Embed Size (px)
Citation preview
Sensors 2008, 8, 4006-4032; DOI: 10.3390/s8064006
sensors ISSN 1424-8220
www.mdpi.org/sensors
Article
Chemical Characterization of Dew Water Collected in Different Geographic Regions of Poland
Żaneta Polkowska 1,*, Marek Błaś 2, Kamila Klimaszewska 1, Mieczysław Sobik 2, Stanisław Małek 3 and Jacek Namieśnik 1
1 Department of Analytical Chemistry, Chemical Faculty, Gdansk University of Technology (GUT), 11/12 G. Narutowicza St., 80-952 Gdańsk, Poland; E-Mails: [email protected]; [email protected]
2 Department of Meteorology and Climatology, Institute of Geography and Regional Development, University of Wrocław, 8 Kosiby Street, PL-51670, Wrocław, Poland; E-mails: [email protected]; [email protected]
3 Forest Faculty, Agricultural University of Cracow, 29 Listopada 46, 31-425 Cracow, Poland.
* Author to whom correspondence should be addressed; E-mail: [email protected]; Tel. +48-058-347-10-10; Fax: +48-058-347-26-94
Received: 23 May 2008 / Accepted: 19 June 2008 / Published: 25 June 2008
Abstract: The results of a dew monitoring program performed in Poland with the aim to outline the chemical composition of dew water in meteorological context are presented. Dew samples were collected from eight measurement stations from August 2004 to November 2006. Taking into account the type of land use and characteristics of pollutant emission, sampling sites were divided into the following categories: rural, coastal urban and inland urban stations. Selected anions and cations as well as formaldehyde and sum of phenols were determined. The average TIC (Total Inorganic Ionic Content) values in dew samples ranged from 0.83 to 3.93 between individual stations with 10.9 meq/L as the highest daily value of TIC measured. The average TIC values observed in dew at all stations were at a similar level (2.46 meq/L) when compared with hoarfrost (2.86 meq/L). However, these values were much higher in comparison with other kinds of atmospheric water like precipitation (wet only; 0.37 meq/L) or fog/cloud (1.01 meq/L). The pH values of dew water ranged from 5.22 to 7.35 for urban coastal stations, from 5.67 to 8.02 for urban inland stations and from 4.16 to 8.76 for dew samples collected in the rural area. HCHO was found in 97 % of dew samples, with concentrations ranging from 0.010 to 5.40 meq/L. Excluding stations near the seashore, where the contribution of Na+ and Cl-
OPEN ACCESS
Sensors 2008, 8
4007
increased, the most important ions were sulphates. A very low contribution of NO3- and
noticeable increase of Ca2+ which were not observed in the case of precipitation and fog water, were typical in all stations. The contribution of ammonium ion was two times higher at rural stations as a result of agricultural ammonia emissions. The strongest correlations were noticed between the sum of acidifying anions SO4
2- + NO3- and Ca2+ ion for all urban
and rural stations. A very strong correlation was also observed for Na+ and Cl- ions in urban coastal stations, as a natural consequence of the location of these stations close to the sea. It was proved that thermal stratification, direction of circulation and local breeze circulation control the atmospheric chemistry at ground level, where dew is formed. The highest TIC values at urban stations were associated with anticyclonic weather, while at rural sites with cyclonic weather situations. The chemistry of dew water in urban coastal stations was closely related to local breeze circulation in the warm season, mainly in the form of diurnal breeze causing a significant increase of the concentration of Na+ and Cl- ions. Thus, dew can be a good indicator of the atmospheric pollution level at a given site. Taking into account both high TIC values and the annual water equivalent estimated at around 50 mm, dew is a considerable factor of wet deposition, responsible for an additional 60 % of pollutant input into the ground when compared with precipitation. Keywords: Urban Environmental Monitoring, Dew, Ionic concentrations, Phenols, Formaldehyde, Ionic Correlations, Type of Air Mass, Synoptic Situation, Poland
1. Introduction Dew is the product of direct condensation of atmospheric water vapour on the ground, the
temperature of which has fallen below the dew point but not as low as water is freezing point. The conditions leading to dew formation are 1) a radiating surface, well insulated from the heat supply of the soil, on which vapor may condense; 2) a clear, still atmosphere with low specific humidity in all but the surface layers, to permit sufficient effective terrestrial radiation to cool the surface; and 3) high relative humidity in surface air layers, or an adjacent source of moisture such as a lake [1]. An examination of dew formation on a microscale shows that different processes are involved in the growth of dew drops: direct accommodation at the drop surface in areas of maximum temperature gradients, nucleation and evaporation of clusters of near critical radius and coalescence of airborne small droplets formed earlier through nucleation [2].
In a major part of Poland dew deposition is the second most important path of water flux from the atmosphere to the ground after precipitation. In terms of frequency and duration in the warm-half of the year, dew is observed almost every night with scarce or scattered cloudiness and lasts even longer than precipitation. The annual number of days with dew in the lowland part of Poland varies from around 100 to 160, and it decreases on convex landforms to around 10-30 days in the case of conspicuous mountain summits and ridges above 1000 m a.s.l. The volume of annual dew deposition at different locations in Poland is disputable. Olszewski [3] measured it as around 6 mm with the use
Sensors 2008, 8
4008
of a dew-recorder, whilst Hutorowicz’s [4] measurements over 10 years revealed that dew formation was observed during 122 nights annually, with a total volume of 53 mm per year. The latter value is equal to around 10 % of annual precipitation. It could be also calculated as 0.4 mm per night, as a mean dewfall rate which corresponds to results presented in other studies [5-7].
Dew is a relatively neglected topic, even through measuring dew formation, the rate of accumulation and total deposition present interesting research questions [8, 9]. A major limitation in assessing the ecological and environmental role of dew is the extreme difficulty of collecting accurate measurements. In the majority of cases, dew is an important moisture input and plays a significant ecological function in most desert ecosystems [10]. In the NW Negev desert, long-term observations by Evenari et al. [11] show that dew occurs about 200 day per year and can reach the equivalent of 30 mm of annual precipitation. In drought years, dewfall can exceed annual rainfall. Interest also exists in urban dew and its implications for an urban climate and air pollution deposition [12, 13]. Measurements conducted in Vancouver showed that an asphalt shingle roof is one of the most efficient surfaces of dew accumulation [12]. Information regarding the chemical composition of dew is not often interpreted with meteorological data. Very limited studies have been done on dew chemistry worldwide [14-19].
While precipitation chemistry in Poland is described quite well, very limited information concerning the composition of dew exists. The aim of the present research was to present information about the chemical composition of dew water collected in different places (rural and urban) and compare these results with meteorological data (horizontal pressure gradient-hPa/111 km, synoptic scale atmospheric circulation, direction of circulation). 2. Experimental Section
Dew samples were collected from eight measurement stations from August 2004 to November
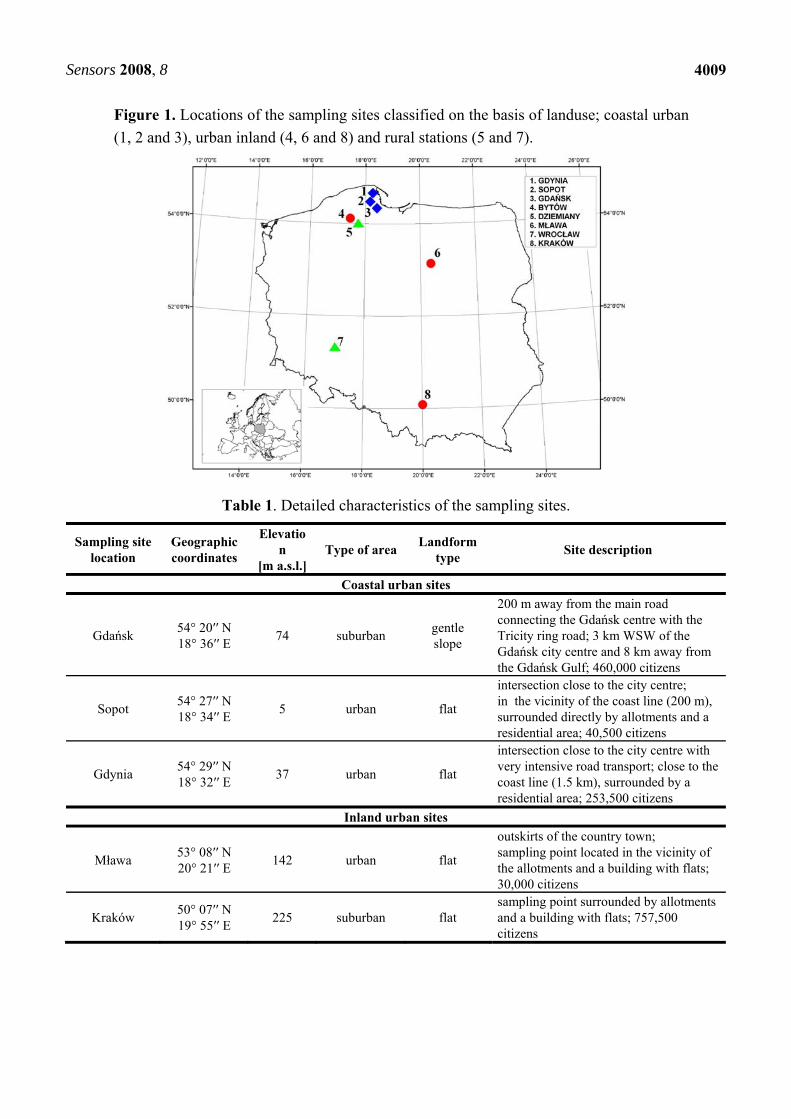
2006. Taking into account the type of land use and chatacteristics of pollutant emissions, the sampling sites were divided into three groups: rural stations (located in agricultural areas: Wrocław, Dziemiany); coastal urban stations (close to the coast line: Gdańsk, Sopot, Gdynia) and inland urban stations (the chemical composition of precipitation in a town, with increasing traffic intensity and industry: Bytów, Mława, Kraków). Table 1 summarizes the basic characteristics of the sampling sites and Figure 1 illustrates their geographical locations. Dew samples were collected using a sampler based on the design described by Muselli et al. [16], placed 50 cm above ground. Basic information concerning the applied sampler is presented in Table 2.
Sensors 2008, 8
4009
Figure 1. Locations of the sampling sites classified on the basis of landuse; coastal urban (1, 2 and 3), urban inland (4, 6 and 8) and rural stations (5 and 7).
Table 1. Detailed characteristics of the sampling sites.
Sampling site location
Geographic coordinates
Elevation
[m a.s.l.] Type of area Landform
type Site description
Coastal urban sites
Gdańsk 54° 20′′ N 18° 36′′ E 74 suburban gentle
slope
200 m away from the main road connecting the Gdańsk centre with the Tricity ring road; 3 km WSW of the Gdańsk city centre and 8 km away from the Gdańsk Gulf; 460,000 citizens
Sopot 54° 27′′ N 18° 34′′ E 5 urban flat
intersection close to the city centre; in the vicinity of the coast line (200 m), surrounded directly by allotments and a residential area; 40,500 citizens
Gdynia 54° 29′′ N 18° 32′′ E 37 urban flat
intersection close to the city centre with very intensive road transport; close to the coast line (1.5 km), surrounded by a residential area; 253,500 citizens
Inland urban sites
Mława 53° 08′′ N 20° 21′′ E 142 urban flat
outskirts of the country town; sampling point located in the vicinity of the allotments and a building with flats; 30,000 citizens
Kraków 50° 07′′ N 19° 55′′ E 225 suburban flat
sampling point surrounded by allotments and a building with flats; 757,500 citizens
Sensors 2008, 8
4010
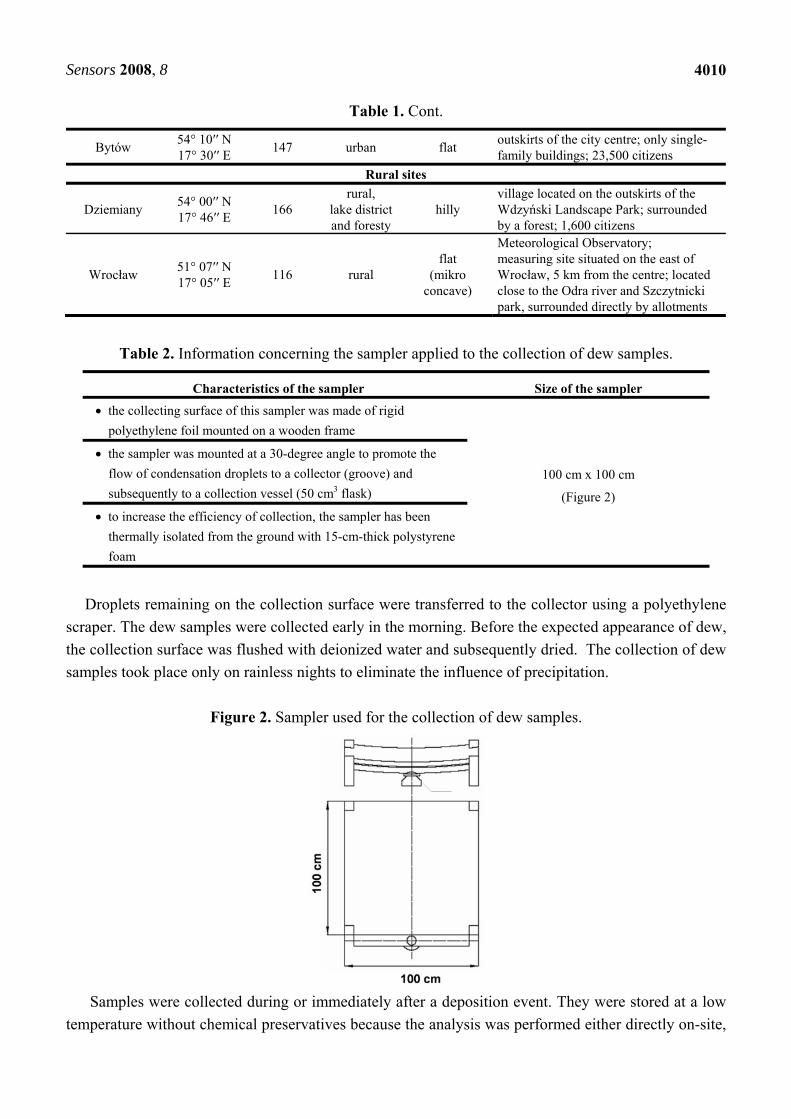
Table 1. Cont.
Bytów 54° 10′′ N 17° 30′′ E 147 urban flat outskirts of the city centre; only single-
family buildings; 23,500 citizens Rural sites
Dziemiany 54° 00′′ N 17° 46′′ E 166
rural, lake district and foresty
hilly village located on the outskirts of the Wdzyński Landscape Park; surrounded by a forest; 1,600 citizens
Wrocław 51° 07′′ N 17° 05′′ E 116 rural
flat (mikro
concave)
Meteorological Observatory; measuring site situated on the east of Wrocław, 5 km from the centre; located close to the Odra river and Szczytnicki park, surrounded directly by allotments
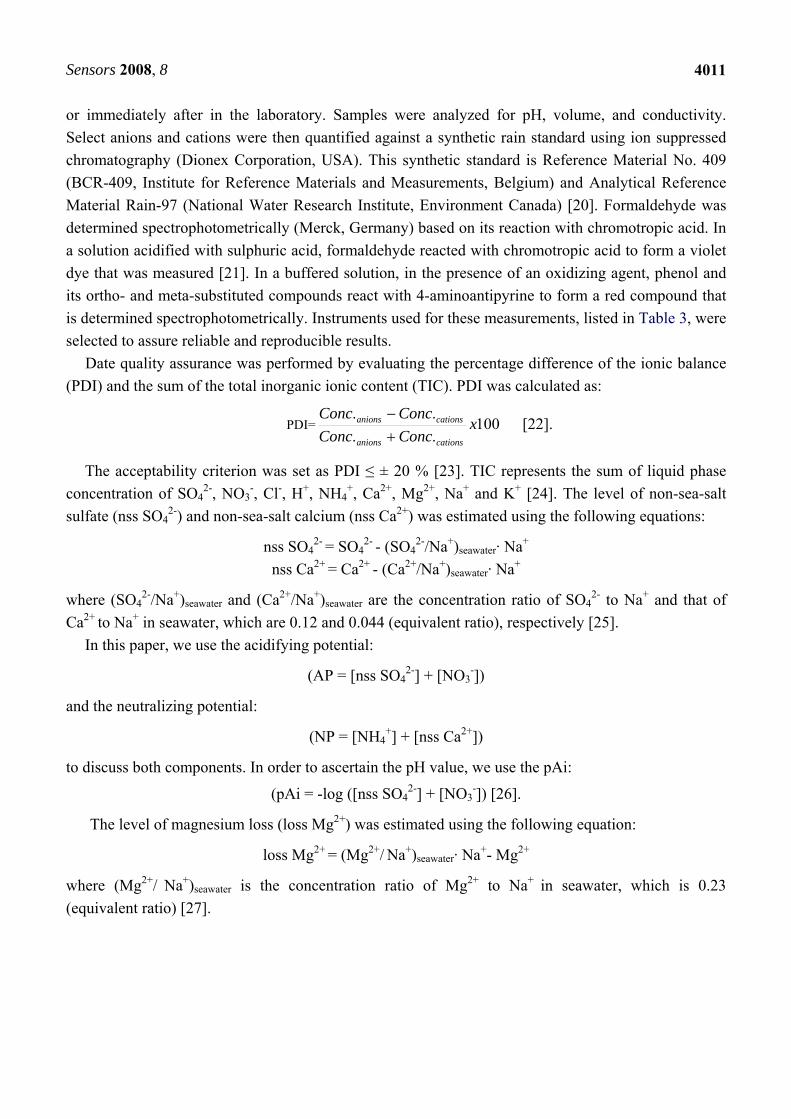
Table 2. Information concerning the sampler applied to the collection of dew samples.
Characteristics of the sampler Size of the sampler
• the collecting surface of this sampler was made of rigid polyethylene foil mounted on a wooden frame
100 cm x 100 cm
(Figure 2)
• the sampler was mounted at a 30-degree angle to promote the flow of condensation droplets to a collector (groove) and subsequently to a collection vessel (50 cm3 flask)
• to increase the efficiency of collection, the sampler has been thermally isolated from the ground with 15-cm-thick polystyrene foam
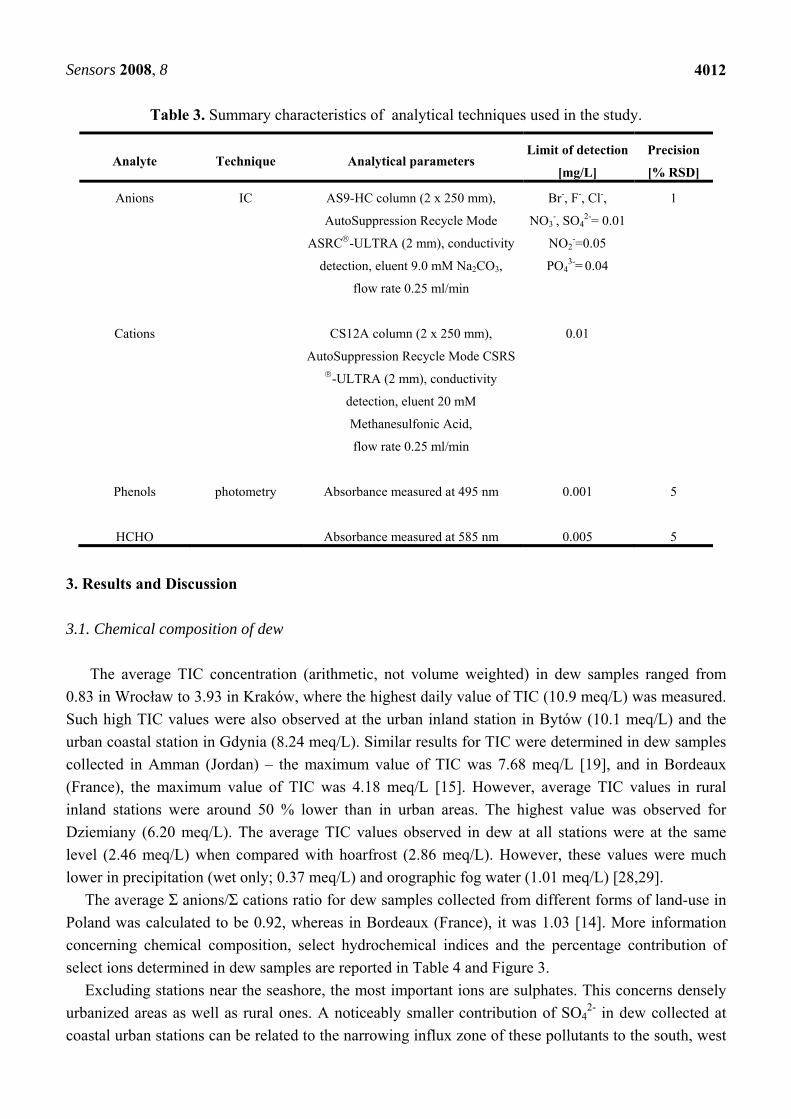
Droplets remaining on the collection surface were transferred to the collector using a polyethylene
scraper. The dew samples were collected early in the morning. Before the expected appearance of dew, the collection surface was flushed with deionized water and subsequently dried. The collection of dew samples took place only on rainless nights to eliminate the influence of precipitation.
Figure 2. Sampler used for the collection of dew samples.
Samples were collected during or immediately after a deposition event. They were stored at a low
temperature without chemical preservatives because the analysis was performed either directly on-site,
Sensors 2008, 8
4011
or immediately after in the laboratory. Samples were analyzed for pH, volume, and conductivity. Select anions and cations were then quantified against a synthetic rain standard using ion suppressed chromatography (Dionex Corporation, USA). This synthetic standard is Reference Material No. 409 (BCR-409, Institute for Reference Materials and Measurements, Belgium) and Analytical Reference Material Rain-97 (National Water Research Institute, Environment Canada) [20]. Formaldehyde was determined spectrophotometrically (Merck, Germany) based on its reaction with chromotropic acid. In a solution acidified with sulphuric acid, formaldehyde reacted with chromotropic acid to form a violet dye that was measured [21]. In a buffered solution, in the presence of an oxidizing agent, phenol and its ortho- and meta-substituted compounds react with 4-aminoantipyrine to form a red compound that is determined spectrophotometrically. Instruments used for these measurements, listed in Table 3, were selected to assure reliable and reproducible results.
Date quality assurance was performed by evaluating the percentage difference of the ionic balance (PDI) and the sum of the total inorganic ionic content (TIC). PDI was calculated as:
PDI= 100....
xConcConcConcConc
cationsanions
cationsanions
+−
[22].
The acceptability criterion was set as PDI ≤ ± 20 % [23]. TIC represents the sum of liquid phase concentration of SO4
2-, NO3-, Cl-, H+, NH4
+, Ca2+, Mg2+, Na+ and K+ [24]. The level of non-sea-salt sulfate (nss SO4
2-) and non-sea-salt calcium (nss Ca2+) was estimated using the following equations:
nss SO42- = SO4
2- - (SO42-/Na+)seawater· Na+
nss Ca2+ = Ca2+ - (Ca2+/Na+)seawater· Na+
where (SO42-/Na+)seawater and (Ca2+/Na+)seawater are the concentration ratio of SO4
2- to Na+ and that of Ca2+ to Na+ in seawater, which are 0.12 and 0.044 (equivalent ratio), respectively [25].
In this paper, we use the acidifying potential:
(AP = [nss SO42-] + [NO3
-])
and the neutralizing potential:
(NP = [NH4+] + [nss Ca2+])
to discuss both components. In order to ascertain the pH value, we use the pAi:
(pAi = -log ([nss SO42-] + [NO3
-]) [26].
The level of magnesium loss (loss Mg2+) was estimated using the following equation:
loss Mg2+ = (Mg2+/ Na+)seawater· Na+- Mg2+
where (Mg2+/ Na+)seawater is the concentration ratio of Mg2+ to Na+ in seawater, which is 0.23 (equivalent ratio) [27].
Sensors 2008, 8
4012
Table 3. Summary characteristics of analytical techniques used in the study.
Analyte Technique Analytical parameters Limit of detection
[mg/L]
Precision
[% RSD]
Anions IC AS9-HC column (2 x 250 mm),
AutoSuppression Recycle Mode
ASRC®-ULTRA (2 mm), conductivity
detection, eluent 9.0 mM Na2CO3,
flow rate 0.25 ml/min
Br-, F-, Cl-,
NO3-, SO4
2-= 0.01
NO2-=0.05
PO43-= 0.04
1
Cations CS12A column (2 x 250 mm),
AutoSuppression Recycle Mode CSRS ®-ULTRA (2 mm), conductivity
detection, eluent 20 mM
Methanesulfonic Acid,
flow rate 0.25 ml/min
0.01
Phenols photometry Absorbance measured at 495 nm 0.001 5
HCHO Absorbance measured at 585 nm 0.005 5
3. Results and Discussion 3.1. Chemical composition of dew
The average TIC concentration (arithmetic, not volume weighted) in dew samples ranged from
0.83 in Wrocław to 3.93 in Kraków, where the highest daily value of TIC (10.9 meq/L) was measured. Such high TIC values were also observed at the urban inland station in Bytów (10.1 meq/L) and the urban coastal station in Gdynia (8.24 meq/L). Similar results for TIC were determined in dew samples collected in Amman (Jordan) – the maximum value of TIC was 7.68 meq/L [19], and in Bordeaux (France), the maximum value of TIC was 4.18 meq/L [15]. However, average TIC values in rural inland stations were around 50 % lower than in urban areas. The highest value was observed for Dziemiany (6.20 meq/L). The average TIC values observed in dew at all stations were at the same level (2.46 meq/L) when compared with hoarfrost (2.86 meq/L). However, these values were much lower in precipitation (wet only; 0.37 meq/L) and orographic fog water (1.01 meq/L) [28,29].
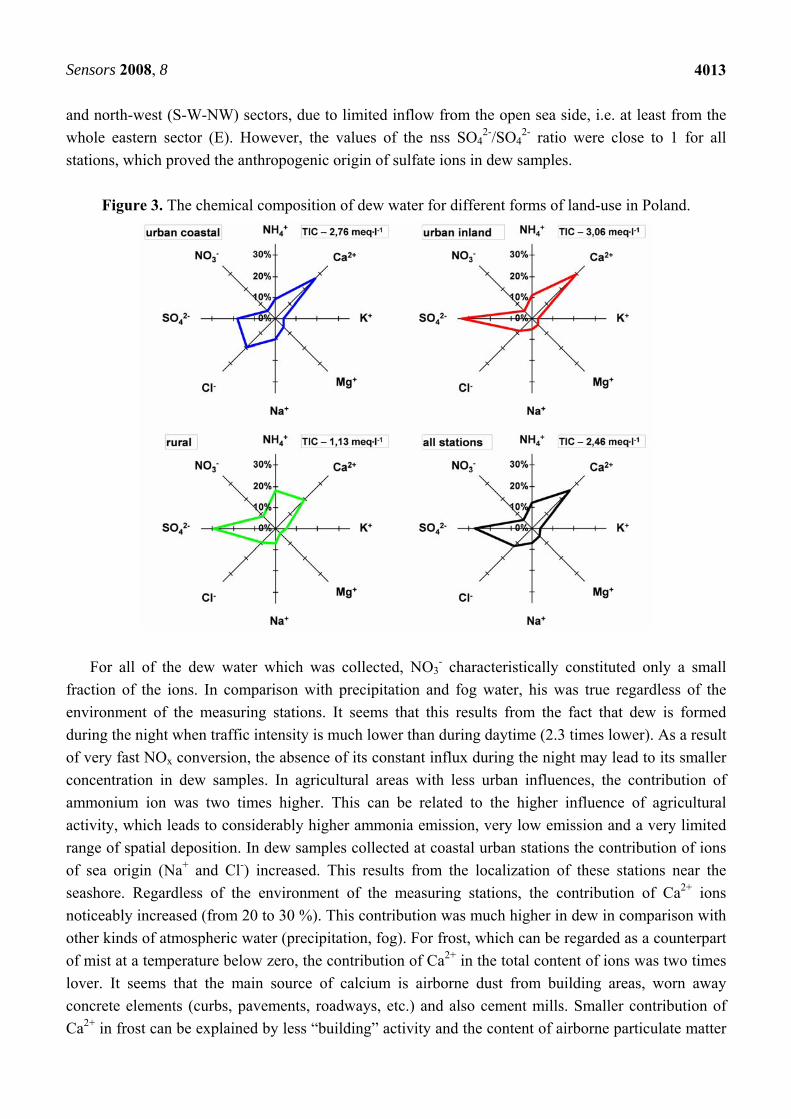
The average Σ anions/Σ cations ratio for dew samples collected from different forms of land-use in Poland was calculated to be 0.92, whereas in Bordeaux (France), it was 1.03 [14]. More information concerning chemical composition, select hydrochemical indices and the percentage contribution of select ions determined in dew samples are reported in Table 4 and Figure 3.
Excluding stations near the seashore, the most important ions are sulphates. This concerns densely urbanized areas as well as rural ones. A noticeably smaller contribution of SO4
2- in dew collected at coastal urban stations can be related to the narrowing influx zone of these pollutants to the south, west
Sensors 2008, 8
4013
and north-west (S-W-NW) sectors, due to limited inflow from the open sea side, i.e. at least from the whole eastern sector (E). However, the values of the nss SO4
2-/SO42- ratio were close to 1 for all
stations, which proved the anthropogenic origin of sulfate ions in dew samples.
Figure 3. The chemical composition of dew water for different forms of land-use in Poland.
For all of the dew water which was collected, NO3
- characteristically constituted only a small fraction of the ions. In comparison with precipitation and fog water, his was true regardless of the environment of the measuring stations. It seems that this results from the fact that dew is formed during the night when traffic intensity is much lower than during daytime (2.3 times lower). As a result of very fast NOx conversion, the absence of its constant influx during the night may lead to its smaller concentration in dew samples. In agricultural areas with less urban influences, the contribution of ammonium ion was two times higher. This can be related to the higher influence of agricultural activity, which leads to considerably higher ammonia emission, very low emission and a very limited range of spatial deposition. In dew samples collected at coastal urban stations the contribution of ions of sea origin (Na+ and Cl-) increased. This results from the localization of these stations near the seashore. Regardless of the environment of the measuring stations, the contribution of Ca2+ ions noticeably increased (from 20 to 30 %). This contribution was much higher in dew in comparison with other kinds of atmospheric water (precipitation, fog). For frost, which can be regarded as a counterpart of mist at a temperature below zero, the contribution of Ca2+ in the total content of ions was two times lover. It seems that the main source of calcium is airborne dust from building areas, worn away concrete elements (curbs, pavements, roadways, etc.) and also cement mills. Smaller contribution of Ca2+ in frost can be explained by less “building” activity and the content of airborne particulate matter
Sensors 2008, 8
4014
during the cool season (wet ground, frozen ground, snow cover). It is not also insignificant that calcium ions are bivalent. Additionally, the values of the nss Ca2+ / Ca2+ ratio in dew samples for all types of stations were close to 1, which results from nearly no limestone in Poland and confirmed the anthropogenic character of this pollution.
HCHO was found in 97 % of dew samples, with concentrations ranging from 0.010 to 5.40 meq/L. The highest average formaldehyde concentrations were observed for dew samples collected from the rural inland station (Wrocław). HCHO is emitted in to the atmosphere from exhaust gases from domestic heating, where it can be scavenged by wet and dry deposition. However, phenols were found in 95 % of dew samples, with concentrations ranging from 0.005 to 2.43 meq/L. The highest average sum of phenols concentrations was observed for dew samples collected from the urban coastal station. The high concentration levels of phenols in runoff waters collected in the area of the centre of Gdańsk and Gdynia are mainly caused by high traffic intensity and industrial factories situated in the surrounding area of these cities. The petroleum refinery alone introduces approximately 118 kg of phenols to the surface waters annually.
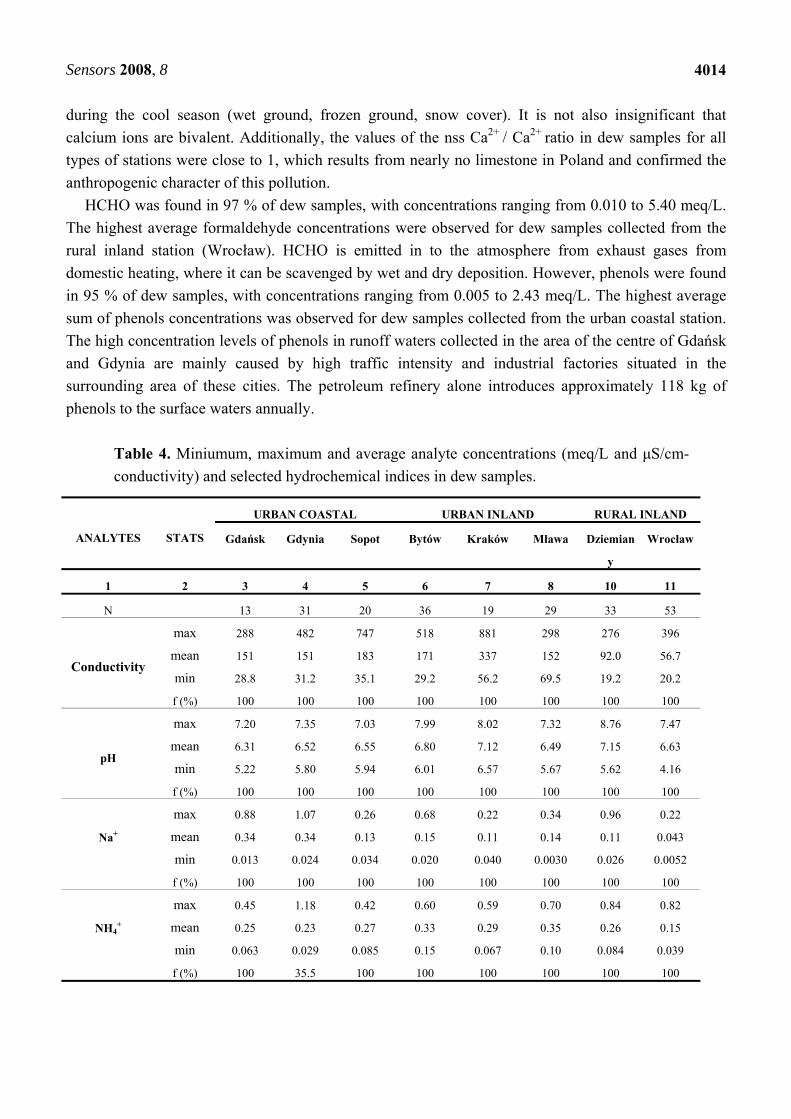
Table 4. Miniumum, maximum and average analyte concentrations (meq/L and μS/cm-conductivity) and selected hydrochemical indices in dew samples.
ANALYTES STATS
URBAN COASTAL URBAN INLAND RURAL INLAND
Gdańsk Gdynia Sopot Bytów Kraków Mława Dziemian
y
Wrocław
1 2 3 4 5 6 7 8 10 11
N 13 31 20 36 19 29 33 53
Conductivity
max 288 482 747 518 881 298 276 396
mean 151 151 183 171 337 152 92.0 56.7
min 28.8 31.2 35.1 29.2 56.2 69.5 19.2 20.2
f (%) 100 100 100 100 100 100 100 100
pH
max 7.20 7.35 7.03 7.99 8.02 7.32 8.76 7.47
mean 6.31 6.52 6.55 6.80 7.12 6.49 7.15 6.63
min 5.22 5.80 5.94 6.01 6.57 5.67 5.62 4.16
f (%) 100 100 100 100 100 100 100 100
Na+
max 0.88 1.07 0.26 0.68 0.22 0.34 0.96 0.22
mean 0.34 0.34 0.13 0.15 0.11 0.14 0.11 0.043
min 0.013 0.024 0.034 0.020 0.040 0.0030 0.026 0.0052
f (%) 100 100 100 100 100 100 100 100
NH4+
max 0.45 1.18 0.42 0.60 0.59 0.70 0.84 0.82
mean 0.25 0.23 0.27 0.33 0.29 0.35 0.26 0.15
min 0.063 0.029 0.085 0.15 0.067 0.10 0.084 0.039
f (%) 100 35.5 100 100 100 100 100 100
Sensors 2008, 8
4015
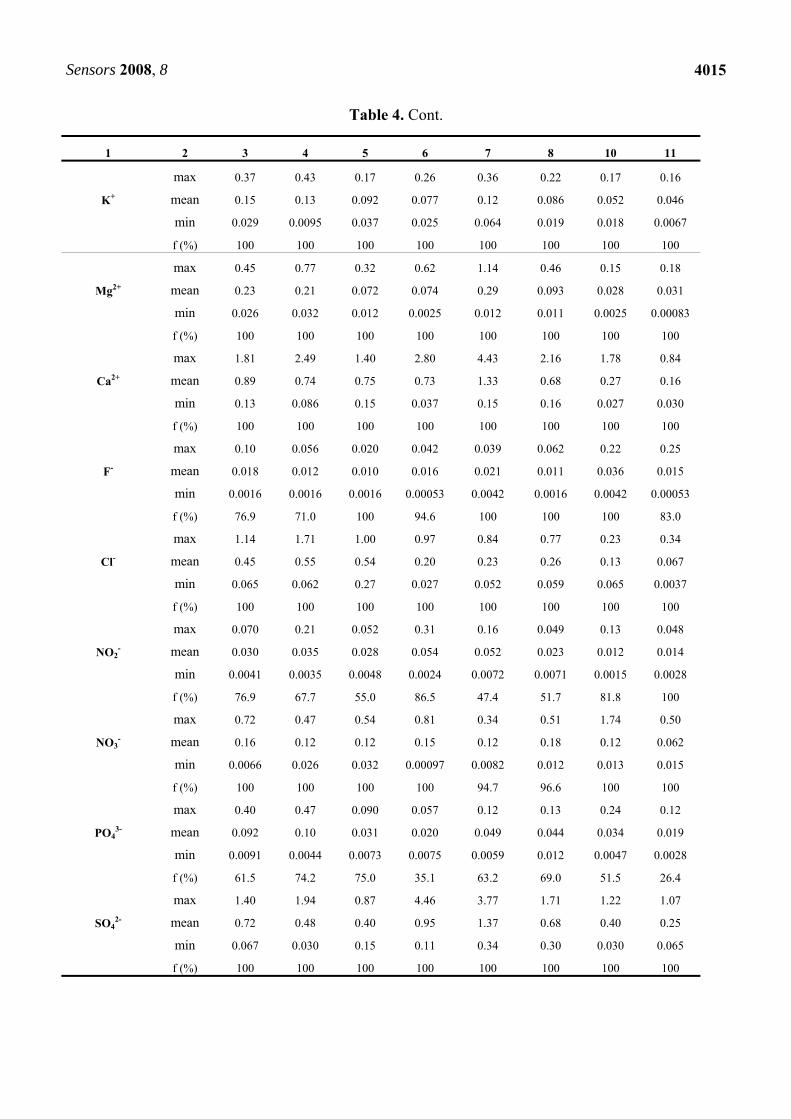
Table 4. Cont.
1 2 3 4 5 6 7 8 10 11
K+
max 0.37 0.43 0.17 0.26 0.36 0.22 0.17 0.16
mean 0.15 0.13 0.092 0.077 0.12 0.086 0.052 0.046
min 0.029 0.0095 0.037 0.025 0.064 0.019 0.018 0.0067
f (%) 100 100 100 100 100 100 100 100
Mg2+
max 0.45 0.77 0.32 0.62 1.14 0.46 0.15 0.18
mean 0.23 0.21 0.072 0.074 0.29 0.093 0.028 0.031
min 0.026 0.032 0.012 0.0025 0.012 0.011 0.0025 0.00083
f (%) 100 100 100 100 100 100 100 100
Ca2+
max 1.81 2.49 1.40 2.80 4.43 2.16 1.78 0.84
mean 0.89 0.74 0.75 0.73 1.33 0.68 0.27 0.16
min 0.13 0.086 0.15 0.037 0.15 0.16 0.027 0.030
f (%) 100 100 100 100 100 100 100 100
F-
max 0.10 0.056 0.020 0.042 0.039 0.062 0.22 0.25
mean 0.018 0.012 0.010 0.016 0.021 0.011 0.036 0.015
min 0.0016 0.0016 0.0016 0.00053 0.0042 0.0016 0.0042 0.00053
f (%) 76.9 71.0 100 94.6 100 100 100 83.0
Cl-
max 1.14 1.71 1.00 0.97 0.84 0.77 0.23 0.34
mean 0.45 0.55 0.54 0.20 0.23 0.26 0.13 0.067
min 0.065 0.062 0.27 0.027 0.052 0.059 0.065 0.0037
f (%) 100 100 100 100 100 100 100 100
NO2-
max 0.070 0.21 0.052 0.31 0.16 0.049 0.13 0.048
mean 0.030 0.035 0.028 0.054 0.052 0.023 0.012 0.014
min 0.0041 0.0035 0.0048 0.0024 0.0072 0.0071 0.0015 0.0028
f (%) 76.9 67.7 55.0 86.5 47.4 51.7 81.8 100
NO3-
max 0.72 0.47 0.54 0.81 0.34 0.51 1.74 0.50
mean 0.16 0.12 0.12 0.15 0.12 0.18 0.12 0.062
min 0.0066 0.026 0.032 0.00097 0.0082 0.012 0.013 0.015
f (%) 100 100 100 100 94.7 96.6 100 100
PO43-
max 0.40 0.47 0.090 0.057 0.12 0.13 0.24 0.12
mean 0.092 0.10 0.031 0.020 0.049 0.044 0.034 0.019
min 0.0091 0.0044 0.0073 0.0075 0.0059 0.012 0.0047 0.0028
f (%) 61.5 74.2 75.0 35.1 63.2 69.0 51.5 26.4
SO42-
max 1.40 1.94 0.87 4.46 3.77 1.71 1.22 1.07
mean 0.72 0.48 0.40 0.95 1.37 0.68 0.40 0.25
min 0.067 0.030 0.15 0.11 0.34 0.30 0.030 0.065
f (%) 100 100 100 100 100 100 100 100
Sensors 2008, 8
4016
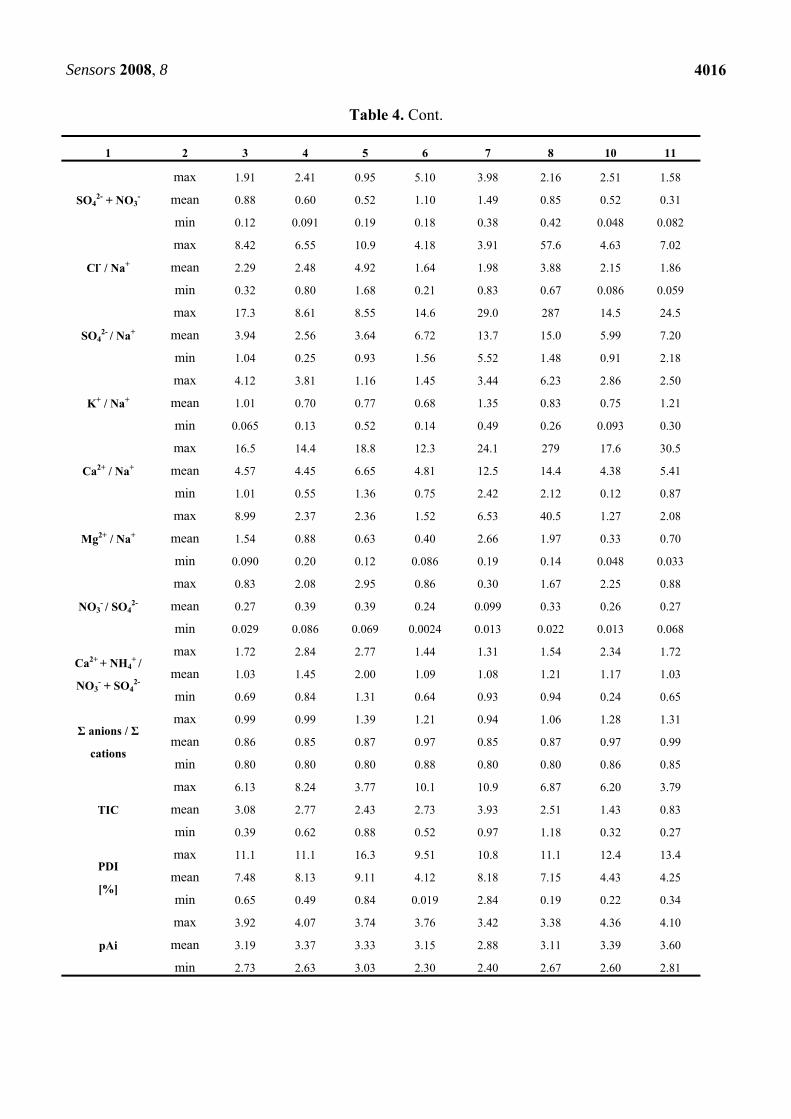
Table 4. Cont.
1 2 3 4 5 6 7 8 10 11
SO42- + NO3
-
max 1.91 2.41 0.95 5.10 3.98 2.16 2.51 1.58
mean 0.88 0.60 0.52 1.10 1.49 0.85 0.52 0.31
min 0.12 0.091 0.19 0.18 0.38 0.42 0.048 0.082
Cl- / Na+
max 8.42 6.55 10.9 4.18 3.91 57.6 4.63 7.02
mean 2.29 2.48 4.92 1.64 1.98 3.88 2.15 1.86
min 0.32 0.80 1.68 0.21 0.83 0.67 0.086 0.059
SO42- / Na+
max 17.3 8.61 8.55 14.6 29.0 287 14.5 24.5
mean 3.94 2.56 3.64 6.72 13.7 15.0 5.99 7.20
min 1.04 0.25 0.93 1.56 5.52 1.48 0.91 2.18
K+ / Na+
max 4.12 3.81 1.16 1.45 3.44 6.23 2.86 2.50
mean 1.01 0.70 0.77 0.68 1.35 0.83 0.75 1.21
min 0.065 0.13 0.52 0.14 0.49 0.26 0.093 0.30
Ca2+ / Na+
max 16.5 14.4 18.8 12.3 24.1 279 17.6 30.5
mean 4.57 4.45 6.65 4.81 12.5 14.4 4.38 5.41
min 1.01 0.55 1.36 0.75 2.42 2.12 0.12 0.87
Mg2+ / Na+
max 8.99 2.37 2.36 1.52 6.53 40.5 1.27 2.08
mean 1.54 0.88 0.63 0.40 2.66 1.97 0.33 0.70
min 0.090 0.20 0.12 0.086 0.19 0.14 0.048 0.033
NO3- / SO4
2-
max 0.83 2.08 2.95 0.86 0.30 1.67 2.25 0.88
mean 0.27 0.39 0.39 0.24 0.099 0.33 0.26 0.27
min 0.029 0.086 0.069 0.0024 0.013 0.022 0.013 0.068
Ca2+ + NH4+ /
NO3- + SO4
2-
max 1.72 2.84 2.77 1.44 1.31 1.54 2.34 1.72
mean 1.03 1.45 2.00 1.09 1.08 1.21 1.17 1.03
min 0.69 0.84 1.31 0.64 0.93 0.94 0.24 0.65
Σ anions / Σ
cations
max 0.99 0.99 1.39 1.21 0.94 1.06 1.28 1.31
mean 0.86 0.85 0.87 0.97 0.85 0.87 0.97 0.99
min 0.80 0.80 0.80 0.88 0.80 0.80 0.86 0.85
TIC
max 6.13 8.24 3.77 10.1 10.9 6.87 6.20 3.79
mean 3.08 2.77 2.43 2.73 3.93 2.51 1.43 0.83
min 0.39 0.62 0.88 0.52 0.97 1.18 0.32 0.27
PDI
[%]
max 11.1 11.1 16.3 9.51 10.8 11.1 12.4 13.4
mean 7.48 8.13 9.11 4.12 8.18 7.15 4.43 4.25
min 0.65 0.49 0.84 0.019 2.84 0.19 0.22 0.34
pAi
max 3.92 4.07 3.74 3.76 3.42 3.38 4.36 4.10
mean 3.19 3.37 3.33 3.15 2.88 3.11 3.39 3.60
min 2.73 2.63 3.03 2.30 2.40 2.67 2.60 2.81
Sensors 2008, 8
4017
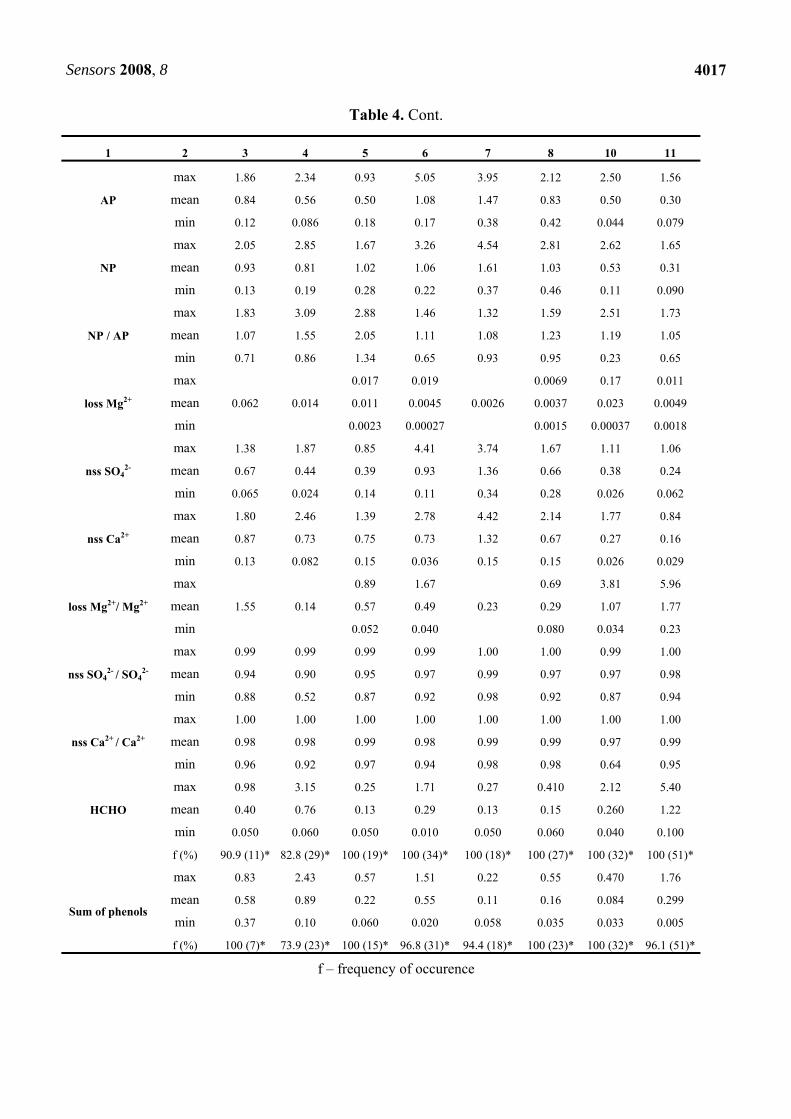
Table 4. Cont.
f – frequency of occurence
1 2 3 4 5 6 7 8 10 11
AP
max 1.86 2.34 0.93 5.05 3.95 2.12 2.50 1.56
mean 0.84 0.56 0.50 1.08 1.47 0.83 0.50 0.30
min 0.12 0.086 0.18 0.17 0.38 0.42 0.044 0.079
NP
max 2.05 2.85 1.67 3.26 4.54 2.81 2.62 1.65
mean 0.93 0.81 1.02 1.06 1.61 1.03 0.53 0.31
min 0.13 0.19 0.28 0.22 0.37 0.46 0.11 0.090
NP / AP
max 1.83 3.09 2.88 1.46 1.32 1.59 2.51 1.73
mean 1.07 1.55 2.05 1.11 1.08 1.23 1.19 1.05
min 0.71 0.86 1.34 0.65 0.93 0.95 0.23 0.65
loss Mg2+
max 0.017 0.019 0.0069 0.17 0.011
mean 0.062 0.014 0.011 0.0045 0.0026 0.0037 0.023 0.0049
min 0.0023 0.00027 0.0015 0.00037 0.0018
nss SO42-
max 1.38 1.87 0.85 4.41 3.74 1.67 1.11 1.06
mean 0.67 0.44 0.39 0.93 1.36 0.66 0.38 0.24
min 0.065 0.024 0.14 0.11 0.34 0.28 0.026 0.062
nss Ca2+
max 1.80 2.46 1.39 2.78 4.42 2.14 1.77 0.84
mean 0.87 0.73 0.75 0.73 1.32 0.67 0.27 0.16
min 0.13 0.082 0.15 0.036 0.15 0.15 0.026 0.029
loss Mg2+/ Mg2+
max 0.89 1.67 0.69 3.81 5.96
mean 1.55 0.14 0.57 0.49 0.23 0.29 1.07 1.77
min 0.052 0.040 0.080 0.034 0.23
nss SO42- / SO4
2-
max 0.99 0.99 0.99 0.99 1.00 1.00 0.99 1.00
mean 0.94 0.90 0.95 0.97 0.99 0.97 0.97 0.98
min 0.88 0.52 0.87 0.92 0.98 0.92 0.87 0.94
nss Ca2+ / Ca2+
max 1.00 1.00 1.00 1.00 1.00 1.00 1.00 1.00
mean 0.98 0.98 0.99 0.98 0.99 0.99 0.97 0.99
min 0.96 0.92 0.97 0.94 0.98 0.98 0.64 0.95
HCHO
max 0.98 3.15 0.25 1.71 0.27 0.410 2.12 5.40
mean 0.40 0.76 0.13 0.29 0.13 0.15 0.260 1.22
min 0.050 0.060 0.050 0.010 0.050 0.060 0.040 0.100
f (%) 90.9 (11)* 82.8 (29)* 100 (19)* 100 (34)* 100 (18)* 100 (27)* 100 (32)* 100 (51)*
Sum of phenols
max 0.83 2.43 0.57 1.51 0.22 0.55 0.470 1.76
mean 0.58 0.89 0.22 0.55 0.11 0.16 0.084 0.299
min 0.37 0.10 0.060 0.020 0.058 0.035 0.033 0.005
f (%) 100 (7)* 73.9 (23)* 100 (15)* 96.8 (31)* 94.4 (18)* 100 (23)* 100 (32)* 96.1 (51)*
Sensors 2008, 8
4018
3.2. Correlation between concentrations
Seawater parameters, calculated as equivalent ratios, are respectively: Cl-/Na+ = 1.17; SO42-/Na+=
0.12; K+/Na+= 0.022; Ca2+/Na+= 0.045; Mg2+/Na2+= 0.25. The average equivalent ratio of Cl-/Na+ in dew samples calculated in Table 4 was higher for all stations when compared with the appropriate seawater value. Very high values were observed for dew samples collected in Mława (max 57.6; mean 3.88) and Sopot (max 10.9; mean 4.92), where the concentration level of Cl- was 3 to 4 times higher than Na+. A higher concentration of sodium ions (in comparison with chloride ions) was reported only in rural inland stations.
The average SO42-/Na+ ratio in dew samples was always higher than the seawater ratio (urban
coastal from 21 to 125 times; urban inland from 30 to 114; rural from 50 to 60) which can be attributed to emission from fuel combustion. The average K+/Na+ ratio in dew samples was also higher than the seawater ratio (for all stations from 30 to 61 times). The excess potassium can have different explanations. K+ is a major constituent of fertilizers and is generally present in windblown soil. Vegetation is another possible source for K+.
It was observed (Table 4) that the value of Ca2+/Na+ ratio in dew samples was generally much higher than that of seawater. The highest average value of Ca2+/Na+ ratio was noticed for urban inland agglomerations, such as: Mława (14.4) and Kraków (12.5). The Mg2+/Na+ ratio was almost equal to that of seawater in rural stations. The highest average values of the Mg2+/Na+ ratio were also observed for big urban agglomerations, such as Kraków (2.66), Sopot (1.97) and Gdańsk (1.54). For Mg2+, the primary source could be marine and the secondary could be continental.
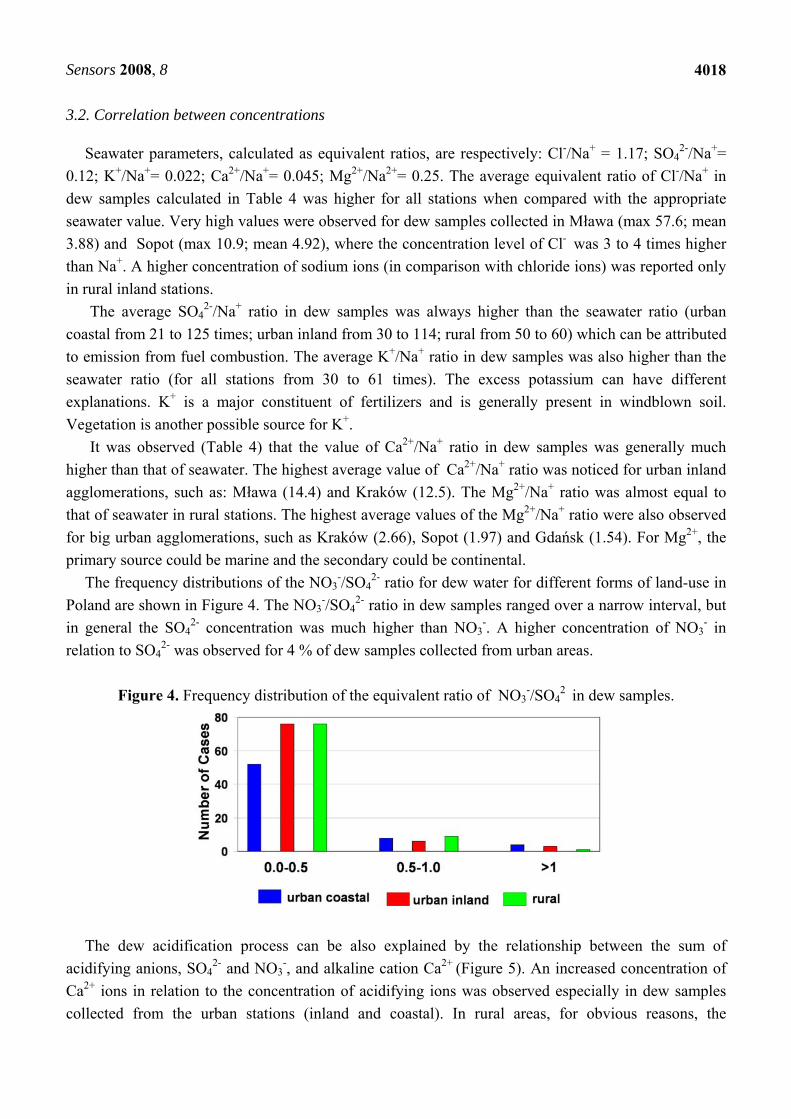
The frequency distributions of the NO3-/SO4
2- ratio for dew water for different forms of land-use in Poland are shown in Figure 4. The NO3
-/SO42- ratio in dew samples ranged over a narrow interval, but
in general the SO42- concentration was much higher than NO3
-. A higher concentration of NO3- in
relation to SO42- was observed for 4 % of dew samples collected from urban areas.
Figure 4. Frequency distribution of the equivalent ratio of NO3
-/SO42 in dew samples.
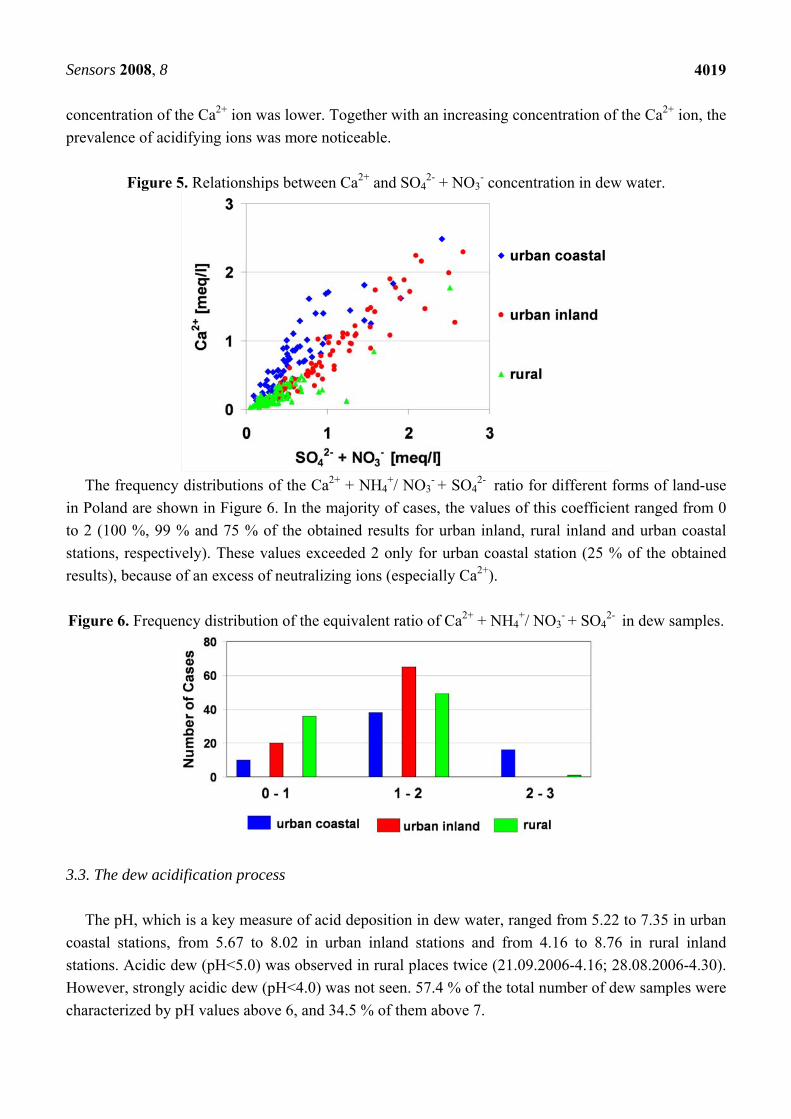
The dew acidification process can be also explained by the relationship between the sum of
acidifying anions, SO42- and NO3
-, and alkaline cation Ca2+ (Figure 5). An increased concentration of Ca2+ ions in relation to the concentration of acidifying ions was observed especially in dew samples collected from the urban stations (inland and coastal). In rural areas, for obvious reasons, the
Sensors 2008, 8
4019
concentration of the Ca2+ ion was lower. Together with an increasing concentration of the Ca2+ ion, the prevalence of acidifying ions was more noticeable.
Figure 5. Relationships between Ca2+ and SO4
2- + NO3- concentration in dew water.
The frequency distributions of the Ca2+ + NH4
+/ NO3- + SO4
2- ratio for different forms of land-use in Poland are shown in Figure 6. In the majority of cases, the values of this coefficient ranged from 0 to 2 (100 %, 99 % and 75 % of the obtained results for urban inland, rural inland and urban coastal stations, respectively). These values exceeded 2 only for urban coastal station (25 % of the obtained results), because of an excess of neutralizing ions (especially Ca2+).
Figure 6. Frequency distribution of the equivalent ratio of Ca2+ + NH4
+/ NO3- + SO4
2- in dew samples.
3.3. The dew acidification process
The pH, which is a key measure of acid deposition in dew water, ranged from 5.22 to 7.35 in urban
coastal stations, from 5.67 to 8.02 in urban inland stations and from 4.16 to 8.76 in rural inland stations. Acidic dew (pH<5.0) was observed in rural places twice (21.09.2006-4.16; 28.08.2006-4.30). However, strongly acidic dew (pH<4.0) was not seen. 57.4 % of the total number of dew samples were characterized by pH values above 6, and 34.5 % of them above 7.
Sensors 2008, 8
4020
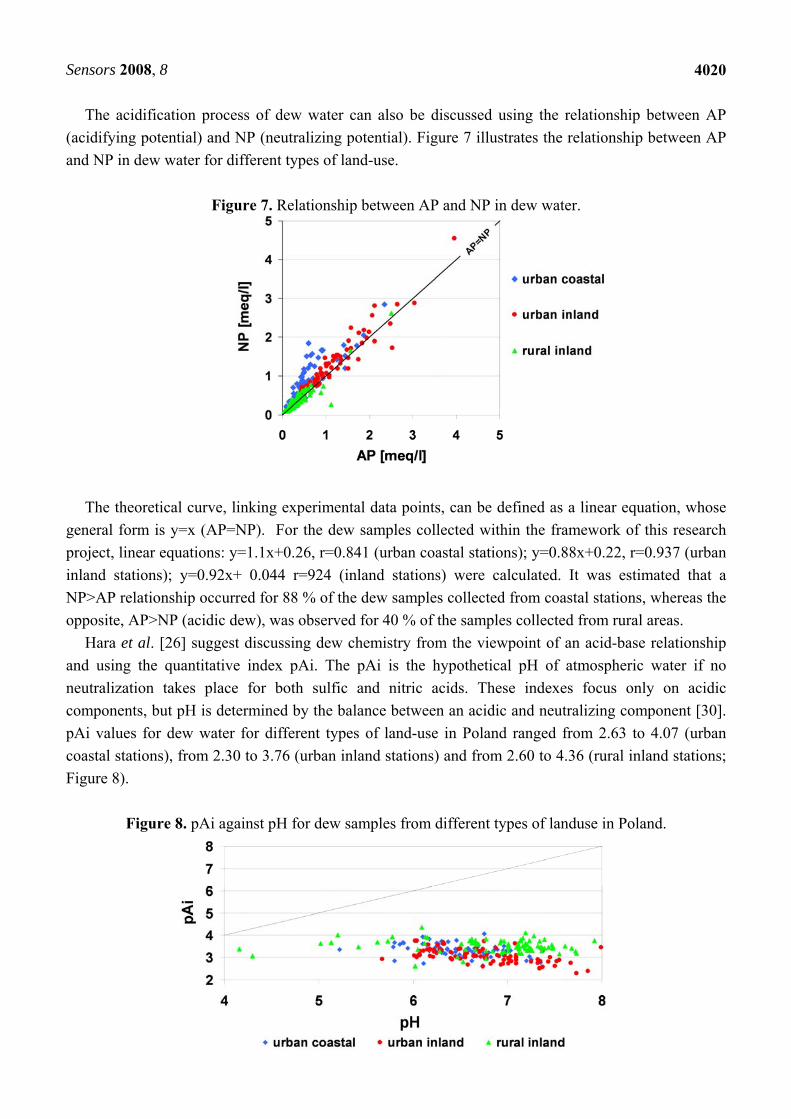
The acidification process of dew water can also be discussed using the relationship between AP (acidifying potential) and NP (neutralizing potential). Figure 7 illustrates the relationship between AP and NP in dew water for different types of land-use.
Figure 7. Relationship between AP and NP in dew water.
The theoretical curve, linking experimental data points, can be defined as a linear equation, whose general form is y=x (AP=NP). For the dew samples collected within the framework of this research project, linear equations: y=1.1x+0.26, r=0.841 (urban coastal stations); y=0.88x+0.22, r=0.937 (urban inland stations); y=0.92x+ 0.044 r=924 (inland stations) were calculated. It was estimated that a NP>AP relationship occurred for 88 % of the dew samples collected from coastal stations, whereas the opposite, AP>NP (acidic dew), was observed for 40 % of the samples collected from rural areas.
Hara et al. [26] suggest discussing dew chemistry from the viewpoint of an acid-base relationship and using the quantitative index pAi. The pAi is the hypothetical pH of atmospheric water if no neutralization takes place for both sulfic and nitric acids. These indexes focus only on acidic components, but pH is determined by the balance between an acidic and neutralizing component [30]. pAi values for dew water for different types of land-use in Poland ranged from 2.63 to 4.07 (urban coastal stations), from 2.30 to 3.76 (urban inland stations) and from 2.60 to 4.36 (rural inland stations; Figure 8).
Figure 8. pAi against pH for dew samples from different types of landuse in Poland.
Sensors 2008, 8
4021
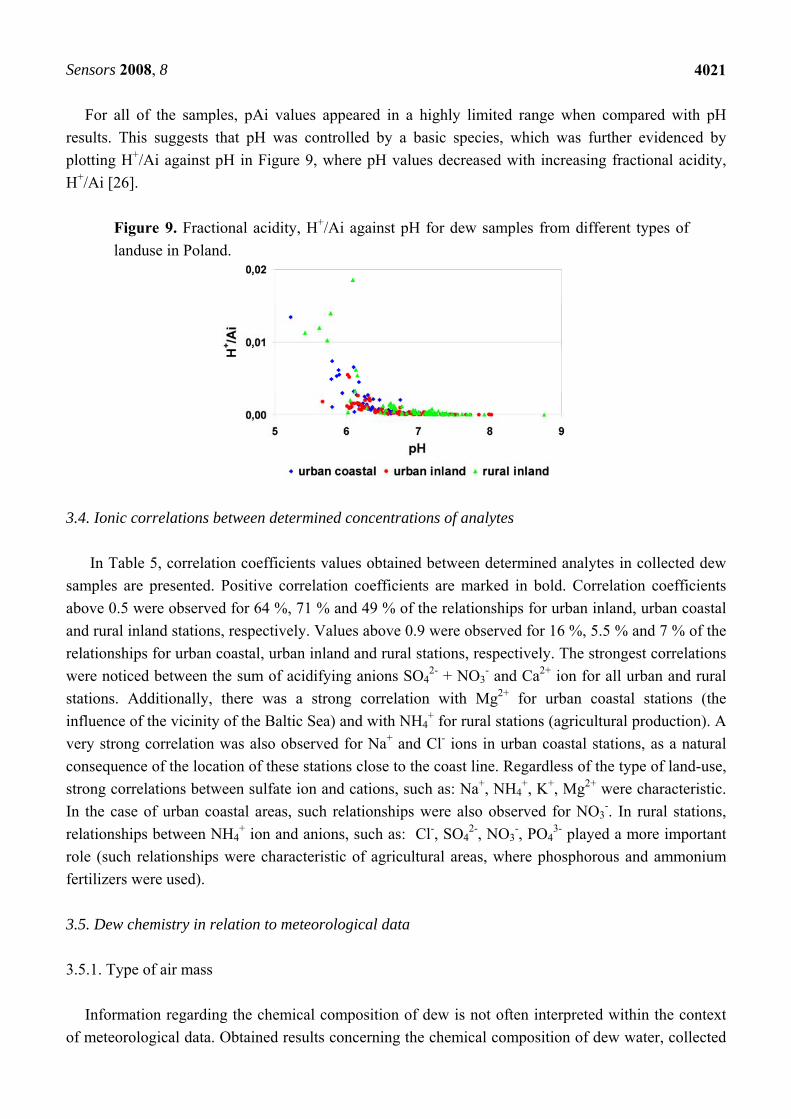
For all of the samples, pAi values appeared in a highly limited range when compared with pH results. This suggests that pH was controlled by a basic species, which was further evidenced by plotting H+/Ai against pH in Figure 9, where pH values decreased with increasing fractional acidity, H+/Ai [26].
Figure 9. Fractional acidity, H+/Ai against pH for dew samples from different types of landuse in Poland.
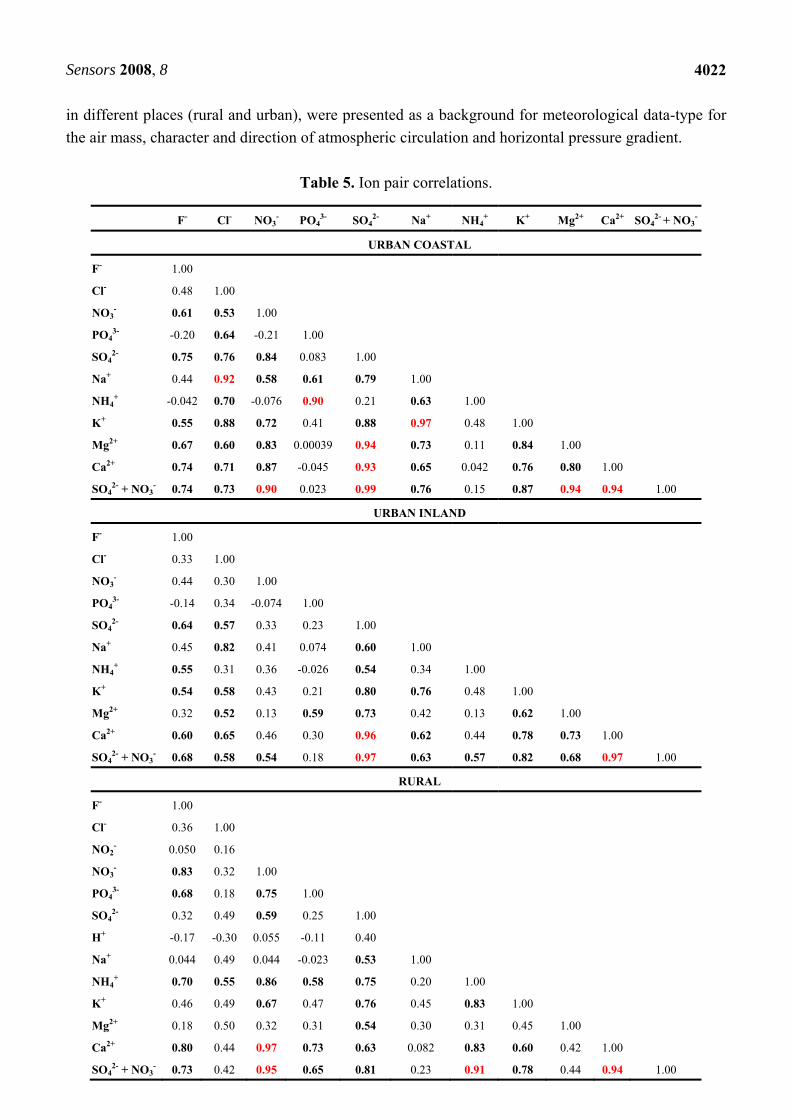
3.4. Ionic correlations between determined concentrations of analytes
In Table 5, correlation coefficients values obtained between determined analytes in collected dew
samples are presented. Positive correlation coefficients are marked in bold. Correlation coefficients above 0.5 were observed for 64 %, 71 % and 49 % of the relationships for urban inland, urban coastal and rural inland stations, respectively. Values above 0.9 were observed for 16 %, 5.5 % and 7 % of the relationships for urban coastal, urban inland and rural stations, respectively. The strongest correlations were noticed between the sum of acidifying anions SO4
2- + NO3- and Ca2+ ion for all urban and rural
stations. Additionally, there was a strong correlation with Mg2+ for urban coastal stations (the influence of the vicinity of the Baltic Sea) and with NH4
+ for rural stations (agricultural production). A very strong correlation was also observed for Na+ and Cl- ions in urban coastal stations, as a natural consequence of the location of these stations close to the coast line. Regardless of the type of land-use, strong correlations between sulfate ion and cations, such as: Na+, NH4
+, K+, Mg2+ were characteristic. In the case of urban coastal areas, such relationships were also observed for NO3
-. In rural stations, relationships between NH4
+ ion and anions, such as: Cl-, SO42-, NO3
-, PO43- played a more important
role (such relationships were characteristic of agricultural areas, where phosphorous and ammonium fertilizers were used). 3.5. Dew chemistry in relation to meteorological data 3.5.1. Type of air mass
Information regarding the chemical composition of dew is not often interpreted within the context
of meteorological data. Obtained results concerning the chemical composition of dew water, collected
Sensors 2008, 8
4022
in different places (rural and urban), were presented as a background for meteorological data-type for the air mass, character and direction of atmospheric circulation and horizontal pressure gradient.
Table 5. Ion pair correlations.
F- Cl- NO3- PO4
3- SO42- Na+ NH4
+ K+ Mg2+ Ca2+ SO42- + NO3
-
URBAN COASTAL
F- 1.00
Cl- 0.48 1.00
NO3- 0.61 0.53 1.00
PO43- -0.20 0.64 -0.21 1.00
SO42- 0.75 0.76 0.84 0.083 1.00
Na+ 0.44 0.92 0.58 0.61 0.79 1.00
NH4+ -0.042 0.70 -0.076 0.90 0.21 0.63 1.00
K+ 0.55 0.88 0.72 0.41 0.88 0.97 0.48 1.00
Mg2+ 0.67 0.60 0.83 0.00039 0.94 0.73 0.11 0.84 1.00
Ca2+ 0.74 0.71 0.87 -0.045 0.93 0.65 0.042 0.76 0.80 1.00
SO42- + NO3
- 0.74 0.73 0.90 0.023 0.99 0.76 0.15 0.87 0.94 0.94 1.00
URBAN INLAND
F- 1.00
Cl- 0.33 1.00
NO3- 0.44 0.30 1.00
PO43- -0.14 0.34 -0.074 1.00
SO42- 0.64 0.57 0.33 0.23 1.00
Na+ 0.45 0.82 0.41 0.074 0.60 1.00
NH4+ 0.55 0.31 0.36 -0.026 0.54 0.34 1.00
K+ 0.54 0.58 0.43 0.21 0.80 0.76 0.48 1.00
Mg2+ 0.32 0.52 0.13 0.59 0.73 0.42 0.13 0.62 1.00
Ca2+ 0.60 0.65 0.46 0.30 0.96 0.62 0.44 0.78 0.73 1.00
SO42- + NO3
- 0.68 0.58 0.54 0.18 0.97 0.63 0.57 0.82 0.68 0.97 1.00
RURAL
F- 1.00
Cl- 0.36 1.00
NO2- 0.050 0.16
NO3- 0.83 0.32 1.00
PO43- 0.68 0.18 0.75 1.00
SO42- 0.32 0.49 0.59 0.25 1.00
H+ -0.17 -0.30 0.055 -0.11 0.40
Na+ 0.044 0.49 0.044 -0.023 0.53 1.00
NH4+ 0.70 0.55 0.86 0.58 0.75 0.20 1.00
K+ 0.46 0.49 0.67 0.47 0.76 0.45 0.83 1.00
Mg2+ 0.18 0.50 0.32 0.31 0.54 0.30 0.31 0.45 1.00
Ca2+ 0.80 0.44 0.97 0.73 0.63 0.082 0.83 0.60 0.42 1.00
SO42- + NO3
- 0.73 0.42 0.95 0.65 0.81 0.23 0.91 0.78 0.44 0.94 1.00
Sensors 2008, 8
4023
Air mass is a large volume of air, in which prevailing meteorological conditions are generated by an exchange of energy and moisture between the atmosphere and its underlying surface over the area, from which the air mass flows. In about 60 % of the cases in Poland, polar maritime (Pm) masses flow from the west. They are formed over the North Atlantic and are often accompanied by atmospheric precipitation. Less frequently observed are the polar-continental (Pc) masses flowing from Eastern Europe, which are dry as well as cold during winter and dry as well as hot during summer. Arctic air masses (PA) flow occasionally from the Arctic Sea and bring cold weather with possible showers. That is reason limited number of the days with arctic air mass and even lack of dew chemical composition in case of arctic air mass for rural in land.
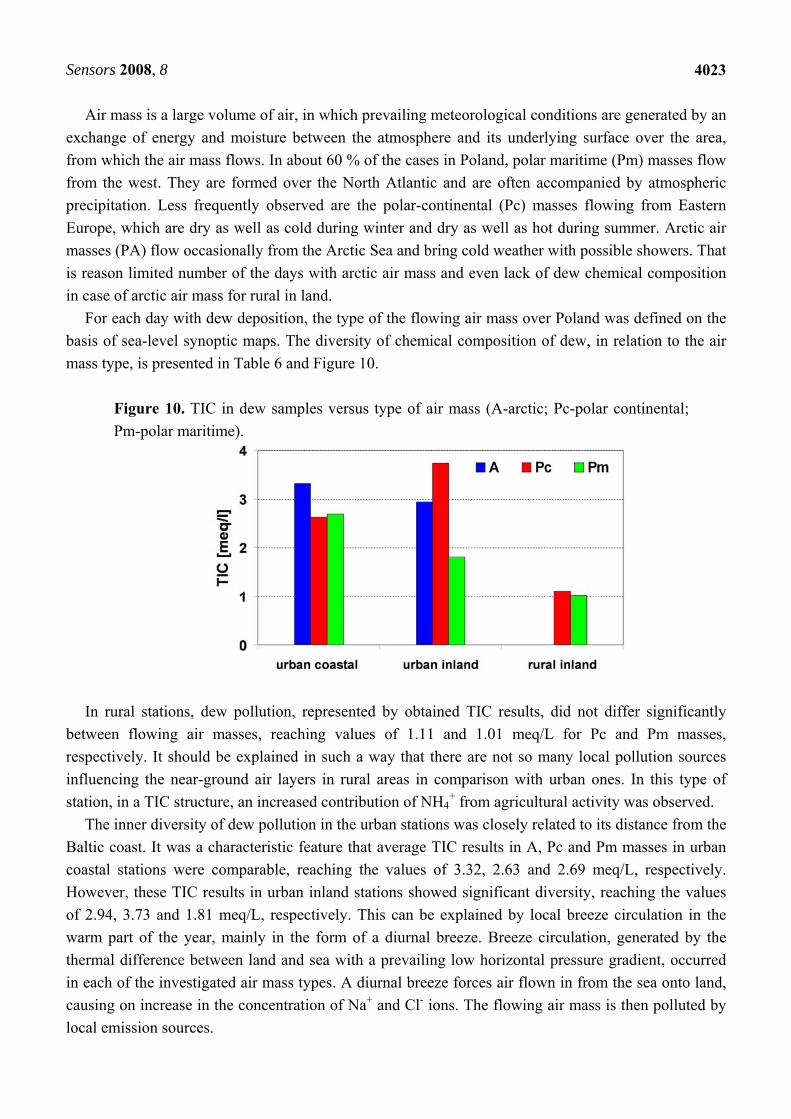
For each day with dew deposition, the type of the flowing air mass over Poland was defined on the basis of sea-level synoptic maps. The diversity of chemical composition of dew, in relation to the air mass type, is presented in Table 6 and Figure 10.
Figure 10. TIC in dew samples versus type of air mass (A-arctic; Pc-polar continental; Pm-polar maritime).
In rural stations, dew pollution, represented by obtained TIC results, did not differ significantly
between flowing air masses, reaching values of 1.11 and 1.01 meq/L for Pc and Pm masses, respectively. It should be explained in such a way that there are not so many local pollution sources influencing the near-ground air layers in rural areas in comparison with urban ones. In this type of station, in a TIC structure, an increased contribution of NH4
+ from agricultural activity was observed. The inner diversity of dew pollution in the urban stations was closely related to its distance from the
Baltic coast. It was a characteristic feature that average TIC results in A, Pc and Pm masses in urban coastal stations were comparable, reaching the values of 3.32, 2.63 and 2.69 meq/L, respectively. However, these TIC results in urban inland stations showed significant diversity, reaching the values of 2.94, 3.73 and 1.81 meq/L, respectively. This can be explained by local breeze circulation in the warm part of the year, mainly in the form of a diurnal breeze. Breeze circulation, generated by the thermal difference between land and sea with a prevailing low horizontal pressure gradient, occurred in each of the investigated air mass types. A diurnal breeze forces air flown in from the sea onto land, causing on increase in the concentration of Na+ and Cl- ions. The flowing air mass is then polluted by local emission sources.
Sensors 2008, 8
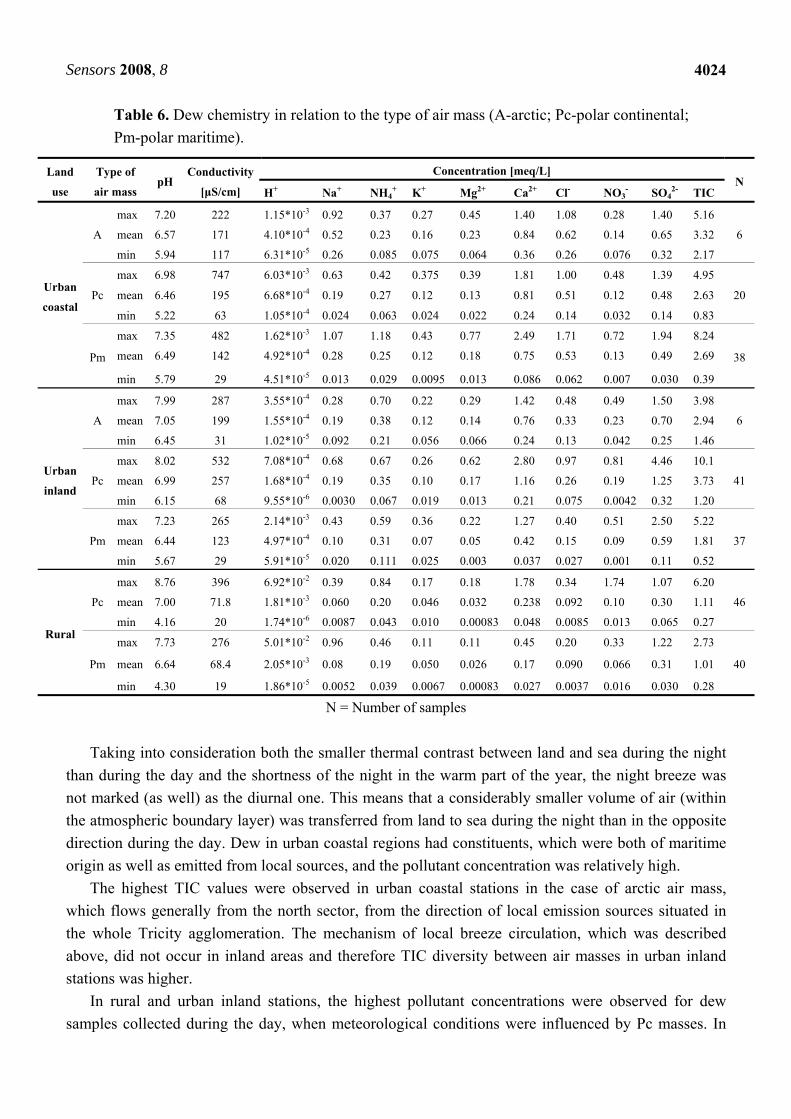
4024
Table 6. Dew chemistry in relation to the type of air mass (A-arctic; Pc-polar continental; Pm-polar maritime).
N = Number of samples
Taking into consideration both the smaller thermal contrast between land and sea during the night than during the day and the shortness of the night in the warm part of the year, the night breeze was not marked (as well) as the diurnal one. This means that a considerably smaller volume of air (within the atmospheric boundary layer) was transferred from land to sea during the night than in the opposite direction during the day. Dew in urban coastal regions had constituents, which were both of maritime origin as well as emitted from local sources, and the pollutant concentration was relatively high.
The highest TIC values were observed in urban coastal stations in the case of arctic air mass, which flows generally from the north sector, from the direction of local emission sources situated in the whole Tricity agglomeration. The mechanism of local breeze circulation, which was described above, did not occur in inland areas and therefore TIC diversity between air masses in urban inland stations was higher.
In rural and urban inland stations, the highest pollutant concentrations were observed for dew samples collected during the day, when meteorological conditions were influenced by Pc masses. In
Land
use
Type of
air mass pH
Conductivity
[μS/cm]
Concentration [meq/L] N
H+ Na+ NH4+ K+ Mg2+ Ca2+ Cl- NO3
- SO42- TIC
Urban
coastal
A
max 7.20 222 1.15*10-3 0.92 0.37 0.27 0.45 1.40 1.08 0.28 1.40 5.16
6 mean 6.57 171 4.10*10-4 0.52 0.23 0.16 0.23 0.84 0.62 0.14 0.65 3.32
min 5.94 117 6.31*10-5 0.26 0.085 0.075 0.064 0.36 0.26 0.076 0.32 2.17
Pc
max 6.98 747 6.03*10-3 0.63 0.42 0.375 0.39 1.81 1.00 0.48 1.39 4.95
20 mean 6.46 195 6.68*10-4 0.19 0.27 0.12 0.13 0.81 0.51 0.12 0.48 2.63
min 5.22 63 1.05*10-4 0.024 0.063 0.024 0.022 0.24 0.14 0.032 0.14 0.83
Pm
max 7.35 482 1.62*10-3 1.07 1.18 0.43 0.77 2.49 1.71 0.72 1.94 8.24
38 mean 6.49 142 4.92*10-4 0.28 0.25 0.12 0.18 0.75 0.53 0.13 0.49 2.69
min 5.79 29 4.51*10-5 0.013 0.029 0.0095 0.013 0.086 0.062 0.007 0.030 0.39
Urban
inland
A
max 7.99 287 3.55*10-4 0.28 0.70 0.22 0.29 1.42 0.48 0.49 1.50 3.98
6 mean 7.05 199 1.55*10-4 0.19 0.38 0.12 0.14 0.76 0.33 0.23 0.70 2.94
min 6.45 31 1.02*10-5 0.092 0.21 0.056 0.066 0.24 0.13 0.042 0.25 1.46
Pc
max 8.02 532 7.08*10-4 0.68 0.67 0.26 0.62 2.80 0.97 0.81 4.46 10.1
41 mean 6.99 257 1.68*10-4 0.19 0.35 0.10 0.17 1.16 0.26 0.19 1.25 3.73
min 6.15 68 9.55*10-6 0.0030 0.067 0.019 0.013 0.21 0.075 0.0042 0.32 1.20
Pm
max 7.23 265 2.14*10-3 0.43 0.59 0.36 0.22 1.27 0.40 0.51 2.50 5.22
37 mean 6.44 123 4.97*10-4 0.10 0.31 0.07 0.05 0.42 0.15 0.09 0.59 1.81
min 5.67 29 5.91*10-5 0.020 0.111 0.025 0.003 0.037 0.027 0.001 0.11 0.52
Rural
Pc
max 8.76 396 6.92*10-2 0.39 0.84 0.17 0.18 1.78 0.34 1.74 1.07 6.20
46 mean 7.00 71.8 1.81*10-3 0.060 0.20 0.046 0.032 0.238 0.092 0.10 0.30 1.11
min 4.16 20 1.74*10-6 0.0087 0.043 0.010 0.00083 0.048 0.0085 0.013 0.065 0.27
Pm
max 7.73 276 5.01*10-2 0.96 0.46 0.11 0.11 0.45 0.20 0.33 1.22 2.73
40 mean 6.64 68.4 2.05*10-3 0.08 0.19 0.050 0.026 0.17 0.090 0.066 0.31 1.01
min 4.30 19 1.86*10-5 0.0052 0.039 0.0067 0.00083 0.027 0.0037 0.016 0.030 0.28
Sensors 2008, 8
4025
rural areas, the difference between Pc and Pm masses reached only 10 %. In the stations representing urban conditions, TIC values in Pc mass were more than twice as high as the Pm value. An explanation seems to be quite obvious. In comparison with Pm and A masses, dry air flow of Pc mass was characterized by lack of precipitation or small rainfalls with a limited range. This considerably limited the removal rate of pollutants (aerosols, dust or gaseous components) from air and caused an increase in the significance of their transport. In inland areas, a considerably higher efficiency of pollutants’ removal from the atmosphere occurred in Pm and A masses, in which precipitation was more abundant, when compared with Pc mass. Moreover, during the nights which followed the days with the Pc mass, the near-ground inversion layer was characteristic, above which the second inversion layer often occurred due to the mesoscale subsidence of air in anticyclone systems. Under such conditions, there was a tendency for pollutants to accumulate in the sub-inversion layer (an average thickness of a few hundred meters above the ground) due to the considerably limited possibilities of air mixing. Noticeably smaller differences in TIC values between Pc and Pm masses in rural stations, as compared with measuring sites situated in urban inland terrains, additionally confirmed a low level of atmospheric pollution in rural areas. 3.5.2. Synoptic situation
Quite important, in the context of the level of dew pollution, is the height of the mixing layer and
the type of thermal stratification occurring within it. The efficient vertical mixing of air occurs under unstable conditions. Pollutants are more efficiently transported within the mixing layer than in other types of thermal stratification. Additionally, the depth of the mixing layer is the greatest. Under both: stable and temperature inversion conditions, the vertical transport of pollutants between air layers is significantly limited. Neutral stratification and the potential instability with the prevalence of ascending air currents are characteristic for low pressure systems during the whole year. In anticyclones, stable stratification connected to an inversion of radiation or subsidence origin is dominant in the atmospheric boundary layer, particularly in the cold part of the year. The occurrence of stable stratification considerably limits vertical air exchange allowing for a high and steady concentration level of emitted atmospheric pollutants. For each day with dew, on the basis of sea level synoptic maps (00 GMT) [31], one of three typical synoptic situations: anticyclonic (AS), cyclonic (CS) or transition (TS), determining the intermediate situation between AS and CS, was assigned.
Conditions allowing for dew formation occured in the anticyclonic situation, when Poland was surrounded by the central part of a high pressure system. Then, the prevailing macroscale processes of air subsidence conduced to cloudless weather with a very weak wind. A lesser probability of dew generation refers to the transition situation and in a greater degree to the cyclonic one. It finds its reflection in the population of the investigated cases of dew formation (AS-168, TS-37, CS-30, respectively). The diversity of the chemical composition of the dew in relation to the synoptic situation is presented in Table 7 and Figure 11.
Sensors 2008, 8
4026
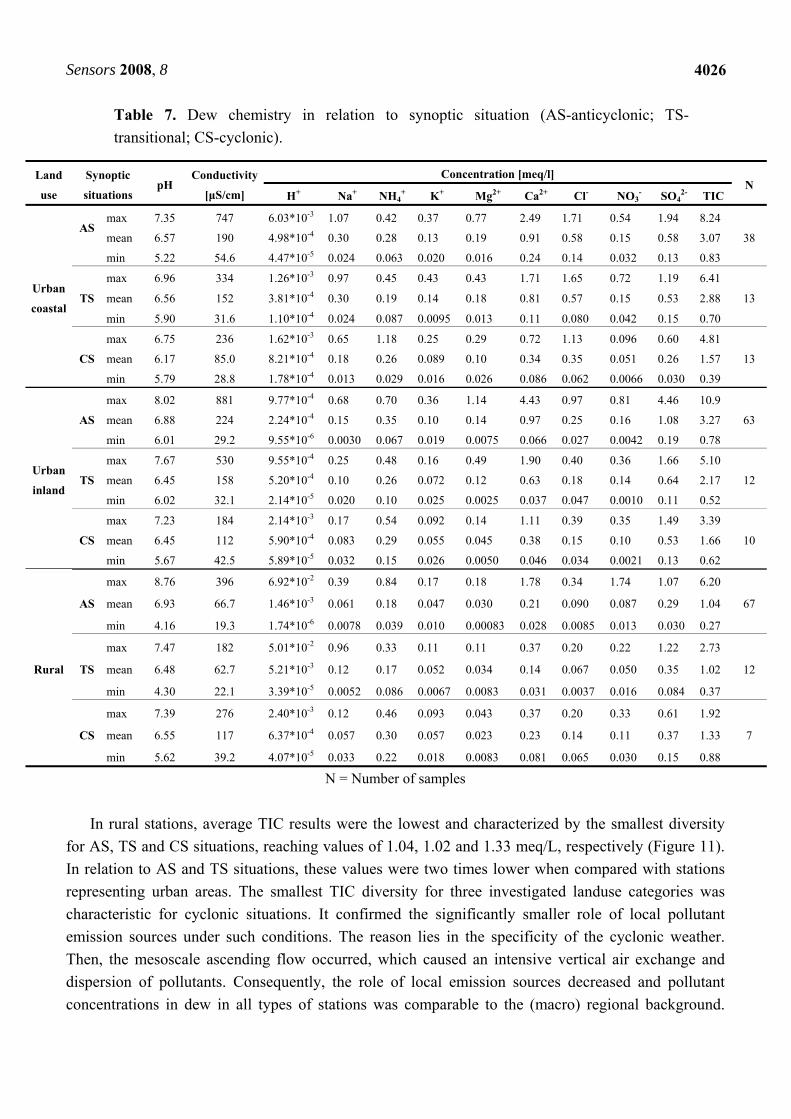
Table 7. Dew chemistry in relation to synoptic situation (AS-anticyclonic; TS-transitional; CS-cyclonic).
N = Number of samples In rural stations, average TIC results were the lowest and characterized by the smallest diversity
for AS, TS and CS situations, reaching values of 1.04, 1.02 and 1.33 meq/L, respectively (Figure 11). In relation to AS and TS situations, these values were two times lower when compared with stations representing urban areas. The smallest TIC diversity for three investigated landuse categories was characteristic for cyclonic situations. It confirmed the significantly smaller role of local pollutant emission sources under such conditions. The reason lies in the specificity of the cyclonic weather. Then, the mesoscale ascending flow occurred, which caused an intensive vertical air exchange and dispersion of pollutants. Consequently, the role of local emission sources decreased and pollutant concentrations in dew in all types of stations was comparable to the (macro) regional background.
Land
use
Synoptic
situations pH
Conductivity
[μS/cm]
Concentration [meq/l] N
H+ Na+ NH4+ K+ Mg2+ Ca2+ Cl- NO3
- SO42- TIC
Urban
coastal
AS
max 7.35 747 6.03*10-3 1.07 0.42 0.37 0.77 2.49 1.71 0.54 1.94 8.24
38 mean 6.57 190 4.98*10-4 0.30 0.28 0.13 0.19 0.91 0.58 0.15 0.58 3.07
min 5.22 54.6 4.47*10-5 0.024 0.063 0.020 0.016 0.24 0.14 0.032 0.13 0.83
TS
max 6.96 334 1.26*10-3 0.97 0.45 0.43 0.43 1.71 1.65 0.72 1.19 6.41
13 mean 6.56 152 3.81*10-4 0.30 0.19 0.14 0.18 0.81 0.57 0.15 0.53 2.88
min 5.90 31.6 1.10*10-4 0.024 0.087 0.0095 0.013 0.11 0.080 0.042 0.15 0.70
CS
max 6.75 236 1.62*10-3 0.65 1.18 0.25 0.29 0.72 1.13 0.096 0.60 4.81
13 mean 6.17 85.0 8.21*10-4 0.18 0.26 0.089 0.10 0.34 0.35 0.051 0.26 1.57
min 5.79 28.8 1.78*10-4 0.013 0.029 0.016 0.026 0.086 0.062 0.0066 0.030 0.39
Urban
inland
AS
max 8.02 881 9.77*10-4 0.68 0.70 0.36 1.14 4.43 0.97 0.81 4.46 10.9
63 mean 6.88 224 2.24*10-4 0.15 0.35 0.10 0.14 0.97 0.25 0.16 1.08 3.27
min 6.01 29.2 9.55*10-6 0.0030 0.067 0.019 0.0075 0.066 0.027 0.0042 0.19 0.78
TS
max 7.67 530 9.55*10-4 0.25 0.48 0.16 0.49 1.90 0.40 0.36 1.66 5.10
12 mean 6.45 158 5.20*10-4 0.10 0.26 0.072 0.12 0.63 0.18 0.14 0.64 2.17
min 6.02 32.1 2.14*10-5 0.020 0.10 0.025 0.0025 0.037 0.047 0.0010 0.11 0.52
CS
max 7.23 184 2.14*10-3 0.17 0.54 0.092 0.14 1.11 0.39 0.35 1.49 3.39
10 mean 6.45 112 5.90*10-4 0.083 0.29 0.055 0.045 0.38 0.15 0.10 0.53 1.66
min 5.67 42.5 5.89*10-5 0.032 0.15 0.026 0.0050 0.046 0.034 0.0021 0.13 0.62
Rural
AS
max 8.76 396 6.92*10-2 0.39 0.84 0.17 0.18 1.78 0.34 1.74 1.07 6.20
67 mean 6.93 66.7 1.46*10-3 0.061 0.18 0.047 0.030 0.21 0.090 0.087 0.29 1.04
min 4.16 19.3 1.74*10-6 0.0078 0.039 0.010 0.00083 0.028 0.0085 0.013 0.030 0.27
TS
max 7.47 182 5.01*10-2 0.96 0.33 0.11 0.11 0.37 0.20 0.22 1.22 2.73
12 mean 6.48 62.7 5.21*10-3 0.12 0.17 0.052 0.034 0.14 0.067 0.050 0.35 1.02
min 4.30 22.1 3.39*10-5 0.0052 0.086 0.0067 0.0083 0.031 0.0037 0.016 0.084 0.37
CS
max 7.39 276 2.40*10-3 0.12 0.46 0.093 0.043 0.37 0.20 0.33 0.61 1.92
7 mean 6.55 117 6.37*10-4 0.057 0.30 0.057 0.023 0.23 0.14 0.11 0.37 1.33
min 5.62 39.2 4.07*10-5 0.033 0.22 0.018 0.0083 0.081 0.065 0.030 0.15 0.88
Sensors 2008, 8
4027
Additionally, the washout of pollutants from the atmosphere in cyclonic weather was more efficient than in the anticyclonic one, due to more frequent precipitation events.
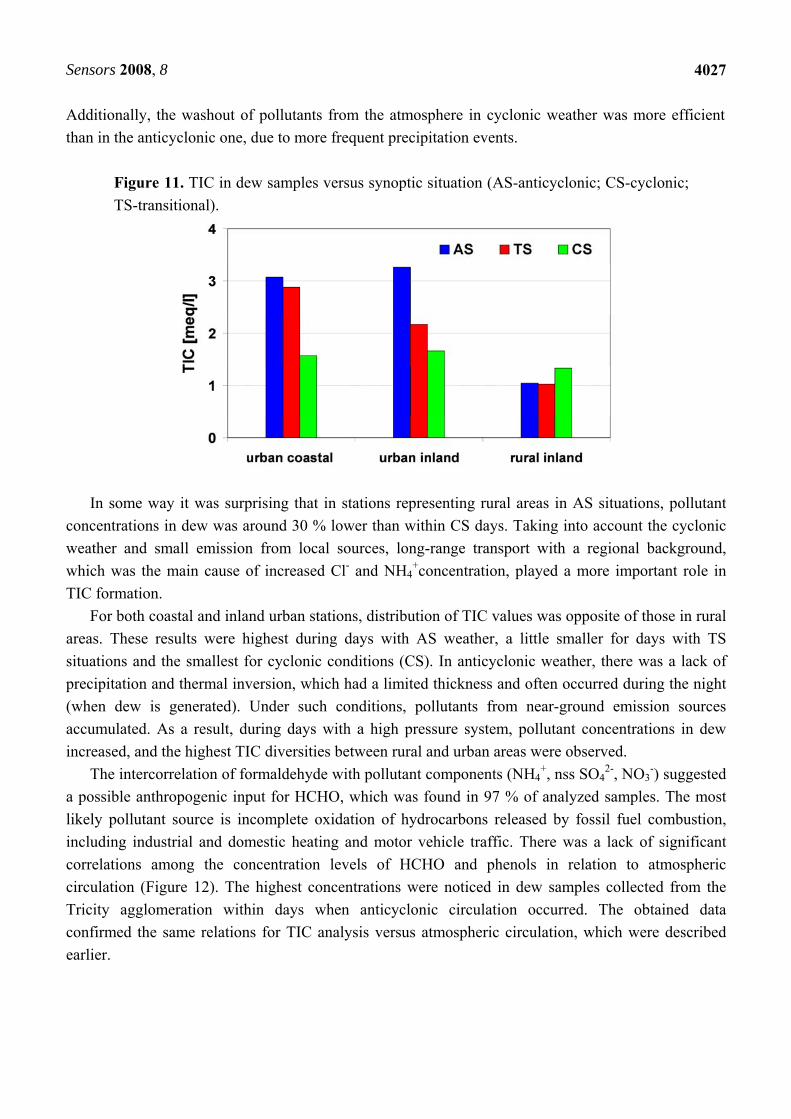
Figure 11. TIC in dew samples versus synoptic situation (AS-anticyclonic; CS-cyclonic; TS-transitional).
In some way it was surprising that in stations representing rural areas in AS situations, pollutant concentrations in dew was around 30 % lower than within CS days. Taking into account the cyclonic weather and small emission from local sources, long-range transport with a regional background, which was the main cause of increased Cl- and NH4
+concentration, played a more important role in TIC formation.
For both coastal and inland urban stations, distribution of TIC values was opposite of those in rural areas. These results were highest during days with AS weather, a little smaller for days with TS situations and the smallest for cyclonic conditions (CS). In anticyclonic weather, there was a lack of precipitation and thermal inversion, which had a limited thickness and often occurred during the night (when dew is generated). Under such conditions, pollutants from near-ground emission sources accumulated. As a result, during days with a high pressure system, pollutant concentrations in dew increased, and the highest TIC diversities between rural and urban areas were observed.
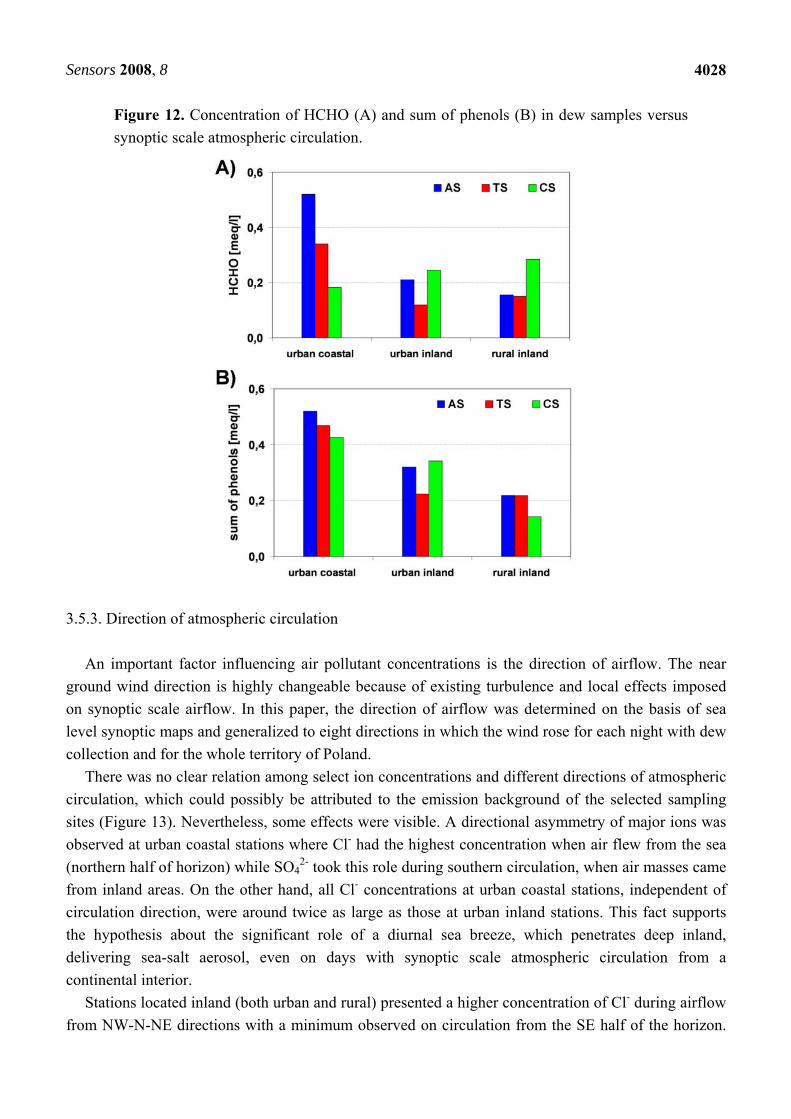
The intercorrelation of formaldehyde with pollutant components (NH4+, nss SO4
2-, NO3-) suggested
a possible anthropogenic input for HCHO, which was found in 97 % of analyzed samples. The most likely pollutant source is incomplete oxidation of hydrocarbons released by fossil fuel combustion, including industrial and domestic heating and motor vehicle traffic. There was a lack of significant correlations among the concentration levels of HCHO and phenols in relation to atmospheric circulation (Figure 12). The highest concentrations were noticed in dew samples collected from the Tricity agglomeration within days when anticyclonic circulation occurred. The obtained data confirmed the same relations for TIC analysis versus atmospheric circulation, which were described earlier.
Sensors 2008, 8
4028
Figure 12. Concentration of HCHO (A) and sum of phenols (B) in dew samples versus synoptic scale atmospheric circulation.
3.5.3. Direction of atmospheric circulation
An important factor influencing air pollutant concentrations is the direction of airflow. The near
ground wind direction is highly changeable because of existing turbulence and local effects imposed on synoptic scale airflow. In this paper, the direction of airflow was determined on the basis of sea level synoptic maps and generalized to eight directions in which the wind rose for each night with dew collection and for the whole territory of Poland.
There was no clear relation among select ion concentrations and different directions of atmospheric circulation, which could possibly be attributed to the emission background of the selected sampling sites (Figure 13). Nevertheless, some effects were visible. A directional asymmetry of major ions was observed at urban coastal stations where Cl- had the highest concentration when air flew from the sea (northern half of horizon) while SO4
2- took this role during southern circulation, when air masses came from inland areas. On the other hand, all Cl- concentrations at urban coastal stations, independent of circulation direction, were around twice as large as those at urban inland stations. This fact supports the hypothesis about the significant role of a diurnal sea breeze, which penetrates deep inland, delivering sea-salt aerosol, even on days with synoptic scale atmospheric circulation from a continental interior.
Stations located inland (both urban and rural) presented a higher concentration of Cl- during airflow from NW-N-NE directions with a minimum observed on circulation from the SE half of the horizon.
Sensors 2008, 8
4029
The opposite pattern was visible in the case of sulphates, which came probably from distant industrialized areas further in the south. No discernible trend was detected for NH4
+, which was emitted mainly from dispersed agricultural sources, with no clear directional preferences.
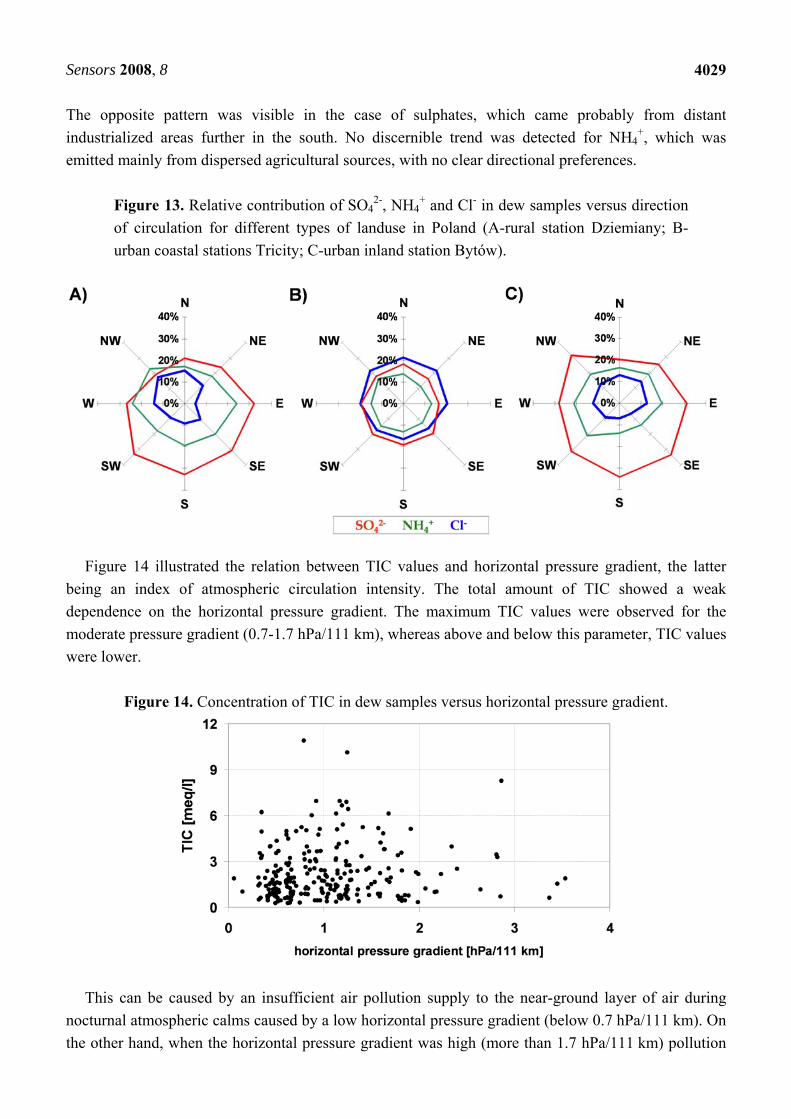
Figure 13. Relative contribution of SO4
2-, NH4+ and Cl- in dew samples versus direction
of circulation for different types of landuse in Poland (A-rural station Dziemiany; B-urban coastal stations Tricity; C-urban inland station Bytów).
Figure 14 illustrated the relation between TIC values and horizontal pressure gradient, the latter
being an index of atmospheric circulation intensity. The total amount of TIC showed a weak dependence on the horizontal pressure gradient. The maximum TIC values were observed for the moderate pressure gradient (0.7-1.7 hPa/111 km), whereas above and below this parameter, TIC values were lower.
Figure 14. Concentration of TIC in dew samples versus horizontal pressure gradient.
This can be caused by an insufficient air pollution supply to the near-ground layer of air during
nocturnal atmospheric calms caused by a low horizontal pressure gradient (below 0.7 hPa/111 km). On the other hand, when the horizontal pressure gradient was high (more than 1.7 hPa/111 km) pollution
Sensors 2008, 8
4030
was dispersed by turbulence in vigorous airflow, which resulted in a lowering of observed concentrations. If the pressure gradient was moderate (0.7-1.7 hPa/111 km), the observed airflow brought pollution from neighbouring areas but was not strong enough to cause intense dispersion of pollutants, resulting in lowered concentrations. Nevertheless, the relationships presented are not unequivocal because of the role of other factors controlling dew formation and chemistry. 4. Conclusions
Dew water in Poland was characterised by a relatively high concentration of major ions with an average TIC 2.46 meq/L, when compared with precipitation (wet only; 0.37 meq/L) or orographic fog (1.01 meq/L) albeit very similar to hoarfrost (2.86 meq/L). Due to a high concentration of chemical constituents, dew is particularly important in pollutant deposition processes. Hence, over the large area of European lowlands, dew (together with hoarfrost) form an important path of pollutants' flux to the ground, being responsible at least for an additional 50% deposition through atmospheric precipitation. Ion concentrations in precipitation is 6-7 times lower in comparison with dew, but the amount of precipitation is a dozen times higher.
A specific feature of dew chemistry was a low level of NO3- when compared with precipitation,
presumably caused by a decrease of traffic emission when dew was formed. The dominant ions were SO4
2- at rural and inland urban stations and Ca2+ at urban coastal stations. The discernible decrease of the marine components was clearly visible with an increasing distance away from the Baltic coast. Because of high concentration of both Ca2+ and NH4
+, pH values of dew water were usually high. The chemistry of dew water was strongly influenced by atmospheric circulation and air mass
character. The highest pollutant concentrations in dew occurred when there was a lack of precipitation in the advecting air mass and weak synoptic- or local- scale airflow was observed supplying the area of dew formation with pollutants emitted from local sources. Local breeze circulation appeared to be very important for both pollutant concentration and composition in coastal areas.
Taking into account both high TIC values and the annual water equivalent, dew was a considerable factor of wet deposition, being responsible for an additional 60% of pollutants input into the ground when compared with precipitation. 5. Acknowledgements
This scientific work was financially supported in 2006-2008 as a research project (1 T09D 098 30).
6. References 1. Taylor, R.C. (ed.). Glossary of Meteorology (http://amsglossary.allenpress.com/glossary),
American Meteorological Society, website visited 6 March 2007. 2. Beysens, D. The formation of dew. Atmos. Res. 1995, 39, 215-237. 3. Olszewski, J.L. Dew at various heights above ground. Ekol. Pol. 1976, 24, 639-668. 4. Hutorowicz, H. Dew measurements at Olsztyn. Assoc. Int. Hydrol. Scient. 1963, 65, 352-359.
Sensors 2008, 8
4031
5. Monteith, J.L. Dew: facts and fallacies. In: The water relations of plants; Rutter, A.J., Whitehead, F.H., eds.; Wiley: New York, 1963; pp. 37-56.
6. Garratt, J.R., M. Segal. On the contribution of atmospheric moisture to dew formation. Bound. Layer Meteor 1988, 45, 209-236.
7. Richards, K. Hardware scale modeling of summertime patterns of urban dew and surface moisture in Vancouver, BC, Canada. Atmos. Res. 2002, 64, 313-321.
8. Jacobs, A.F.G.; Heusinkveld, B.G.; Berkiwicz, S.M. Dew deposition and drying in a desert system: a simple simulation model. J. Arid Environ. 1999, 42, 211-222.
9. Jacobs, A.F.G.; Heusinkveld, B.G.; Berkiwicz, S.M. Force-restore technique for ground surface temperature and moisture content in dry desert system. Water Resour. Res. 2000, 36, 1261-1268.
10. Jacobs, A.F.G.; Heusinkveld, B.G.; Berkiwicz, S.M. A simple model for potential dewfall in an arid region. Atmos. Environ. 2002, 64, 285-295.
11. Evenari, M.; Shanan, L.; Tadmor, N. The Negev: Challenge of a Desert, 2nd Ed. Harvard Univ. Press: Cambridge, MA, 1982.
12. Richards, K. Observation and modeling of urban dew. PhD thesis, University of British Columbia, Vancouver, Canada, 1999.
13. Grimmond, C.S.B.; Oke, T.R. Variability of evapotranspiration rates in urban areas. In Biometeorology and Urban Climatology at the Turn of the Millennium; de Dear, R.J., Kalma, J.D., Oke, T.R., Auliciems, A., Eds.; Selected papers from the ICB-ICU’99 Conference. World Meteorological Organization: Geneva, 2000; pp. 475-480.
14. Beysens, D.; Ohayon, C.; Muselli, M.; Clus O. Chemical and biological characteristics of dew and rain water in an urban coastal area (Bordeaux, France). Atmos. Environ. 2006, 40, 3710-3723.
15. Beysens, D.; Muselli, M.; Milimouk, I.; Ohayon, C.; Berkowicz, S. M.; Soyeux, E.; Mileta, M.; Ortega P. Application of passive radiative cooling for dew condensation. Energy 2006, 31, 1967-1979.
16. Muselli, M.; Beysens, D.; Marcillat, J.; Milimouk, I.; Nilsson, T.; Louche, A. Dew water collector for potable water in Ajaccio. Atmos. Res. 2002, 64, 297-312.
17. Zuo, Y.; Wang, C.; Van, T. Simultaneous determination of nitrite and nitrate in dew, rain, snow and lake water samples by ion-pair high-performance liquid chromatography. Talanta 2006, 70, 281-285.
18. Rubio, M. A.; Guerrero, M. J.; Villena, G.; Lissi E. Hydroperoxides in dew water in downtown Santiago, Chile. A comparison with gas-phase values. Atmos. Environ. 2006, 40, 6165-6172.
19. Jiries, A. Chemical composition of dew in Amman, Japan. Atmos. Res. 2001, 57, 261-268. 20. Polkowska, Ż.; Astel, A.; Walna, B.; Małek, S.; Mędrzycka, K.; Górecki, T.; Siepak, J.;
Namieśnik, J. Chemometric analysis of rainwater and throughfall at several sites in Poland. Atmos. Environ. 2005, 39, 837-855.
21. Cardenas, L.M.; Brassington, D.J.; Allan, B.J.; Coe, H.; Alicke, B.; Platt, U.; Wilson, K.M.; Plane, J.M.C.; Penkett, S.A. Intercomparison of formaldehyde measurements in clean and polluted atmospheres. J. Atmos. Chem. 2000, 37, 53-80.
22. Cini, R.; Prodi, F.; Santachiara, G.; Porcu., F.; Bellandi, S.; Stortini, A.M.; Oppo, C.; Udisti, R.; Pantani, F. Chemical characterization of cloud episodes at a ridge in Tuscan Appenines, Italy. Atmos. Res. 2002, 61, 311-334.
Sensors 2008, 8
4032
23. Zimmermann, F.; Matschullat, J.; Bruggemann, E.; Pleβow, K.; Wienhaus, O. Temporal and elevation-related variability in precipitation chemistry from 1993 to 2002, Eastern Erzgebirge, Germany. Water, Air, Soil Pollut. 2006, 170, 123-141.
24. Möller, D.; Acker, K.; Wieprecht, W. A relationship between liquid water content and chemical composition in clouds. Atmos. Res. 1996, 41, 321-335.
25. Watanabe, K.; Ishizaka, Y.; Takenaka, C. Chemical characteristics of cloud water over the Japan Sea and the North western Pacific Ocean near the central part of Japan: airborne measurements. Atmos. Environ. 2001, 35, 645-655.
26. Hara, H.; Kitamura, M.; Mori, A.; Noguchi, I.; Ohizumi, T.; Seto, S.; Takeuchi, T.; Deguchi, T. Precipitation chemistry in Japan 1989-1993. Water Air Soil Pollut. 1995, 85, 2307-2312.
27. Watanabe, K.; Takebe, Y.; Sode, N.; Igarashi, Y.; Takahashi, H.; Dokiya, Y. Fog and rain water chemistry at Mt. Fuji: A case study during the September 2002 campaign. Atmos. Res. 2006, 82, 652-662.
28. Błaś, M.; Sobik, M.; Quiel, F.; Netzel P. Temporal and spatial variations of fog in the Western Sudety Mts., Poland. Atmos. Res. 2002, 64, 19-28.
29. Dore, A.J.; Sobik, M.; Migała, K. Patterns of precipitation and pollutant deposition in the western Sudete Mountains. Atmos. Environ. 1999, 33, 3301-3312.
30. Sasakawa, M.; Uematsu, M. Relative contribution of chemical composition to acidification of sea fog (stratus) over the northern North Pacific and its marginal seas. Atmos. Environ. 2005, 39, 1357-1362.
31. Daily Synoptic Bulletin; IMGW: Warszawa, 2006. © 2008 by the authors; licensee Molecular Diversity Preservation International, Basel, Switzerland. This article is an open-access article distributed under the terms and conditions of the Creative Commons Attribution license (http://creativecommons.org/licenses/by/3.0/).
Sensors 2008, 8
4033
Legends for tables Table 1. Detailed characteristics of the sampling sites. Table 2. Information concerning the sampler applied to collection of dew samples Table 3. Summary characteristics of the analytical techniques used in the study. Table 4. Miniumum, maximum and average analytes concentration (meq/l and μS/cm-conductivity) and selected hydrochemical indices in dew samples. Table 5. Ion pair correlations. Table 6. Dew chemistry in relation to type of air mass (A-arctic; Pc-polar continental; Pm-polar maritime). Table 7. Dew chemistry in relation to synoptic situation (A-anticyclonic; C-cyclonic; T-transitional). Legends for figures Figure 1. Locations of the sampling sites with distinction between type of landuse; coastal urban (1, 2 and 3), urban inland (4, 6 and 8) and rural stations (5 and 7). Figure 2. Sampler applied to collection of dew samples. Figure 3. Chemical composition of dew water for different types of landuse in Poland: A-all stations; B-rural inland stations; C-urban coastal stations; D-urban inland stations. Figure 4. Frequency distribution of the equivalent ratio of NO3
-/SO42 in dew samples.
Figure 5. Relationships between Ca2+ and SO42- + NO3
- concentration in dew water. Figure 6. Frequency distribution of the equivalent ratio of Ca2+ + NH4
+/ NO3- + SO4
2- in dew samples. Figure 7. Relationship between AP and NP in dew water. Figure 8. pAi against pH for dew samples from different types of landuse in Poland. Figure 9. Fractional acidity, H+/Ai against pH for dew samples from different types of landuse in Poland. Figure 10. TIC in dew samples versus type of air mass (A-arctic; Pc-polar continental; Pm-polar maritime). Figure 11. TIC in dew samples versus synoptic situation (A-anticyclonic; C-cyclonic; T-transitional). Figure 12. Concentration of HCHO (A) and sum of phenols (B) in dew samples versus synoptic scale atmospheric circulation. Figure 13. Relative contribution of SO4
2-, NH4+ and Cl- in dew samples versus direction of circulation
for different types of landuse in Poland (A-rural station Dziemiany; B-urban coastal stations Tricity; C-urban inland station Bytów). Figure 14. Concentration of TIC in dew samples versus horizontal pressure gradient.