Embed Size (px)
Citation preview

Chemical composition, discharge and suspended matter of rivers in North-
Western Iceland. The database of the Science Institute, University of Iceland,
and the Hydrological Service of the National Energy Authority.
Sigurdur Reynir Gíslason1, Árni Snorrason2, Gudmundur Bjarki Ingvarsson1, Bergur
Sigfússon1, Eydís Salome Eiríksdóttir1, Sverrir Óskar Elefsen2, Jórunn Harðardóttir2,
Svava Björk Þorláksdóttir2 and Peter Torssander3
RH-07-2006
1Science Institute, University of Iceland, Dunhagi 3, 107 Reykjavík. 2Hydrological Service, National Energy Authority, Grensásvegur 9, 108 Reykjavík.
3Department of Geology and Geochemistry, Stockholm University, S-106 91
Stockholm, Sweden.
March 2006

2
TABLE OF CONTENTS INTRODUCTION................................................................................................................................... 4 METHODS.............................................................................................................................................. 5 River discharge .................................................................................................................................... 5 Sampling of river particulate suspended matter ................................................................................... 5 Sampling of river water ....................................................................................................................... 6 Analytical methods for suspended particulate constituents ................................................................. 7 Analytical methods for dissolved constituents..................................................................................... 8 Flux calculations .................................................................................................................................. 9 RESULTS.............................................................................................................................................. 10 Sampling and analytical results.......................................................................................................... 10 Charge balance and the relative error of the charge balance.............................................................. 12 Average composition of the rivers ..................................................................................................... 13 River fluxes in North-Western Iceland .............................................................................................. 13 Nordurá at Stekkur............................................................................................................................. 14 Concentration versus discharge correlations in River Nordurá.......................................................... 16 Time series for River Nordurá ........................................................................................................... 17 Vídidalsá at Kolugil ........................................................................................................................... 17 Concentration versus discharge correlations in River Vídidalsá........................................................ 20 Time series for River Vídidalsá ......................................................................................................... 20 Vatnsdalsá at Forsaeludalur ............................................................................................................... 20 Concentration versus discharge correlations in River Vatnsdalsá ..................................................... 23 Time series for River Vatnsdalsá ....................................................................................................... 23 ACKNOWLEDGEMENTS................................................................................................................... 24 REFERENCES...................................................................................................................................... 24 TABLES AND FIGURES Figure 1. Sample locations and catchment areas.................................................................................. 3 Table 1. Average composition of Rivers Nordurá, Vídidalsá and Vatnsdalsá ................................... 29 Table 2. Annual river fluxes of Rivers Nordurá, Vídidalsá and Vatnsdalsá ...................................... 30 Table 3a. Results of samples collected in 2004-2005 in a time sequence.......................................... 31 Table 3b. Results of samples collected in 2004-2005 in a time sequence.......................................... 32 Figure 2. Discharge of River Nordurá at Stekkur for 2004 and 2005 ................................................ 33 Table 4. Chemical composition, discharge and suspended matter in River Nordurá 2004-05........... 34 Figure 3. Concentration versus discharge correlations in River Nordurá 2004-05 ............................ 35 Figure 4. Rock derived concentration versus discharge correlations in River Nordurá 2004-05....... 36 Figure 5. Time series for River Nordurá for 2004-2005 .................................................................... 37 Figure 6. Time series for River Nordurá for 2004-2005 .................................................................... 38 Figure 7. Discharge of River Vídidalsá at Kolugil for 2004 and 2005 .............................................. 39 Table 5. Chemical composition, discharge and suspended matter in River Vídidalsá 2004-05......... 40 Figure 8. Concentration versus discharge correlations in Vídidalsá 2004-05.................................... 41 Figure 9. Rock derived concentration versus discharge correlations in River Vídidalsá 2004-05..... 42 Figure 10. Time series for River Vídidalsá for 2004-2005 ................................................................ 43 Figure 11. Time series for River Vídidalsá for 2004-2005 ................................................................ 44 Figure 12. Discharge of River Vatnsdalsá at Forsaeludalur for 2004 and 2005................................. 45 Table 6. Chemical composition, discharge and suspended matter in River Vatnsdalsá 2004-05 ...... 46 Figure 13. Concentration versus discharge correlations in Vatnsdalsá 2004-05................................ 47 Figure 14. Rock derived concentration versus discharge correlations in River Vatnsdalsá 2004-05. 48 Figure 15. Time series for River Vatnsdalsá for 2004-2005.............................................................. 49 Figure 16. Time series for River Vatnsdalsá for 2004-2005.............................................................. 50 Table 7. Detection limits and relative errors between measurements ................................................ 51

3
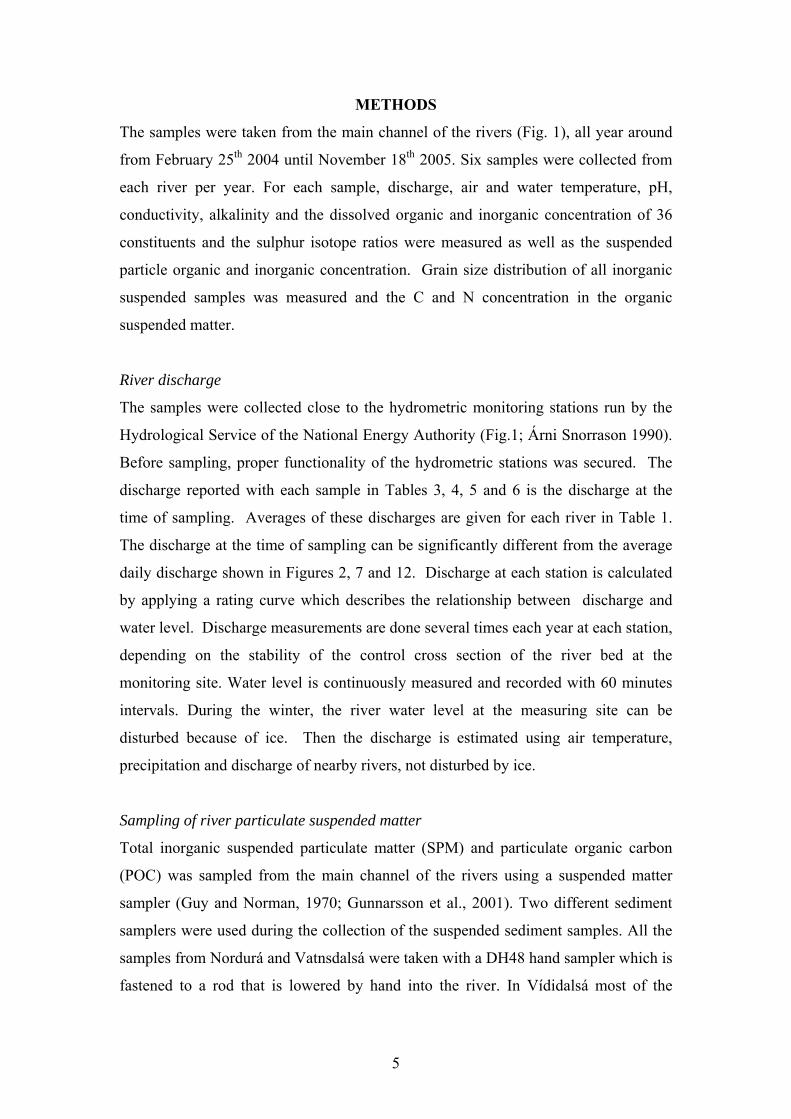
Figure 1. Sample locations and catchment areas.

4
INTRODUCTION
The objectives of this study are:
1. To define the discharge and concentration of dissolved and particulate matter
in the Rivers Vatnsdalsá at Forsaeludalur, Vídidalsá at Kolugil and Nordurá at
Stekkur in Borgarfjördur and to describe how discharge and concentration are
related and how they change during the year from February 25th 2004 until
November 18th 2005. The data make it possible to calculate average
concentration of river water of over 30 constituents, to calculate average
concentration of major dissolved elements in precipitation in the catchments,
rate of chemical and mechanical weathering of organic and inorganic matter in
the river catchments, and the fixation of atmospheric CO2 by chemical
weathering.
2. To calculate the annual fluxes of over 30 constituents based on data from the
three rivers from February 25th 2004 until November 18th.
3. To define second order power functions describing the riverine concentrations
as a function of discharge for the monitoring period.
4. To describe by figures the time sequences for selected constituents in the
rivers for the period February 25th 2004 until November 18th 2005.
Samples were taken at the following sample locations: (Fig. 1); Vatnsdalsá in
Forsaeludalur, Vídidalsá in Kolugil, and Nordurá at Stekkur. One sample was taken
at Litla-Skard, Borgarfjördur February 25th 2004 and another one from River Blanda,
February 26th 2004. The study was supported by the Ministry for the Environment
through AMSUM and the National Energy Authority, Natural Resources Division.
This study is a continuation of previous river monitoring studies in South, South-
eastern and Eastern Iceland conducted by the Science Institute and the Hydrological
Service of the National Energy Authority, Iceland (i.e. Sigurdur R. Gíslason et al.
2003; 2004).
This study is scientifically important because many variables are measured
simultaneously and emphasis will be on gaining fundamental understanding of natural
and man made processes controlling the chemical composition of the rivers (Gislason
et al. 1996; Gislason and Eiríksdóttir 2003; Oelkers et al. 2003; Gislason et al. 2006;
Gislason and Torssander 2006).
This report is a progress report, reporting methods and analytical results.
5
METHODS
The samples were taken from the main channel of the rivers (Fig. 1), all year around
from February 25th 2004 until November 18th 2005. Six samples were collected from
each river per year. For each sample, discharge, air and water temperature, pH,
conductivity, alkalinity and the dissolved organic and inorganic concentration of 36
constituents and the sulphur isotope ratios were measured as well as the suspended
particle organic and inorganic concentration. Grain size distribution of all inorganic
suspended samples was measured and the C and N concentration in the organic
suspended matter.
River discharge
The samples were collected close to the hydrometric monitoring stations run by the
Hydrological Service of the National Energy Authority (Fig.1; Árni Snorrason 1990).
Before sampling, proper functionality of the hydrometric stations was secured. The
discharge reported with each sample in Tables 3, 4, 5 and 6 is the discharge at the
time of sampling. Averages of these discharges are given for each river in Table 1.
The discharge at the time of sampling can be significantly different from the average
daily discharge shown in Figures 2, 7 and 12. Discharge at each station is calculated
by applying a rating curve which describes the relationship between discharge and
water level. Discharge measurements are done several times each year at each station,
depending on the stability of the control cross section of the river bed at the
monitoring site. Water level is continuously measured and recorded with 60 minutes
intervals. During the winter, the river water level at the measuring site can be
disturbed because of ice. Then the discharge is estimated using air temperature,
precipitation and discharge of nearby rivers, not disturbed by ice.
Sampling of river particulate suspended matter
Total inorganic suspended particulate matter (SPM) and particulate organic carbon
(POC) was sampled from the main channel of the rivers using a suspended matter
sampler (Guy and Norman, 1970; Gunnarsson et al., 2001). Two different sediment
samplers were used during the collection of the suspended sediment samples. All the
samples from Nordurá and Vatnsdalsá were taken with a DH48 hand sampler which is
fastened to a rod that is lowered by hand into the river. In Vídidalsá most of the
6
samples were taken with a S49 sampler which is attached to a winch and lowered into
and lifted up from the river at a constant rate.
All the suspended sediment samples were classified by their quality into three
categories, S1, S2, and S3. S1 samples are taken from several locations (usually 3–5)
on the river transect using the S49 sampler. These samples are considered to be the
best quality samples. S2 samples are taken from 1–2 locations on the river transect.
They are taken with the S49 sampler and are usually equal to S1 samples in quality,
especially when taken in high discharge rivers where turbulent flow occurs. S3
samples are always taken with the hand sampler, DH48, and are taken from either
riverbank in the greatest current if possible. These samples are of less quality than S1
and S2 samples as they do usually not reach the bottom where the greatest sediment
concentration is. S3 samples are thought to represent the finer sediment fraction
reasonably, but under represent the coarser sediment load. In occasional instances it is
possible to wade the rivers and collect a sample from several locations across the river
with the handheld rod sampler (DH48). These samples can be classified as S1 or S2
samples if they are thought to be equal in quality as samples taken with the S49
sampler.
The POC samples were always taken after several samples of inorganic
suspended particulate matter had been taken, using the same sampler. Thus it was
thoroughly cleaned by the river water. Glass bottles, cleaned with acid (1N HCl) and
deionised water, were used for the POC sampling. Before sampling for SPM and
POC, glass bottles were mounted in the sampler, and an integrated sample was taken
from the river surface to the bottom of the main channel of the river.
Sampling of river water
The river water samples were collected in a plastic bucket and poured into two 5 l
plastic containers. The bucket and container were rinsed several times with the river
water. The containers were filled completely before being closed. The air and water
temperature was measured by a thermistor (± 0.1 °C). The water samples were
filtrated immediately after sampling through 0.2 µm Millipore membranes (cellulose
acetate) with a peristaltic pump, silicone tubing and a 140 mm Sartorius filter holder
into low and high density polyethylene bottles and glass bottles. One l of sample
water was pumped through the filtration unit before the samples were collected and all
the air in the unit expelled through an air valve.

7
Samples for pH, alkalinity and conductivity measurements were filtrated into
60 ml and 275 ml amber glass bottles with specially designed taps to prevent air
bubbles in the bottles. Then in sequence; one litre sample for S isotopes; 190 ml and
two 90 ml bottles for anion and major and trace element analyses; one 100 ml bottle
for total dissolved N and P measurements; one 30 ml for dissolved organic carbon
measurements and finally four 20 ml bottles for dissolved PO4, NO3, NO2, NH4. All
bottles except those for pH, alkalinity, conductivity, sulphur isotopes and anion
measurements were washed in acid (1 N HCl) and deionised water prior to sampling.
All bottles were rinsed 3 times with the filtrated river water prior to collection.
Sample for major and trace element analyses were acidified by 1 ml of concentrated
suprapure HNO3 (1/90), DOC by 0.1 ml of 1.2 M HCl (0.1/30), and NH4 and PO4 by
1 ml of 0.1 M H2SO4 (1/20). To prevent any organic growth or decay, samples for the
determination of nutrients were refrigerated (-18 ˚C) within hours after collection and
kept frozen until analysed. Alkalinity, conductivity and pH were determined 1 to 5
days after sampling. These samples were kept in the refrigerator until analysed.
Alkalinity was determined by Gran titration (Stumm and Morgan 1996).
Analytical methods for suspended particulate constituents
Total suspended particulate matter (SPM) concentration, the grain size distribution of
the particulates and total dissolved solids (TDSmeas) were measured at the
Hydrological Service of the National Energy Authority (Svanur Pálsson and
Gudmundur Vigfússon, 1996; 2000). Before grain size analysis the organic fraction
of the suspended sediment was removed by boiling the sample in hydrogen peroxide
(H2O2). The grain size was subsequently analyzed using a combination of sediment
settling method (for fraction finer than <63µm) and sieving (for material coarser than
63µm). Total suspended inorganic sediment concentration (mg/l) was then calculated
based on the results from the grain size analysis.
After each expedition, each particulate organic carbon sample (POC) was weighed,
and all of it filtered through 0.7 µm glass filter (Whatman GF/F). The filters and
filtrate were dried at 50°C overnight, and placed in aluminium folders before analysis.
The glass filters and aluminium folders were ‘precombusted’ for four hours at 450°C
before sample preparation. Filter holders were washed in 1N HCl before filtration.
Analyses of particulate carbon and nitrogen on glass-fibre filters were performed at
Umeå Marine Sciences Center, Sweden with a Carlo Erba model 11081 high

8
temperature combustion elemental analyser, using standard procedures and a
combustion temperature of 1030°C. Acetanilide was utilized for standardization, and
results were corrected for blank filter carbon content.
Analytical methods for dissolved constituents
The dissolved major and trace elements were measured in 4 laboratories: Science
Institute, University of Iceland (SI); Analytica-SGAB Luleå, Sweden; Umeå Marine
Sciences Center, Sweden and Stockholm University, Sweden. The analytical results,
based on replicated analyses of the water samples in the various laboratories, were
well within 10%. The average charge balances of major elements were less than 2%.
The concentrations of dissolved nutrients (NO3, NO2, NH4 and PO4) and total
dissolved P and N were determined colourimetrically with an Alpkem autoanalyser.
Total dissolved P was also measured by ICP from the acidified 90 ml sample
(concentrated suprapure HNO3). DON was calculated by the difference between the
sum of dissolved inorganic NO3, NO2 and NH4 and total dissolved N. The
colorimetric measurement of total dissolved N and P were performed after 20 ml of
the samples had been radiated in silica test tubes for two hours with UV-light. Twenty
ml of concentrated hydrogen peroxide were added to the samples before radiation.
Total dissolved N was then measured after the radiation as NO3 concentration, and
total dissolved P as PO4 concentration. DOP was calculated by the difference
between the dissolved PO4 and total dissolved P. The concentration of DOP was most
often close to the detection limits of both methods. Thus the uncertainty of the
concentration is considerably higher than 10%. The total P and DOP concentrations
in this report are based on the total dissolved P measured by the inductively coupled
plasma (ICP) as described below. Concentrations of DOC were measured using a
Shimadzu TOC-5000 high temperature catalytic oxidation instrument. Samples were
acidified and sparged prior to analysis. Calculation of carbon concentrations was
made with potassium hydrogen phthalate as standard substance.
The Cl, F and SO4 measurements were done with a Dionex – High Pressure
Liquid Chromatograph. The major elements (Na, Ca, Mg, etc.) were determined by
inductively coupled plasma atomic emission spectrometry (ICP-AES) together with
minor and trace elements present in relatively high concentrations. Trace elements in
low concentrations were determined by inductively coupled plasma sector mass
spectrometry (ICP-SMS), sometimes referred to as high resolution ICP-MS. The

9
choice of which ICP technique to use for which element in a specific sample
depended on the concentration of the elements. Concentration of K which was below
the detection limits of the ICP-AES was measured by atomic adsorption (AA) and
mercury by atomic fluorescence spectrometry (AFS).
Dissolved sulphate was converted to BaSO4 for sulphur isotopic analyses (e.g.
Torssander, 1986; Torssander and Mörth 1998). The BaSO4 was mixed with an equal
amount of V2O5 and reacted in an online EA converting the BaSO4 to SO2(g), which
was then analysed in a CF-SIRMS (Finnigan Delta+). The sulphur isotope
composition was defined as a deviation in ‰ of the ratio 34S/32S between a sample
and a standard, expressed in the conventional δ34S notation relative to Cañon Diablo
Troilite (CDT). The accuracy of the measurements based on standard measurements
was better than ± 0.2 ‰ for all samples.
Flux calculations
Annual river fluxes, F, were calculated according to equation (1) according to the
Oslo and Paris Commissions, 1995: Implementation of the Joint Assessment and
Monitoring Programme, Appendix 2, Principles of the Comprehensive Study on
Riverine Inputs, page 22 to 27:
Where:
• Ci is the concentration of suspended or dissolved constituents in sample i
(mg/kg).
• Qi is the discharge at the time of sampling (m3/sek).
• Qr is the long term average discharge of the river of interest (m3/sek).
• n is the number of samples collected during the research period.
n Qr Σ (Ci Qi) i=1 F = ⎯⎯⎯⎯⎯⎯⎯ (1) n Σ Qi i=1
10
RESULTS
The results for Rivers Vatnsdalsá, Vídidalsá and Nordurá are reported below and the
quality of the results assessed.
Sampling and analytical results
The results from the various measurements are shown in Table 1 and Tables 3 to 6.
Calculated fluxes according to equation 1 are shown in Table 2. Detection limits and
precision of the various measurements are shown in Table 7.
The average of all measurements for each river for 2004 and 2005 is shown in
Table 1. The World average for unpolluted rives is shown for comparison in Table 1
(Meybeck 1979, 1982; Martin and Meybeck, 1979; Martin and Withfield, 1983).
Calculated fluxes according to equation 1 are shown in Table 2. These two tables
underscore the difference between the three rivers.
Tables 3a and 3b report the results in the sampling sequence. This aids in tracing
possible mistake during sampling, by comparing results between individual
expeditions. Systematic difference between individual expeditions indicates mistakes
during sampling. Results for individual rivers are reported in Tables 4, 5 and 6 were
variations within the years are underscored. Detection limits and precision of the
various methods are given in Table 7.
Vanadium, V, is included in the flux of heavy metals in Table 2. Vanadium is lighter
than iron, Fe, and the concentration of vanadium is relatively high. Including
vanadium in the heavy metal flux increases the flux, compared to previous heavy
metal flux calculations (S. R. Gíslason et. al. 2003). Chemical analysis of vanadium
was initiated in 2004 because it is an important metal in enzymes involved in bacterial
fixation of nitrogen in river waters (Gislason and Eiríksdóttir 2004).
The sample temperature at the time of pH and conductivity measurements is given in
Tables 3 to 6, since pH and conductivity are temperature dependent. Concentration of
dissolved major elements is given in mmol/l, but trace elements in µmol/l or nmol/l.
Alkalinity, abbreviated as Alk in Tables 1, and 3 to 6 is given in milliequvalent per kg
of water (meq/kg). Total dissolved inorganic carbon, DIC, is given as mmol/kg in
Tables 1, and 3-6. DIC is calculated according to equation 2 using the measured
alkalinity, total dissolved silica, pH and the sample temperature at which the pH
measurement was done. This temperature is used to define the value of the

11
temperature dependent dissociation constants in the equation. Activity as assumed to
be equal to molality (mol/kg) in the calculations.
( )⎟⎟⎟
⎠
⎞
⎜⎜⎜
⎝
⎛
⎟⎟⎠
⎞⎜⎜⎝
⎛+++⎟⎟
⎠
⎞⎜⎜⎝
⎛++
⎟⎟⎟⎟⎟
⎠
⎞
⎜⎜⎜⎜⎜
⎝
⎛
+
⎟⎟⎠
⎞⎜⎜⎝
⎛+
−−
=−
−−−
−
−
−−−
1
221
21
2
1
11010210
110
1011010
1000
KKKK
K
K
SiKAlk
DICpHpH
pH
pH
pH
Si
pHT
pHw
(2)
K1 is temperature dependent dissociation constant for carbonic acid (Plummer and
Busenberg 1982), K2 is temperature dependent dissociation constant for
bicarbonate (Plummer and Busenberg 1982), KSi is temperature dependent
dissociation constant for the monomeric uncharged silica species (Stefán Arnórsson
et al. 1982), Kw is temperature dependent dissociation constant for water (Sweeton
et al. 1974) and SiT is the measured total concentration of dissolved silica (Tables
1, 3, 4, 5 and 6). All concentrations are in mol/kg except alkalinity which is in
eq/kg. Equation 2 is adequate as long as the pH of the river waters are lower than 9
and total dissolved solids (TDS) are less than about 100 mg/kg. At higher
concentration and higher pH computer codes such as PHREEQC (Parkhurst and
Appelo 1999) should be used.
Total dissolved solids (TDScalculated) are the total sum of the concentrations (mg/l)
of the major elements according to equation 3;
TDScalculated = Na +K + Ca + Mg + SiO2 + Cl + SO4 +CO3 (3)
Total dissolved inorganic carbon (DIC) given in mmol/l in Tables 1, 3, 4, 5 and 6 is
cast in terms of mg CO3/l in equation 3. This is done to be consistent with measured
total dissolved solids, TDSmeas. Total dissolved solids are measured by weighing the
evaporate residue of the water that passed through the 0.45 µm filter, after the
suspended matter measurements as described previously. The pH of the samples
increases during evaporation, most of the dissolved inorganic carbon is transferred to
carbonate and precipitated as calcite (CaCO3) and finally at very high concentration as
12
trona (Na2CO3NaHHCO3). Before trona precipitates at the end of evaporation some
CO2 is lost by degassing (Eugster 1970; Jones et al. 1977; Hardy and Eugster 1970).
Because of this loss, TDSmeas concentration is most often lower than the calculated
total dissolved solid concentration, TDScalc.
The concentration of total suspended matter, TSM, is given in mg/l.
The detection limits and precision of analytical methods are given in Table 7. When
the concentration of dissolved constituents is below the detection limits, the
concentration is reported as lower than (<) the detection limit given in Table 7. These
values are included in average concentration and flux values in Tables 1, 2 and 3 to 6.
The detection limit value is used, but the average is reported as lower than (<) the
calculated average value including the detection limit value.
All samples measured at the Science Institute are measured at least twice. Average
relative errors between measurements are given in Table 7. The relative error varies
from one measurement to another, as it varies with the concentration. The relative
error is higher close to the detection limits of the methods than at much higher
concentrations. The concentrations of the nutrients, PO4, NO3, NO2, NH4, Ptot, and Ntot
are close to the detection limits of the methods. Thus, the relative error is variable
and often higher than 10% and especially for the Ptot, and Ntot and the Ptot, and Ntot
derived concentrations; DOP and DON, as these concentrations are close to the
detection limits of the analytical methods and the preparation of the samples involves
transfer between the various sample vials and radiation before analysis.
Charge balance and the relative error of the charge balance
The quality of the chemical analysis of the charged dissolved major elements can be
assessed by the charge balance. If measurements are in error, or some major
dissolved charged species is missing the + and – charges will not balance. The
difference between the + and – charges and the relative charge balance error is given
in Tables 3 to 6. The charge balance is calculated according to equation 4:
Charge bal. = Cations – Anions = Na + K + 2 Ca + 2 Mg - Alk - Cl - 2 SO4 - F (4).

13
The relative error of the charge balance is calculated by equation 5:
anionscationsebalChebalCh+
=.arg100%arg (5)
Equation 5 is a bit different from what has been used in previous river monitoring
reports. The denominator in eq. 5 used to be ((cations + anions)/2), but now the sum
of major cations and anions are used rather than the average of the two. Thus the
present chargebal% is lower than the previous one reported by the Science Institute.
This was changed be more consistent with speciation computer codes like PREEQC
(Parkhurst and Appelo 1999). The average percent charge balance is less than 2%
highlighting the good quality of the measurements of the major dissolved elements.
Average composition of the rivers
The average composition of the Nordurá, Vídidalsá and Vatnsdalsá rivers are shown
in Table 1. The concentrations and alkalinity of Vatnsdalsá and Vídidalsá are
relatively high. Especially in Si, K, Ca, Mg, Fe and dissolved organic carbon (DOC)
and dissolved organic nitrogen (DON). Perhaps reflection extensive wetland areas in
the two catchments. But these two rivers are low in Al concentration compared to
other rivers in Iceland. The Nordurá River has the same average TDS as was
measured in the river in 1973-1974 (Gislason et al. 1996). However the Cl
concentration in River Nordurá has increased significantly as is the case for some
other rivers in West Iceland.
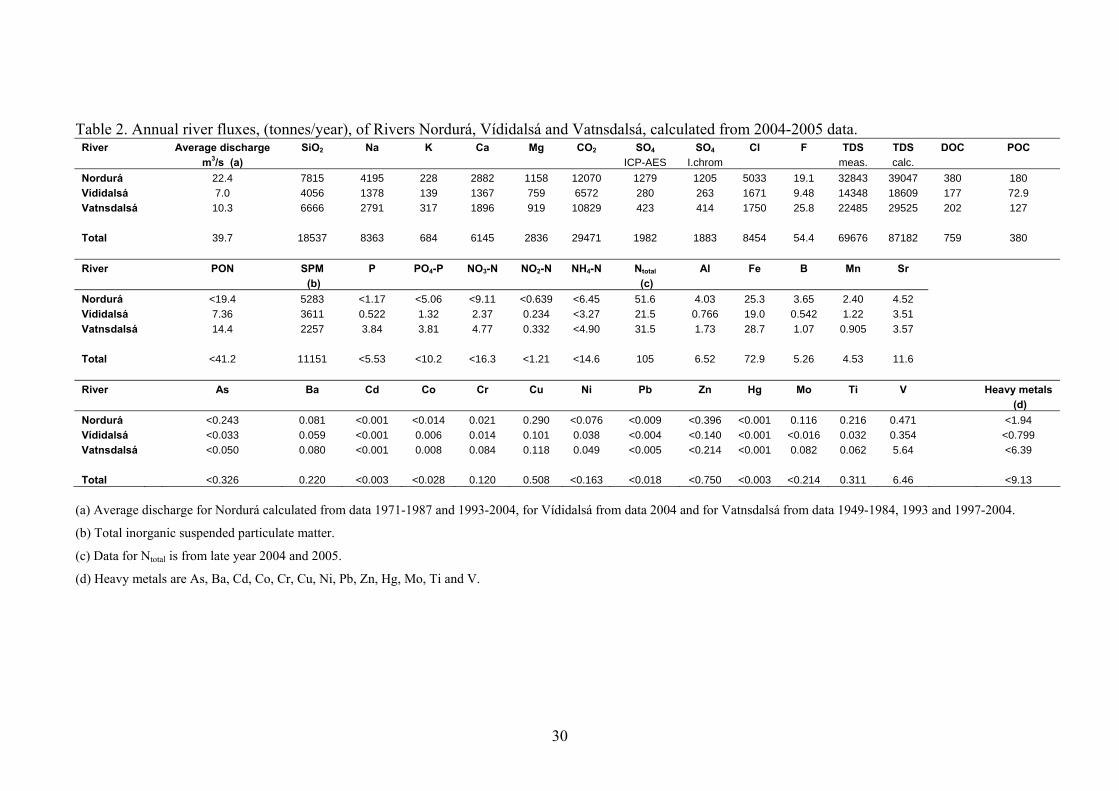
River fluxes in North-Western Iceland
Annual river fluxes calculated according to equation 2 is shown in Table 2.
Calculations use data from 2004 and 2005. As discussed earlier, fluxes are given as
lower than the calculated one (<) if a sample for that particular element has once or
more often been measured below the detection limits of the analytical methods.
Suspended and dissolved matter fluxes are calculated by the same method (eq.1). The
fluxes results from air borne dissolved and particulate matter to the catchments, they
are caused by chemical and mechanical weathering and denudation, because of decay
of organic matter and human disturbances.

14
Dissolved sulphur is measured by two methods, inductively coupled argon plasma
emission spectrograpy (ICP-AES) and a Dionex – High Pressure Liquid
Chromatograph.
The ICP-AES measured total dissolved sulphur Stot, but the chromatograph measures
the concentration of the dominating sulphur species, sulphate (SO4--). As can be seen
in Tables 3-6, the concentrations are within uncertainty the same (“%) demonstrating
that virtually all the dissolved sulphur to be on the form of sulphate (SO4--). Both Stot
and SO4-- fluxes are given in Table 2 and they are about the same.
Nordurá at Stekkur
The results for the Nordurá River are shown in Table 4. There are 6 samples for each
year. In 2004 there is one winter sample taken 25th of February, one fall sample;
October 21st the rest of the samples were colleted in May, July, August and
September. In 2005 there were three winter samples taken in February, October and
November, the rest of the samples were collected in May, June and August.
Discharge varied by factor of 7, from 6.5 m3/s, July 5th 2004 to 45.3 m3/s 3rd of
October 2005. The water temperature during sampling in February 2004 and 2005
was 0 and –0.2°C. The river discharge and chemistry of these samples are more
uncertain than the rest because of ice frustules formation and chemical fractionation
during partial freezing of water. The average pH was 7.49 and it was highest in the
summer samples both years. The average conductivity of the river waters was 68
µS/cm, similar to Ölfusá in South Iceland and Jökulsá á Dal at Hardarhagi in Eastern
Iceland. The average Si concentration was 0.189 mmol/l, higher than all rivers in
Eastern Iceland, excluding river Jökulsá á Fjöllum. All rivers in south Iceland are
higher in average Si concentration except River Sog, which is similar, 0.180 µmol/l.
The concentrations of the major cations reflect both the concentrations derived from
weathering and the seawater component in precipitation. All rivers in south Iceland
are higher in average Na concentration than river Nordurá; 0.266 mmol/l. In East
Iceland all rivers but Jökulsá á Fjöllum are lower than river Nordurá in Na average
concentration. This is reverse for Ca and Mg, all rivers in South Iceland except rivers
Ytri-Rangá and Thjórsá are lower in average Ca and Mg concentrations than River
Nordurá; 0.105 and 0.07 mol/l respectively; but in East Iceland all but Fellsá and
Fjardará are higher in Ca, but only Jökulsá á Fjöllum and Jökulsá í Fljótsdal are
higher in Mg average concentration than Nordurá. Alkalinity indicates the amount of

15
weathering that the river waters have caused. The average alkalinity of Nordurá;
0.370 meq/kg, is lower than all the rivers in South Iceland with the exception of
Brúará at Efstidalur. All the rivers in Eastern Iceland except Fellsá and Fjardará are
higher in alkalinity then the Nordurá River. The concentration of dissolved sulphur
reflects the concentrations derived from weathering, and the seawater and
anthropogenic component in precipitation (Gislason and Torssander 2006). The
average sulphate concentrations using ICP and ion chromatograph are the same; 0.019
mmol/l (Table 4). Indicating that essentially all the river dissolved sulphur is on the
sulphate form (SO42-). The average concentration is lower than the average sulphur
concentration of all the rivers in South Iceland with the exception of Brúará at
Efstidalur; 0.017 mmol/l and river Tungufljót at Faxi; 0.015 mmol/l. In eastern
Iceland it is just Fellsá and Fjardará that are lower in dissolved sulphur. The
dissolved sulphur isotope ratio of Nordurá; δ34S (‰) is the second heaviest Icelandic
river water ratio measured so far; 12.3 ‰. The heaviest river sulphate isotope ratio is
in Vídidalsá; 14.8 ‰ Precipitation on the Langökull glacier range from 13 to 18 ‰
δ34S, the rock component is around 0 ‰ and the anthropogenic component around 5
‰ (Gislason and Torssander 2006). The average concentration of Cl is high in
Nordurá; 0.205 mmol/kg. Average Cl for Nordurá at Stekkur for the years 1973-1972
(average of 17 samples) was 0.189 mmol/l (Gislason et al. 1996), about 8% decline in
average Cl concentration. The present Cl concentration of Nordurá is higher than the
Cl concentration of all rivers in East Iceland and higher than all but river Ytri-Rangá
in South Iceland. The average F concentration in Nordurá is lower than the F
concentration in all the rivers in south Iceland and it is lower than all the rivers in East
Iceland with the exception of Fellsá and Fjardará. The percent average charge balance
is 0.8% which is excellent, reflecting the high quality of the major element analysis.
Average calculated TDS for the years 2004 to 2005 was 57 mg/kg. Average
calculated TDS for Nordurá at Stekkur for the years 1973-1972 (average of 17
samples) was 58 mg/l (Gislason et al. 1996). Average dissolved organic carbon
(DOC) is low like in all Icelandic rivers, 0.037. This is higher than all the rivers in
eastern Iceland, and higher than all but Ölfusá and Thjórsá at Sandafell in South
Iceland. Particle organic carbon (POC) concentration of Nordurá; 175 µmol/kg, is
lower than the POC concentrations of all the rivers in Eastern Iceland, and all but
river Ytri-Rangá in South Iceland. The C/N particulate mol ratio of river Nordurá,
9.29 is the lowest average river ratio measured so far in Iceland, close to the 6.6.

16
Redfield ratio of organic particulates derived from algae. Terrestrial plants and soils
have much higher ratio. The average total suspended inorganic particulate
concentration (TSM) was 6 mg/kg, lower than the TSM of all the rivers in Eastern
Iceland and South Iceland. River Sog in South Iceland is closest, with 7.7 mg/kg.
There is a discrepancy in the average total dissolved phosphorous concentration; <
0.050 µmol/l, reported in Table 4 measured by ICP and the average PO4
concentration; <0.260 µmol/l, measured by the Alpkem Auto analyser in Table 4.
Because of this discrepancy, the calculated DOP is negative. The average PO4
concentration for Nordurá at Stekkur for the years 1973-1972 (average of 17 samples)
was 0.1 µmol/l (Gislason et al. 1996). The average inorganic dissolved nitrogen
nutrient concentrations, NO3, NO2 and NH4 for the Nordurá River was 1.15, 0.08 and
0.8 µmol/l respectively (Table 4). The NO3 concentration is about two times lower
than the average concentration for 1973-1974, the NO2 concentration is about similar,
but NH4 about 3.5 times lower than the one of 1973-1974 (Gislason et al. 1996). The
total dissolved nitrogen (Ntotal) analysis for the first 4 samples in 2004 are not included
in Table 4. The hydrogen peroxide used for the analysis turned out to be
contaminated. The average calculated dissolved organic nitrogen for the rest of the
samples; DON (DON=Ntot- NO3-NO2-NH4) is 3.1 µmol/kg, higher than the DON in
all the rivers in East and South Iceland. The average Al concentration of Nordurá
River is lower than the one in all the rivers in South and East Iceland with the
exception of rivers Fellsá and Fjardará. Conversely, the Fe concentration in River
Nordurá is higher than all the rivers in the East and South Iceland except rivers Ölfusá
and Ytri-Rangá in South Iceland.
Concentration versus discharge correlations in River Nordurá at Stekkur
After the discharge picture, and table for each river, there are two pages of diagrams
depicting the relationship between concentration of selected constituents and
discharge similar. This is similar to previous river monitoring reports (e.g. Sigurdur
R. Gíslason et al. 2003; 2004). All the data is fitted by a second order power function.
The functions and regression coefficients are superimposed on the diagrams on river.
The concentration of selected constituents and discharge at the time of sampling is
shown on the left hand side. But shown on the right hand side are the rock derived
concentrations versus discharge. The concentration of Na, K, Ca, Mg and SO4 is
corrected for the average composition of precipitation in the catchments. Most of the
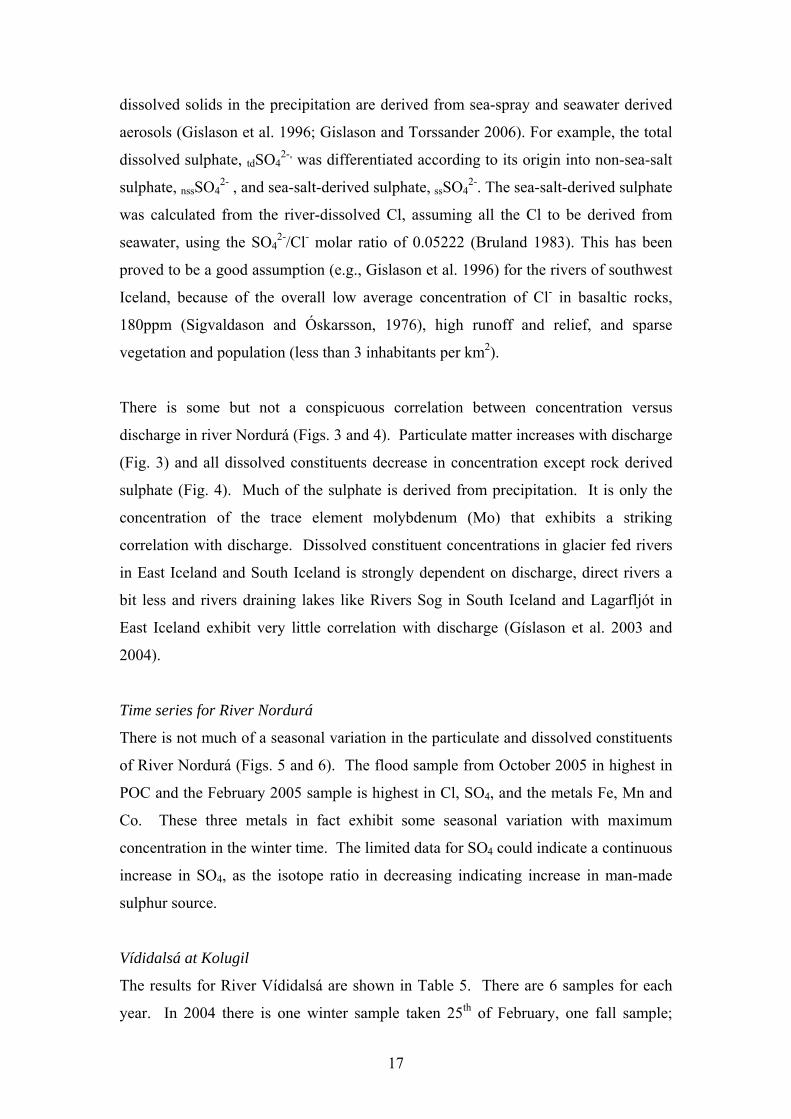
17
dissolved solids in the precipitation are derived from sea-spray and seawater derived
aerosols (Gislason et al. 1996; Gislason and Torssander 2006). For example, the total
dissolved sulphate, tdSO42-, was differentiated according to its origin into non-sea-salt
sulphate, nssSO42- , and sea-salt-derived sulphate, ssSO4
2-. The sea-salt-derived sulphate
was calculated from the river-dissolved Cl, assuming all the Cl to be derived from
seawater, using the SO42-/Cl- molar ratio of 0.05222 (Bruland 1983). This has been
proved to be a good assumption (e.g., Gislason et al. 1996) for the rivers of southwest
Iceland, because of the overall low average concentration of Cl- in basaltic rocks,
180ppm (Sigvaldason and Óskarsson, 1976), high runoff and relief, and sparse
vegetation and population (less than 3 inhabitants per km2).
There is some but not a conspicuous correlation between concentration versus
discharge in river Nordurá (Figs. 3 and 4). Particulate matter increases with discharge
(Fig. 3) and all dissolved constituents decrease in concentration except rock derived
sulphate (Fig. 4). Much of the sulphate is derived from precipitation. It is only the
concentration of the trace element molybdenum (Mo) that exhibits a striking
correlation with discharge. Dissolved constituent concentrations in glacier fed rivers
in East Iceland and South Iceland is strongly dependent on discharge, direct rivers a
bit less and rivers draining lakes like Rivers Sog in South Iceland and Lagarfljót in
East Iceland exhibit very little correlation with discharge (Gíslason et al. 2003 and
2004).
Time series for River Nordurá
There is not much of a seasonal variation in the particulate and dissolved constituents
of River Nordurá (Figs. 5 and 6). The flood sample from October 2005 in highest in
POC and the February 2005 sample is highest in Cl, SO4, and the metals Fe, Mn and
Co. These three metals in fact exhibit some seasonal variation with maximum
concentration in the winter time. The limited data for SO4 could indicate a continuous
increase in SO4, as the isotope ratio in decreasing indicating increase in man-made
sulphur source.
Vídidalsá at Kolugil
The results for River Vídidalsá are shown in Table 5. There are 6 samples for each
year. In 2004 there is one winter sample taken 25th of February, one fall sample;

18
October 21st, the rest of the samples were collected in May, July, August and
September. In 2005 there were three winter samples taken in February, October and
November, the rest of the samples were collected in May, June and August.
Discharge varied by factor of 5, from 2.6 m3/s, September 15th 2004 to 12.8 m3/s 3rd
of October 2005. The water temperature during sampling in February 2004 and 2005
was 0 and –0.1°C. The river discharge and chemistry of these samples are more
uncertain than the rest because of ice frustules formation and chemical fractionation
during partial freezing of water. The average pH was 7.74 and it was highest in the
summer samples both years. The average conductivity of the river waters was 92.3
µS/cm, higher than all but Jökulsá á Fjöllum in East Iceland, and all but Ytri – Rangá
in south Iceland. The average Si concentration was 0.303 mmol/l, higher than all
rivers in Eastern Iceland, and all but the Ytri-Rangá River in south Iceland. The
concentrations of the major cations reflect both the concentrations derived from
weathering and the seawater component in precipitation. All rivers in South Iceland
are higher in average Na concentration than River Vídidalsá; 0.270 mmol/l. In East
Iceland all rivers but Jökulsá á Fjöllum are lower than River Vídidalsá in Na average
concentration. This is reverse for Ca and Mg. All rivers in South Iceland except rivers
Ytri-Rangá are lower in average Ca, Mg and K concentrations than River Vídidalsá;
0.154, 0.139 and 0.016 mmol/l respectively. In East Iceland it is only River Jökulsá í
Fljótsdal that is higher in average Ca concentration than Vídidalsá. Alkalinity
indicates the amount of weathering that the river waters have caused. The average
alkalinity of Vídidalsá river; 0.644 meq/kg, is higher than all the rivers in South
Iceland with the exception of River Ytri - Rangá. All the rivers in Eastern Iceland
except the rivers Jökulsá á Fjöllum and Jökulsá í Fljótsdal are lower in alkalinity than
the Vídidalsá River. The concentration of dissolved sulphur reflects the
concentrations derived from weathering, and the seawater and anthropogenic
component in precipitation (Gislason and Torssander 2006). The average sulphate
concentrations using ICP; 0.013 mmol/l, and ion chromatograph, 0.012 mmol/l are
nearly the same (Table 5). Indicating that essentially all the river dissolved sulphur is
on the sulphate form (SO42-). The average concentration is lower than the average
sulphur concentration of all the rivers in South Iceland. In eastern Iceland it is just
Fellsá and Fjardará that are lower in dissolved sulphur, 0.007 and 0.011 mmol/l,
respectively. The dissolved sulphur isotope ratio of Vídidalsá; δ34S (‰) is the
heaviest Icelandic river water ratio measured so far; 14.8 ‰. The samples from the

19
year 2005 are left to be measured (Table 5). The heaviest river sulphate isotope ratio
is in Vídidalsá; 14.8 ‰. Precipitation on the Langökull glacier range from 13 to 18
‰ δ34S, the sulphate rock component is around 0 ‰ and the anthropogenic
component around 5 ‰ (Gislason and Torssander 2006). This high sulphate isotope
ratio precludes that oxidation of iron sulphates is the cause of the relatively high
concentration of Ca and Mg in this river. The average concentration of Cl is high in
Vídidalsá; 0.209 mmol/kg. This is similar to the Cl concentration of Nordurá River in
West Iceland, higher than the Cl concentration of all rivers in East Iceland and higher
than all but river Ytri-Rangá in South Iceland. The average F concentration of
Vídidalsá, 2.37 µmol/l, is lower than the F concentration in all the rivers in South
Iceland and it is lower than all the rivers in East Iceland with the exception of rivers
Grímsá, Fellsá and Fjardará. The percent average charge balance is 1.6% which is
higher than the one for river Nordurá, 0.8%. The highest one is for sample 04N007,
8.1% and the charge balance is negative, indicating that the concentration of negative
charges is too high or the concentration of cations are to low (eq. 4). It is most likely
that alkalinity of this sample is too high although it is not a striking outlier on a plot of
alkalinity vs. conductivity. Average calculated TDScalc for river Vídidalsá for the
years 2004 to 2005 was 84 mg/kg. Average dissolved organic carbon (DOC) is low
like in all Icelandic rivers, 0.062 mmol/l. However, this is higher than all the rivers in
East Iceland, and higher than all but River Ölfusá (0.065 mmol/l) in South Iceland.
Average particle organic carbon (POC) concentration of Vídidalsá; 257 µmol/kg, is
higher than the POC concentrations of the rivers in East Iceland, except Jökulsá á Dal,
Jökulsá í Fljótsdal and Lagarfljót and all but Rivers Sog, Brúará , Ölfusá and Ytri-
Rangá in South Iceland. The average C/N particulate mol ratio is low, 10.6 (Table 5).
It is close to the 6.6 Redfield mol ratio of organic particulates derived from algae.
Terrestrial plants and soils have much higher ratio. This indicates that most of the
organic particles in this river stem from algae. The average total suspended inorganic
particulate concentration (TSM) was 14 mg/kg, slightly higher than the TSM of rivers
Fellsá (10 mg/kg), Grímsá (10 mg/kg), and Fjardará (8 mg/kg), in East Iceland. River
Sog, 7.7 mg/kg, is the only river in South Iceland that is lower in TDM than river
Vídidalsá. There is a discrepancy in the average total dissolved phosphorous
concentration; 0.074 µmol/l, reported in Table 5 measured by ICP and the average
PO4 concentration; <0.205 µmol/l, measured by the Alpkem Auto analyser (Table 5).
Because of this discrepancy, the calculated DOP is negative. The average inorganic

20
dissolved nitrogen nutrient concentrations, NO3, NO2 and NH4 for the Vídidalsá River
was 0.797, 0.083 and 1.36 µmol/l respectively (Table 5). The total dissolved nitrogen
(Ntotal) analysis for the first 4 samples in 2004 are not included in Table 5. The
hydrogen peroxide used for the analysis turned out to be contaminated. The average
calculated dissolved organic nitrogen for the rest of the samples; DON (DON=Ntot-
NO3-NO2-NH4) is 4.1 µmol/kg, higher than the DON in all the rivers in East, South
and west Iceland. The average Al concentration of Vídidalsá River (0.129 µmol/l) is
lower than the one in all the rivers in South, East and West Iceland. Conversely, the
Fe concentration in River Vídidalsá is higher than all the rivers in the East and South
Iceland.
Concentration versus discharge correlations in River Vídidalsá
There is some correlation between concentration of particulate and dissolved
constituents versus discharge in river Vídidalsá (Figs. 8 and 9). Particulate matter
concentration, organic and inorganic increases with discharge (Fig. 8). Dissolved Na,
K, Mg, Si, Cl and SO4 increases with discharge and Ca and alkalinity are not affected
by discharge in river Vídidalsá. This is very rare in Icelandic rivers. When seawater
contribution through precipitation is subtracted from the river water composition two
samples exhibit “negative concentration” of SO4 indicating that some Cl could be
derived from otter source than seawater. Molibdenum (Mo) exhibits beautiful
correlation with discharge, the concentration decreases with increasing river discharge
(Fig. 9).
Time series for River Vídidalsá
There is not much of a seasonal variation in the particulate and dissolved constituents
of River Vídidalsá (Figs. 10 and 11). The flood sample from October 2005 in highest
in POC. The manganese concentration is the only element in Figs. 10 and 11 that
shows seasonal variation, with maximum concentration in the winter time.
Vatnsdalsá at Forsaeludalur
The results for River Vatnsdalsá are shown in Table 6. Similar to rivers Nordurá and
Vídidalsá, there are 6 samples for each year. In 2004 there is one winter sample taken
25th of February, one fall sample; October 21st the rest of the samples were colleted in
May, July, August and September. In 2005 there were three winter samples taken in

21
February, October and November, the rest of the samples were collected in May, June
and August.
There was not much variation in discharge. It varied by factor of 5, from 2.6 m3/s,
September 15th 2004 to 12.8 m3/s 3rd of October 2005. The water temperature during
sampling in February 2004 and 2005 was 0 and –0.2°C. The river discharge and
chemistry of these samples are more uncertain than the rest because of ice frustules
formation and chemical fractionation during partial freezing of water. The average
pH was 7.82 and it was highest in the summer samples both years. The average
conductivity of the river waters was 96.8 µS/cm, higher than all but Jökulsá á Fjöllum
in East Iceland, and all but Ytri – Rangá in South Iceland. The average Si
concentration was 0.341 mmol/l, higher than all rivers in Eastern Iceland, and all but
the Ytri-Rangá River in South Iceland. The concentrations of the major cations
reflect both the concentrations derived from weathering and the seawater component
in precipitation. It is only Rivers Thjórsá and Ytri - Rangá in South Iceland are
higher in average Na concentration than River Vídidalsá; 0.377 mmol/l. In East
Iceland all rivers but Jökulsá á Fjöllum are lower than River Vatnsdalsá in average Na
concentration. All rivers in South Iceland except rivers Ytri-Rangá are lower in
average Ca, Mg and K concentrations than River Vatnsdalsá; 0.146, 0.139 and 0.025
mmol/l respectively. In East Iceland it is only Rives Jökulsá á Fjöllum and Jökulsá í
Fljótsdal that is higher in average Ca concentration than Vídidalsá. Alkalinity
indicates the amount of weathering that the river waters have caused. The average
alkalinity of Vatnsdalsá River, 0.733 meq/kg, is higher than all the rivers in South
Iceland with the exception of River Ytri - Rangá. All the rivers in Eastern Iceland
except the River Jökulsá á Fjöllum are lower in alkalinity than the Vatnsdalsá River.
The concentration of dissolved sulphur reflects the concentrations derived from
weathering, and the seawater and anthropogenic component in precipitation (Gislason
and Torssander 2006). The average sulphate concentrations using ICP; 0.013 mmol/l,
and ion chromatograph, 0.013 mmol/l are the same (Table 5). Essentially all the river
dissolved sulphur is on the sulphate form (SO42-). The average concentration is lower
than the average sulphur concentration of all the rivers in South Iceland. In eastern
Iceland it is just Fellsá and Fjardará that are lower in dissolved sulphur, 0.007 and
0.011 mmol/l respectively. The dissolved sulphur isotope ratio of Vatnsdalsá; δ34S
(‰) is relatively high; 11.1 ‰. It is just rivers Vídidalsá and Nordurá that have been
measured higher in Iceland. The samples from the year 2005 are left to be measured

22
(Table 5). The heaviest river sulphate isotope ratio is in Vídidalsá; 14.8 ‰.
Precipitation on the Langökull glacier range from 13 to 18 ‰ δ34S, the sulphate rock
component is around 0 ‰ and the anthropogenic component around 5 ‰ (Gislason
and Torssander 2006). This high sulphate isotope ratio precludes that oxidation of
iron sulphates is the cause of the relatively high concentration of Ca and Mg in this
river. The average concentration of Cl is 0.152 mmol/kg. This is lower than the
average Cl concentration of rivers Nordurá and Vídidalsá, higher than the Cl
concentration of all rivers in East Iceland and higher than all but rivers Sog, Ölfusá
and Ytri-Rangá in South Iceland. The average F concentration of Vatnsdalsá, 4.25
µmol/l, is lower than the F concentration in the rivers close to the volcanic zone in
South Iceland (Hvítá, Ölfusá, Thjórsá and Ytri-Rangá) and it is higher than all the
rivers in East Iceland with the exception of River Jökulsá á Fjöllum which drains the
volcanic zone. The percent average charge balance is 1.6% which is higher than the
one for river Nordurá, 0.8% but the same as the one for Vídidalsá (Tables 4 and 5).
The highest one is for sample 04N006, 5.8% and the charge balance is positive,
indicating that the concentration of negative charges is to low or the concentration of
cations are to high (eq. 4). It is most likely that alkalinity of this sample is too low. It
is a striking outlier on a plot of alkalinity vs. conductivity, with to low alkalinity.
Average calculated TDScalc for river Vatnsdalsá for the years 2004 to 2005 was 91
mg/kg. It is only rivers Jökulsá á Fjöllum (96 mg/kg) and Ytri – Rangá (177 mg/kg)
that are higher. Average dissolved organic carbon (DOC) is low like in all Icelandic
rivers, 0.051 mmol/l. However, this is higher than all the rivers in East Iceland, and
higher than all but Rivers Ölfusá (0.065 mmol/l) and Brúará (0.074 mmol/l) in South
Iceland. Average particle organic carbon (POC) concentration of Vatnsdalsá; 364
µmol/kg, is higher than the POC concentrations of the rivers in East Iceland, except
Jökulsá í Fljótsdal and Lagarfljót and all but Ölfusá in South Iceland. The average
C/N particulate mol ratio is low, 10.1 (Table 5). It is close to the 6.6 Redfield mol
ratio of organic particulates derived from algae. Terrestrial plants and soils have
much higher ratio. This indicates that most of the organic particles in this river stem
from algae. The average total suspended inorganic particulate concentration (TSM)
was 7 mg/kg, slightly lower than the TSM of rivers Fellsá (10 mg/kg), Grímsá (10
mg/kg), and Fjardará (8 mg/kg), in East Iceland. And River Sog, 7.7 mg/kg, in South
Iceland. There is a discrepancy in the average total dissolved phosphorous
concentration; 0.376 µmol/l, reported in Table 5 measured by ICP and the average

23
PO4 concentration; <0.386 µmol/l, measured by the Alpkem Auto analyser (Table 5).
Because of this discrepancy, the calculated DOP is negative. The average inorganic
dissolved nitrogen nutrient concentrations, NO3, NO2 and NH4 for the Vatnsdalsá
River was 1.06, 0.075 and 1.31 µmol/l respectively (Table 5). The total dissolved
nitrogen (Ntotal) analysis for the first 6 samples in 2004 are not included in Table 5.
The hydrogenperoxide used for the analysis turned out to be contaminated. The
average calculated dissolved organic nitrogen for the rest of the samples; DON
(DON=Ntotal - NO3-NO2-NH4) is 4.69 µmol/kg, higher than the DON in all the rivers
in East, South and west Iceland. The average Al concentration of Vatnsdalsá River
(0.200 µmol/l) is lower than the one in all the rivers in South and East Iceland with
the exception of the direct runoff rivers in the East Iceland; Fellsá, Grímsá and
Fjardará. Conversely, the Fe concentration in River Vatnsdalsá is higher than all the
rivers in the East and South Iceland.
Concentration versus discharge correlations in River Vatnsdalsá
There is some correlation between concentration of particulate and dissolved
constituents versus discharge in river Vatnsdalsá (Figs 13 and 14). Particulate matter
concentration, organic and inorganic increases with discharge (Fig. 13). Dissolved
Na, K, Alkalinity and Mo concentrations decreases with discharge. Conversely, Mg,
Ca, Si, Cl and SO4 increases with discharge in River Vídidalsá. This is very rare in
Icelandic rivers. As in Nordurá and Vídidalsá, molybdenum (Mo) exhibits beautiful
correlation with discharge, the concentration decreases with increasing river discharge
(Fig. 14)
Time series for River Vatnsdalsá
There is not much of a seasonal variation in the particulate and dissolved constituents
of River Vídidalsá (Figs. 15 and 16). The flood sample from October 2005 in highest
in POC. The manganese concentration is the only element in Figs. 15 and 16 that
shows seasonal variation, with maximum concentration in the winter time.

24
ACKNOWLEDGEMENTS
The study was supported by the Ministry for the Environment through AMSUM and
the National Energy Authority, Natural Resources Division. We are grateful to Helgi
Jensson, Gunnar Steinn Jónsson and Hákon Adalsteinsson for their support.
REFERENCES
Árni Snorrason 1990. Markmið og skipulag vatnamælinga á Íslandi. Í Vatnið og
landið, Guttormur Sigbjarnarson (ritstjóri). Vatnafræðiráðstefna, október
1987. Orkustofnun, Reykjavík, bls. 89-93.
Bruland, K. W. 1983. Trace elements in seawater. In Chemical Oceanography;
Riley, J. P., Chester, R., Eds.; Academic Press: London, 1983; Vol. 8, pp
157-220.
Eugster, H. P. 1970. Chemistry and origin of the brines of Lake Magadi, Kenya.
Mineral. Soc. Am. Spec. Paper 3, bls. 213-235.
Gislason S. R and Eiríksdóttir E. S. (2003). Molybdenum control of primary
production in the terrestrial environment. In: Water-Rock Interactions
(Wanty R. B. and Seal II R. R., eds.), 1119-1122. Taylor & Francis
Group, London.
Gislason S. R. and Torssander P. (2006). The response of Icelandic river sulfate
concentration and isotope composition, to the decline in global
atmospheric SO2 emission to the North Atlantic region. Environmental
Science and Technology, 40,680-686.
Gislason, S. R., Arnórsson, S., and Ármannsson, H. (1996). Chemical
weathering of basalt in SW Iceland: Effects of runoff, age of rocks and
vegetative/glacial cover. American Journal of Science, 296, pp. 837-907.
Gislason, S. R., Oelkers E. H. and Snorrason Á. (2006). The role of river
suspended material in the global carbon cycle. Geology 34, 49–52.
Gunnarsson, Á., Hardardóttir J., Jónsson P., Snorrason Á., Pálsson S. 2001.
Measurements of Discharge and Suspended Matter of Jökulsá á Dal in
2000. 14319 Orkustofnun, Vatnamaelingar OS-2001/078 24: Reykjavik
(in Icelandic).
25
Guy HP, Norman VW. 1970. Techniques of Water-Resources Investigations of
the United States Geological Survey. Field Methods for Measurement of
Fluvial Sediment 3 (C2). United States Government Printing Office:
Washington, DC; 59.
Hardy, L. A. and Eugster, H. P. 1970. The evolution of closed-basin brines.
Mineral. Soc. Am. Spec. Pub. 3, pp. 273-290.
Jones, B. F., Eugster H. P. and Rettig S. L. 1977. Hydrochemistry of the Lake
Magadi basin, Kenya. Geochim. Cosmochim. Acta, 41, pp. 53-72.
Martin, J.M., and Meybeck, M. 1979. Elemental mass-balance of material
carried by world major rivers: Marine Chemistry, V. 7, pp. 173 206.
Martin, J.M., and Whitfield, M. 1983. The significance of the river input of
chemical elements to the ocean, In Wong, S.S., ed., Trace Metals in
Seawater, Proceedings of the NATO Advanced Research Institute on
Trace Metals in Seawater, March 1981: Erice, Plenum Press, pp. 265-
296.
Meybeck, M. 1979. Concentrations des eaux fluviales en éléments majeours et
apports en solution aux océans: Rev. Geologie Dynamique et Geographie
Physique 21, pp. 215 246.
Meybeck, M. 1982. Carbon, nitrogen, and phosphorus transport by world rivers:
American Journal of Science 282, pp. 401-450.
Oelkers, E. H., Gislason S. R, Eiríksdóttir E. S, Elefsen S. O. and Hardardottir J.
2004. The significance of suspended material in the chemical transport in
rivers of NE Iceland. In Water-Rock Interactions (Wanty R. B. and Seal
II R. R., eds.), 865-868. Taylor & Francis Group, London.
Oslo and Paris Commissions 1995. Implementation of the Joint Assessment and
Monitoring Programme, 68 pp.
Parkhurst D.L, Appelo C.A.J. 1999. User's guide to PHREEQC (Version 2) – a
computer program for speciation, batch-reaction, one-dimensional
transport, and inverse geochemical calculations. Water resources
investigations report 99-4259. Lakewood: US Geological Survey.
Plummer, N.L., and Busenberg, E. 1982. The solubility of calcite, aragonite and
vaterite in CO2-H2O solutions between 0 and 90°C, and an evaluation of
the aqueous model for the system CaCO3-CO2-H2O: Geochimica et
Cosmochimica Acta 46, pp. 1011 1040.

26
Sigurður Reynir Gíslason , Árni Snorrason, Eydís Salome Eiríksdóttir, Bergur
Sigfússon, Sverrir Óskar Elefsen, Jórunn Harðardóttir, Ásgeir
Gunnarsson, og Peter Torssander, (2003). Efnasamsetning, rennsli og
aurburður straumvatna á Suðurlandi, VI. Gagnagrunnur
Raunvísindastofnunar og Orkustofnnunar. Raunvísindastofnun, RH-03-
2003, 85 bls.
Sigurður Reynir Gíslason , Árni Snorrason, Eydís Salome Eiríksdóttir, Bergur
Sigfússon, Sverrir Óskar Elefsen, Jórunn Harðardóttir, Ásgeir
Gunnarsson, Einar Örn Hreinsson, Peter Torssander, Níels Örn
Óskarsson og Eric Oelkers (2004). Efnasamsetning, rennsli og aurburður
straumvatna á Austurlandi, V. Gagnagrunnur Raunvísindastofnunar og
Orkustofnnunar. Raunvísindastofnun, RH-05-2004, 101 bls.
Sigvaldason, G. E. and Óskarsson, N. 1976. Chlorine in basalts from Iceland.
Geochim. Cosmochim. Acta , 40, 777-789.
Stefán Arnórsson, Sven Sigurðsson og Hörður Svavarsson 1982. The chemistry
of geothermal waters in Iceland. I. Calculation of aqueous speciation
from 0° to 370 °C: Geochimica et Cosmochimica Acta 46, bls. 1513-
1532.
Stumm, W. and Morgan, J. 1996. Aquatic Chemistry. Chemical Equilibria and
Rates in Natural Waters, 3rd ed. John Wiley & sons, New York, 1022
bls.
Svanur Pálsson og Guðmundur H. Vigfússon 1996. Gagnasafn
aurburðarmælinga 1963- 1995, Orkustofnun OS-96032/VOD-05 B, 270
bls.
Svanur Pálsson og Guðmundur H. Vigfússon 2000. Leiðbeiningar um mælingar
á svifaur og úrvinnslu gagna. Greinargerð, SvP-GHV-2000-2,
Orkustofnun, Reykjavík.
Sweewton R. H., Mesmer R. E. and Baes C. R. Jr. 1974. Acidity measurements
at elevated temperatures. VII. Dissociation of water. J. Soln. Chem. 3, nr.
3 pp. 191-214.
Torssander, Peter 1986. Origin of volcanic sulfur in Iceland. A Sulfur Isotope
Study. Published PhD thesis. Meddelanden från Stockholms Universitets
Geologiska Institution Nr. 268, Stokkhólmi, 164 pp.
27
Torssander, P. and Mörth, C.-M. 1998. Sulfur dynamics in the roof experiment
at Lake Gårdsjön deduced from sulfur and oxygen isotope ratios in
sulfate. In Experimental Reversal of Acid Rain Effects: The Gårdsjön
Roof Project; Hultberg, H., Skeffington, R., Eds.; John Wiley & Sons:
New York, 1998; pp. 185-206.

28

29
Table 1. Average composition of Rivers Nordurá, Vídidalsá and Vatnsdalsá in 2004-2005. River Discharge Water Air pH Cond. SiO2 Na K Ca Mg Alk (a) DIC SO4 SO4 ∂34S Cl F TDS TDS
m3/s T °C T °C µS/cm mmol/l mmol/l mmol/l mmol/l mmol/l meq./kg mmol/l mmol/l mmol/l ‰ mmol/l µmol/l mg/l mg/l ICP-AES I.chrom (b) I.chrom I.chrom meas. calc.
Nordurá 14.5 4.8 6.0 7.49 68 0.189 0.266 0.008 0.105 0.070 0.370 0.401 0.019 0.019 12.3 0.205 1.57 50 57 Vídidalsá 5.7 4.9 6.0 7.74 92 0.303 0.270 0.016 0.154 0.139 0.644 0.674 0.013 0.012 14.8 0.209 2.37 65 84 Vatnsdalsá 7.9 4.4 5.4 7.82 97 0.341 0.377 0.025 0.146 0.116 0.733 0.763 0.013 0.013 11.1 0.152 4.25 70 91 World average 0.173 0.224 0.033 0.334 0.138 0.853 0.090 0.090 0.162 5.26 100 100 River DIP DOP TDN DIN DON DIN/ POC/ DOC/ DOC POC PON C/N SPM Ptotal Ptotal PO4-P Ptot-DIP DIP/ Ntotal NO3-N NO2-N NH4-N Ntot-DIN DON SPM (DOC+POC)
mmol/l µg/kg µg/kg mol mg/l µmol/l µmol/l µmol/l DOP µmol/l µmol/l µmol/l µmol/l calc. % (c) ICP-MS col (d) ratio calc. Nordurá 0.037 175 <20.7 >9.84 6 <0.050 - <0.260 -0.210 5.13 <1.05 <0.072 <0.744 <1.87 >3.26 <0.57 0.029 72 Vídidalsá 0.062 257 27.6 10.6 14 0.074 - 0.205 -0.131 6.60 0.797 0.083 <1.36 <2.24 >4.36 <0.51 0.018 74 Vatnsdalsá 0.051 364 41.4 10.1 7 0.376 - 0.386 -0.010 7.14 1.06 0.075 <1.31 <2.45 >4.69 <0.52 0.052 63 World average 0.323 0.323 0.67 7.14 0.065 1.14 8.57 18.60 0.46 1 60
River Al Fe B Mn Sr As Ba Cd Co Cr Cu Ni Pb Zn Hg Mo Ti V µmol/l µmol/l µmol/l µmol/l µmol/l nmol/l nmol/l nmol/l nmol/l nmol/l nmol/l nmol/l nmol/l nmol/l nmol/l nmol/l nmol/l µmol/l
Nordurá 0.151 0.592 0.521 0.066 0.074 <5.80 0.855 <0.019 <0.211 0.533 5.96 <1.66 <0.066 <10.7 <0.010 1.99 3.87 0.014 Vídidalsá 0.129 1.43 0.224 0.083 0.181 <2.01 1.92 <0.030 0.294 1.39 7.19 2.90 <0.093 <9.93 <0.010 <0.836 2.97 0.034 Vatnsdalsá 0.200 1.59 0.307 0.047 0.125 <2.13 1.75 <0.024 0.297 5.13 5.66 2.51 <0.078 <9.55 <0.010 2.68 4.09 0.351 World average 1.850 0.716 1.850 0.716 209
(a) Alkalinity. (b) Data for δ34S is from 2004. (c) Total inorganic suspended particulate matter. (d) Data for Ntotal is from late year 2004 and 2005.
30
Table 2. Annual river fluxes, (tonnes/year), of Rivers Nordurá, Vídidalsá and Vatnsdalsá, calculated from 2004-2005 data. River Average discharge SiO2 Na K Ca Mg CO2 SO4 SO4 Cl F TDS TDS DOC POC m3/s (a) ICP-AES I.chrom meas. calc. Nordurá 22.4 7815 4195 228 2882 1158 12070 1279 1205 5033 19.1 32843 39047 380 180 Vídidalsá 7.0 4056 1378 139 1367 759 6572 280 263 1671 9.48 14348 18609 177 72.9 Vatnsdalsá 10.3 6666 2791 317 1896 919 10829 423 414 1750 25.8 22485 29525 202 127 Total 39.7 18537 8363 684 6145 2836 29471 1982 1883 8454 54.4 69676 87182 759 380 River PON SPM P PO4-P NO3-N NO2-N NH4-N Ntotal Al Fe B Mn Sr (b) (c) Nordurá <19.4 5283 <1.17 <5.06 <9.11 <0.639 <6.45 51.6 4.03 25.3 3.65 2.40 4.52 Vídidalsá 7.36 3611 0.522 1.32 2.37 0.234 <3.27 21.5 0.766 19.0 0.542 1.22 3.51 Vatnsdalsá 14.4 2257 3.84 3.81 4.77 0.332 <4.90 31.5 1.73 28.7 1.07 0.905 3.57 Total <41.2 11151 <5.53 <10.2 <16.3 <1.21 <14.6 105 6.52 72.9 5.26 4.53 11.6 River As Ba Cd Co Cr Cu Ni Pb Zn Hg Mo Ti V Heavy metals (d) Nordurá <0.243 0.081 <0.001 <0.014 0.021 0.290 <0.076 <0.009 <0.396 <0.001 0.116 0.216 0.471 <1.94 Vídidalsá <0.033 0.059 <0.001 0.006 0.014 0.101 0.038 <0.004 <0.140 <0.001 <0.016 0.032 0.354 <0.799 Vatnsdalsá <0.050 0.080 <0.001 0.008 0.084 0.118 0.049 <0.005 <0.214 <0.001 0.082 0.062 5.64 <6.39 Total <0.326 0.220 <0.003 <0.028 0.120 0.508 <0.163 <0.018 <0.750 <0.003 <0.214 0.311 6.46 <9.13
(a) Average discharge for Nordurá calculated from data 1971-1987 and 1993-2004, for Vídidalsá from data 2004 and for Vatnsdalsá from data 1949-1984, 1993 and 1997-2004.
(b) Total inorganic suspended particulate matter.
(c) Data for Ntotal is from late year 2004 and 2005.
(d) Heavy metals are As, Ba, Cd, Co, Cr, Cu, Ni, Pb, Zn, Hg, Mo, Ti and V.

31
Table 3a. Results of samples collected in 2004-2005 in a time sequence. River Sample Date Discharge Water Air pH T °C Cond. SiO2 Na K Ca Mg Alk. (a) DIC SO4 SO4 ∂34S Cl F Charge Error TDS TDS DOC POC PON C/N
number m3/s T °C T °C (pH/ µS/cm mmol/l mmol/l mmol/l mmol/l mmol/l meq./kg mmol/l mmol/l mmol/l ‰ mmol/l µmol/l balance % mg/l mg/kg mmol/l µg/kg µg/kg mol cond.) ICP-AES I.chrom I.chrom I.chrom meas. calc. Litla-Skard 04N001 2/25/2004 11:45 0.0 -4.8 6.45 20.3 64 0.229 0.019 15.4 0.284 0.813 46 0.077 382 35.3 12.7 Nordurá 04N002 2/25/2004 13:45 15.0 0.0 -3.2 7.27 20.1 66 0.185 0.258 0.008 0.101 0.068 0.301 0.340 0.017 0.021 12.0 0.251 1.60 0.00 0.8 47 54 0.037 143 21.8 7.68 Vídidalsá 04N003 2/25/2004 18:50 5.9 0.0 -5.5 7.60 19.9 84 0.263 0.247 0.016 0.130 0.118 0.516 0.547 0.014 0.016 14.8 0.221 2.26 -0.01 0.6 66 72 0.042 162 17.6 10.7 Blanda 04N004 2/26/2004 14:30 50.2 0.0 -6.6 7.60 19.5 78 0.592 0.038 5.45 0.099 5.77 60 0.025 236 35.1 7.82 Vatnsdalsá 04N005 2/26/2004 18:15 9.0 0.0 -8.9 7.54 19.3 96 0.323 0.377 0.025 0.148 0.117 0.720 0.770 0.015 0.017 11.2 0.181 4.69 -0.01 0.4 74 92 0.052 Vatnsdalsá 04N006 5/7/2004 8:20 9.1 1.8 2.8 7.48 23.1 107 0.301 0.329 0.022 0.128 0.101 0.537 0.578 0.013 0.015 11.7 0.149 4.56 0.09 5.8 57 75 0.045 335 44.3 8.84 Vídidalsá 04N007 5/7/2004 11:30 6.4 2.8 3.2 7.63 22.9 84 0.267 0.241 0.013 0.130 0.120 0.640 0.674 0.013 0.014 15.5 0.216 2.58 -0.13 8.1 50 80 0.068 190 22.9 9.71 Nordurá 04N008 5/7/2004 14:30 11.6 5.1 9.6 7.38 23.0 61 0.178 0.239 0.007 0.097 0.064 0.320 0.351 0.017 0.021 13.2 0.204 1.75 0.00 0.0 43 52 0.039 100 15.8 7.41 Nordurá 04N009 7/5/2004 8:40 6.5 11.1 12.0 7.61 23.4 67 0.194 0.269 0.010 0.106 0.069 0.392 0.414 0.018 0.021 12.5 0.193 2.05 0.00 0.1 47 58 0.026 142 21.3 7.78 Vídidalsá 04N010 7/5/2004 11:30 4.9 12.2 13.3 7.74 23.4 87 0.289 0.256 0.018 0.145 0.124 0.598 0.623 0.011 0.013 13.7 0.190 3.10 0.00 0.2 77 78 0.077 246 38.8 7.41 Vatnsdalsá 04N011 7/5/2004 13:10 8.4 11.3 15.8 7.87 23.4 92 0.316 0.357 0.025 0.142 0.111 0.685 0.705 0.012 0.014 11.0 0.148 5.19 0.02 1.3 74 85 0.062 235 37.7 7.28 Nordurá 04N012 8/5/2004 8:50 7.1 10.7 11.3 7.68 19.8 68 0.189 0.280 0.010 0.112 0.073 0.431 0.453 0.018 0.020 12.1 0.186 1.87 0.00 0.1 55 60 0.026 177 19.0 10.9 Vídidalsá 04N013 8/5/2004 11:55 3.2 11.5 15.3 7.80 19.8 98 0.273 0.271 0.016 0.158 0.132 0.679 0.705 0.006 0.010 14.2 0.190 2.86 -0.03 1.5 78 82 0.050 166 19.6 9.89 Vatnsdalsá 04N014 8/5/2004 14:20 6.0 10.9 16.2 8.14 19.8 92 0.304 0.390 0.024 0.147 0.109 0.773 0.787 0.011 0.013 11.2 0.147 5.07 -0.03 1.4 74 90 0.053 235 26.1 10.5 Nordurá 04N015 9/15/2004 10:45 11.4 6.8 7.9 7.52 21.6 90 0.189 0.275 0.010 0.115 0.074 0.434 0.465 0.019 0.022 11.5 0.182 1.76 0.00 0.2 52 61 0.035 107 11.0 11.3 Vídidalsá 04N016 9/15/2004 14:35 2.6 5.5 12.9 7.63 21.7 94 0.282 0.264 0.013 0.158 0.133 0.664 0.700 0.008 0.011 14.5 0.192 2.68 -0.02 1.2 69 83 0.039 159 15.1 12.2 Vatnsdalsá 04N017 9/15/2004 17:10 5.5 5.4 11.0 7.85 21.8 102 0.313 0.393 0.024 0.146 0.107 0.807 0.834 0.009 0.014 10.7 0.150 4.98 -0.06 3.4 73 93 0.042 294 32.1 10.7 Nordurá 04N018 10/21/2004 10:15 11.8 0.4 3.0 7.16 24.6 74 0.196 0.267 0.008 0.114 0.075 0.381 0.440 0.020 0.022 12.8 0.204 1.67 0.01 1.6 62 60 0.028 124 14.6 9.92 Vídidalsá 04N019 10/21/2004 12:59 4.8 0.1 4.8 7.41 24.1 113 0.308 0.304 0.016 0.184 0.163 0.719 0.782 0.016 0.016 16.0 0.264 2.61 0.00 0.2 78 95 0.058 309 33.5 10.8 Vatnsdalsá 04N020 10/21/2004 15:15 6.1 0.0 -3.3 7.54 23.6 110 0.352 0.428 0.026 0.154 0.120 0.797 0.849 0.013 0.016 11.1 0.177 4.99 -0.01 0.4 85 100 0.041 234 28.9 9.44 Nordurá 05N001 2/10/2005 10:45 11.6 -0.2 -11.2 7.45 21.5 74 0.202 0.322 0.009 0.116 0.081 0.335 0.363 0.023 0.019 0.318 1.57 0.03 1.8 74 62 0.032 257 33.8 8.88 Vídidalsá 05N002 2/10/2005 14:22 6.6 -0.1 -5.6 7.75 21.5 97 0.334 0.321 0.015 0.161 0.158 0.627 0.652 0.018 0.015 0.292 2.00 0.02 1.0 82 90 0.056 216 27.5 9.15 Vatnsdalsá 05N003 2/10/2005 17:55 8.2 -0.2 -1.6 7.80 21.2 98 0.377 0.393 0.026 0.149 0.127 0.723 0.749 0.016 0.014 0.179 3.56 0.03 1.7 80 95 0.047 328 44.5 8.60 Nordurá 05N004 5/23/2005 11:18 7.9 4.1 6.8 7.72 19.9 65 0.187 0.267 0.008 0.102 0.067 0.351 0.367 0.021 0.016 0.203 1.50 0.02 1.3 53 55 0.024 93.0 16.5 6.57 Vídidalsá 05N005 5/23/2005 14:35 4.7 5.1 6.3 7.88 19.9 77 0.307 0.248 0.016 0.133 0.119 0.528 0.544 0.012 0.011 0.172 2.15 0.04 2.9 59 73 0.044 183 23.2 9.21 Vatnsdalsá 05N006 5/23/2005 17:13 8.2 4.3 5.4 7.98 19.8 85 0.342 0.363 0.025 0.133 0.108 0.660 0.676 0.013 0.011 0.134 3.54 0.05 2.8 67 84 0.035 252 32.6 9.03 Nordurá 05N007 6/29/2005 13:50 13.4 10.0 14.2 7.83 21.0 54 0.167 0.224 0.007 0.082 0.052 0.327 0.338 0.017 0.014 0.147 1.36 -0.01 1.0 43 47 0.033 128 13.7 10.9 Vídidalsá 05N008 6/29/2005 17:05 4.2 14.1 14.8 8.11 20.9 83 0.319 0.267 0.019 0.147 0.129 0.613 0.624 0.011 0.009 0.169 2.23 0.03 2.0 34 80 0.054 176 19.3 10.6 Vatnsdalsá 05N009 6/29/2005 19:15 7.2 11.7 14.1 8.18 20.9 89 0.360 0.358 0.027 0.132 0.105 0.721 0.731 0.014 0.011 0.130 3.75 -0.02 1.3 62 89 0.052 240 27.5 10.2 Nordurá 05N010 8/25/2005 11:15 23.8 5.9 10.7 7.69 20.1 65 0.194 0.265 0.008 0.106 0.070 0.404 0.424 0.019 0.016 0.172 1.51 0.01 0.7 35 57 0.062 128 17.9 8.38 Vídidalsá 05N011 8/25/2005 14:15 6.9 5.1 4.6 8.03 20.1 98 0.326 0.278 0.016 0.176 0.163 0.749 0.766 0.012 0.009 0.198 2.33 0.00 0.1 61 92 0.106 195 20.5 11.1 Vatnsdalsá 05N012 8/25/2005 16:25 8.0 4.0 4.5 8.08 20.2 99 0.374 0.384 0.026 0.159 0.133 0.813 0.829 0.014 0.011 0.144 3.73 0.00 0.2 61 98 0.082 369 32.3 13.3 Nordurá 05N013 10/3/2005 10:21 45.3 2.5 4.8 7.18 20.4 61 0.168 0.233 0.008 0.091 0.061 0.303 0.351 0.018 0.015 0.190 0.943 0.01 1.3 39 50 0.065 590 55.1 12.5 Vídidalsá 05N014 10/3/2005 13:30 12.8 2.8 6.5 7.69 20.1 98 0.318 0.275 0.017 0.158 0.154 0.667 0.700 0.014 0.012 0.217 1.69 0.00 0.1 64 87 0.087 878 74.8 13.7 Vatnsdalsá 05N015 10/3/2005 15:23 10.9 2.5 6.2 7.73 20.4 97 0.355 0.358 0.024 0.156 0.130 0.771 0.805 0.014 0.011 0.144 3.24 0.01 0.4 63 95 0.063 941 96.4 11.4 Nordurá 05N016 11/18/2005 10:07 8.5 0.9 6.3 7.37 21.4 74 0.212 0.299 <0.010 0.121 0.081 0.463 0.510 0.021 0.018 0.212 1.22 -0.01 0.4 48 67 0.031 108 <7.97 >15.9 Vídidalsá 05N017 11/18/2005 13:37 5.0 0.1 1.8 7.61 21.6 94 0.345 0.271 0.017 0.169 0.152 0.728 0.770 0.015 0.012 0.188 1.93 -0.02 1.0 66 92 0.057 203 18.4 12.9 Vatnsdalsá 05N018 11/18/2005 15:55 8.2 0.8 2.9 7.63 21.7 96 0.370 0.388 0.027 0.153 0.122 0.793 0.836 0.015 0.013 0.142 3.68 0.00 0.2 69 98 0.039 538 53.4 11.8 (a) Alkalinity.

32
Table 3b. Results of samples collected in 2004-2005 in a time sequence. River Sample Date SPM (a) P PO4-P NO3-N NO2-N NH4-N Ntotal Al Fe B Mn Sr As Ba Cd Co Cr Cu Ni Pb Zn Hg Mo Ti V
number mg/l µmol/l µmol/l µmol/l µmol/l µmol/l µmol/l µmol/l µmol/l µmol/l µmol/l µmol/l nmol/l nmol/l nmol/l nmol/l nmol/l nmol/l nmol/l nmol/l nmol/l nmol/l nmol/l nmol/l µmol/l
Litla-Skard 04N001 2/25/2004 11:45 3 0.136 0.907 0.150 0.720 Nordurá 04N002 2/25/2004 13:45 3 0.126 0.200 3.31 0.074 0.850 0.188 0.727 0.367 0.140 0.073 <13.3 0.659 <0.018 0.355 0.617 6.85 3.05 <0.048 11.7 <0.010 1.26 6.41 0.011 Vídidalsá 04N003 2/25/2004 18:50 83 0.108 0.491 2.32 0.118 0.887 0.143 1.03 0.220 0.069 0.155 <0.667 2.17 0.060 0.214 1.63 6.42 3.73 <0.048 11.5 <0.010 0.809 2.59 0.028 Blanda 04N004 2/26/2004 14:30 22 0.340 3.33 0.146 1.72 Vatnsdalsá 04N005 2/26/2004 18:15 13 0.455 0.470 2.79 0.074 0.168 1.06 0.324 0.079 0.134 <0.667 2.23 0.040 0.403 4.98 5.92 3.46 <0.048 7.13 <0.010 2.54 4.53 0.283 Vatnsdalsá 04N006 5/7/2004 8:20 7 0.462 0.555 0.464 0.147 0.906 0.215 1.59 0.271 0.098 0.111 <0.667 1.98 0.049 0.350 4.71 8.21 4.58 0.080 54.0 <0.010 2.61 3.99 0.320 Vídidalsá 04N007 5/7/2004 11:30 10 0.092 0.243 0.474 0.105 1.71 0.148 1.75 0.197 0.159 0.155 <0.667 1.99 0.031 0.392 1.23 8.17 5.79 0.076 31.7 <0.010 0.789 4.03 0.030 Nordurá 04N008 5/7/2004 14:30 6 0.035 <0.065 1.20 0.102 1.75 0.113 0.494 0.433 0.068 0.065 <12.0 0.493 <0.018 0.077 0.392 4.67 2.52 <0.048 21.1 <0.010 1.68 2.34 0.011 Nordurá 04N009 7/5/2004 8:40 5 0.043 <0.065 0.232 0.111 1.10 0.115 0.517 0.625 0.009 0.072 <10.7 0.582 <0.018 <0.058 0.523 6.83 1.65 <0.048 27.7 <0.010 2.50 2.32 0.020 Vídidalsá 04N010 7/5/2004 11:30 2 0.106 0.146 0.155 0.111 3.19 0.146 0.859 0.249 0.029 0.178 <0.667 1.89 0.026 0.159 1.23 11.6 2.74 0.066 19.6 <0.010 0.947 2.01 0.048 Vatnsdalsá 04N011 7/5/2004 13:10 2 0.387 0.351 0.213 0.065 1.03 0.274 1.70 0.307 0.012 0.126 <0.667 1.71 0.021 0.162 5.02 6.12 2.44 0.069 9.63 0.012 2.87 2.84 0.406 Nordurá 04N012 8/5/2004 8:50 6 <0.032 <0.065 0.310 0.089 0.822 0.071 0.274 0.680 0.008 0.078 <9.34 0.626 <0.018 <0.058 0.417 5.30 1.33 <0.048 13.2 <0.010 2.52 0.309 0.020 Vídidalsá 04N013 8/5/2004 11:55 1 0.045 0.114 0.377 0.089 0.869 5.57 0.144 0.698 0.236 0.019 0.189 1.00 1.76 0.023 0.257 2.19 6.23 2.40 0.060 11.9 <0.010 1.07 1.86 0.046 Vatnsdalsá 04N014 8/5/2004 14:20 2 0.247 0.232 0.435 0.089 0.272 7.04 0.356 2.18 0.320 0.017 0.124 3.22 1.40 0.020 0.364 6.77 5.92 2.25 0.118 10.0 <0.010 3.14 8.04 0.452 Nordurá 04N015 9/15/2004 10:45 12 <0.032 1.01 0.861 0.214 80.5 4.85 0.069 0.526 0.584 0.026 0.080 <9.34 1.65 <0.018 <0.058 0.554 6.34 1.68 0.110 10.5 <0.010 1.95 1.77 0.017 Vídidalsá 04N016 9/15/2004 14:35 3 0.043 0.265 1.42 0.183 6.15 6.08 0.102 1.07 0.171 0.018 0.184 1.13 1.98 0.037 0.229 2.42 6.40 3.27 0.124 5.32 <0.010 1.18 2.84 0.031 Vatnsdalsá 04N017 9/15/2004 17:10 9 0.234 0.189 1.56 0.120 9.30 6.93 0.108 1.38 0.312 0.011 0.122 2.34 1.42 <0.018 0.262 5.96 4.14 2.30 0.077 <3.06 <0.010 3.17 2.76 0.444 Nordurá 04N018 10/21/2004 10:15 2 0.039 0.933 1.46 0.069 0.999 5.13 0.088 0.440 0.509 0.081 0.077 <9.34 0.445 <0.018 0.150 0.281 6.04 1.52 <0.048 7.36 <0.010 1.94 4.11 0.012 Vídidalsá 04N019 10/21/2004 12:59 4 0.068 0.178 0.310 0.089 0.906 7.21 0.149 1.49 0.224 0.109 0.216 1.33 1.94 0.027 0.372 1.50 7.73 2.67 0.136 7.08 0.011 0.821 7.39 0.027 Vatnsdalsá 04N020 10/21/2004 15:15 3 0.358 1.19 1.05 0.131 0.785 13.0 0.158 1.27 0.338 0.027 0.128 1.60 1.49 0.036 0.239 5.98 6.04 2.62 0.095 7.43 <0.010 3.07 5.93 0.373 Nordurá 05N001 2/10/2005 10:45 13 0.078 0.189 2.65 0.036 0.701 5.61 0.192 1.34 0.562 0.268 0.088 <0.801 1.43 0.026 0.852 0.500 5.57 1.66 0.176 20.2 <0.010 1.84 5.22 0.011 Vídidalsá 05N002 2/10/2005 14:22 24 0.119 0.146 1.68 0.064 0.697 9.74 0.150 3.26 0.283 0.143 0.189 <9.34 2.36 0.028 0.420 1.70 9.22 2.91 0.214 14.5 <0.010 0.642 2.94 0.029 Vatnsdalsá 05N003 2/10/2005 17:55 14 0.494 0.437 2.75 0.051 0.434 7.46 0.171 1.79 0.314 0.090 0.128 <6.67 2.21 0.020 0.363 5.00 6.25 2.28 0.154 8.03 <0.010 2.27 4.28 0.304 Nordurá 05N004 5/23/2005 11:18 6 <0.032 0.131 <0.143 0.031 0.596 3.50 0.116 0.532 0.567 0.070 0.071 <0.667 0.910 <0.018 0.211 0.614 5.29 1.09 0.065 <3.06 <0.010 2.49 1.60 0.013 Vídidalsá 05N005 5/23/2005 14:35 7 0.073 0.112 0.178 0.087 0.668 4.84 0.120 1.44 0.194 0.058 0.146 <4.00 1.58 0.061 0.178 1.09 6.92 2.32 0.138 5.32 <0.010 0.862 2.55 0.037 Vatnsdalsá 05N006 5/23/2005 17:13 8 0.488 0.122 0.195 0.046 0.409 4.86 0.231 1.59 0.283 0.065 0.108 <2.67 1.37 <0.018 0.285 4.92 4.77 1.87 0.057 <3.06 <0.010 2.43 4.55 0.357 Nordurá 05N007 6/29/2005 13:50 4 0.043 0.179 0.162 0.021 0.398 3.89 0.191 0.281 0.462 0.007 0.061 <0.667 0.634 <0.018 0.091 0.542 4.89 <0.852 0.052 <3.06 <0.010 1.99 2.53 0.018 Vídidalsá 05N008 6/29/2005 17:05 8 0.067 0.417 0.145 0.021 0.308 5.87 0.174 1.37 0.239 0.022 0.164 <2.67 1.63 <0.018 0.176 0.981 6.11 1.59 0.080 <3.06 <0.010 0.902 1.77 0.054 Vatnsdalsá 05N009 6/29/2005 19:15 1 0.446 0.160 0.178 0.036 0.316 6.46 0.304 1.83 0.324 0.015 0.114 3.03 1.58 <0.018 0.285 5.56 5.82 1.70 0.073 <3.06 <0.010 2.68 2.53 0.426 Nordurá 05N010 8/25/2005 11:15 5 0.035 0.084 0.195 <0.020 0.298 3.66 0.165 0.605 0.438 0.024 0.080 1.11 0.757 <0.018 0.162 0.644 6.47 0.922 <0.048 4.01 <0.010 1.54 2.63 0.015 Vídidalsá 05N011 8/25/2005 14:15 5 0.050 0.084 0.195 0.031 0.406 6.40 0.096 1.88 0.218 0.051 0.207 <1.33 1.50 <0.018 0.340 0.817 5.90 2.30 0.082 <3.06 <0.010 0.745 2.78 0.033 Vatnsdalsá 05N012 8/25/2005 16:25 5 0.267 0.236 0.170 0.049 0.305 4.91 0.161 2.35 0.283 0.028 0.136 2.03 1.41 <0.018 0.324 4.75 4.58 2.23 0.062 <3.06 <0.010 2.71 2.99 0.310 Nordurá 05N013 10/3/2005 10:21 12 0.061 0.103 0.245 0.056 0.470 6.19 0.426 0.781 0.396 0.037 0.067 1.00 0.808 <0.018 0.303 0.744 8.23 2.57 0.049 3.75 <0.010 1.12 15.9 0.010 Vídidalsá 05N014 10/3/2005 13:30 18 0.067 0.112 0.345 0.054 0.330 7.76 0.122 1.60 0.235 0.181 0.188 <0.667 2.13 <0.018 0.489 0.733 6.37 2.83 0.050 <3.06 <0.010 <0.521 3.32 0.020 Vatnsdalsá 05N015 10/3/2005 15:23 6 0.278 0.274 0.120 0.054 0.434 5.61 0.147 1.57 0.287 0.078 0.145 1.19 2.01 <0.018 0.370 3.42 5.32 2.64 <0.048 <3.06 <0.010 2.15 3.97 0.241 Nordurá 05N016 11/18/2005 10:07 4 0.039 0.093 1.99 0.046 <0.200 8.23 0.073 0.582 0.633 0.060 0.079 1.32 1.26 <0.018 0.158 0.571 5.00 1.09 <0.048 <3.06 <0.010 3.02 1.27 0.011 Vídidalsá 05N017 11/18/2005 13:37 6 0.052 0.150 1.97 0.046 <0.200 5.95 0.060 0.741 0.220 0.137 0.195 <0.667 2.12 <0.018 0.305 1.18 5.13 2.20 <0.048 <3.06 <0.010 0.741 1.51 0.021 Vatnsdalsá 05N018 11/18/2005 15:55 11 0.394 0.417 2.73 0.044 <0.200 7.95 0.102 0.774 0.326 0.039 0.123 0.806 2.13 <0.018 0.158 4.50 4.78 1.74 <0.048 <3.06 <0.010 2.58 2.72 0.294 (a) Total inorganic suspended particulate matter.
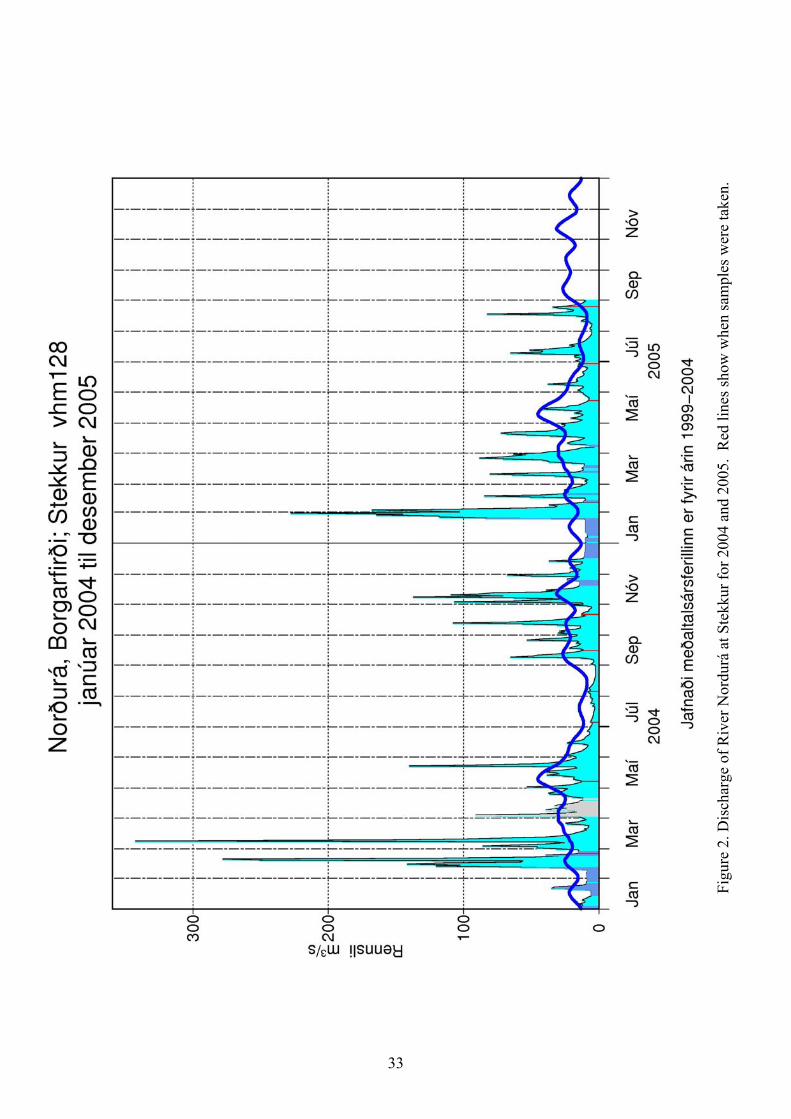
33
Figu
re 2
. Dis
char
ge o
f Riv
er N
ordu
rá a
t Ste
kkur
for 2
004
and
2005
. R
ed li
nes s
how
whe
n sa
mpl
es w
ere
take
n.
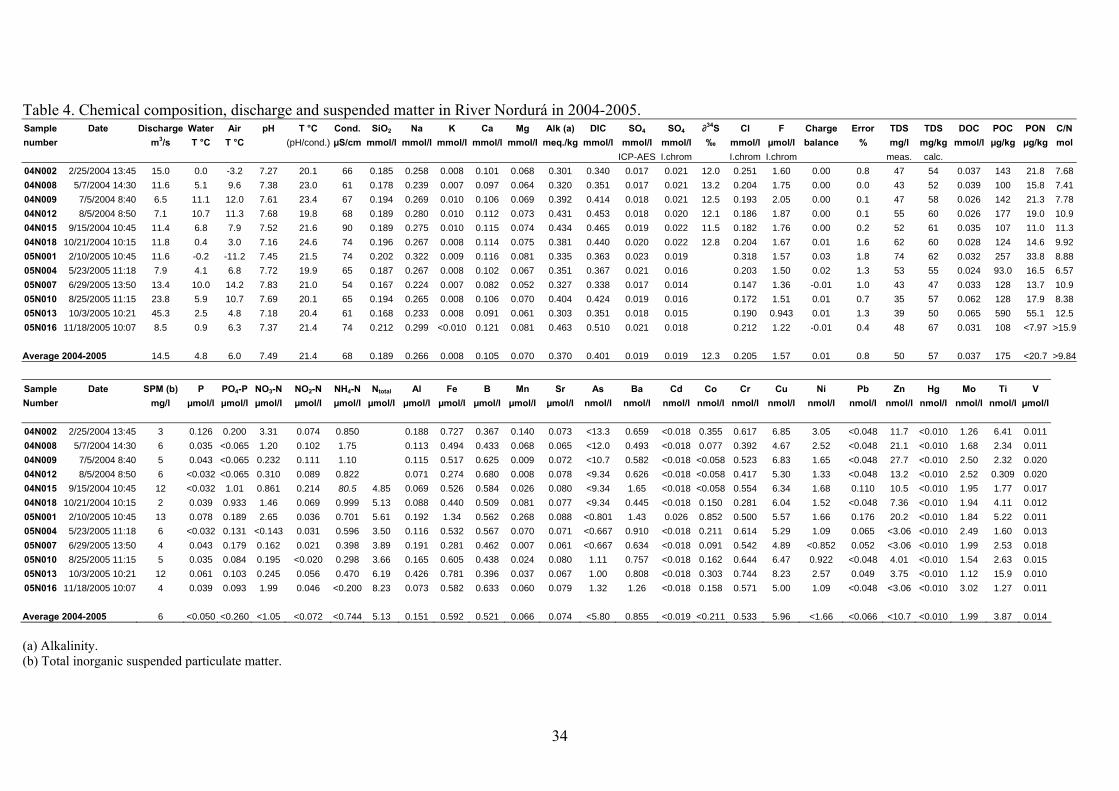
34
Table 4. Chemical composition, discharge and suspended matter in River Nordurá in 2004-2005. Sample Date Discharge Water Air pH T °C Cond. SiO2 Na K Ca Mg Alk (a) DIC SO4 SO4 ∂34S Cl F Charge Error TDS TDS DOC POC PON C/N number m3/s T °C T °C (pH/cond.) µS/cm mmol/l mmol/l mmol/l mmol/l mmol/l meq./kg mmol/l mmol/l mmol/l ‰ mmol/l µmol/l balance % mg/l mg/kg mmol/l µg/kg µg/kg mol
ICP-AES I.chrom I.chrom I.chrom meas. calc. 04N002 2/25/2004 13:45 15.0 0.0 -3.2 7.27 20.1 66 0.185 0.258 0.008 0.101 0.068 0.301 0.340 0.017 0.021 12.0 0.251 1.60 0.00 0.8 47 54 0.037 143 21.8 7.68 04N008 5/7/2004 14:30 11.6 5.1 9.6 7.38 23.0 61 0.178 0.239 0.007 0.097 0.064 0.320 0.351 0.017 0.021 13.2 0.204 1.75 0.00 0.0 43 52 0.039 100 15.8 7.41 04N009 7/5/2004 8:40 6.5 11.1 12.0 7.61 23.4 67 0.194 0.269 0.010 0.106 0.069 0.392 0.414 0.018 0.021 12.5 0.193 2.05 0.00 0.1 47 58 0.026 142 21.3 7.78 04N012 8/5/2004 8:50 7.1 10.7 11.3 7.68 19.8 68 0.189 0.280 0.010 0.112 0.073 0.431 0.453 0.018 0.020 12.1 0.186 1.87 0.00 0.1 55 60 0.026 177 19.0 10.9 04N015 9/15/2004 10:45 11.4 6.8 7.9 7.52 21.6 90 0.189 0.275 0.010 0.115 0.074 0.434 0.465 0.019 0.022 11.5 0.182 1.76 0.00 0.2 52 61 0.035 107 11.0 11.3 04N018 10/21/2004 10:15 11.8 0.4 3.0 7.16 24.6 74 0.196 0.267 0.008 0.114 0.075 0.381 0.440 0.020 0.022 12.8 0.204 1.67 0.01 1.6 62 60 0.028 124 14.6 9.92 05N001 2/10/2005 10:45 11.6 -0.2 -11.2 7.45 21.5 74 0.202 0.322 0.009 0.116 0.081 0.335 0.363 0.023 0.019 0.318 1.57 0.03 1.8 74 62 0.032 257 33.8 8.88 05N004 5/23/2005 11:18 7.9 4.1 6.8 7.72 19.9 65 0.187 0.267 0.008 0.102 0.067 0.351 0.367 0.021 0.016 0.203 1.50 0.02 1.3 53 55 0.024 93.0 16.5 6.57 05N007 6/29/2005 13:50 13.4 10.0 14.2 7.83 21.0 54 0.167 0.224 0.007 0.082 0.052 0.327 0.338 0.017 0.014 0.147 1.36 -0.01 1.0 43 47 0.033 128 13.7 10.9 05N010 8/25/2005 11:15 23.8 5.9 10.7 7.69 20.1 65 0.194 0.265 0.008 0.106 0.070 0.404 0.424 0.019 0.016 0.172 1.51 0.01 0.7 35 57 0.062 128 17.9 8.38 05N013 10/3/2005 10:21 45.3 2.5 4.8 7.18 20.4 61 0.168 0.233 0.008 0.091 0.061 0.303 0.351 0.018 0.015 0.190 0.943 0.01 1.3 39 50 0.065 590 55.1 12.5 05N016 11/18/2005 10:07 8.5 0.9 6.3 7.37 21.4 74 0.212 0.299 <0.010 0.121 0.081 0.463 0.510 0.021 0.018 0.212 1.22 -0.01 0.4 48 67 0.031 108 <7.97 >15.9 Average 2004-2005 14.5 4.8 6.0 7.49 21.4 68 0.189 0.266 0.008 0.105 0.070 0.370 0.401 0.019 0.019 12.3 0.205 1.57 0.01 0.8 50 57 0.037 175 <20.7 >9.84
Sample Date SPM (b) P PO4-P NO3-N NO2-N NH4-N Ntotal Al Fe B Mn Sr As Ba Cd Co Cr Cu Ni Pb Zn Hg Mo Ti V Number mg/l µmol/l µmol/l µmol/l µmol/l µmol/l µmol/l µmol/l µmol/l µmol/l µmol/l µmol/l nmol/l nmol/l nmol/l nmol/l nmol/l nmol/l nmol/l nmol/l nmol/l nmol/l nmol/l nmol/l µmol/l 04N002 2/25/2004 13:45 3 0.126 0.200 3.31 0.074 0.850 0.188 0.727 0.367 0.140 0.073 <13.3 0.659 <0.018 0.355 0.617 6.85 3.05 <0.048 11.7 <0.010 1.26 6.41 0.011 04N008 5/7/2004 14:30 6 0.035 <0.065 1.20 0.102 1.75 0.113 0.494 0.433 0.068 0.065 <12.0 0.493 <0.018 0.077 0.392 4.67 2.52 <0.048 21.1 <0.010 1.68 2.34 0.011 04N009 7/5/2004 8:40 5 0.043 <0.065 0.232 0.111 1.10 0.115 0.517 0.625 0.009 0.072 <10.7 0.582 <0.018 <0.058 0.523 6.83 1.65 <0.048 27.7 <0.010 2.50 2.32 0.020 04N012 8/5/2004 8:50 6 <0.032 <0.065 0.310 0.089 0.822 0.071 0.274 0.680 0.008 0.078 <9.34 0.626 <0.018 <0.058 0.417 5.30 1.33 <0.048 13.2 <0.010 2.52 0.309 0.020 04N015 9/15/2004 10:45 12 <0.032 1.01 0.861 0.214 80.5 4.85 0.069 0.526 0.584 0.026 0.080 <9.34 1.65 <0.018 <0.058 0.554 6.34 1.68 0.110 10.5 <0.010 1.95 1.77 0.017 04N018 10/21/2004 10:15 2 0.039 0.933 1.46 0.069 0.999 5.13 0.088 0.440 0.509 0.081 0.077 <9.34 0.445 <0.018 0.150 0.281 6.04 1.52 <0.048 7.36 <0.010 1.94 4.11 0.012 05N001 2/10/2005 10:45 13 0.078 0.189 2.65 0.036 0.701 5.61 0.192 1.34 0.562 0.268 0.088 <0.801 1.43 0.026 0.852 0.500 5.57 1.66 0.176 20.2 <0.010 1.84 5.22 0.011 05N004 5/23/2005 11:18 6 <0.032 0.131 <0.143 0.031 0.596 3.50 0.116 0.532 0.567 0.070 0.071 <0.667 0.910 <0.018 0.211 0.614 5.29 1.09 0.065 <3.06 <0.010 2.49 1.60 0.013 05N007 6/29/2005 13:50 4 0.043 0.179 0.162 0.021 0.398 3.89 0.191 0.281 0.462 0.007 0.061 <0.667 0.634 <0.018 0.091 0.542 4.89 <0.852 0.052 <3.06 <0.010 1.99 2.53 0.018 05N010 8/25/2005 11:15 5 0.035 0.084 0.195 <0.020 0.298 3.66 0.165 0.605 0.438 0.024 0.080 1.11 0.757 <0.018 0.162 0.644 6.47 0.922 <0.048 4.01 <0.010 1.54 2.63 0.015 05N013 10/3/2005 10:21 12 0.061 0.103 0.245 0.056 0.470 6.19 0.426 0.781 0.396 0.037 0.067 1.00 0.808 <0.018 0.303 0.744 8.23 2.57 0.049 3.75 <0.010 1.12 15.9 0.010 05N016 11/18/2005 10:07 4 0.039 0.093 1.99 0.046 <0.200 8.23 0.073 0.582 0.633 0.060 0.079 1.32 1.26 <0.018 0.158 0.571 5.00 1.09 <0.048 <3.06 <0.010 3.02 1.27 0.011
Average 2004-2005 6 <0.050 <0.260 <1.05 <0.072 <0.744 5.13 0.151 0.592 0.521 0.066 0.074 <5.80 0.855 <0.019 <0.211 0.533 5.96 <1.66 <0.066 <10.7 <0.010 1.99 3.87 0.014 (a) Alkalinity. (b) Total inorganic suspended particulate matter.

35
y = 2.6337x0.2935
R2 = 0.0769
0
2
4
6
8
10
12
14
0.0 10.0 20.0 30.0 40.0 50.0
Discharge (m 3/s)
SPM
(mg/
l)y = 32.59x0.6055
R2 = 0.4108
0
100
200
300
400
500
600
700
0.0 10.0 20.0 30.0 40.0 50.0
Discharge (m3/s)
POC
(µg/
kg)
y = 0.3305x-0.0877
R2 = 0.2209
0.000
0.100
0.200
0.300
0.400
0.0 10.0 20.0 30.0 40.0 50.0
Discharge (m3/s)
Na
(mm
ol/l)
y = 0.0109x-0.1023
R2 = 0.1711
0.000
0.002
0.004
0.006
0.008
0.010
0.012
0.0 10.0 20.0 30.0 40.0 50.0
Discharge (m 3/s)
K (m
mol
/l)
y = 0.1311x-0.0902
R2 = 0.1916
0.000
0.040
0.080
0.120
0.160
0.0 10.0 20.0 30.0 40.0 50.0
Discharge (m3/s)
Ca
(mm
ol/l)
y = 0.0855x-0.0848
R2 = 0.1391
0.000
0.020
0.040
0.060
0.080
0.100
0.0 10.0 20.0 30.0 40.0 50.0
Discharge (m 3/s)
Mg
(mm
ol/l)
y = 0.0198x-0.0174
R2 = 0.0109
0.000
0.005
0.010
0.015
0.020
0.025
0.0 10.0 20.0 30.0 40.0 50.0
Discharge (m3/s)
SO4 (
mm
ol/l)
y = 0.2233x-0.041
R2 = 0.0134
0.000
0.100
0.200
0.300
0.400
0.0 10.0 20.0 30.0 40.0 50.0
Discharge (m3/s)
Cl (
mm
ol/l)
Figure 3. Concentration versus discharge correlations in River Nordurá 2004-2005.

36
y = 0.5133x-0.1342
R2 = 0.2414
0.000
0.100
0.200
0.300
0.400
0.500
0.0 10.0 20.0 30.0 40.0 50.0
Discharge (m3/s)
Alk
alin
ity (m
eq/k
g)
y = 0.2202x-0.0628
R2 = 0.2406
0.000
0.050
0.100
0.150
0.200
0.250
0.0 10.0 20.0 30.0 40.0 50.0
Discharge (m 3/s)
SiO
2 (m
mol
/l)
Concentrations corrected for precipitation (except Mo):
y = 0.1389x-0.1929
R2 = 0.0838
0.000
0.040
0.080
0.120
0.160
0.0 10.0 20.0 30.0 40.0 50.0
Discharge (m 3/s)
Na
(mm
ol/l)
y = 0.0064x-0.1387
R2 = 0.0714
0.000
0.002
0.004
0.006
0.008
0.0 10.0 20.0 30.0 40.0 50.0
Discharge (m 3/s)
K (m
mol
/l)
y = 0.1175x-0.1023
R2 = 0.1967
0.000
0.020
0.040
0.060
0.080
0.100
0.120
0.0 10.0 20.0 30.0 40.0 50.0
Discharge (m3/s)
Ca
(mm
ol/l)
y = 0.0637x-0.1032
R2 = 0.1668
0.000
0.020
0.040
0.060
0.080
0.0 10.0 20.0 30.0 40.0 50.0
Discharge (m 3/s)
Mg
(mm
ol/l)
y = 0.0083x-0.0057
R2 = 0.0001
0.000
0.002
0.004
0.006
0.008
0.010
0.012
0.0 10.0 20.0 30.0 40.0 50.0
Discharge (m3/s)
SO4 (m
mol
/l)
y = 6.2427x-0.4711
R2 = 0.7494
0.00
1.00
2.00
3.00
4.00
0.0 10.0 20.0 30.0 40.0 50.0
Discharge (m3/s)
Mo
(nm
ol/l)
Figure 4. Rock derived concentration versus discharge correlations in River Nordurá 2004-2005.
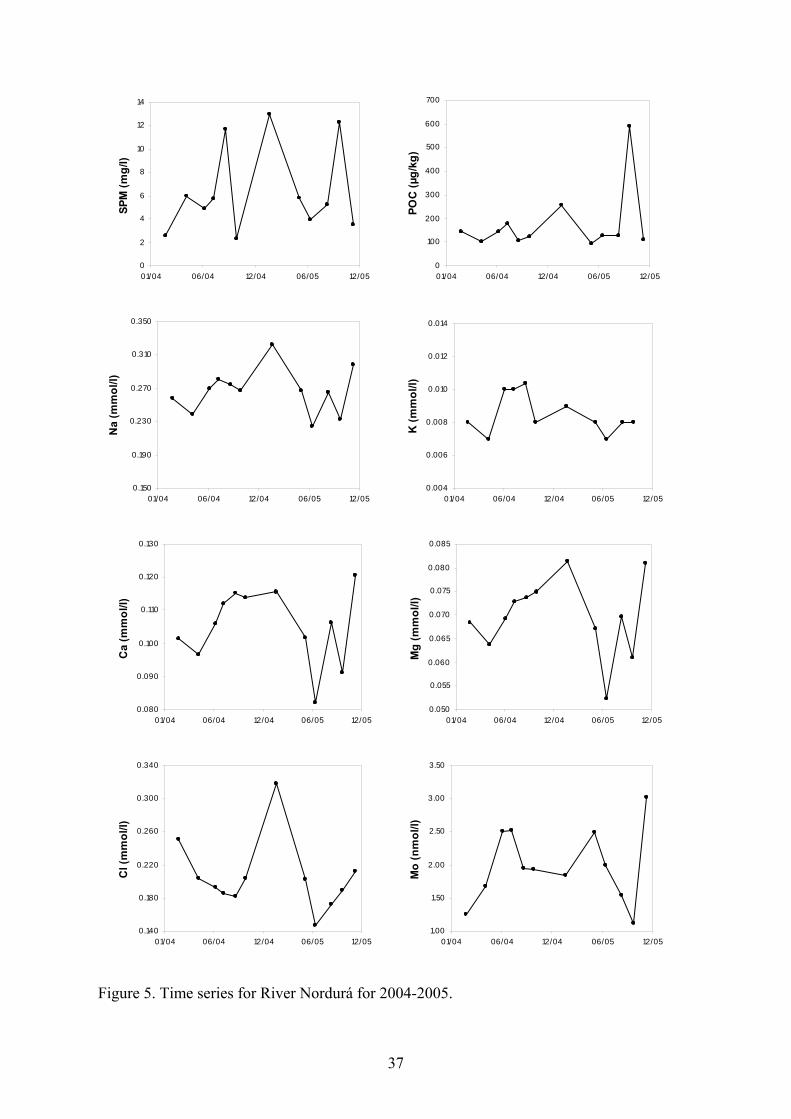
37
0
2
4
6
8
10
12
14
01/04 06/04 12/04 06/05 12/05
SPM
(mg/
l)
0
100
200
300
400
500
600
700
01/04 06/04 12/04 06/05 12/05
POC
(µg/
kg)
0.150
0.190
0.230
0.270
0.310
0.350
01/04 06/04 12/04 06/05 12/05
Na
(mm
ol/l)
0.004
0.006
0.008
0.010
0.012
0.014
01/04 06/04 12/04 06/05 12/05
K (m
mol
/l)
0.080
0.090
0.100
0.110
0.120
0.130
01/04 06/04 12/04 06/05 12/05
Ca
(mm
ol/l)
0.050
0.055
0.060
0.065
0.070
0.075
0.080
0.085
01/04 06/04 12/04 06/05 12/05
Mg
(mm
ol/l)
0.140
0.180
0.220
0.260
0.300
0.340
01/04 06/04 12/04 06/05 12/05
Cl (
mm
ol/l)
1.00
1.50
2.00
2.50
3.00
3.50
01/04 06/04 12/04 06/05 12/05
Mo
(nm
ol/l)
Figure 5. Time series for River Nordurá for 2004-2005.

38
0.280
0.320
0.360
0.400
0.440
0.480
01/04 06/04 12/04 06/05 12/05
Alk
alin
ity (m
eq/k
g)
0.160
0.170
0.180
0.190
0.200
0.210
0.220
01/04 06/04 12/04 06/05 12/05
SiO
2 (m
mol
/l)
0.016
0.018
0.020
0.022
0.024
01/04 06/04 12/04 06/05 12/05
SO4 (
mm
ol/l)
11.0
11.5
12.0
12.5
13.0
13.5
14.0
01/04 06/04 12/04 06/05 12/05
δ34 S
(‰)
0.000
0.300
0.600
0.900
1.200
1.500
01/04 06/04 12/04 06/05 12/05
Fe (µ
mol
/l)
0.000
0.050
0.100
0.150
0.200
0.250
0.300
01/04 06/04 12/04 06/05 12/05
Mn
(µm
ol/l)
0.000
0.200
0.400
0.600
0.800
1.000
01/04 06/04 12/04 06/05 12/05
Co
(nm
ol/l)
0.200
0.300
0.400
0.500
0.600
0.700
0.800
01/04 06/04 12/04 06/05 12/05
Cr (
nmol
/l)
Figure 6. Time series for River Nordurá for 2004-2005. .

39
Figu
re 7
. Dis
char
ge o
f Riv
er V
ídid
alsá
at K
olug
il fo
r 200
4 an
d 20
05.
Red
line
s sho
w w
hen
sam
ples
wer
e ta
ken.

40
Table 5. Chemical composition, discharge and suspended matter in River Vídidalsá in 2004-2005. Sample Date Discharge Water Air pH T °C Cond. SiO2 Na K Ca Mg Alk (a) DIC SO4 SO4 ∂34S Cl F Charge Error TDS TDS DOC POC PON C/N number m3/s T °C T °C (pH/cond.) µS/cm mmol/l mmol/l mmol/l mmol/l mmol/l meq./kg mmol/l mmol/l mmol/l ‰ mmol/l µmol/l balance % mg/l mg/kg mmol/l µg/kg µg/kg mol
ICP-AES I.chrom I.chrom I.chrom meas. calc. 04N003 2/25/2004 18:50 5.9 0.0 -5.5 7.60 19.9 84 0.263 0.247 0.016 0.130 0.118 0.516 0.547 0.014 0.016 14.8 0.221 2.26 -0.01 0.6 66 72 0.042 162 17.6 10.7 04N007 5/7/2004 11:30 6.4 2.8 3.2 7.63 22.9 84 0.267 0.241 0.013 0.130 0.120 0.640 0.674 0.013 0.014 15.5 0.216 2.58 -0.13 8.1 50 80 0.068 190 22.9 9.71 04N010 7/5/2004 11:30 4.9 12.2 13.3 7.74 23.4 87 0.289 0.256 0.018 0.145 0.124 0.598 0.623 0.011 0.013 13.7 0.190 3.10 0.00 0.2 77 78 0.077 246 38.8 7.41 04N013 8/5/2004 11:55 3.2 11.5 15.3 7.80 19.8 98 0.273 0.271 0.016 0.158 0.132 0.679 0.705 0.006 0.010 14.2 0.190 2.86 -0.03 1.5 78 82 0.050 166 19.6 9.89 04N016 9/15/2004 14:35 2.6 5.5 12.9 7.63 21.7 94 0.282 0.264 0.013 0.158 0.133 0.664 0.700 0.008 0.011 14.5 0.192 2.68 -0.02 1.2 69 83 0.039 159 15.1 12.2 04N019 10/21/2004 12:59 4.8 0.1 4.8 7.41 24.1 113 0.308 0.304 0.016 0.184 0.163 0.719 0.782 0.016 0.016 16.0 0.264 2.61 0.00 0.2 78 95 0.058 309 33.5 10.8 05N002 2/10/2005 14:22 6.6 -0.1 -5.6 7.75 21.5 97 0.334 0.321 0.015 0.161 0.158 0.627 0.652 0.018 0.015 0.292 2.00 0.02 1.0 82 90 0.056 216 27.5 9.15 05N005 5/23/2005 14:35 4.7 5.1 6.3 7.88 19.9 77 0.307 0.248 0.016 0.133 0.119 0.528 0.544 0.012 0.011 0.172 2.15 0.04 2.9 59 73 0.044 183 23.2 9.21 05N008 6/29/2005 17:05 4.2 14.1 14.8 8.11 20.9 83 0.319 0.267 0.019 0.147 0.129 0.613 0.624 0.011 0.009 0.169 2.23 0.03 2.0 34 80 0.054 176 19.3 10.6 05N011 8/25/2005 14:15 6.9 5.1 4.6 8.03 20.1 98 0.326 0.278 0.016 0.176 0.163 0.749 0.766 0.012 0.009 0.198 2.33 0.00 0.1 61 92 0.106 195 20.5 11.1 05N014 10/3/2005 13:30 12.8 2.8 6.5 7.69 20.1 98 0.318 0.275 0.017 0.158 0.154 0.667 0.700 0.014 0.012 0.217 1.69 0.00 0.1 64 87 0.087 878 74.8 13.7 05N017 11/18/2005 13:37 5.0 0.1 1.8 7.61 21.6 94 0.345 0.271 0.017 0.169 0.152 0.728 0.770 0.015 0.012 0.188 1.93 -0.02 1.0 66 92 0.057 203 18.4 12.9 Average 2004-2005 5.7 4.9 6.0 7.74 21.3 92 0.303 0.270 0.016 0.154 0.139 0.644 0.674 0.013 0.012 14.8 0.209 2.37 -0.01 1.6 65 84 0.062 257 27.6 10.6 Sample Date SPM (b) P PO4-P NO3-N NO2-N NH4-N Ntotal Al Fe B Mn Sr As Ba Cd Co Cr Cu Ni Pb Zn Hg Mo Ti V number mg/l µmol/l µmol/l µmol/l µmol/l µmol/l µmol/l µmol/l µmol/l µmol/l µmol/l µmol/l nmol/l nmol/l nmol/l nmol/l nmol/l nmol/l nmol/l nmol/l nmol/l nmol/l nmol/l nmol/l µmol/l 04N003 2/25/2004 18:50 83 0.108 0.491 2.32 0.118 0.887 0.143 1.03 0.220 0.069 0.155 <0.667 2.17 0.060 0.214 1.63 6.42 3.73 <0,048 11.5 <0.010 0.809 2.59 0.028 04N007 5/7/2004 11:30 10 0.092 0.243 0.474 0.105 1.71 0.148 1.75 0.197 0.159 0.155 <0.667 1.99 0.031 0.392 1.23 8.17 5.79 0.076 31.7 <0.010 0.789 4.03 0.030 04N010 7/5/2004 11:30 2 0.106 0.146 0.155 0.111 3.19 0.146 0.859 0.249 0.029 0.178 <0.667 1.89 0.026 0.159 1.23 11.6 2.74 0.066 19.6 <0.010 0.947 2.01 0.048 04N013 8/5/2004 11:55 1 0.045 0.114 0.377 0.089 0.869 5.57 0.144 0.698 0.236 0.019 0.189 1.00 1.76 0.023 0.257 2.19 6.23 2.40 0.060 11.9 <0.010 1.07 1.86 0.046 04N016 9/15/2004 14:35 3 0.043 0.265 1.42 0.183 6.15 6.08 0.102 1.07 0.171 0.018 0.184 1.13 1.98 0.037 0.229 2.42 6.40 3.27 0.124 5.32 <0.010 1.18 2.84 0.031 04N019 10/21/2004 12:59 4 0.068 0.178 0.310 0.089 0.906 7.21 0.149 1.49 0.224 0.109 0.216 1.33 1.94 0.027 0.372 1.50 7.73 2.67 0.136 7.08 0.011 0.821 7.39 0.027 05N002 2/10/2005 14:22 24 0.119 0.146 1.68 0.064 0.697 9.74 0.150 3.26 0.283 0.143 0.189 <9.34 2.36 0.028 0.420 1.70 9.22 2.91 0.214 14.5 <0.010 0.642 2.94 0.029 05N005 5/23/2005 14:35 7 0.073 0.112 0.178 0.087 0.668 4.84 0.120 1.44 0.194 0.058 0.146 <4.00 1.58 0.061 0.178 1.09 6.92 2.32 0.138 5.32 <0.010 0.862 2.55 0.037 05N008 6/29/2005 17:05 8 0.067 0.417 0.145 0.021 0.308 5.87 0.174 1.37 0.239 0.022 0.164 <2.67 1.63 <0.018 0.176 0.981 6.11 1.59 0.080 <3.06 <0.010 0.902 1.77 0.054 05N011 8/25/2005 14:15 5 0.050 0.084 0.195 0.031 0.406 6.40 0.096 1.88 0.218 0.051 0.207 <1.33 1.50 <0.018 0.340 0.817 5.90 2.30 0.082 <3.06 <0.010 0.745 2.78 0.033 05N014 10/3/2005 13:30 18 0.067 0.112 0.345 0.054 0.330 7.76 0.122 1.60 0.235 0.181 0.188 <0.667 2.13 <0.018 0.489 0.733 6.37 2.83 0.050 <3.06 <0.010 <0.521 3.32 0.020 05N017 11/18/2005 13:37 6 0.052 0.150 1.97 0.046 <0.200 5.95 0.060 0.741 0.220 0.137 0.195 <0.667 2.12 <0.018 0.305 1.18 5.13 2.20 <0.048 <3.06 <0.010 0.741 1.51 0.021
Average 2004-2005 14 0.074 0.205 0.797 0.083 <1.36 6.60 0.129 1.43 0.224 0.083 0.181 <2.01 1.92 <0.030 0.294 1.39 7.19 2.90 <0.093 <9.93 <0.010 <0.836 2.97 0.034 (a) Akalinity. (b) Total inorganic suspended particulate matter.

41
y = 0.3247x1.8383
R2 = 0.362
0
20
40
60
80
100
0.0 5.0 10.0 15.0
Discharge (m3/s)
SPM
(mg/
l)y = 53.474x0.8632
R2 = 0.5433
0
200
400
600
800
1000
0.0 5.0 10.0 15.0
Discharge (m 3/s)
POC
(µg/
kg)
y = 0.2574x0.0272
R2 = 0.0172
0.000
0.100
0.200
0.300
0.400
0.0 5.0 10.0 15.0
Discharge (m 3/s)
Na
(mm
ol/l)
y = 0.0148x0.0472
R2 = 0.0261
0.000
0.005
0.010
0.015
0.020
0.025
0.0 5.0 10.0 15.0
Discharge (m 3/s)
K (m
mol
/l)
y = 0.1537x-0.0015
R2 = 3E-05
0.000
0.040
0.080
0.120
0.160
0.200
0.0 5.0 10.0 15.0
Discharge (m 3/s)
Ca
(mm
ol/l)
y = 0.1148x0.1098
R2 = 0.1203
0.000
0.040
0.080
0.120
0.160
0.200
0.0 5.0 10.0 15.0
Discharge (m 3/s)
Mg
(mm
ol/l)
y = 0.0056x0.4636
R2 = 0.4244
0.000
0.005
0.010
0.015
0.020
0.0 5.0 10.0 15.0
Discharge (m 3/s)
SO4 (
mm
ol/l)
y = 0.1609x0.151
R2 = 0.1393
0.000
0.100
0.200
0.300
0.400
0.0 5.0 10.0 15.0
Discharge (m 3/s)
Cl (
mm
ol/l)
Figure 8. Concentration versus discharge correlations in River Vídidalsá 2004-2005.

42
y = 0.6315x0.008
R2 = 0.0007
0.000
0.200
0.400
0.600
0.800
0.0 5.0 10.0 15.0
Discharge (m 3/s)
Alk
alin
ity (m
eq/k
g)
y = 0.2673x0.0726
R2 = 0.1032
0.000
0.100
0.200
0.300
0.400
0.0 5.0 10.0 15.0
Discharge (m 3/s)
SiO
2 (m
mol
/l)
Concentrations corrected for precipitation (except Mo):
y = 0.1274x-0.2244
R2 = 0.1201
0.000
0.030
0.060
0.090
0.120
0.150
0.0 5.0 10.0 15.0
Discharge (m3/s)
Na
(mm
ol/l)
y = 0.0117x0.013
R2 = 0.0009
0.000
0.005
0.010
0.015
0.020
0.0 5.0 10.0 15.0
Discharge (m3/s)
K (m
mol
/l)
y = 0.141x-0.0063
R2 = 0.0004
0.000
0.040
0.080
0.120
0.160
0.200
0.0 5.0 10.0 15.0
Discharge (m3/s)
Ca
(mm
ol/l)
y = 0.0992x0.101
R2 = 0.0878
0.000
0.040
0.080
0.120
0.160
0.0 5.0 10.0 15.0
Discharge (m 3/s)
Mg
(mm
ol/l)
-0.005
-0.003
0.000
0.003
0.005
0.008
0.0 5.0 10.0 15.0
Discharge (m3/s)
SO4 (m
mol
/l)
y = 1.9129x-0.5134
R2 = 0.8988
0.00
0.25
0.50
0.75
1.00
1.25
0.0 5.0 10.0 15.0
Discharge (m 3/s)
Mo
(nm
ol/l)
Figure 9. Rock derived concentration versus discharge correlations in River Vídidalsá 2004-2005.

43
0
20
40
60
80
100
01/04 06/04 12/04 06/05 12/05
SPM
(mg/
l)
0
200
400
600
800
1000
01/04 06/04 12/04 06/05 12/05
POC
(µg/
kg)
0.200
0.240
0.280
0.320
0.360
01/04 06/04 12/04 06/05 12/05
Na
(mm
ol/l)
0.010
0.012
0.014
0.016
0.018
0.020
01/04 06/04 12/04 06/05 12/05
K (m
mol
/l)
0.100
0.120
0.140
0.160
0.180
0.200
01/04 06/04 12/04 06/05 12/05
Ca
(mm
ol/l)
0.100
0.120
0.140
0.160
0.180
01/04 06/04 12/04 06/05 12/05
Mg
(mm
ol/l)
0.100
0.150
0.200
0.250
0.300
0.350
01/04 06/04 12/04 06/05 12/05
Cl (
mm
ol/l)
0.25
0.50
0.75
1.00
1.25
01/04 06/04 12/04 06/05 12/05
Mo
(nm
ol/l)
Figure 10. Time series for River Vídidalsá for 2004-2005.
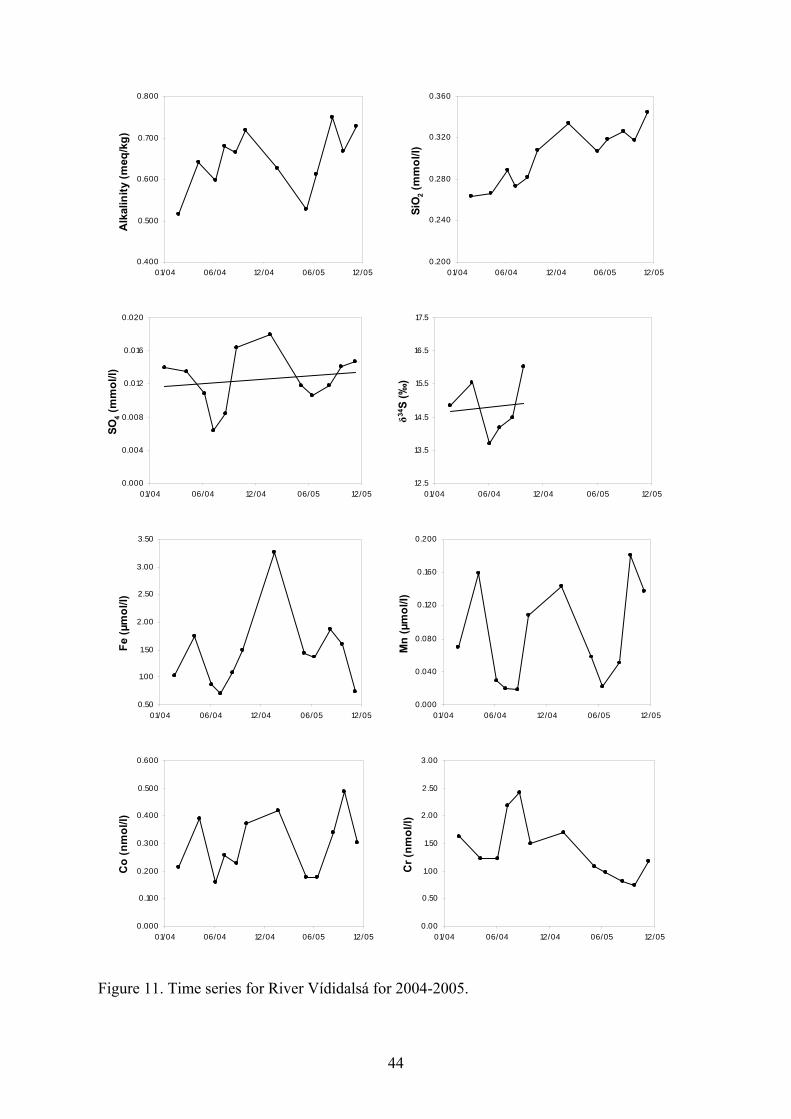
44
0.400
0.500
0.600
0.700
0.800
01/04 06/04 12/04 06/05 12/05
Alk
alin
ity (m
eq/k
g)
0.200
0.240
0.280
0.320
0.360
01/04 06/04 12/04 06/05 12/05
SiO
2 (m
mol
/l)
0.000
0.004
0.008
0.012
0.016
0.020
01/04 06/04 12/04 06/05 12/05
SO4 (
mm
ol/l)
12.5
13.5
14.5
15.5
16.5
17.5
01/04 06/04 12/04 06/05 12/05
δ34 S
(‰)
0.50
1.00
1.50
2.00
2.50
3.00
3.50
01/04 06/04 12/04 06/05 12/05
Fe (µ
mol
/l)
0.000
0.040
0.080
0.120
0.160
0.200
01/04 06/04 12/04 06/05 12/05
Mn
(µm
ol/l)
0.000
0.100
0.200
0.300
0.400
0.500
0.600
01/04 06/04 12/04 06/05 12/05
Co
(nm
ol/l)
0.00
0.50
1.00
1.50
2.00
2.50
3.00
01/04 06/04 12/04 06/05 12/05
Cr (
nmol
/l)
Figure 11. Time series for River Vídidalsá for 2004-2005.

45
Figu
re 1
2. D
isch
arga
of R
iver
Vat
nsda
lsá
at F
orsa
elud
alur
for 2
004
and
2005
. R
ed li
nes s
how
whe
n sa
mpl
es w
ere
take
n.

46
Table 6. Chemical composition, discharge and suspended matter in River Vatnsdalsá in 2004-2005. Sample Date Discharge Water Air pH T °C Cond. SiO2 Na K Ca Mg Alk (a) DIC SO4 SO4 ∂34S Cl F Charge Error TDS TDS DOC POC PON C/N number m3/s T °C T °C (pH/cond.) µS/cm mmol/l mmol/l mmol/l mmol/l mmol/l meq./kg mmol/l mmol/l mmol/l ‰ mmol/l µmol/l balance % mg/l mg/kg mmol/l µg/kg µg/kg mol
ICP-AES I.chrom I.chrom I.chrom meas. calc. 04N005 2/26/2004 18:15 9.0 0.0 -8.9 7.54 19.3 96 0.323 0.377 0.025 0.148 0.117 0.720 0.770 0.015 0.017 11.2 0.181 4.69 -0.01 0.4 74 92 0.052 04N006 5/7/2004 8:20 9.1 1.8 2.8 7.48 23.1 107 0.301 0.329 0.022 0.128 0.101 0.537 0.578 0.013 0.015 11.7 0.149 4.56 0.09 5.8 57 75 0.045 335 44.3 8.84 04N011 7/5/2004 13:10 8.4 11.3 15.8 7.87 23.4 92 0.316 0.357 0.025 0.142 0.111 0.685 0.705 0.012 0.014 11.0 0.148 5.19 0.02 1.3 74 85 0.062 235 37.7 7.28 04N014 8/5/2004 14:20 6.0 10.9 16.2 8.14 19.8 92 0.304 0.390 0.024 0.147 0.109 0.773 0.787 0.011 0.013 11.2 0.147 5.07 -0.03 1.4 74 90 0.053 235 26.1 10.5 04N017 9/15/2004 17:10 5.5 5.4 11.0 7.85 21.8 102 0.313 0.393 0.024 0.146 0.107 0.807 0.834 0.009 0.014 10.7 0.150 4.98 -0.06 3.4 73 93 0.042 294 32.1 10.7 04N020 10/21/2004 15:15 6.1 0.0 -3.3 7.54 23.6 110 0.352 0.428 0.026 0.154 0.120 0.797 0.849 0.013 0.016 11.1 0.177 4.99 -0.01 0.4 85 100 0.041 234 28.9 9.44 05N003 2/10/2005 17:55 8.2 -0.2 -1.6 7.80 21.2 98 0.377 0.393 0.026 0.149 0.127 0.723 0.749 0.016 0.014 0.179 3.56 0.03 1.7 80 95 0.047 328 44.5 8.60 05N006 5/23/2005 17:13 8.2 4.3 5.4 7.98 19.8 85 0.342 0.363 0.025 0.133 0.108 0.660 0.676 0.013 0.011 0.134 3.54 0.05 2.8 67 84 0.035 252 32.6 9.03 05N009 6/29/2005 19:15 7.2 11.7 14.1 8.18 20.9 89 0.360 0.358 0.027 0.132 0.105 0.721 0.731 0.014 0.011 0.130 3.75 -0.02 1.3 62 89 0.052 240 27.5 10.2 05N012 8/25/2005 16:25 8.0 4.0 4.5 8.08 20.2 99 0.374 0.384 0.026 0.159 0.133 0.813 0.829 0.014 0.011 0.144 3.73 0.00 0.2 61 98 0.082 369 32.3 13.3 05N015 10/3/2005 15:23 10.9 2.5 6.2 7.73 20.4 97 0.355 0.358 0.024 0.156 0.130 0.771 0.805 0.014 0.011 0.144 3.24 0.01 0.4 63 95 0.063 941 96.4 11.4 05N018 11/18/2005 15:55 8.2 0.8 2.9 7.63 21.7 96 0.370 0.388 0.027 0.153 0.122 0.793 0.836 0.015 0.013 0.142 3.68 0.00 0.2 69 98 0.039 538 53.4 11.8 Average 2004-2005 7.9 4.4 5.4 7.82 21.3 97 0.341 0.377 0.025 0.146 0.116 0.733 0.763 0.013 0.013 11.1 0.152 4.25 0.01 1.6 70 91 0.051 364 41.4 10.1 Sample Date SPM (b) P PO4-P NO3-N NO2-N NH4-N Ntotal Al Fe B Mn Sr As Ba Cd Co Cr Cu Ni Pb Zn Hg Mo Ti V number mg/l µmol/l µmol/l µmol/l µmol/l µmol/l µmol/l µmol/l µmol/l µmol/l µmol/l µmol/l nmol/l nmol/l nmol/l nmol/l nmol/l nmol/l nmol/l nmol/l nmol/l nmol/l nmol/l nmol/l µmol/l 04N005 2/26/2004 18:15 13 0.455 0.470 2.79 0.074 0.168 1.06 0.324 0.079 0.134 <0.667 2.23 0.040 0.403 4.98 5.92 3.46 <0.048 7.13 <0.010 2.54 4.53 0.283 04N006 5/7/2004 8:20 7 0.462 0.555 0.464 0.147 0.906 0.215 1.59 0.271 0.098 0.111 <0.667 1.98 0.049 0.350 4.71 8.21 4.58 0.080 54.0 <0.010 2.61 3.99 0.320 04N011 7/5/2004 13:10 2 0.387 0.351 0.213 0.065 1.03 0.274 1.70 0.307 0.012 0.126 <0.667 1.71 0.021 0.162 5.02 6.12 2.44 0.069 9.63 0.012 2.87 2.84 0.406 04N014 8/5/2004 14:20 2 0.247 0.232 0.435 0.089 0.272 7.04 0.356 2.18 0.320 0.017 0.124 3.22 1.40 0.020 0.364 6.77 5.92 2.25 0.118 10.0 <0.010 3.14 8.04 0.452 04N017 9/15/2004 17:10 9 0.234 0.189 1.56 0.120 9.30 6.93 0.108 1.38 0.312 0.011 0.122 2.34 1.42 <0.018 0.262 5.96 4.14 2.30 0.077 <3.06 <0.010 3.17 2.76 0.444 04N020 10/21/2004 15:15 3 0.358 1.19 1.05 0.131 0.785 13.0 0.158 1.27 0.338 0.027 0.128 1.60 1.49 0.036 0.239 5.98 6.04 2.62 0.095 7.43 <0.010 3.07 5.93 0.373 05N003 2/10/2005 17:55 14 0.494 0.437 2.75 0.051 0.434 7.46 0.171 1.79 0.314 0.090 0.128 <6.67 2.21 0.020 0.363 5.00 6.25 2.28 0.154 8.03 <0.010 2.27 4.28 0.304 05N006 5/23/2005 17:13 8 0.488 0.122 0.195 0.046 0.409 4.86 0.231 1.59 0.283 0.065 0.108 <2.67 1.37 <0.018 0.285 4.92 4.77 1.87 0.057 <3.06 <0.010 2.43 4.55 0.357 05N009 6/29/2005 19:15 1 0.446 0.160 0.178 0.036 0.316 6.46 0.304 1.83 0.324 0.015 0.114 3.03 1.58 <0.018 0.285 5.56 5.82 1.70 0.073 <3.06 <0.010 2.68 2.53 0.426 05N012 8/25/2005 16:25 5 0.267 0.236 0.170 0.049 0.305 4.91 0.161 2.35 0.283 0.028 0.136 2.03 1.41 <0.018 0.324 4.75 4.58 2.23 0.062 <3.06 <0.010 2.71 2.99 0.310 05N015 10/3/2005 15:23 6 0.278 0.274 0.120 0.054 0.434 5.61 0.147 1.57 0.287 0.078 0.145 1.19 2.01 <0.018 0.370 3.42 5.32 2.64 <0.048 <3.06 <0.010 2.15 3.97 0.241 05N018 11/18/2005 15:55 11 0.394 0.417 2.73 0.044 <0.200 7.95 0.102 0.774 0.326 0.039 0.123 0.806 2.13 <0.018 0.158 4.50 4.78 1.74 <0.048 <3.06 <0.010 2.58 2.72 0.294
Average 2004-2005 7 0.376 0.386 1.06 0.075 <1.31 7.14 0.200 1.59 0.307 0.047 0.125 <2.13 1.75 <0.024 0.297 5.13 5.66 2.51 <0.078 <9.55 <0.010 2.68 4.09 0.351 (a) Alkalinity. (b) Total inorganic suspended particulate matter.

47
y = 0.239x1.4952
R2 = 0.1209
0
2
4
6
8
10
12
14
16
0.0 5.0 10.0 15.0
Discharge (m 3/s)
SPM
(mg/
l)y = 17.793x1.4322
R2 = 0.4433
0
200
400
600
800
1000
0.0 5.0 10.0 15.0
Discharge (m 3/s)
POC
(µg/
kg)
y = 0.5824x-0.2139
R2 = 0.394
0.000
0.100
0.200
0.300
0.400
0.500
0.0 5.0 10.0 15.0
Discharge (m 3/s)
Na
(mm
ol/l)
y = 0.0271x-0.0405
R2 = 0.0158
0.000
0.005
0.010
0.015
0.020
0.025
0.030
0.0 5.0 10.0 15.0
Discharge (m 3/s)
K (m
mol
/l)
y = 0.1499x-0.0153
R2 = 0.00190.000
0.040
0.080
0.120
0.160
0.200
0.0 5.0 10.0 15.0
Discharge (m 3/s)
Ca
(mm
ol/l)
y = 0.0856x0.1457
R2 = 0.10360.000
0.030
0.060
0.090
0.120
0.150
0.0 5.0 10.0 15.0
Discharge (m 3/s)
Mg
(mm
ol/l)
y = 0.0045x0.5209
R2 = 0.4642
0.000
0.005
0.010
0.015
0.020
0.0 5.0 10.0 15.0
Discharge (m 3/s)
SO4 (
mm
ol/l)
y = 0.1601x-0.0278
R2 = 0.00250.000
0.050
0.100
0.150
0.200
0.0 5.0 10.0 15.0
Discharge (m 3/s)
Cl (
mm
ol/l)
Figure 13. Concentration versus discharge correlations in River Vatnsdalsá 2004-2005.

48
y = 1.2056x-0.2457
R2 = 0.1728
0.000
0.200
0.400
0.600
0.800
1.000
0.0 5.0 10.0 15.0
Discharge (m 3/s)
Alk
alin
ity (m
eq/k
g)
y = 0.2809x0.0925
R2 = 0.049
0.000
0.100
0.200
0.300
0.400
0.500
0.0 5.0 10.0 15.0
Discharge (m 3/s)
SiO
2 (m
mol
/l)
Concentrations corrected for precipitation (except Mo):
y = 0.4705x-0.3186
R2 = 0.4765
0.000
0.050
0.100
0.150
0.200
0.250
0.300
0.0 5.0 10.0 15.0
Discharge (m3/s)
Na
(mm
ol/l)
y = 0.0241x-0.043
R2 = 0.0133
0.000
0.005
0.010
0.015
0.020
0.025
0.030
0.0 5.0 10.0 15.0
Discharge (m3/s)
K (m
mol
/l)
y = 0.1374x-0.0168
R2 = 0.00190.000
0.040
0.080
0.120
0.160
0.0 5.0 10.0 15.0
Discharge (m3/s)
Ca
(mm
ol/l)
y = 0.0711x0.1687
R2 = 0.11650.000
0.030
0.060
0.090
0.120
0.150
0.0 5.0 10.0 15.0
Discharge (m 3/s)
Mg
(mm
ol/l)
y = 0.0002x1.6878
R2 = 0.5457
0.000
0.002
0.004
0.006
0.008
0.010
0.0 5.0 10.0 15.0
Discharge (m3/s)
SO4 (m
mol
/l)
y = 7.9932x-0.5359
R2 = 0.7454
0.00
1.00
2.00
3.00
4.00
0.0 5.0 10.0 15.0
Discharge (m 3/s)
Mo
(nm
ol/l)
Figure 14. Rock derived concentration versus discharge correlations in River Vatnsdalsá 2004-2005.

49
0
2
4
6
8
10
12
14
16
01/04 06/04 12/04 06/05 12/05
SPM
(mg/
l)
0
200
400
600
800
1000
01/04 06/04 12/04 06/05 12/05
POC
(µg/
kg)
0.300
0.330
0.360
0.390
0.420
0.450
01/04 06/04 12/04 06/05 12/05
Na
(mm
ol/l)
0.020
0.022
0.024
0.026
0.028
0.030
01/04 06/04 12/04 06/05 12/05
K (m
mol
/l)
0.120
0.130
0.140
0.150
0.160
0.170
01/04 06/04 12/04 06/05 12/05
Ca
(mm
ol/l)
0.080
0.090
0.100
0.110
0.120
0.130
0.140
01/04 06/04 12/04 06/05 12/05
Mg
(mm
ol/l)
0.120
0.140
0.160
0.180
0.200
01/04 06/04 12/04 06/05 12/05
Cl (
mm
ol/l)
2.00
2.40
2.80
3.20
3.60
01/04 06/04 12/04 06/05 12/05
Mo
(nm
ol/l)
Figure 15. Time series for River Vatnsdalsá for 2004-2005.

50
0.450
0.550
0.650
0.750
0.850
01/04 06/04 12/04 06/05 12/05
Alk
alin
ity (m
eq/k
g)
0.280
0.300
0.320
0.340
0.360
0.380
0.400
01/04 06/04 12/04 06/05 12/05
SiO
2 (m
mol
/l)
0.008
0.010
0.012
0.014
0.016
0.018
01/04 06/04 12/04 06/05 12/05
SO4 (
mm
ol/l)
10.0
10.5
11.0
11.5
12.0
01/04 06/04 12/04 06/05 12/05
δ34 S
(‰)
0.00
0.50
1.00
1.50
2.00
2.50
3.00
01/04 06/04 12/04 06/05 12/05
Fe (µ
mol
/l)
0.000
0.020
0.040
0.060
0.080
0.100
0.120
01/04 06/04 12/04 06/05 12/05
Mn
(µm
ol/l)
0.100
0.200
0.300
0.400
0.500
01/04 06/04 12/04 06/05 12/05
Co
(nm
ol/l)
3.00
4.00
5.00
6.00
7.00
01/04 06/04 12/04 06/05 12/05
Cr (
nmol
/l)
Figure 16. Time series for River Vatnsdalsá for 2004-2005.
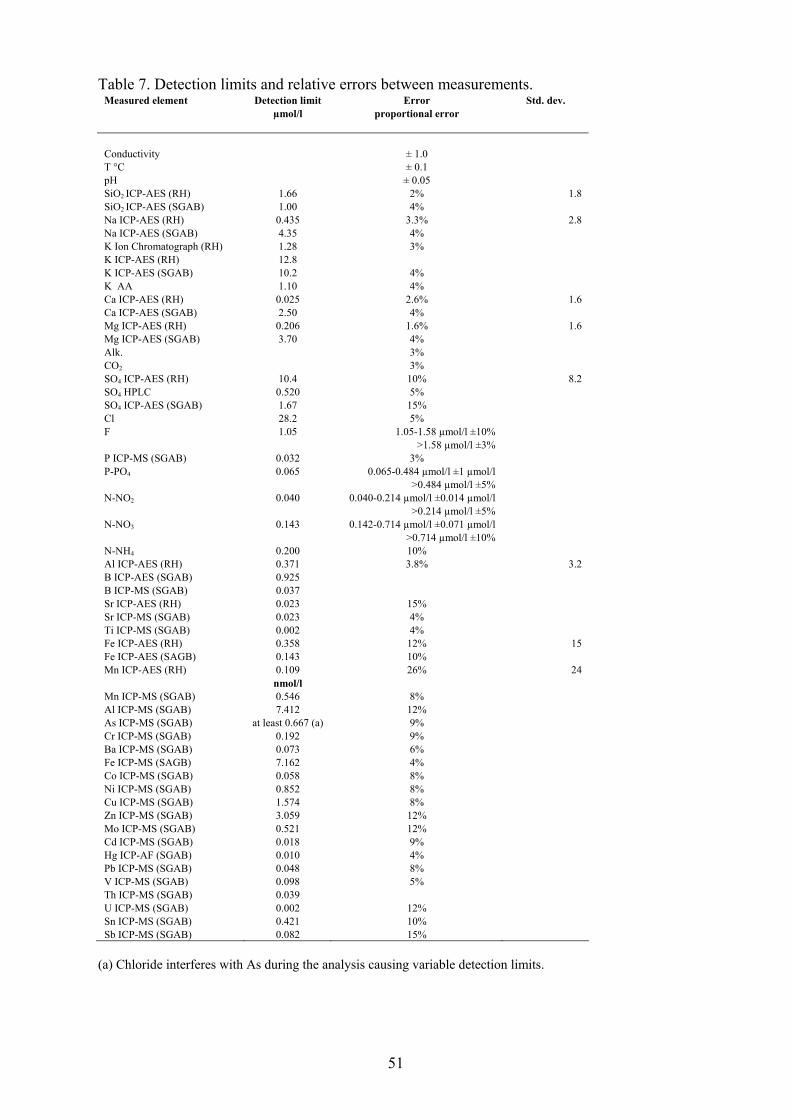
51
Table 7. Detection limits and relative errors between measurements. Measured element Detection limit Error Std. dev. µmol/l proportional error Conductivity ± 1.0 T °C ± 0.1 pH ± 0.05 SiO2 ICP-AES (RH) 1.66 2% 1.8 SiO2 ICP-AES (SGAB) 1.00 4% Na ICP-AES (RH) 0.435 3.3% 2.8 Na ICP-AES (SGAB) 4.35 4% K Ion Chromatograph (RH) 1.28 3% K ICP-AES (RH) 12.8 K ICP-AES (SGAB) 10.2 4% K AA 1.10 4% Ca ICP-AES (RH) 0.025 2.6% 1.6 Ca ICP-AES (SGAB) 2.50 4% Mg ICP-AES (RH) 0.206 1.6% 1.6 Mg ICP-AES (SGAB) 3.70 4% Alk. 3% CO2 3% SO4 ICP-AES (RH) 10.4 10% 8.2 SO4 HPLC 0.520 5% SO4 ICP-AES (SGAB) 1.67 15% Cl 28.2 5% F 1.05 1.05-1.58 µmol/l ±10% >1.58 µmol/l ±3% P ICP-MS (SGAB) 0.032 3% P-PO4 0.065 0.065-0.484 µmol/l ±1 µmol/l >0.484 µmol/l ±5% N-NO2 0.040 0.040-0.214 µmol/l ±0.014 µmol/l >0.214 µmol/l ±5% N-NO3 0.143 0.142-0.714 µmol/l ±0.071 µmol/l >0.714 µmol/l ±10% N-NH4 0.200 10% Al ICP-AES (RH) 0.371 3.8% 3.2 B ICP-AES (SGAB) 0.925 B ICP-MS (SGAB) 0.037 Sr ICP-AES (RH) 0.023 15% Sr ICP-MS (SGAB) 0.023 4% Ti ICP-MS (SGAB) 0.002 4% Fe ICP-AES (RH) 0.358 12% 15 Fe ICP-AES (SAGB) 0.143 10% Mn ICP-AES (RH) 0.109 26% 24 nmol/l Mn ICP-MS (SGAB) 0.546 8% Al ICP-MS (SGAB) 7.412 12% As ICP-MS (SGAB) at least 0.667 (a) 9% Cr ICP-MS (SGAB) 0.192 9% Ba ICP-MS (SGAB) 0.073 6% Fe ICP-MS (SAGB) 7.162 4% Co ICP-MS (SGAB) 0.058 8% Ni ICP-MS (SGAB) 0.852 8% Cu ICP-MS (SGAB) 1.574 8% Zn ICP-MS (SGAB) 3.059 12% Mo ICP-MS (SGAB) 0.521 12% Cd ICP-MS (SGAB) 0.018 9% Hg ICP-AF (SGAB) 0.010 4% Pb ICP-MS (SGAB) 0.048 8% V ICP-MS (SGAB) 0.098 5% Th ICP-MS (SGAB) 0.039 U ICP-MS (SGAB) 0.002 12% Sn ICP-MS (SGAB) 0.421 10% Sb ICP-MS (SGAB) 0.082 15%
(a) Chloride interferes with As during the analysis causing variable detection limits.