Embed Size (px)
Citation preview
Chemical Interaction and Enhanced Interfacial Ion Transport in Ceramic Nanofiber-Polymer Composite Electrolyte for All-Solid-State Lithium Metal Battery
Journal: Journal of Materials Chemistry A
Manuscript ID TA-ART-11-2019-012495.R1
Article Type: Paper
Date Submitted by the Author: 22-Jan-2020
Complete List of Authors: Yang, Hui; West Virginia UniversityBright, Joeseph; West Virginia University, Department of Mechanical and Aerospace EngineeringChen, Banghao; Florida Stat UniversityZheng, Peng; West Virginia UniversityGao, Xuefei; West Virginia University, Department of Mechanical and Aerospace EngineeringLiu, Botong; West Virginia University, Department of Mechanical and Aerospace EngineeringKasani, Sujan; West Virginia University College of Engineering and Mineral Resources, Lane Department of Computer Science and Electrical EngineeringZhang, Xiangwu; North Carolina State University, Fiber and Polymer ScienceWu, Nianqiang; West Virginia University,
Journal of Materials Chemistry A
1
Chemical Interaction and Enhanced Interfacial Ion
Transport in Ceramic Nanofiber-Polymer Composite
Electrolyte for All-Solid-State Lithium Metal Battery
Hui Yang1, Joeseph Bright1, Banghao Chen2, Peng Zheng1, Xuefei Gao1, Botong Liu1, Sujan Kasani1,
Xiangwu Zhang3, and Nianqiang Wu1,4,*,#
1Department of Mechanical and Aerospace Engineering, West Virginia University, Morgantown, WV 26506-6106, United States
2Chem & BioChem Department, Florida State University, Tallahassee, Florida, 32306, USA
3Fiber and Polymer Science Program, Department of Textile Engineering, Chemistry and Science, Wilson College of Textiles, North Carolina State University, Raleigh, NC 27695-8301, United States
4C. Eugene Bennett Department of Chemistry, West Virginia University, Morgantown, WV 26506-6045, USA
*To whom the correspondence should be addressed. Tel: +1-413-545-6175, E-mail: [email protected]
#Current address: Department of Chemical Engineering, University of Massachusetts Amherst, Amherst, MA 01003-9303, United States
Page 1 of 30 Journal of Materials Chemistry A

2
ABSTRACT
This paper has reported the synergy between the ceramic nanofibers and the polymer, and the
enhanced interfacial Li-ion transport along the nanofiber/polymer interface in a solid-state
ceramic/polymer composite electrolyte, at which three-dimensional (3D) electrospun aluminum-doped
Li0.33La0.557TiO3 (LLTO) nanofiber network is embedded in polyvinylidiene fluoride-
hexafluoropropylene (PVDF-HFP) matrix. Strong chemical interaction occurs between the nanofibers
and the polymer matrix. Addition of the ceramic nanofibers into the polymer matrix results in the
dehydrofluorination of PVDF chains, deprotonation of the -CH2 moiety and amorphization of the
polymer matrix. Solid-state nuclear magnetic resonance (NMR) spectra reveal that lithium ions
transport via three pathways: (i) intra-polymer transport, (ii) intra-nanofiber transport, and (iii)
interfacial polymer/nanofiber transport. In addition, lithium phosphate has been coated on the LLTO
nanofiber surface before the nanofibers are embedded into the polymer matrix. The presence of lithium
phosphate at the LLTO/polymer interface further enhances the chemical interaction between the
nanofibers and the polymer, which promotes the lithium ion transport along the polymer/nanofiber
interface. This in turn improves the ionic conductivity and electrochemical cyclic stability of the
nanofiber/polymer composite. As a result, the flexible LLTO/Li3PO4/polymer composite electrolyte
membrane exhibits ionic conductivity of 5.1×10⁻⁴ S/cm at room temperature and an electrochemical
stability window of 5.0 V vs. Li/Li+. The symmetric Li|electrolyte|Li half-cell shows a low overpotential
of 50 mV at a constant current density of 0.5 mA/cm2 for more than 800 h. In addition, a full cell is
constructed by sandwiching the composite electrolyte between a lithium metal anode and a LiFePO4-
based cathode. Such an all-solid-state lithium metal battery exhibits excellent cycling performance and
rate capability.
KEYWORDS: Solid-state electrolyte; ceramic-polymer composite; ion transport; lithium battery;
interface
Page 2 of 30Journal of Materials Chemistry A
3
INTRODUCTION
Currently commercial lithium-ion batteries use liquid electrolytes that contain flammable substrates.
This raises a concern on operational safety. Use of solid-state electrolytes is an alternative solution to
flammable liquid electrolytes, which improves the chemical and thermal stability of Li-ion batteries.
Researchers have been developing different types of solid-state electrolytes including ceramics,
polymers, and ceramic-polymer composites. Ceramic electrolytes have much higher ionic conductivity
than polymers. However, it is difficult to integrate ceramic electrolytes with electrodes due to large
contact interfacial resistances.1,2 In addition, the stability of ceramic electrolytes such as
Li0.33La0.557TiO3 (LLTO) is still of concern3. Dendrites can be formed at the Li metal
electrode/electrolyte interface in ceramic electrolyte-based batteries if there is poor contact and/or exist
defects in the ceramic electrolytes.4,5 In contrast, polymer electrolytes are convenient for machining and
integration with electrodes. However, current polymer electrolytes show poor ionic conductivity.6-8 For
example, the lithium salt-stuffed polyethyleneoxide (PEO) exhibits ionic conductivity on the order of
10-6-10-9 S/cm at room temperature.9,10 To utilize the merits of both ceramic and polymers and to
compensate their shortcomings, inorganic fillers are incorporated into polymers to form solid-state
ceramic-polymer composite electrolytes. These inorganic fillers not only enhance the ionic conductivity,
but are also beneficial to integration of electrolytes with electrodes. It has been reported that inorganic
spherical particles including active lithium ion conductors (Li3N1611), LLTO12 and inactive fillers
(Al2O313 and SiO2
14) have been added into the polymers, which increases mechanical strength,
suppresses crystallization of polymer matrix, and improves ionic conductivity and cyclic stability.
However, agglomeration of particles usually happens in the ceramic-polymer composites when a large
content of inorganic particles are added into polymer matrix. Particle agglomeration leads to non-
uniform presence of large amount of crystallized polymer in different regions of the electrolyte15, 16. In
contrast, long ceramic nanofibers can form a three-dimensional (3D) uniform network within the
polymer matrix in the nanofiber-polymer composite, eliminating the particle agglomeration problem.
Page 3 of 30 Journal of Materials Chemistry A

4
The 3D inorganic nanofiber network not only improves the mechanical strength of the electrolyte
membrane, but also provides continuous ion transport channels through the inter-woven inorganic
nanofibers or along the nanofiber/polymer interface. Therefore, solid-state inorganic nanofiber-polymer
composite electrolytes have aroused considerable research interest17-20.
So far the ionic conductivity (10-5 ~10-4 S/cm) of the state-of-the-art solid-state inorganic nanofiber-
polymer composite electrolytes are two orders of magnitude lower than that (110-2 S/cm) of
conventional liquid electrolytes used in commercial lithium-ion batteries. To improve their ionic
conductivity, extensive study has been focused on enhancing the ionic conductivity of both ceramic
fillers and polymer matrix. Few studies have focused on the interface between ceramic fillers and
polymer matrix.21-25 The ceramic/polymer interface needs to be engineered to enable the interaction and
synergy between ceramic and polymers. On the other hand, the chemical interaction of polymer with
ceramic remains poorly characterized. In addition, the lithium ion transport pathway in the ceramic-
polymer composite electrolytes needs to understood.
To address the issues above, a solid-state ceramic nanofiber-polymer composite electrolyte is
developed, in which a lithium phosphate (Li3PO4) modified three-dimensional (3D) LLTO nanofiber
network is embedded into a polyvinylidiene fluoride-hexafluoropropylene (PVDF-HFP) polymer matrix.
PVDF-HFP is chosen as the composite matrix because it has higher Li-ion conductivity than PEO.
PVDF-HFP has relatively lower crystallinity due to the copolymerization effect between VDF and HFP
in comparison with poly(vinylidene fluoride) (PVDF). To enhance the ionic conductivity of the
pervoskite-type LLTO nanofibers, Al is doped into LLTO with different concentrations (Li0.33La0.557Ti1-
xAlxO3 (LLATO), x=0.005, 0.01, 0.015, 0.05, 0.1 are named as LLATO, LLATO-1, LLATO-2,
LLATO-3, LLATO-4, respectively). In addition, a layer of Li3PO4 is coated on the surface of LLATO
nanofibers to enhance the chemical interaction between nanofibers and polymer and to improve the
ionic conductivity of composite electrolyte. This study also aims to gain fundamental understanding of
Page 4 of 30Journal of Materials Chemistry A
5
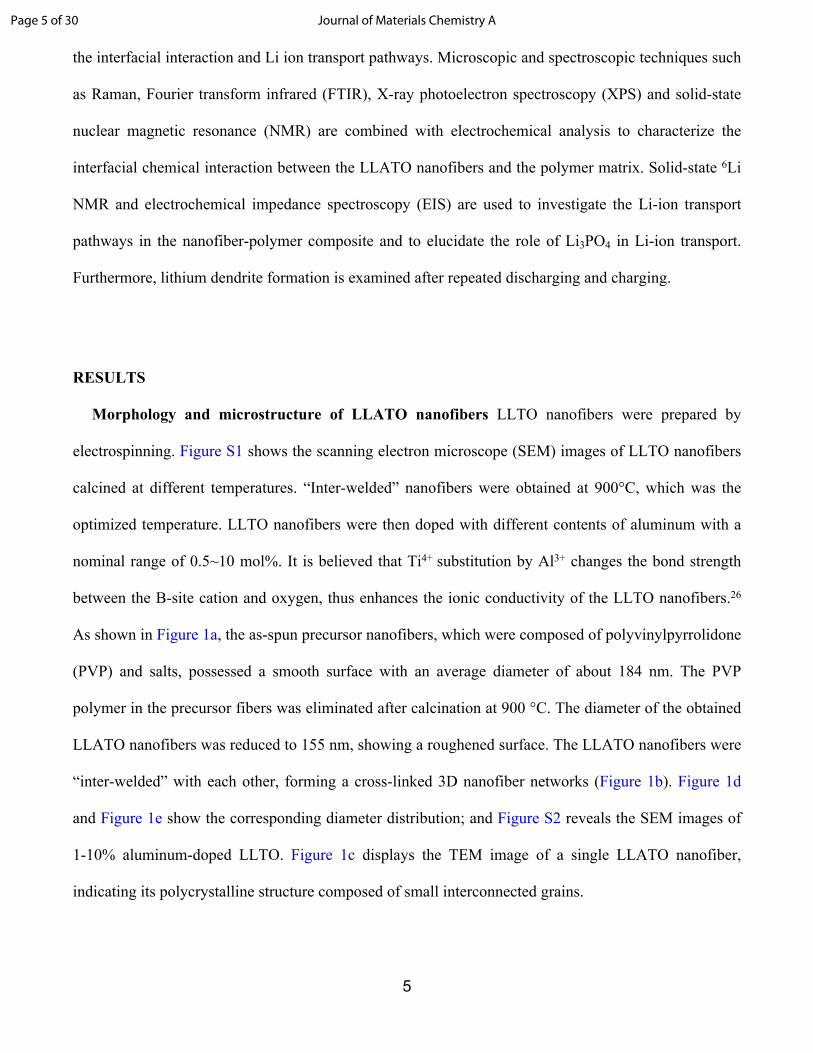
the interfacial interaction and Li ion transport pathways. Microscopic and spectroscopic techniques such
as Raman, Fourier transform infrared (FTIR), X-ray photoelectron spectroscopy (XPS) and solid-state
nuclear magnetic resonance (NMR) are combined with electrochemical analysis to characterize the
interfacial chemical interaction between the LLATO nanofibers and the polymer matrix. Solid-state 6Li
NMR and electrochemical impedance spectroscopy (EIS) are used to investigate the Li-ion transport
pathways in the nanofiber-polymer composite and to elucidate the role of Li3PO4 in Li-ion transport.
Furthermore, lithium dendrite formation is examined after repeated discharging and charging.
RESULTS
Morphology and microstructure of LLATO nanofibers LLTO nanofibers were prepared by
electrospinning. Figure S1 shows the scanning electron microscope (SEM) images of LLTO nanofibers
calcined at different temperatures. “Inter-welded” nanofibers were obtained at 900°C, which was the
optimized temperature. LLTO nanofibers were then doped with different contents of aluminum with a
nominal range of 0.5~10 mol%. It is believed that Ti4+ substitution by Al3+ changes the bond strength
between the B-site cation and oxygen, thus enhances the ionic conductivity of the LLTO nanofibers.26
As shown in Figure 1a, the as-spun precursor nanofibers, which were composed of polyvinylpyrrolidone
(PVP) and salts, possessed a smooth surface with an average diameter of about 184 nm. The PVP
polymer in the precursor fibers was eliminated after calcination at 900 °C. The diameter of the obtained
LLATO nanofibers was reduced to 155 nm, showing a roughened surface. The LLATO nanofibers were
“inter-welded” with each other, forming a cross-linked 3D nanofiber networks (Figure 1b). Figure 1d
and Figure 1e show the corresponding diameter distribution; and Figure S2 reveals the SEM images of
1-10% aluminum-doped LLTO. Figure 1c displays the TEM image of a single LLATO nanofiber,
indicating its polycrystalline structure composed of small interconnected grains.
Page 5 of 30 Journal of Materials Chemistry A
6
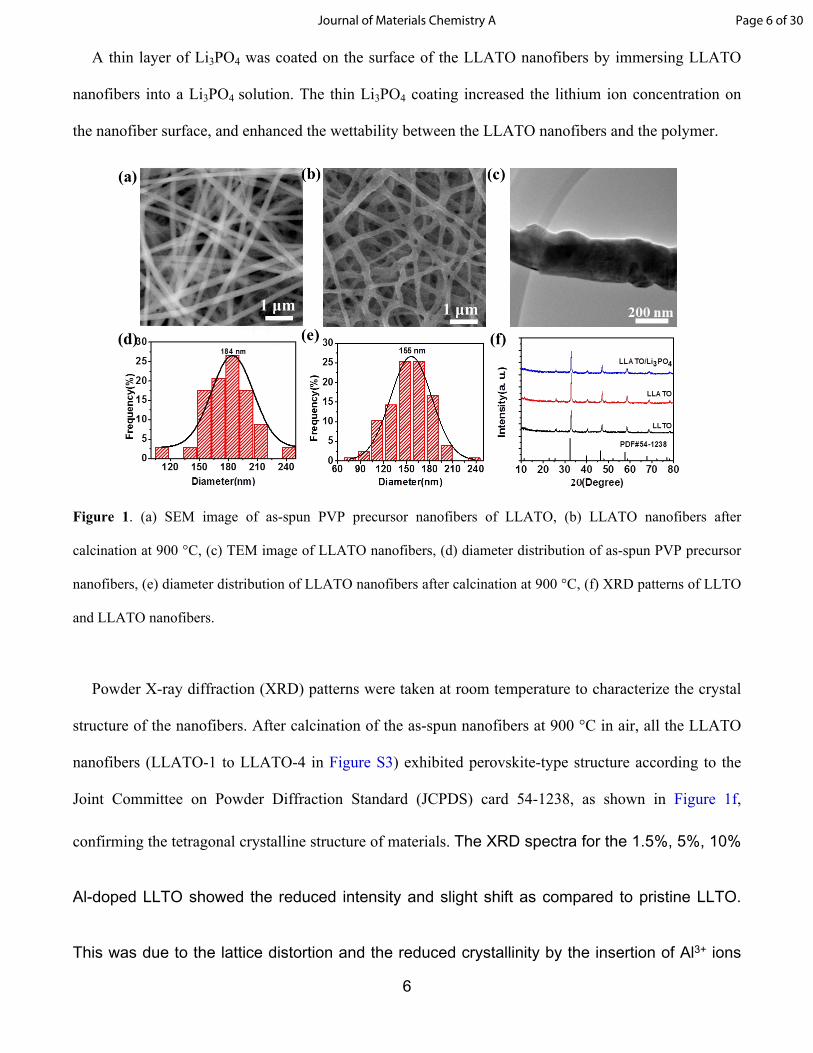
A thin layer of Li3PO4 was coated on the surface of the LLATO nanofibers by immersing LLATO
nanofibers into a Li3PO4 solution. The thin Li3PO4 coating increased the lithium ion concentration on
the nanofiber surface, and enhanced the wettability between the LLATO nanofibers and the polymer.
Figure 1. (a) SEM image of as-spun PVP precursor nanofibers of LLATO, (b) LLATO nanofibers after
calcination at 900 °C, (c) TEM image of LLATO nanofibers, (d) diameter distribution of as-spun PVP precursor
nanofibers, (e) diameter distribution of LLATO nanofibers after calcination at 900 °C, (f) XRD patterns of LLTO
and LLATO nanofibers.
Powder X-ray diffraction (XRD) patterns were taken at room temperature to characterize the crystal
structure of the nanofibers. After calcination of the as-spun nanofibers at 900 °C in air, all the LLATO
nanofibers (LLATO-1 to LLATO-4 in Figure S3) exhibited perovskite-type structure according to the
Joint Committee on Powder Diffraction Standard (JCPDS) card 54-1238, as shown in Figure 1f,
confirming the tetragonal crystalline structure of materials. The XRD spectra for the 1.5%, 5%, 10%
Al-doped LLTO showed the reduced intensity and slight shift as compared to pristine LLTO.
This was due to the lattice distortion and the reduced crystallinity by the insertion of Al3+ ions
Page 6 of 30Journal of Materials Chemistry A
7
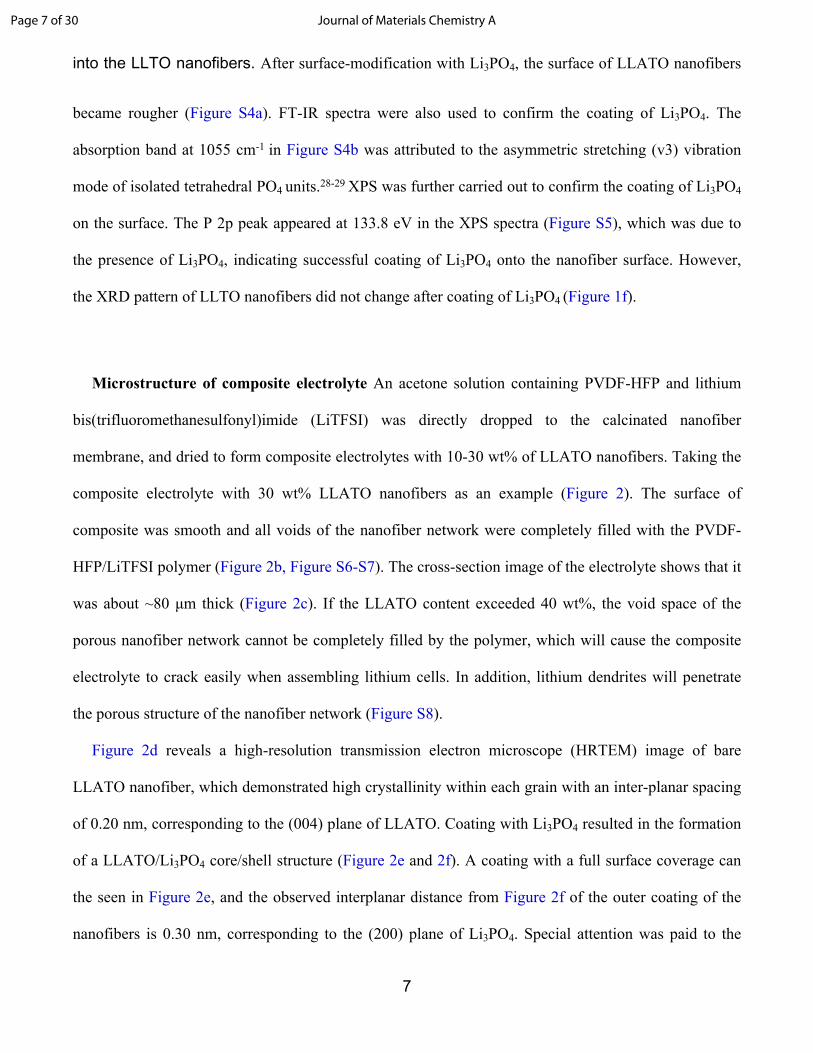
into the LLTO nanofibers. After surface-modification with Li3PO4, the surface of LLATO nanofibers
became rougher (Figure S4a). FT-IR spectra were also used to confirm the coating of Li3PO4. The
absorption band at 1055 cm-1 in Figure S4b was attributed to the asymmetric stretching (v3) vibration
mode of isolated tetrahedral PO4 units.28-29 XPS was further carried out to confirm the coating of Li3PO4
on the surface. The P 2p peak appeared at 133.8 eV in the XPS spectra (Figure S5), which was due to
the presence of Li3PO4, indicating successful coating of Li3PO4 onto the nanofiber surface. However,
the XRD pattern of LLTO nanofibers did not change after coating of Li3PO4 (Figure 1f).
Microstructure of composite electrolyte An acetone solution containing PVDF-HFP and lithium
bis(trifluoromethanesulfonyl)imide (LiTFSI) was directly dropped to the calcinated nanofiber
membrane, and dried to form composite electrolytes with 10-30 wt% of LLATO nanofibers. Taking the
composite electrolyte with 30 wt% LLATO nanofibers as an example (Figure 2). The surface of
composite was smooth and all voids of the nanofiber network were completely filled with the PVDF-
HFP/LiTFSI polymer (Figure 2b, Figure S6-S7). The cross-section image of the electrolyte shows that it
was about ~80 μm thick (Figure 2c). If the LLATO content exceeded 40 wt%, the void space of the
porous nanofiber network cannot be completely filled by the polymer, which will cause the composite
electrolyte to crack easily when assembling lithium cells. In addition, lithium dendrites will penetrate
the porous structure of the nanofiber network (Figure S8).
Figure 2d reveals a high-resolution transmission electron microscope (HRTEM) image of bare
LLATO nanofiber, which demonstrated high crystallinity within each grain with an inter-planar spacing
of 0.20 nm, corresponding to the (004) plane of LLATO. Coating with Li3PO4 resulted in the formation
of a LLATO/Li3PO4 core/shell structure (Figure 2e and 2f). A coating with a full surface coverage can
the seen in Figure 2e, and the observed interplanar distance from Figure 2f of the outer coating of the
nanofibers is 0.30 nm, corresponding to the (200) plane of Li3PO4. Special attention was paid to the
Page 7 of 30 Journal of Materials Chemistry A

8
interface between the inorganic nanofiber and the polymer. A clear and sharp boundary was observed
between the uncoated nanofiber and polymer in the PVDF-HFP/LiTFSI/LLATO composite electrolyte
(Figure 2g); and PVDF-HFP appeared amorphous while LLATO still retained its crystallinity. In
contrast, the boundary between the Li3PO4-coated nanofiber and polymer in the PVDF-
HFP/LiTFSI/LLATO/Li3PO4 composite electrolyte was no longer sharp and distinct (Figure 2h). There
was still a thin layer of Li3PO4 attached on the surface of the LLATO nanofibers. However, Li3PO4 was
found to penetrate into the amorphous PVDF-HFP polymer matrix, showing a gradient distribution of
Li3PO4 from the nanofiber surface to the polymer matrix.
Page 8 of 30Journal of Materials Chemistry A

9
Figure 2. (a) Photograph of the flexible and bendable PVDF-HFP/LiTFSI/LLATO membrane, (b) SEM image of
the surface of PVDF-HFP/LiTFSI/LLATO membrane, (c) cross-sectional SEM image of PVDF-
HFP/LiTFSI/LLATO membrane, (d) TEM image of LLATO nanofibers, (e) TEM, inset is zoomed view of the
marked box region, (f) HRTEM image of Li3PO4 LLATO nanofibers, (g) interface of PVDF-
HFP/LiTFSI/LLATO composite electrolyte, (h) interface of PVDF-HFP/LiTFSI/LLATO/Li3PO4 composite
electrolyte.
Page 9 of 30 Journal of Materials Chemistry A

10
Ionic conductivity of composite electrolyte The ionic conductivity of the composite electrolyte was
characterized with electrochemical impedance spectroscopy (EIS). EIS measurement was performed on
the composite electrolyte sandwiched between two stainless-steel blocking electrodes in the frequency
range from 1 Hz to 1MHz. Figure S9 shows the typical Nyquist plots of the composite electrolytes
based on LLATO nanofibers with different contents of aluminum doping. The real axis intercept at a
high frequency region was ascribed to the relaxation behavior in the bulk of composite electrolyte.
There was one well-defined semicircle in the intermediate frequency region, indicating no electrode
reaction at the electrode/electrolyte interfaces. The inclined straight tail in the low frequency region was
due to the migration of lithium lions and the surface in-homogeneity of the electrodes.30 The ionic
conductivity was calculated by the formula19:
(1)𝜎 =𝐿
𝑅𝐴
where L is the thickness of the composite electrolyte membrane, R is the resistance, and A is the
effective electrode area. Without aluminum doping, PVDF-HFP/LiTFSI/LLTO exhibited ionic
conductivity of 2.1 × 10⁻⁴ S/cm at room temperature. With 0.5% aluminum doping (Li0.33La0.557Ti1-
xAlxO3 (LLATO), x=0.005) in ceramic nanofibers, PVDF-HFP/LiTFSI/LLATO showed much higher
ionic conductivities of 4.0 × 10⁻⁴ S/cm. Gradually decrease in ionic conductivity was observed with
more aluminum doping (3.6 × 10⁻⁴ , 1.9 × 10⁻⁴, 1.1 × 10⁻⁴, 0.8 × 10⁻⁴ S/cm with LLATO-1 (x=0.01),
LLATO-2 (x=0.015), LLATO-3 (x=0.05), LLATO-4 (x=0.1), respectively). Figure 3a shows the
Nyquist plots of the PVDF-HFP/LiTFSI/LLATO composite electrolytes with 10-30 wt% LLATO. The
ionic conductivity of PVDF-HFP/LiTFSI composite electrolyte with 10%, 20% and 30% contents of
LLATO nanofibers were estimated to be 1.7×10⁻⁴ S/cm, 2.4×10⁻⁴ S/cm and 4.0×10⁻⁴ S/cm, respectively,
at room temperature. The ionic conductivity of the PVDF-HFP/LiTFSI/30%LLATO was four times
higher than that of the PVDF-HFP/LiTFSI electrolyte (1.110-4 S/cm). Obviosly the ionic conductivity
of composite electrolyte increased with an increase in the cermaic filler content. Coating with Li3PO4
Page 10 of 30Journal of Materials Chemistry A

11
further increased the ionic conductivity, leading to 5.1×10⁻⁴ S/cm for the PVDF-
HFP/LiTFSI/30%LLATO/Li3PO4 composite electrolyte.
Figure 3b shows the Arrhenius plot of the PVDF-HFP/LiTFSI/LLATO/Li3PO4 composite
electrolytes. The relationship between ionic conductivity and temperature follows the traditional
Arrhenius equation,
(2)σ(T) = a ∙ exp ( ―𝐸𝐴
𝑅𝑇)
where a is the pre-exponential factor, EA is the activation energy of the activated ion-hopping
conduction process, and R is the universal gas constant (8.314 J mol-1). Based on this equation, the
activation energy obtained was 0.23 eV for the PVDF-HFP/LiTFSI/30%LLATO electrolyte, and 0.22
eV for the PVDF-HFP/LiTFSI/LLATO/Li3PO4 electrolyte (Table 1).
Figure 3. (a) EIS plots of composite electrolytes with different contents of LLATO nanofibers. (b) Arrhenius
plots of the composite electrolytes. (c) Chronoamperometry profiles in Li/ PVDF-HFP/LiTFSI/LLATO /Li with a
Page 11 of 30 Journal of Materials Chemistry A
12
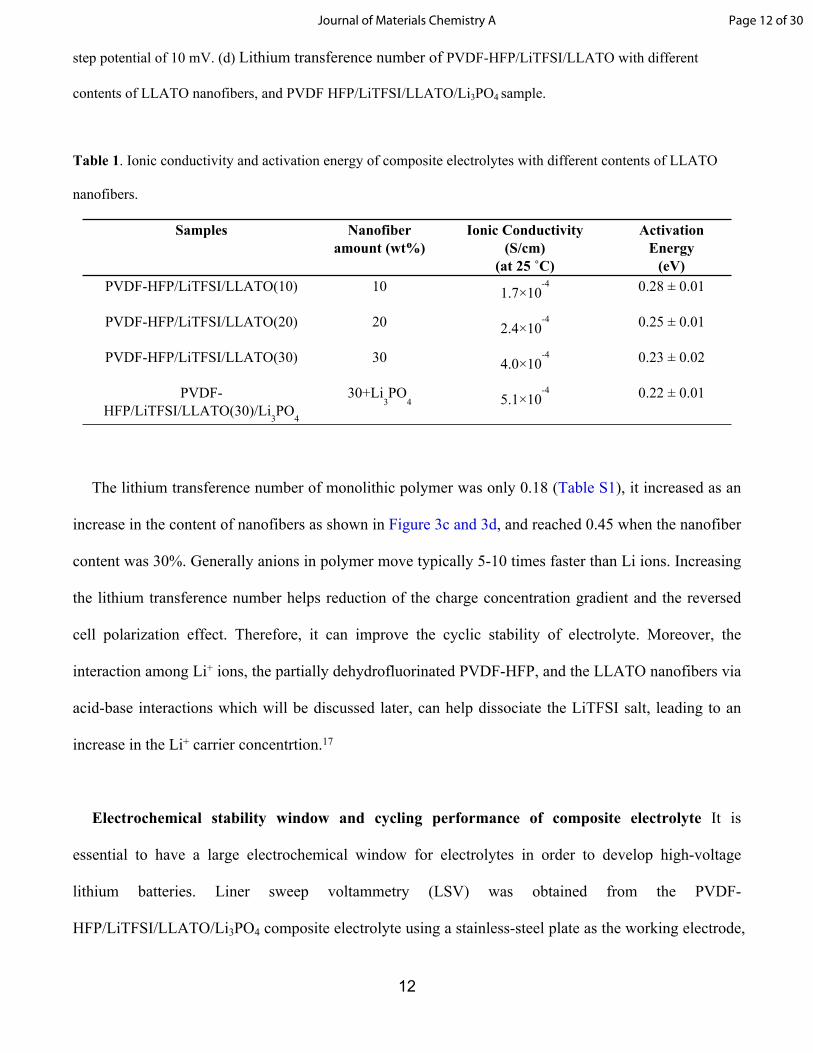
step potential of 10 mV. (d) Lithium transference number of PVDF-HFP/LiTFSI/LLATO with different
contents of LLATO nanofibers, and PVDF HFP/LiTFSI/LLATO/Li3PO4 sample.
Table 1. Ionic conductivity and activation energy of composite electrolytes with different contents of LLATO
nanofibers.
Samples Nanofiber amount (wt%)
Ionic Conductivity (S/cm)
(at 25 ˚C)
Activation Energy
(eV)PVDF-HFP/LiTFSI/LLATO(10) 10 1.7×10
-4 0.28 ± 0.01
PVDF-HFP/LiTFSI/LLATO(20) 20 2.4×10⁻⁴ 0.25 ± 0.01
PVDF-HFP/LiTFSI/LLATO(30) 30 4.0×10⁻⁴ 0.23 ± 0.02
PVDF-HFP/LiTFSI/LLATO(30)/Li
3PO
4
30+Li3PO
4 5.1×10⁻⁴ 0.22 ± 0.01
The lithium transference number of monolithic polymer was only 0.18 (Table S1), it increased as an
increase in the content of nanofibers as shown in Figure 3c and 3d, and reached 0.45 when the nanofiber
content was 30%. Generally anions in polymer move typically 5-10 times faster than Li ions. Increasing
the lithium transference number helps reduction of the charge concentration gradient and the reversed
cell polarization effect. Therefore, it can improve the cyclic stability of electrolyte. Moreover, the
interaction among Li+ ions, the partially dehydrofluorinated PVDF-HFP, and the LLATO nanofibers via
acid-base interactions which will be discussed later, can help dissociate the LiTFSI salt, leading to an
increase in the Li+ carrier concentrtion.17
Electrochemical stability window and cycling performance of composite electrolyte It is
essential to have a large electrochemical window for electrolytes in order to develop high-voltage
lithium batteries. Liner sweep voltammetry (LSV) was obtained from the PVDF-
HFP/LiTFSI/LLATO/Li3PO4 composite electrolyte using a stainless-steel plate as the working electrode,
Page 12 of 30Journal of Materials Chemistry A

13
and a lithium foil as the counter electrode. Figure 4a shows the LSV profile of the PVDF-
HFP/LiTFSI/LLATO/Li3PO4 composite electrolyte, demonstrating a stable voltage window up to 5 V vs.
Li/Li+.
The cyclic stability of the PVDF-HFP/LiTFSI, PVDF-HFP/LiTFSI/LLATO and PVDF-
HFP/LiTFSI/LLATO/Li3PO4 electrolytes was evaluated with a symmetric Li|Electrolyte|Li cell. The
composite electrolyte membrane was sandwiched between two lithium metal foils and sealed in coin
cell in a glovebox. Figure S10 shows the thickness of the composite electrolytes. The symmetric cell
was periodically charged and discharged at a constant current density of 0.5 mA/cm2 for 0.5 h at room
temperature to mimic the operation of charging and discharging process of lithium metal batteries.
Figure 4b,4d and 4f shows the time-dependent voltage profiles. At room temperature, the Li|PVDF-
HFP/LiTFSI|Li cell showed a polarization voltage of ~1 V due to the poor ionic conductivity of the
electrolyte (Figure 4b), and short-circuiting happened after only 25 cycles. The reversible cycling
performance of the Li|PVDF-HFP/LiTFSI/LLATO|Li cell was greatly improved, and it was stable for
600 h, showing a polarization voltage of 100 mV (Figure. 4d). The Li|PVDF-
HFP/LiTFSI/LLATO/Li3PO4|Li cell exhibited a polarization voltage as low as 44 mV before 150 hours
(Figure 4f). And the over-potential decreased to 34 mV after 150 hours of the charging/discharging
process, which could be ascribed to the improved interface between the electrolyte membrane and
lithium metal during the repeated Li electrodeposition.20 (Figure 4f). The SEM images in Figure 4 show
the morphology difference among the post-cycled samples. The presence of Li3PO4 at the
ceramic/polymer interface in the composite electrolyte effectively suppressed the growth of interfacial
products. As shown in Figures 4g, the surface morphology of the cycled PVDF-
HFP/LiTFSI/LLATO/Li3PO4 composite electrolyte did not display obvious changes on the membrane
surface. However, numerous round dots were visible on the membrane surfaces of the cycled PVDF-
HFP/LiTFSI (Figure. 4c) and PVDF-HFP/LiTFSI/LLATO electrolyte membranes (Figure. 4e),
indicating the interfacial product growth. 4
Page 13 of 30 Journal of Materials Chemistry A

14
Figure 4. (a) LSV curve of composite electrolyte membrane to show the electrochemical stability window,
Voltage profile at a current density of 0.5 mA/cm2 for (b) Li|PVDF-HFP/LiTFSI|Li, (d) Li|PVDF-
HFP/LiTFSI/LLATO |Li, and (f) Li|PVDF-HFP/LiTFSI/LLATO/Li3PO4|Li. Top view SEM images of composite
electrolyte after charging/discharging cycling test for (c) Li|PVDF-HFP/LiTFSI|Li, (e) Li|PVDF-
HFP/LiTFSI/LLATO|Li, and (g) Li|PVDF-HFP/LiTFSI/LLATO/Li3PO4|Li.
Page 14 of 30Journal of Materials Chemistry A

15
Figure 5. (a) Cycling performance of a Li|PVDF-HFP/LiTFSI/LLATO/Li3PO4|LFP coin cell at 0.5 C at 25 °C. (b)
Rate capability at 0.1C, 0.2C, 0.5C, 1C and 2C. (c) Charge/discharge curves of the Li|PVDF-
HFP/LiTFSI/LLATO/Li3PO4|LFP coin cell at various rates.
Full CR2032 coin cells were constructed for the lithium batteries with the PVDF-
HFP/LiTFSI/LLATO/Li3PO4 composite membrane as the electrolyte, a Li metal foil as the anode and
the LiFePO4-based material as the cathode. The cycling performance of the full-cell battery was tested
at a current rate of 0.5C and 1C (1C = 170 mA g−1) at 25 °C between 2.5 and 4.2 V. Figure 5a shows the
galvanostatic charging and discharging profiles. The cell delivered the specific discharge capacity of
130.7 mA h g−1 at a current rate of 0.5 C and retained 87.8% (114.7 mA h g−1) of the initial capacity
after 160 cycles. The Coulombic efficiency remained over 99.4% after 160 cycles. Furthermore, the full
cell displayed excellent rate performance. The reason for fluctuation of the capacity of Li|PVDF-
HFP/LiTFSI/LLATO/Li3PO4|LFP coin cell was not clear to the best of our knowledge. One of possible
reasons was that some cycles were perturbed by the change in material or in contact during testing. The
Page 15 of 30 Journal of Materials Chemistry A

16
capacity fading should be mainly due to the interface change between the electrolyte and the Li metal.
The PVDF-HFP/LiTFSI/LLATO/Li3PO4 polymer/ceramic electrolyte may also change during testing.
As shown in Figure 5b, the discharging capacity was measured to be 158, 147, 133, 98, and 76 mAh·g−1
at rate of 0.1C, 0.2C, 0.5C, 1C and 2C, respectively. When the current rate was switched back to 0.1 C,
the cell exhibited a reversible capacity of 149 mA h g−1. As compared to the full cell with a
commercial liquid electrolyte, the counterpart with the optimized PVDF-
HFP/LiTFSI/LLATO/Li3PO4 electrolyte exhibited a longer cycling lifetime.30,31 These results
indicated that the PVDF-HFP/LiTFSI/LLATO/Li3PO4 composite was promising for use in lithium metal
batteries.
DISCUSSION
Interaction between ceramic nanofibers and polymer matrix XRD patterns were acquired from
PVDF-HFP, PVDF-HFP/LiTFSI, and composite electrolytes with different contents of LLATO at room
temperature in order to characterize the crystalline phases of the composite electrolyte (Figure 6a).
Pristine PVDF-HFP polymer membrane showed strong characteristic diffraction peaks in 2θ range of 18°
and 20° with relatively weak peaks at around 27° and 40o, indicating a high degree of crystallinity. After
the lithium salt (LiTFSI) was added into the polymer, the characteristic diffraction peaks of PVDF-HFP
became weak. The crystallinity of PVDF-HFP in the composite electrolyte further decreased as the
LLATO nanofiber contents increased from 10% to 30%. It is well known that amorphization of polymer
matrix increases motion of polymer chain segments and mobility of lithium ions. This is important for
the conductivity improvement in the PVDF-HFP/LiTFSI/LLATO composite electrolytes.
The chemical interaction between the inorganic nanofibers and polymer were further investigated
with vibration spectroscopy and photoemission spectroscopy. After addition of the lithium salt (LiTFSI)
Page 16 of 30Journal of Materials Chemistry A
17
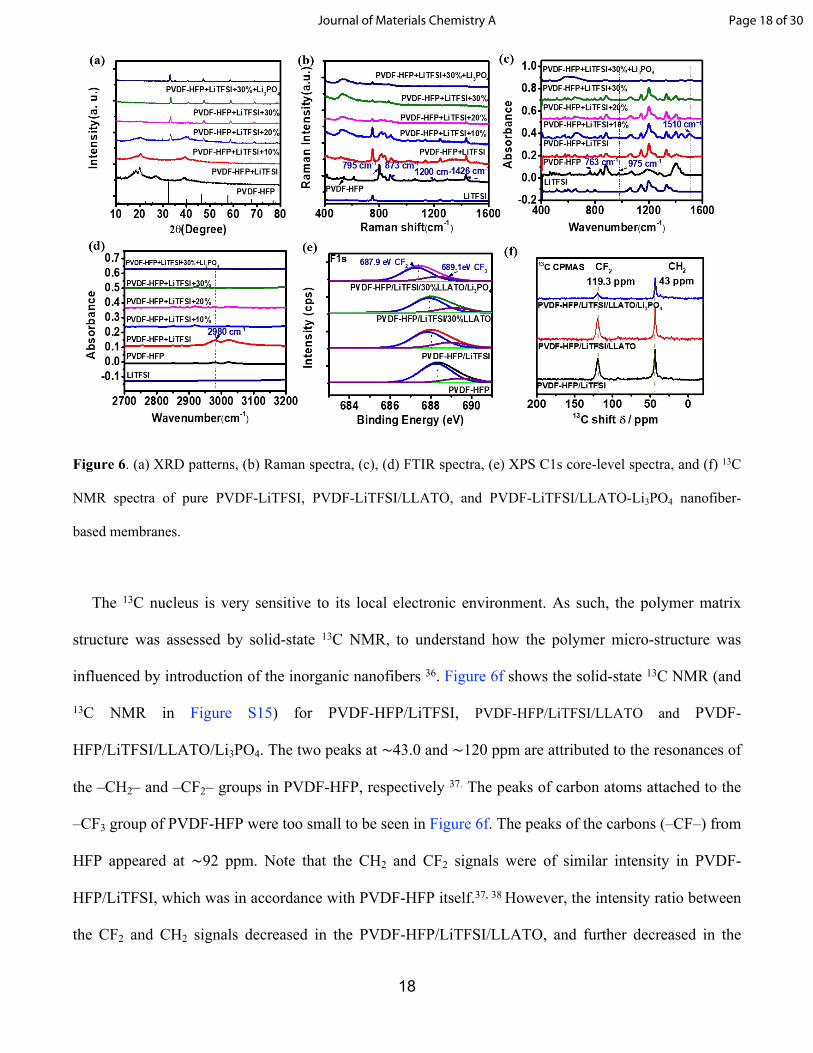
and ceramic nanofibers, the vibration modes of the PVDF-HFP complex was altered in both the shape
and intensity. The Raman peaks at 795 cm-1 and 1426 cm-1 were assigned to the CH2 rocking vibration
and CH2 wagging modes of α phase PVDF-HFP, respectively. The Raman peak at 873 cm-1 was
attributed to the C-C symmetric stretching (Figure 6b).32 The intensity of the peaks at 795 cm-1, 873 cm-
1, and 1426 cm-1 decreased after the adding the lithium salt LiTFSI and LLATO nanofibers to the
PVDF-HFP matrix. The decreased Raman peak intensities indicate the deprotonation of -CH2 moiety
and a weakened α phase due to the introduction of LiTFSI. On the other hand, the CF2 stretching
vibration mode at 1200 cm-1 of PVDF-HFP also decreased dramatically. The decrease in the CF2
stretching vibration was associated with interactions between lithium salt and CF2 groups in the polymer
molecular chains.33 In the FTIR spectra (Figure 6c), the CH2 bending vibration mode peak at 2980 cm-1
decreased dramatically after the addition of LLATO nanofibers, indicating deprotonation of CH2 in
PVDF-HFP.17, 34 A new FTIR peak appeared at 1510 cm-1 after adding LLATO nanofibers to the
composite, which was attributed to the C=C stretching vibration modes of polyenes, suggesting the
dehydrofluorination of PVDF chains. These changes in the chemical structure were consistent with
those of PVDF after alkaline treatment. Therefore, addition of LLATO was likely to create an alkaline-
like condition for PVDF-HFP and caused a change in the chemical structure of PVDF-HFP.33-35
Figure 6e displays the XPS spectra of F 1s core-level from different samples. For the pristine PVDF-
HFP polymer, the F 1s shows two sub-peaks with binding energy of 689.4 eV and 688.2 eV, which was
ascribed to CF3 and CF2, respectively.33 The binding energy of both peaks corresponding to CF3 and CF2
negatively shifted to 688.9 eV and 687.8 eV after the lithium salt LiTFSI was incorporated into the
polymer, indicating partial reduction of F of PVDF-HFP. Due to the extraction of fluorine via the
dehydrofluorination reaction after the addition of LLATO nanofibers, there was a new sub-peak
attributed to the CF bond appeared in the C 1s spectra at binding energy of 287.6 eV, as shown in Figure
S11-14. Adding Li3PO4 attenuated the strong polar effect of F on lithium ions as shown by the negative
binding energy shift of CF3 and CF2 to 688.2 and 687.3 eV, respectively, as shown in Figure 6e.
Page 17 of 30 Journal of Materials Chemistry A
18
Figure 6. (a) XRD patterns, (b) Raman spectra, (c), (d) FTIR spectra, (e) XPS C1s core-level spectra, and (f) 13C
NMR spectra of pure PVDF-LiTFSI, PVDF-LiTFSI/LLATO, and PVDF-LiTFSI/LLATO-Li3PO4 nanofiber-
based membranes.
The 13C nucleus is very sensitive to its local electronic environment. As such, the polymer matrix
structure was assessed by solid-state 13C NMR, to understand how the polymer micro-structure was
influenced by introduction of the inorganic nanofibers 36. Figure 6f shows the solid-state 13C NMR (and
13C NMR in Figure S15) for PVDF-HFP/LiTFSI, PVDF-HFP/LiTFSI/LLATO and PVDF-
HFP/LiTFSI/LLATO/Li3PO4. The two peaks at ∼43.0 and ∼120 ppm are attributed to the resonances of
the –CH2– and –CF2– groups in PVDF-HFP, respectively 37. The peaks of carbon atoms attached to the
–CF3 group of PVDF-HFP were too small to be seen in Figure 6f. The peaks of the carbons (–CF–) from
HFP appeared at ∼92 ppm. Note that the CH2 and CF2 signals were of similar intensity in PVDF-
HFP/LiTFSI, which was in accordance with PVDF-HFP itself.37, 38 However, the intensity ratio between
the CF2 and CH2 signals decreased in the PVDF-HFP/LiTFSI/LLATO, and further decreased in the
Page 18 of 30Journal of Materials Chemistry A
19
PVDF-HFP/LiTFSI/LLATO/Li3PO4. This gave direct evidence of dehydrofluorination of PVDF chains,
which was in agreement with the Raman and FTIR spectra results.
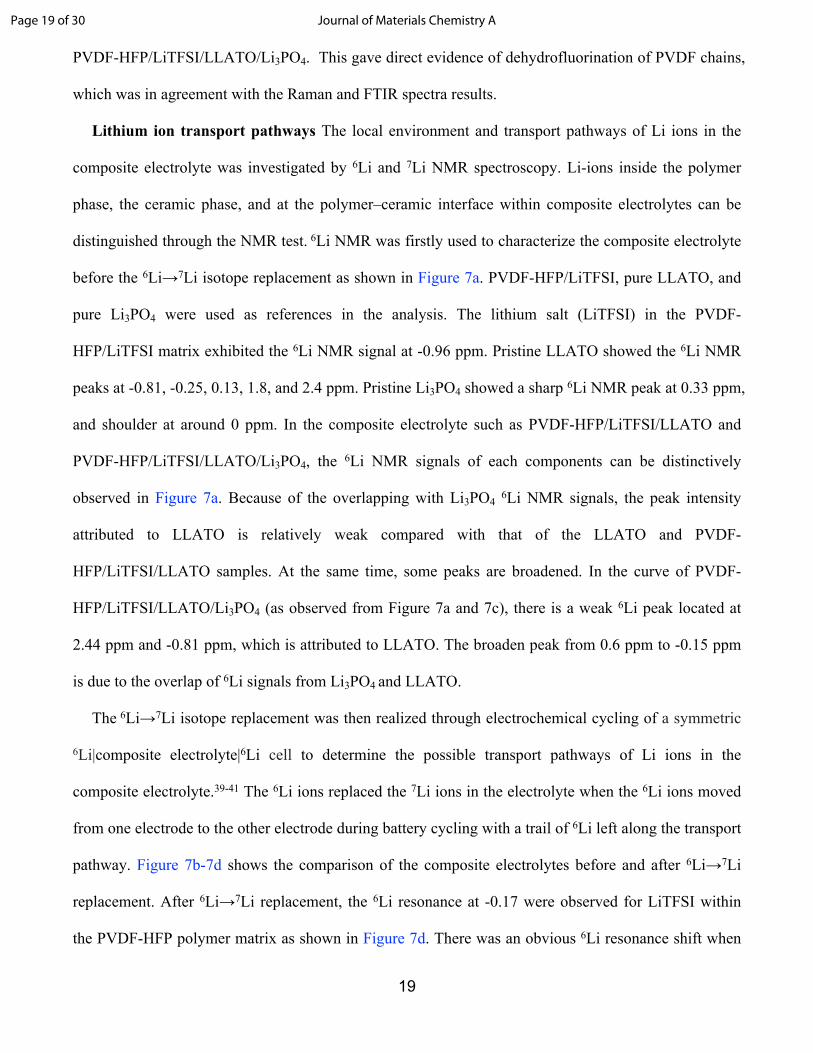
Lithium ion transport pathways The local environment and transport pathways of Li ions in the
composite electrolyte was investigated by 6Li and 7Li NMR spectroscopy. Li-ions inside the polymer
phase, the ceramic phase, and at the polymer–ceramic interface within composite electrolytes can be
distinguished through the NMR test. 6Li NMR was firstly used to characterize the composite electrolyte
before the 6Li→7Li isotope replacement as shown in Figure 7a. PVDF-HFP/LiTFSI, pure LLATO, and
pure Li3PO4 were used as references in the analysis. The lithium salt (LiTFSI) in the PVDF-
HFP/LiTFSI matrix exhibited the 6Li NMR signal at -0.96 ppm. Pristine LLATO showed the 6Li NMR
peaks at -0.81, -0.25, 0.13, 1.8, and 2.4 ppm. Pristine Li3PO4 showed a sharp 6Li NMR peak at 0.33 ppm,
and shoulder at around 0 ppm. In the composite electrolyte such as PVDF-HFP/LiTFSI/LLATO and
PVDF-HFP/LiTFSI/LLATO/Li3PO4, the 6Li NMR signals of each components can be distinctively
observed in Figure 7a. Because of the overlapping with Li3PO4 6Li NMR signals, the peak intensity
attributed to LLATO is relatively weak compared with that of the LLATO and PVDF-
HFP/LiTFSI/LLATO samples. At the same time, some peaks are broadened. In the curve of PVDF-
HFP/LiTFSI/LLATO/Li3PO4 (as observed from Figure 7a and 7c), there is a weak 6Li peak located at
2.44 ppm and -0.81 ppm, which is attributed to LLATO. The broaden peak from 0.6 ppm to -0.15 ppm
is due to the overlap of 6Li signals from Li3PO4 and LLATO.
The 6Li→7Li isotope replacement was then realized through electrochemical cycling of a symmetric
6Li|composite electrolyte|6Li cell to determine the possible transport pathways of Li ions in the
composite electrolyte.39-41 The 6Li ions replaced the 7Li ions in the electrolyte when the 6Li ions moved
from one electrode to the other electrode during battery cycling with a trail of 6Li left along the transport
pathway. Figure 7b-7d shows the comparison of the composite electrolytes before and after 6Li→7Li
replacement. After 6Li→7Li replacement, the 6Li resonance at -0.17 were observed for LiTFSI within
the PVDF-HFP polymer matrix as shown in Figure 7d. There was an obvious 6Li resonance shift when
Page 19 of 30 Journal of Materials Chemistry A
20
compared with the sample before cycling, indicating the change in the Li-ion local environment. For
PVDF-HFP/LiTFSI/LLATO, the 6Li peaks of LLATO at -0.30 and 0.13ppm shifted to -0.33 ppm and
0.19 ppm, respectively, with the peak intensities increasing significantly after 6Li→7Li replacement
(Figure 7b). Meanwhile, the PVDF-HFP/LLATO interface and LiTFSI resonances showed a small 6Li
change, which indicated that the majority of Li ions passed through the percolated network formed by
LLATO nanofibers; and only a small portion migrated via LiTFSI in the PVDF-HFP polymer matrix
and along the interface. For the PVDF-HFP/LiTFSI/LLATO/Li3PO4 sample, in addition to the
significant intensity increase of 6Li signals of LLATO at -0.34 ppm and 0.12 ppm, the 6Li peak of
Li3PO4 at 0.42 ppm also increased significantly after the 6Li →7Li replacement (Figure 7c).
Page 20 of 30Journal of Materials Chemistry A
21
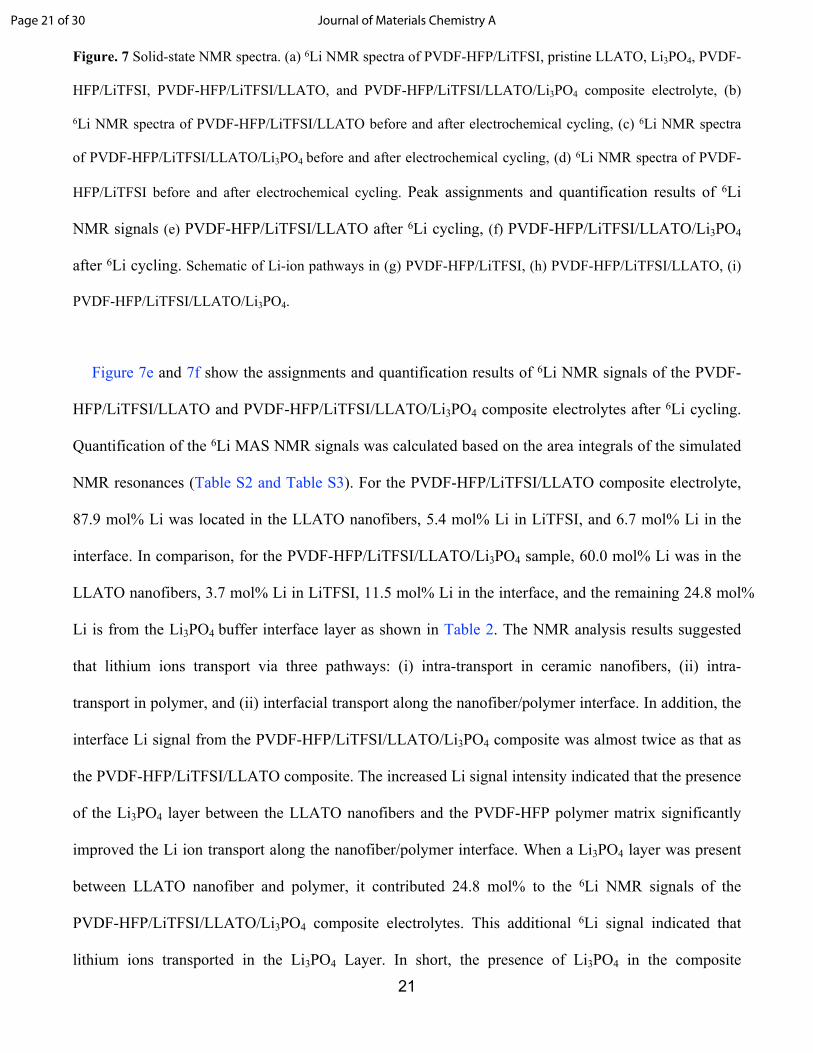
Figure. 7 Solid-state NMR spectra. (a) 6Li NMR spectra of PVDF-HFP/LiTFSI, pristine LLATO, Li3PO4, PVDF-
HFP/LiTFSI, PVDF-HFP/LiTFSI/LLATO, and PVDF-HFP/LiTFSI/LLATO/Li3PO4 composite electrolyte, (b)
6Li NMR spectra of PVDF-HFP/LiTFSI/LLATO before and after electrochemical cycling, (c) 6Li NMR spectra
of PVDF-HFP/LiTFSI/LLATO/Li3PO4 before and after electrochemical cycling, (d) 6Li NMR spectra of PVDF-
HFP/LiTFSI before and after electrochemical cycling. Peak assignments and quantification results of 6Li
NMR signals (e) PVDF-HFP/LiTFSI/LLATO after 6Li cycling, (f) PVDF-HFP/LiTFSI/LLATO/Li3PO4
after 6Li cycling. Schematic of Li-ion pathways in (g) PVDF-HFP/LiTFSI, (h) PVDF-HFP/LiTFSI/LLATO, (i)
PVDF-HFP/LiTFSI/LLATO/Li3PO4.
Figure 7e and 7f show the assignments and quantification results of 6Li NMR signals of the PVDF-
HFP/LiTFSI/LLATO and PVDF-HFP/LiTFSI/LLATO/Li3PO4 composite electrolytes after 6Li cycling.
Quantification of the 6Li MAS NMR signals was calculated based on the area integrals of the simulated
NMR resonances (Table S2 and Table S3). For the PVDF-HFP/LiTFSI/LLATO composite electrolyte,
87.9 mol% Li was located in the LLATO nanofibers, 5.4 mol% Li in LiTFSI, and 6.7 mol% Li in the
interface. In comparison, for the PVDF-HFP/LiTFSI/LLATO/Li3PO4 sample, 60.0 mol% Li was in the
LLATO nanofibers, 3.7 mol% Li in LiTFSI, 11.5 mol% Li in the interface, and the remaining 24.8 mol%
Li is from the Li3PO4 buffer interface layer as shown in Table 2. The NMR analysis results suggested
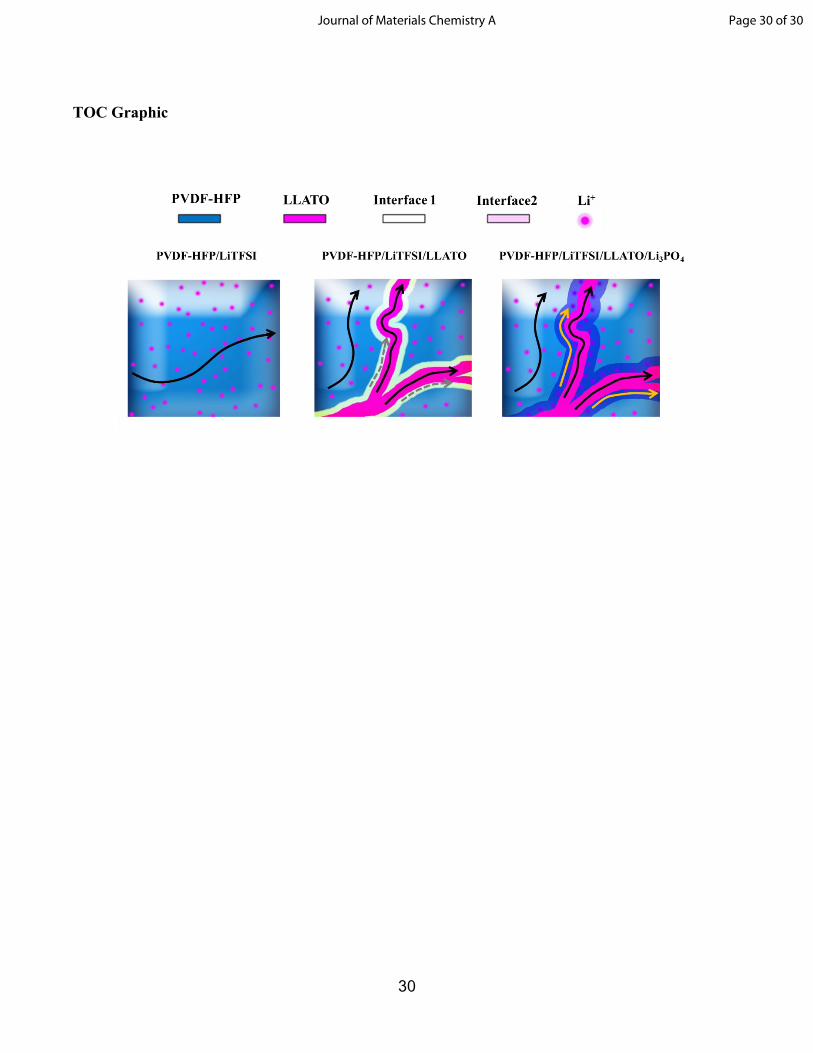
that lithium ions transport via three pathways: (i) intra-transport in ceramic nanofibers, (ii) intra-
transport in polymer, and (ii) interfacial transport along the nanofiber/polymer interface. In addition, the
interface Li signal from the PVDF-HFP/LiTFSI/LLATO/Li3PO4 composite was almost twice as that as
the PVDF-HFP/LiTFSI/LLATO composite. The increased Li signal intensity indicated that the presence
of the Li3PO4 layer between the LLATO nanofibers and the PVDF-HFP polymer matrix significantly
improved the Li ion transport along the nanofiber/polymer interface. When a Li3PO4 layer was present
between LLATO nanofiber and polymer, it contributed 24.8 mol% to the 6Li NMR signals of the
PVDF-HFP/LiTFSI/LLATO/Li3PO4 composite electrolytes. This additional 6Li signal indicated that
lithium ions transported in the Li3PO4 Layer. In short, the presence of Li3PO4 in the composite
Page 21 of 30 Journal of Materials Chemistry A

22
electrolyte significantly enhanced the interfacial transport along the LLTAO nanofibers/polymer
interface. The 7Li spectra of the composite electrolytes show the reduced intensity of the 7Li resonance
after 6Li cycling, confirming the replacement of 7Li by passing 6Li ions in the LLATO phase (Figure
S16).
Table 2. Li ion pathway analysis through 6Li NMR: quantification results of spectral simulation.
6Li signalPVDF-
HFP/LiTFSI/LLATO (mol.%)
PVDF-HFP/LiTFSI/LLATO/Li3PO4
(mol.%)in LLATO nanofibers 87.9 60
in LiTFSI-polymer 5.4 3.7
at the nanofiber/polymer interface 6.7 11.5
in the interfacial Li3PO4 layer -- 24.8
Addition of LLATO nanofibers and Li3PO4 into the polymer matrix significantly improves the ionic
conductivity and cyclic performance of electrolyte, which can be understood based on the analysis of
three Li-ion transport pathways in the electrolyte. The LLATO nanofibers are formed a 3D network in
the composite, which provides the continuous ion transport channels throughout the electrolyte.
Incorporation of nanofibers with polymer leads to the amorphization of polymer, which increases the
mobility of polymer chain segments, improving the Li-ion mobility in the polymer. Also, interaction of
the nanofibers with the polymer results in the dehydrofluorination of PVDF chains, which weakens the
electron-drawing binding energy of F, and attenuates the strong polar effect of F on the Li ions in Li-salt.
This increases the mobility of lithium ions. Furthermore, the LLATO nanofiber/polymer interface is the
high ionic conductivity channel for lithium ions. When more lithium ions transport along the
nanofiber/polymer interface, the overall conductivity of composite electrolyte are improved. Interfacial
modification with the Li3PO4 layer further amplifies all these effects, which further improves the ionic
conductivity.
Page 22 of 30Journal of Materials Chemistry A
23
CONCLUSIONS
In summary, the LLATO nanofiber/polymer composite electrolyte exhibited much higher ionic
conductivity, lithium ion transference number and better cyclic stability than monolithic polymer
electrolyte. The ionic conductivity of the composite electrolyte increased with an increase in the fiber
content in the composite electrolyte. The presence of a Li3PO4 layer between the LLATO nanofiber and
the polymer further improved the ionic conductivity and cyclic stability. As a result, the ionic
conductivity of the PVDF-HFP/LiTFSI/LLATO/Li3PO4 reached 5.1×10⁻⁴ S/cm. The PVDF-
HFP/LiTFSI/LLATO/Li3PO4 exhibited a stable voltage window up to 5.0 V vs. Li|Li+. The symmetric
Li|PVDF-HFP/LiTFSI/LLATO/Li3PO4|Li cell showed mechanical stability during repeated lithium
plating/stripping at room temperature, and a low overpotential of ~50 mV at a constant current density
of 0.5 mA/cm2. In addition, full-cell batteries assembled using this electrolyte and lithium metal anodes
exhibit excellent good cycling performance and rate capability. This work shows that interfacial synergy
between the ceramic nanofibers and the polymer plays important in the electrochemical performance of
ceramic-polymer composite electrolytes.
There exists strong chemical interaction between the inorganic and the organic phases in the
composite electrolytes. Incorporation of the LLATO nanofibers into the polymer induced
dehydrofluorination of PVDF chains, deprotonation of the -CH2 moiety and amorphization of the
polymer matrix. Solid-state NMR spectra revealed that lithium ions transported via three pathways: the
intra-polymer transport, the intra-nanofiber transport, and the interfacial polymer/nanofiber transport.
The presence of Li3PO4 between the nanofibers and the polymer not only enhanced the chemical
interaction but also greatly improved the Li ion transport along the nanofiber/polymer interface in the
composite electrolyte. Fundamental understanding the interfacial ion transport and the chemical
interaction at the ceramic/polymer interface will provide guidelines for design of ceramic/polymer
composite electrolytes for all-solid-state lithium batteries.
Page 23 of 30 Journal of Materials Chemistry A
24
EXPERIMENTAL METHODS
Chemicals and Materials. Lithium nitrate anhydrous (99.0%) and lanthanum(III) nitrate
hexahydrate (99.9%), and polyvinylpyrrolidone M.W. 1,300,000 were purchased from Alfa Aesar.
Titanium isopropoxide (≥99.0%), bis(trifluoromethane) sulfonimide lithium salt, (99.95% trace metals
basis), poly(vinylidene fluoride-co-hexafluoropropylene) and lithium phosphate were purchased from
Sigma-Aldrich. Aluminum nitrate nonahydrate (99+%) was purchased from Acros Organics. Deionized
(D.I.) water was produced by a Milli-Q Millipore system (18.2 MΩ∙cm, Millipore Corp., USA). All
solvents were obtained from commercial sources and used without further purification.
Synthesis of Li0.33La0.557TiO3 (LLTO) nanofibers and aluminum-doped Li0.33La0.557Ti1-xAlxO3
(LLATO). Electrospinning precursor solutions of Li0.33La0.557TiO3 (LLTO), Al-doped Li0.33La0.557Ti1-
xAlxO3 (LLATO) (LLATO, x=0.005; LLATO-1, x=0.01; LLATO-2, x=0.015; LLATO-3, x=0.05;
LLATO-4, x=0.1) were firstly prepared. Lithium nitrate anhydrous, lanthanum(III) nitrate hexahydrate,
titanium(IV) isopropoxide , and aluminum nitrate nonahydrate were used as the starting materials with a
Li: La: Ti: Al ratio matching the stoichiometric molar ratio of Al-doped Li0.33La0.557Ti1-xAlxO3. 20%
excess of the lithium source was used to compensate for the lithium loss during subsequent calcination
process. In a typical synthesis process for the LLATO (x=0.005), 3.96 mmol of lithium nitrate and 5.57
mmol of lanthanum(III) nitrate hexahydrate, 0.05 mmol aluminum nitrate nonahydrate were dissolved in
25 mL of de-ionized water. 9.95 mmol titanium(IV) isopropoxide was separately dissolved in a mixture
of 15.27 mL of isopropanol and 5.72 mL of acetic acid. These two solutions were then mixed to create a
sol. 4 g of PVP (Mw=1,300,000) was dissolved in 40 ml of DMF with 15 vol% acetic acid. The sol and
PVP solution were then mixed to form the precursor solution for electrospinning. In a typical
electrospinning experiment, a voltage of 19 kV was applied, the distance between the needle tip and the
collector was kept constant at 15 cm, and the feed rate was 0.3 mL h-1. The collector was connected to
the ground.
Page 24 of 30Journal of Materials Chemistry A

25
The as-spun nanofibers were peeled off from the collector after the electrospinning, followed by
calcination in an alumina combustion boat in air to remove the polymer PVP and crystallize the
nanofibers.1,2 Morphologies of the LLTO nanofibers was tuned by calcinated under different
temperatures of 700 °C, 800 °C, 900 °C, and 1000 °C (Figure S1). 900°C was used for further heating
treatment for LLATO nanofiber. Then LLTO nanofibers were doped with different percentage (0.5~10
mol%) of aluminum.
Lithium phosphate modification of LLATO nanofibers. Lithium phosphate was dissolved in 0.1
M phosphoric acid to form a 0.05 M solution. LLATO nanofibers were immersed in the solution for one
hour. After that, the LLATO/Li3PO4 nanofibers were dried on a hot plate at 60 oC in air.
Preparation of inorganic nanofiber network-polymer composite electrolytes. A Li salt–polymer
composite solution was prepared by dissolving bis(trifluoromethane)sulfonimide lithium salt (LiTFSI)
and polyvinylidiene fluoride-hexafluoropropylene (PVDF-HFP) (molecular weight, ∼40,000) in
acetone. The composite electrolyte was prepared by dropping the Li salt-polymer solution onto the
calcinated LLATO nanofiber membrane, the solvent was evaporated under air for 30 minutes. After
drying, the Li salt-polymer solution wetting process was repeated. After the certain amount 70-90 wt%
organic polymer was dropped onto the three-dimensional cross-linked nanofiber structure, the
membrane was then kept in under vacuum before use.
Characterization. The morphologies of the samples are characterized by field-emission scanning
electron microscopy (FE-SEM) and transmission electron microscopy (TEM). FESEM images were
taken on JEOL JSM-7600 and Hitachi S-4700 SEMs with an accelerating voltage of 15 kV. TEM
images were taken on a JEOL JEM 2100F. The crystallographic and chemical structures were
characterized by an X-ray diffractometer (XRD, Rigaku DIII Ultima with Cu Kα radiation). X-ray
photoelectron spectroscopy (XPS) measurements were performed on Physical Electronics PHI 5000
Versa Probe system to analyze the chemical state and atomic concentrations of elements. Binding
energies (BE) were calibrated to adventitious carbon BE of 284.80 eV.
Page 25 of 30 Journal of Materials Chemistry A

26
The symmetric Li|solid-state electrolyte|Li full cell was assembled in glovebox. The electrolyte
membrane was sandwiched between two surface-polished lithium metal foils and sealed in 2,032 coin
cells. The electrochemical stability of the electrolyte membrane was measured using linear sweep
voltammetry (LSV) with a sweep rate of 1 mV/s in the range of 0–6 V. In the LSV test, the electrolyte
membrane was sandwiched between stainless steel as the working electrode and lithium metal foil as the
counter electrode. The ionic conductivity of the composite electrolyte was tested by electrochemical
impedance spectroscopy (EIS) measurement. The electrolyte membrane was sandwiched between two
stainless steel plates for the EIS measurement which was performed on a Solartron 1260 using a
frequency range of 1 Hz to 1 MHz. All the samples were in a dimeter of ø=0.7 cm with a testing
area of 0.385 cm2. The pressure kept constant at 3000 psi during measurement. For
measurement of the ionic conductivity, the thickness of the composite membrane were 139
µm, 111 µm, 117 µm, 115 µm, 125 µm, and 216 µm for the LLTO/PVDF-HFP/LiTFSI,
LLATO/PVDF-HFP/LiTFSI, LLATO-1/PVDF-HFP/LiTFSI, LLATO-2/PVDF-HFP/LiTFSI,
LLATO-3/PVDF-HFP/LiTFSI, and LLATO-4/PVDF-HFP/LiTFSI, respectively, as shown in
Figure S7.
Galvanostatic cycling of the symmetric battery cells was carried out on a LANHE (CT2001A)
battery testing system, with a constant current density of 0.5 mA/cm2. For 6Li→7Li replacement, 6Li
metal foils were used as the two electrodes, with a constant current density of 7 μA/cm2 biased at a
potential that changed polarity every 5 min. Solid-State 6Li NMR experiments were performed on a
Bruker Avance III-500 spectrometer with a 2.5 mm Bruker HXY triple-resonance probe. The sample
Page 26 of 30Journal of Materials Chemistry A

27
was spun at 25 kHz, and the spectra were collected at the 6Li Larmor frequency of 73.6 MHz. LiCl with
the Li shift at 0 ppm was used as a reference.
CR2032-type coin cells were assembled inside an argon-filled glovebox to evaluate the cycling
performance of the composite electrolyte. The charge and discharge profiles were tested between 2.5 V
to 4.2 V at different current rate at room temperature. The cells were assembled with LiFePO4 cathode,
Li metal anode and composite electrolyte, a trace of 2 μL carbonate electrolyte (1M LiPF6 in EC: DMC:
DEC=1: 1: 1 in volume ratio) was employed as a “softer contact” between the electrode and
electrolyte.42
ASSOCIATED CONTENT
Supporting Information. Figures S1-S13. This material is available free of charge via the Internet at
http://.
AUTHOR INFORMATION
Corresponding Author
Tel: +1-304-293-3326, E-mail: [email protected]
Notes
The authors declare no competing financial interest.
ACKNOWLEDGEMENTS
This material is based upon a grant by the Department of Energy (DOE), Office of Energy Efficiency
and Renewable Energy (EERE) under award number DE-EE0007806. The views and opinions of the
authors stated do not necessarily reflect those of the U. S. Government.
DISCLAIMER
Page 27 of 30 Journal of Materials Chemistry A
28
Neither the U. S. Government, nor any of its employees, makes any warranty, express or implied, or
assumes any legal liability or responsibility for the accuracy or completeness of any information,
product, or process disclosed, or represents that its manufacture or use would not infringe privately
owned rights. The views and opinions of the authors stated do not necessarily reflect those of the U. S.
Government.
REFERENCES AND NOTES
1. H. S. Jadhav, M.-S. Cho, R. S. Kalubarme, J.-S. Lee, K.- N. Jung, K.-H. Shin, C.-J. Park, J. Power Sources
2013, 241, 502-508.
2. N. Rosenkiewitz, J. Schuhmacher, M. Bockmeyer, J. Deubener, J. Power Sources 2015, 278, 104-108.
3. S. Stramare, V. Thangadurai,a W. Weppner, Chem. Mater. 2003, 15, 3974-3990.
4. B. Wu, S. Wang, J. Lochala, D. Desrochers, B. Liu, W. Zhang, J. Yang, J. Xiao, Energy Environ. Sci., 2018, 11,
1803-1810.
5. J. C. Bachman, S. Muy, A. Grimaud, H.H. Chang, N. Pour, S.F. Lux, O. Paschos, F. Maglia, S. Lupart, P.
Lamp, and L. Giordano, Chem. Rev., 2015, 116, 140-162.
6. P. L. Kuo, C. A. Wu, C. Y. Lu, C. H. Tsao, C. H. Hsu, S. S. Hou, ACS Appl. Mater. Interfaces 2014, 6, 3156-
3162.
7. S. Liu, N. Imanishi, T. Zhang, A. Hirano, Y. Takeda, O. Yamamoto, J. Yang, J. Electrochem. Soc. 2010, 157,
A1092-A1098.
8. Y. Shi, L. Peng, Y. Ding, Y. Zhao, G. Yu, Chem. Soc. Rev. 2015, 44, 6684-6696.
9. F. Croce, G.B. Appetecchi, L. Persi, B. Scrosati, Nature 1998, 394, 456–458,
10. L. R. A. K. Bandara, M. A. K. L. Dissanayake, B. E. Mellander, Electrochimica acta, 1998,43, 1447-1451.
11. A. M. Stephan,K. S. Nahm, Polymer 2006, 47, 5952-5964.
12. W. Liu, N. Liu, J. Sun, P.C. Hsu, Y. Li, H.W. Lee, Y. Cui, Nano Lett, 2015, 15, 2740-2745.
13. X. Qian, N. Gu, Z. Cheng, X. Yang, E. Wang, S. Dong, Electrochim. Acta 2001, 46, 1829-1836.
14. J. W. Kim, K. S. Ji, J. P. Lee, J. W. Park, J. Power Sources 2003, 119, 415-421.
15.W. Wang, E. Yi, A. J. Fici, R. M. Laine, J. Kieffer, J. Phys. Chem. C 2017, 121, 2563–2573.
16. K.-S. Ji, H.-S. Moon, J.-W. Kim, J.-W. Park, J. Power Sources 2003, 117, 124–130.
17. X. Zhang, T. Liu, S. Zhang, X. Huang, B. Xu, Y. Lin, B. Xu, L. Li, C.W. Nan, Y. Shen, J. Am. Chem.
Soc. 2017, 139, 13779-13785.
18. W. Liu, D. Lin, J. Sun, G. Zhou, Y. Cui, ACS nano, 2016, 10, 11407-11413.
19. P. Zhu, C. Yan, M. Dirican, J. Zhu, J. Zang, R.K. Selvan, C.C. Chung, H. Jia, Y. Li, Y. Kiyak, N. Wu, J.
Mater. Chem. A, 2018, 6, 4279-4285.
Page 28 of 30Journal of Materials Chemistry A
29
20. K.K. Fu, Y. Gong, J. Dai, A. Gong, X. Han, Y. Yao, C. Wang, Y. Wang, Y. Chen, C. Yan, Y. Li, Proc. Natl.
Acad. Sci. U.S.A. 2016. 113, 7094-7099.
21. X. Zhang, J. Xie, F. Shi, D. Lin, Y. Liu, W. Liu, A. Pei, Y. Gong, H. Wang, K. Liu, Y. Xiang. Nano Lett.
2018, 18, 3829−3838,
22. W. Wieczorek, Z. Florjanczyk, J. R. Stevens, Electrochim. Acta 1995, 40, 2251−2258.
23. P. Johansson, P. Jacobsson, Solid State Ionics 2004, 170, 73−78.
24. W. Liu, S.W. Lee, D. Lin, F. Shi, S. Wang, A.D. Sendek, Y. Cui, Nature energy, 2017, 2, 17035.
25. M. Wagemaker, G.J. Kearley, A.A. van Well, H. Mutka, F.M. Mulder, J. Am. Chem. Soc. 2003, 125, 840−848.
26. V. Thangadurai, W. Weppner, Ionics, 2000, 6, 70-77.
27.S. Stramare, V. Thangadurai, W. Weppner, Chemistry of materials, 2003,15, 3974-3990.
28. P. Tarte, J. Inorg. Nucl. Chem., 1967, 29, 915–923.
29. L. Popovic, B. Manoun, D. de Waal, M. K. Nieuwoudt, and J. D. Comins, J. Raman Spectrosc. 2003, 34, 77–
83.
30. Q. Wang, C. Yang, J. Yang, K. Wu, L. Qi, H. Tang, Z. Zhang, W. Liu, H. Zhou, Energy Storage Materials,
2018, 15, 249-256.
31. Y. Zhong, L. Zhong, S. Wang, J. Qin, D. Han, S. Ren, M. Xiao, L. Sun, and Y. Meng, Journal of Materials
Chemistry A, 2019, 7, 24251-24261.
32. S. Das, A. Ghosh, J. Appl. Phys. 2016, 119, 095101.
33. Q. Guo, Y. Han, H. Wang, S. Xiong, W. Sun, C. Zheng, K. Xie, J. Phys. Chem. C 2018, 122, 10334–10342.
34. S. Zhang, J. Shen, X. Qiu, D. Weng, W. Zhu, J. Power Sources, 2006, 153, 234–238.
35. N. A. Hashim, Y. Liu, K. Li, Ind. Eng. Chem. Res. 2011, 50, 3035–3040.
36. J. C. Daigle, A. A. Arnold, A. Vijh, K. Zaghib, Magnetochemistry, 2018, 4, 13.
37. S. Ferrari, E. Quartarone, P. Mustarelli, A. Magistris, M. Fagnoni, S. Protti, A. Spinella, J. Power Sources,
2010,195, 559-566.
38. T. Montina, P. Wormald, P. Hazendonk, Macromolecules, 2012, 45, 6002-6007.
39. J. Zheng, M. Tang, Y.Y. Hu, Angew. Chem. Int. Ed, 2016, 55, 12538-12542.
40. J. Zheng, Y.Y. Hu, ACS Appl. Mater. Interfaces, 2018, 10, 4113-4120.
41. T. Yang, J., Zheng, Q., Cheng, Y.Y. Hu, C.K. Chan, ACS Appl. Mater. Interfaces, 2017, 9, 21773-21780
42. H. Duan, M. Fan, W.P. Chen, J.Y. Li, P.F. Wang, W.P. Wang, J.L. Shi, Y.X. Yin, L.J. Wan, Y.G. Guo, Adv.
Mater. 2019, 31, 1807789.
Page 29 of 30 Journal of Materials Chemistry A
30
TOC Graphic
Page 30 of 30Journal of Materials Chemistry A