Embed Size (px)
Citation preview
This Provisional PDF corresponds to the article as it appeared upon acceptance. Fully formattedPDF and full text (HTML) versions will be made available soon.
An industry consensus study on an HPLC fluorescence method for thedetermination of (+/-)-catechin and (+/-)-epicatechin in cocoa and chocolate
products
Chemistry Central Journal 2011, 5:39 doi:10.1186/1752-153X-5-39
Laura Shumow ([email protected])Alison Bodor ([email protected])
ISSN 1752-153X
Article type Methodology
Submission date 9 December 2010
Acceptance date 5 July 2011
Publication date 5 July 2011
Article URL http://journal.chemistrycentral.com/content/5/1/39
This peer-reviewed article was published immediately upon acceptance. It can be downloaded,printed and distributed freely for any purposes (see copyright notice below).
Articles in Chemistry Central Journal are listed in PubMed and archived at PubMed Central.
For information about publishing your research in Chemistry Central Journal or any BioMed Centraljournal, go to
http://journal.chemistrycentral.com/info/instructions/
For information about other BioMed Central publications go to
http://www.biomedcentral.com/
Chemistry Central Journal
© 2011 Shumow and Bodor ; licensee Chemistry Central Ltd.This is an open access article distributed under the terms of the Creative Commons Attribution License (http://creativecommons.org/licenses/by/2.0),
which permits unrestricted use, distribution, and reproduction in any medium, provided the original work is properly cited.
An industry consensus study on an HPLC fluorescence method for the
determination of (±)-catechin and (±)-epicatechin in cocoa and chocolate
products
Laura Shumow1*
and Alison Bodor1
1National Confectioners Association, 1101 30
th St NW, Suite #200, Washington, DC
20007, USA.
*Corresponding author
Email:
Abstract
Background: This manuscript describes the results of an HPLC study for the
determination of the flavan-3-ol monomers, (±)-catechin and (±)-epicatechin, in cocoa
and plain dark and milk chocolate products. The study was performed under the auspices
of the National Confectioners Association (NCA) and involved the analysis of a series of
samples by laboratories of five member companies using a common method.
Methodology: The method reported in this paper uses reversed phase HPLC with
fluorescence detection to analyze (±)-epicatechin and (±)-catechin extracted with an
acidic solvent from defatted cocoa and chocolate. In addition to a variety of cocoa and
chocolate products, the sample set included a blind duplicate used to assess method
reproducibility. All data were subjected to statistical analysis with outliers eliminated
from the data set. Results: The percent coefficient of variation (%CV) of the sample set
ranged from approximately 7 to 15 %. Conclusions: Further experimental details are
described in the body of the manuscript and the results indicate the method is suitable for
the determination of (±)-catechin and (±)-epicatechin in cocoa and chocolate products
and represents the first collaborative study of this HPLC method for these compounds in
these matrices.
Background
The use of cocoa has been documented for almost 4,000 years. The first
population thought to consume the material was the Mesoamericans [1,2]. In the past
decade there has been increasing interest and numerous publications on the putative
health effects associated with the moderate consumption of cocoa and chocolate products
[3-5]. In a parallel fashion, several groups initiated studies into the potential agents
responsible for cardiovascular effects with the flavanols, (±)-catechin and (±)-epicatechin
being candidate compounds [6].
The growing interest in these compounds resulted in a plethora of methods for
quantification in various foodstuffs including tea, wine, grapes and chocolate. While
other analytical methods have been used, HPLC was the predominant method developed
[7-13]. A thorough literature search using Google and Pubmed resulted in thousands of
citations on polyphenol analysis and almost 900 citations on flavanol analysis by HPLC
in chocolate, indicating the recent explosive growth in methods for these analytes.
Considering the increased interest in the cocoa flavanols’ potential cardiovascular effects,
a standard quantification method would be pertinent for accurate determination of dose-
response effects in clinical trials. There is both an ISO and an Institute for Nutraceutical
Advancement (INA) method for flavanols in tea, but not yet a standard method for
flavanol quantification in chocolate and cocoa [14,15].
With this as background, the National Confectioners Association (NCA)
convened an analytical chemistry working group to develop a consensus HPLC method.
This group conducted a collaborative study using samples provided by NCA to establish
a method to quantify (±)-catechin and (±)-epicatechin in cocoa and chocolate and make it
available to the industry.
Experimental
Scope and Applicability: This method is applicable for the analysis of (±)-epicatechin
and (±)-catechin in cocoa powder, chocolate liquor and formulated chocolate products.
This ring trial only included pure chocolate; any products containing inclusions (such as
fruit or nuts) may not be appropriate for this method due to potential interference.
A. Principle
This method determines the (±)-catechin and (±)-epicatechin content of cocoa and
chocolate products. Fat is removed from the sample in order to prevent potential
interference and protect the column by using multiple hexane extractions. Defatted
samples are then dried for subsequent extraction of analytes. Defatted, dried samples are
extracted, with sonication, at 40 °C for 15 minutes using an acetone: water: acetic acid
(70: 29.5: 0.5) solvent mixture. Extracted samples are then centrifuged to remove
insoluble materials and brought up to a defined volume. The extracts are filtered into
HPLC vials for chromatographic analysis. (±)-Catechin and (±)-epicatechin are separated
by a reverse phase mechanism on a C18 column with an acidic acetonitrile-water mobile
phase gradient. Analytes are detected and quantified by their fluorescence, with
excitation at 280 nm and emission at 315 nm.
B. Apparatus
(a) HPLC system: With solvent degasser, binary gradient pumping, gradient
mixer, injector capable of 10 µL injection (either autosampler or manual), column
oven, fluorescence detector and data analysis system
(b) Chromatography column: Reversed phase HPLC column octadecylsilane
(ODS; C18) derivatized silica reversed phase HPLC column, pore size from 100 –
125 A, are recommended. Recommended column: Phenomenex Luna, 5µm,
C18(2), 100A, 250 x 3.0 mm (alternate columns may be used if they provide
acceptable resolution)
(c) Analytical balance: Readability 0.1 mg or lower
(d) Pipettes: Capable of accurately delivering 20-1000 µL; 1-5 mL
(e) Vials: 2 mL, amber glass, screw cap, for storing Stock Standard solutions and
for holding filtered HPLC sample prior to injection
(f) Test Tubes: Screw capped, with caps, capable of holding at least 10 mL
(g) Volumetric flasks: 10 mL, 20 mL, 50 mL and 100 mL, Class A, glass
(h) Centrifuge tubes: Plastic, for single use, 50 mL, screw cap (air tight)
(i) Vortex Mixer
(j) Ultrasonic Bath
(k) Flame-Proof Centrifuge: For centrifuging 50 mL tubes at 2500 x g
(l) Syringe filters: For filtering HPLC samples, 0.45 µm PVDF, PTFE or
hydrophilic polypropylene, 13 or 25 mm diameter (Nylon filters are not
recommended due to potential adsorption of metabolites)
(m) Syringe: All plastic, 1 mL to 5 mL as appropriate
(n) Glass beads: (approx. diameter 5mm)
C. Reagents
(a) Water: High purity deionized water, filtered through a 0.45 µm or smaller
pore filter
(b) Acetonitrile: HPLC grade
(c) Hexane: HPLC grade
(d) Acetone: HPLC grade
(e) Acetic Acid: Glacial
(f) Extraction Solvent: Mix 700 mL Acetone, 295 mL Water and 5 mL Acetic
Acid
(g) Mobile Phase A: 0.2 % Acetic Acid in Water. Add 2 mL Acetic Acid to 1 L
Water.
(h) Mobile Phase B: 0.2 % Acetic Acid in Acetonitrile. Add 2 mL Acetic Acid to
1 L Acetonitrile.
(i) Standards: (±)-Catechin hydrate, purity ≥ 98 %, Sigma-Aldrich C1251-5G or
equivalent; (±)-epicatechin, purity ≥ 98 %, Sigma-Aldrich E4018-1G or
equivalent. Certificate of analysis from supplier is required for purity correction
of each new lot number.
D. Standards and Reagent Blank Preparation
(a) (i.) Stock standard solution A (approx 1000 µg/mL): Into a 50 mL
volumetric flask, accurately weigh approximately 50 mg (±)-catechin hydrate and
50 mg (±)-epicatechin and record the weights. Add extraction solvent and mix or
sonicate to dissolve. Bring to 50.00 mL with extraction solvent and mix. Label as
Stock standard A.
(ii.) Stock standard solution B (approx 100 µg/mL): Pipette, using a Class A
volumetric pipette, 5 mL of Stock standard A into a 50 mL volumetric flask and
dilute to volume with extraction solvent. Label as Stock standard B.
(b) Obtain loss on drying (important for (±)-catechin hydrate): Crystal water is
not stoichiometrically distributed; for (±)-epicatechin loss on drying normally
equals 0) and HPLC purity of analyte from supplier’s certificate of analysis for
each new lot number to calculate purity: Purity (%) = [100 (%) - loss on drying
(%)] * HPLC purity (%) / 100 (%)
Calculate exact concentrations of each component in stock standard solution as
shown below:
(±)-Catechin (µg/mL) = W(±)-Catechin (mg) * 1000 / X (mL) * Purity(±)-catechin (%) / 100
(%)
(±)-Epicatechin (µg/mL)=W(±)-Epicatechin (mg) * 1000 / X (mL)*Purity(±)-epicatechin (%) /
100 (%)
W(±)-Catechin/ (±)-Epicatechin (mg) = weight of reference standards
X (mL) = volume of volumetric flask for stock solution
Stock standard A use concentration as is.
Stock standard B concentrations will require multiplication by an additional 1/10 factor.
(c) Fluorescence Detector Sensitivity Assessment: Stock Standard Selection
(Stock Standard Solutions A, B): When running this method for the first time
inject the appropriate injection volume, 10 µl, of Stock Standard A and B onto the
HPLC system under the conditions provided in Section G. Examine the detector
response for the two concentrations provided. Choose the most concentrated stock
standard solution that does not saturate the detector as the Stock Standard with
which to proceed. Discard the other stock standard solution. If proceeding with
stock standard B, for future analysis note that the stock standard preparation
procedure can be modified by preparing a stock standard solution of 0.1 mg/mL to
save one dilution step.
(d) Reagent Blank: Use extraction solvent for the blank.
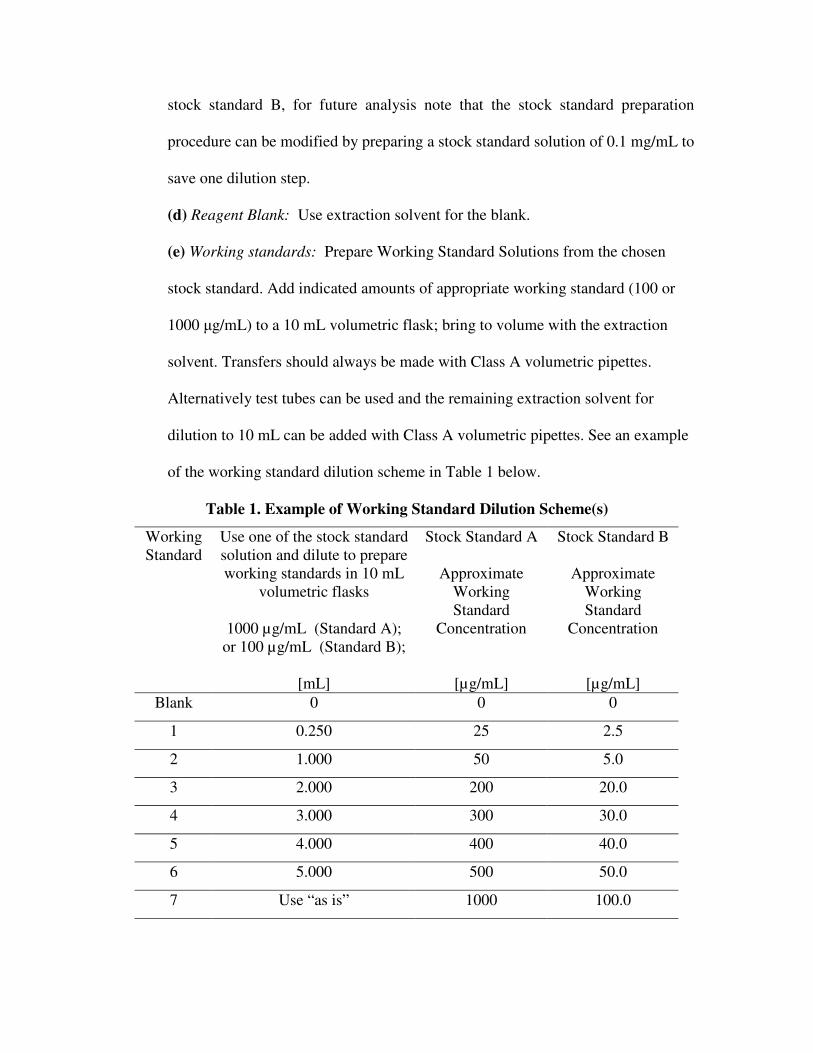
(e) Working standards: Prepare Working Standard Solutions from the chosen
stock standard. Add indicated amounts of appropriate working standard (100 or
1000 µg/mL) to a 10 mL volumetric flask; bring to volume with the extraction
solvent. Transfers should always be made with Class A volumetric pipettes.
Alternatively test tubes can be used and the remaining extraction solvent for
dilution to 10 mL can be added with Class A volumetric pipettes. See an example
of the working standard dilution scheme in Table 1 below.
Table 1. Example of Working Standard Dilution Scheme(s)
Working
Standard
Use one of the stock standard
solution and dilute to prepare
working standards in 10 mL
volumetric flasks
1000 µg/mL (Standard A);
or 100 µg/mL (Standard B);
[mL]
Stock Standard A
Approximate
Working
Standard
Concentration
[µg/mL]
Stock Standard B
Approximate
Working
Standard
Concentration
[µg/mL]
Blank 0 0 0
1 0.250 25 2.5
2 1.000 50 5.0
3 2.000 200 20.0
4 3.000 300 30.0
5 4.000 400 40.0
6 5.000 500 50.0
7 Use “as is” 1000 100.0
(f) Calculate the exact concentration of each component of the working standards
as follows:
E. Lipid Removal from Cocoa and Chocolate Samples
(a) Accurately weigh approximately 2 grams of each finely divided/grated milk
chocolate sample or 1 gram for cocoa powders/baking chocolate/dark chocolate
samples into a labeled, tared 50 mL disposable centrifuge tube. Record the weight
of the sample W SAMPLE.
(b) Add approx. 40 mL hexane (dispenser) and cap tightly.
(c) Mix until the sample is completely dispersed (check visually).
(d) Centrifuge for 5 minutes at 2500 x g.
(e) Carefully decant and dispose of the hexane phase immediately.
(f) Repeat defatting steps (b) to (e) one additional time.
(g) Remove the cap and allow the residual solvent to evaporate in an appropriate
fume hood until remaining hexane has evaporated (e.g. over night). Alternately, a
stream of nitrogen may be used to accelerate the drying process.
F. Preparation of Test Solutions
Continue with whole sample remaining in the centrifugation tube.
(a) Add 2 glass beads to the centrifuge tube containing the dried, defatted sample.
(b) Add 9 mL of extraction solvent (dispenser) and vigorously shake the sample
to break centrifugation pellet. Sample does not need to be completely suspended
yet. Shake headlong, if necessary gently tap several times.
(c) Place in an ultrasonic bath at 40 °C for 15 minutes in total. After 5-10 minutes
of sonication, remove sample from bath and handshake again until sample is
completely suspended (check visually). Alternately, vortex sample.
(d) Remove the sample from the ultrasonic bath, centrifuge at 2500 x g for 5
minutes.
(e) Carefully and slowly decant the liquid portion into a 20 mL Class A
volumetric flask (wide neck, if possible).
(f) Repeat the extraction steps (b) to (d) one additional time. Decant the liquid
from the second extraction into the same 20 mL volumetric flask.
(g) Bring to volume with extraction solvent.
(h) Assemble a Syringe and Syringe Filter. Filter approximately 1 mL of sample
into a HPLC Vial.
(i) Analyze by HPLC as described in Section G.
G. Chromatography
(a) Injection volume: 10 µL
(b) Flow rate: 0.65 mL/min for 3 mm i.d. column; Alter flow rate to maintain
linear flow for other column dimensions.
(c) Detection: Fluorescence with excitation at 280 nm and emission at 315 nm
(d) Column temperature: 40 °C
(e) Gradient Elution: See Table 2 for example gradient conditions. HPLC
columns differ in their selectivity for these compounds. Gradient conditions
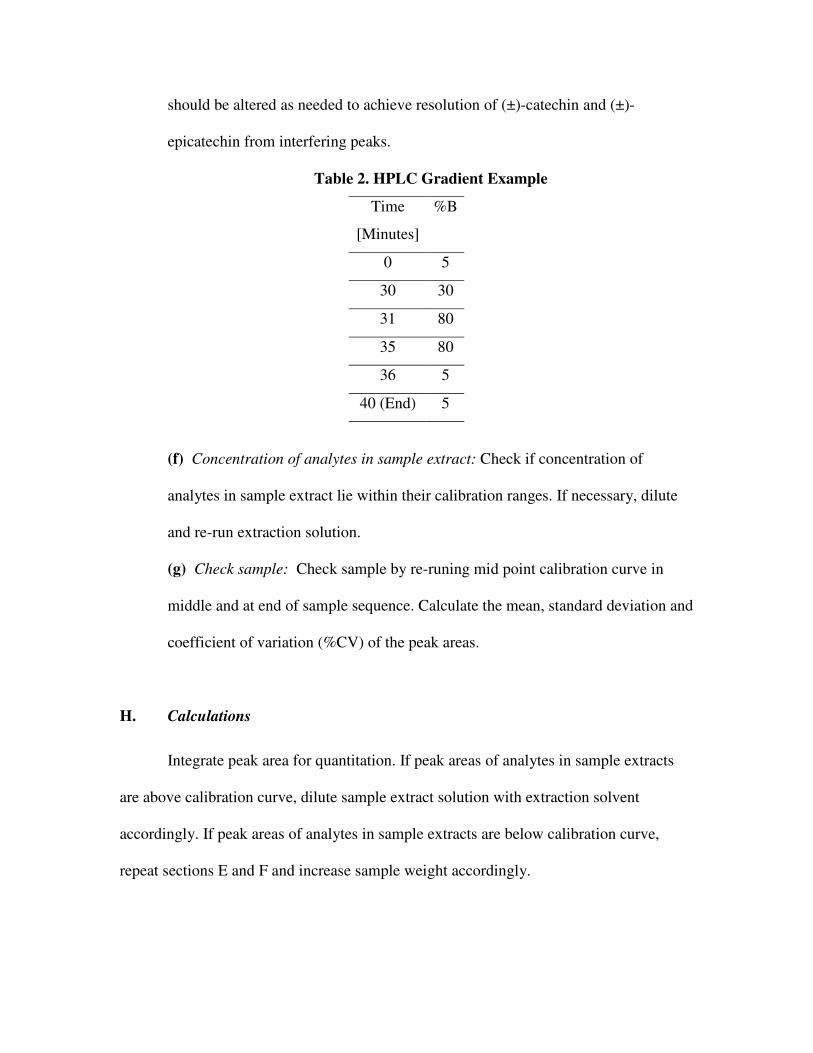
should be altered as needed to achieve resolution of (±)-catechin and (±)-
epicatechin from interfering peaks.
Table 2. HPLC Gradient Example
Time
[Minutes]
%B
0 5
30 30
31 80
35 80
36 5
40 (End) 5
(f) Concentration of analytes in sample extract: Check if concentration of
analytes in sample extract lie within their calibration ranges. If necessary, dilute
and re-run extraction solution.
(g) Check sample: Check sample by re-runing mid point calibration curve in
middle and at end of sample sequence. Calculate the mean, standard deviation and
coefficient of variation (%CV) of the peak areas.
H. Calculations
Integrate peak area for quantitation. If peak areas of analytes in sample extracts
are above calibration curve, dilute sample extract solution with extraction solvent
accordingly. If peak areas of analytes in sample extracts are below calibration curve,
repeat sections E and F and increase sample weight accordingly.
Construct standard curves, plotting calibration standard concentration of each
standard against the area of the standard peak, using linear regression. Calculate the
analytes (±)-catechin and (±)-epicatechin in the original sample as follows:
Analyte in sample [µg/g] = assay concentration of analyte [µg/mL] * x
[mL]/Wsample[g]
WSample [g] = initial sample weight from section E (a)
x [mL] = 20 mL (volume of extraction solution in volumetric flask; section F )
I. HPLC System and Column Performance Criteria Qualification
An HPLC column which fully resolves the analytes of interest may be used for
the method. Gradient slope, flow rates and injection volumes may be altered as
appropriate to accommodate columns of differing dimensions.
J. System Suitability
System suitability is a required procedure to ensure the HPLC system is working
correctly. The following suitability tests are recommended to ensure correct system
operation prior to initial use:
Repeatability and carry-over: Before running any test solutions, demonstrate the
repeatability and lack of carryover of the HPLC system as follows:
(a) System Artifacts: As the first two injections of the day, analyze the blank
standard twice in succession. Inspect the two chromatograms for artifact peaks
from the HPLC system. Artifacts in the first chromatogram, absent in the second,
indicate a buildup of impurities on the system. Artifacts present in both runs
indicate impurities expected in every run. If the first chromatogram shows artifact
peaks but the second chromatogram does not, inject a blank solution as the first
sample in every analytical set. The presence of artifact peaks indicates impurities
in the HPLC solvents, the needle wash system, or carryover in the injection
system. These problems, if present, should be corrected.
(b) Carryover: Inject Standard 5 and then the blank. Carefully examine the
blank injection for carryover peaks. Calculate the carryover of any peaks seen in
the blanks as a percentage of the concentration found in standard 5. Carryover of
standard 5 to the blank injection should be less than 0.1 %.
(c) Linearity of the standard curve: Analyze each of the 5 standards, and
construct a standard curve. The R2 of each standard curve should be greater than
0.9990. If this linearity is not achieved, prepare fresh standards.
(d) System precision: Analyze five replicate analyses of standard number 3.
Calculate the concentration of each analyte and calculate the mean, standard
deviation and percent coefficient of variation (%CV) of the results. The %CV for
all peaks should be ideally less than 2 %.
K. Samples
Samples for analysis were prepared by the NCA Study Director and submitted as blind
samples to five participating laboratories. Samples consisted of cocoa, dark chocolate,
milk chocolate and NIST SRM [2384] Baking Chocolate having certified values for (±)-
catechin and (±)-epicatechin. One dark chocolate samples was used as a blind duplicate
to assess method repeatability.
L. Quantification
Quantification was performed using the external calibration method as described in the
method with all laboratories reporting regression coefficients in excess of 0.99 with the
labs equally divided whether calibration was forced through zero.
Results and Discussion
All results were submitted to the Study Director using the form that was provided with
the samples and with all data statistically evaluated. Samples were run in duplicate or
triplicate. Furthermore each data set was evaluated using the Q-test to test for outliers
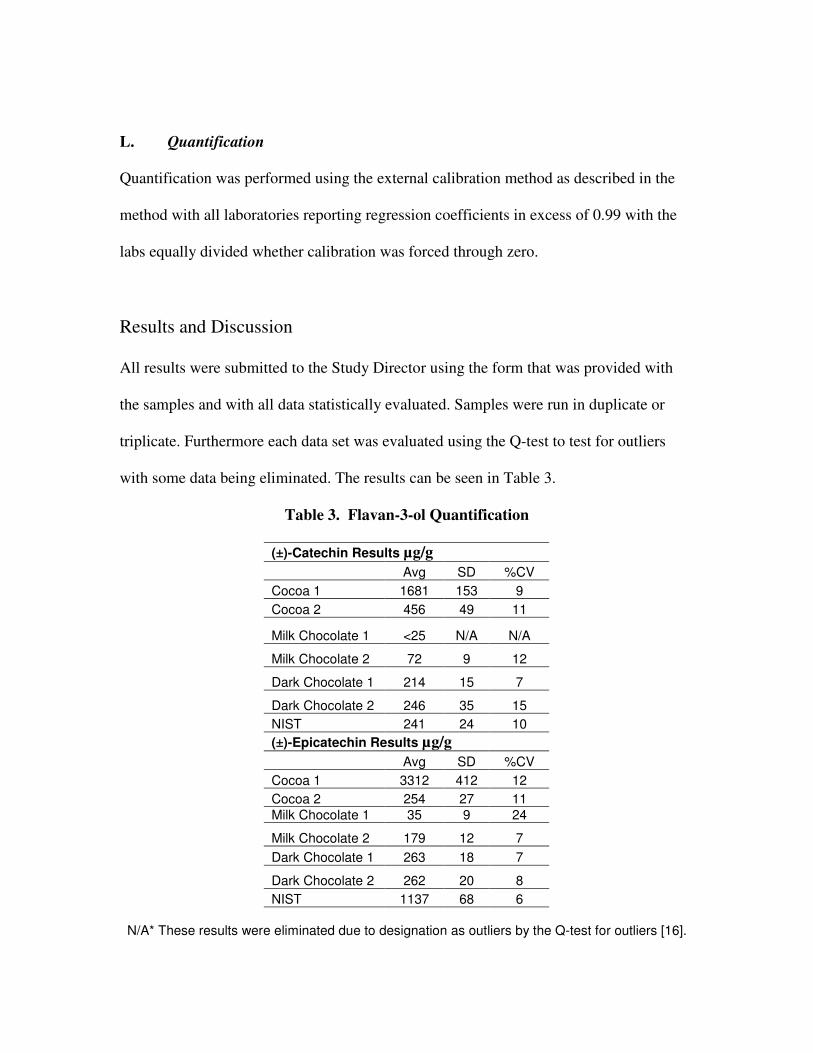
with some data being eliminated. The results can be seen in Table 3.
Table 3. Flavan-3-ol Quantification
(±)-Catechin Results µg/g
Avg SD %CV
Cocoa 1 1681 153 9
Cocoa 2 456 49 11
Milk Chocolate 1 <25 N/A N/A
Milk Chocolate 2 72 9 12
Dark Chocolate 1 214 15 7
Dark Chocolate 2 246 35 15
NIST 241 24 10
(±)-Epicatechin Results µg/g
Avg SD %CV
Cocoa 1 3312 412 12
Cocoa 2 254 27 11
Milk Chocolate 1 35 9 24
Milk Chocolate 2 179 12 7
Dark Chocolate 1 263 18 7
Dark Chocolate 2 262 20 8
NIST 1137 68 6
N/A* These results were eliminated due to designation as outliers by the Q-test for outliers [16].
Figure 1 is a sample chromatogram provided from one laboratory of a dark chocolate
extract. Instrumental conditions are as described in the methods section.
Each laboratory also provided information about LOD (Limit of Detection) which
was in pure solvent in the 40-50 ng/mL. The LOQ (Limit of Quantitation) ranged from 1-
2 µg/g Repeat injections of standards were also accomplished with %CVs reported in the
1-4 % range.
The NIST (National Institute of Standard Technology) reference values for (±)-
catechin and (±)-epicatechin in SRM (Standard Reference Material) 2384 are 245 +/- 51
(µg/g) and 1220 +/- 22 (µg/g) respectively with the data from this study indicating value
of 254 +/- 23.5 (µg/kg) and 1137 +/- 68 (µg/kg) which are within the acceptable range
of determinations established by NIST. While recovery studies have become a default
method to assess method accuracy according to Swartz and Krull, the analysis of an
established SRM is by itself a generally accepted method of validation [17]. Additionally,
guidance from AOAC on methods validation indicates that spiking is not a desirable
method to assess method accuracy as spiking solutions tend to be easily extractable hence
the choice of the NIST standard to evaluate the method.
The sample labeled Milk Chocolate 1 is an example for a product containing very
low amounts of the target analytes. With the analyte concentration in the sample extract
at their lower limit of quantification and the chromatographic performance negatively
affected by co-extracted matrix compounds the applied method operates at its limit.
Hence the sample was not included in the statistical evaluation of the method. That being
said, no issues related to complexation of polyphenols with milk reported by some
researchers were seen [18].
The %CV ranged from 7-15 % in this study. Laboratories used a column that
satisfied the requirements of U.S. Pharmacopeia, previously described in methodology
section [19]. The method was reviewed and compared with recommendations of Swartz
and Krull. Finally, while the data in Table 3 may seem excessive to the casual observer, it
is well within the parameters established by AOAC for another complex analyte [20].
The literature reports on the use of numerous solvents for the extraction of flavan-
3-ols including mixtures of methanol, acetone, water and acid therefore the solvent
combination used is within established parameters [21,22]. Furthermore, a variety of
HPLC detector types have been used including UV, Diode Array, Mass Spec and
fluorescence [23-27]. The choice of fluorescence detection is within established
analytical parameters for this determination as it offers selectivity and sensitivity for
these compounds with the identity of the peaks being established by the use of authentic
standards.
Conclusion
The data from these studies indicate the proposed chocolate and cocoa method is suitable
as an HPLC method for the determination of flavanol monomers, (±)-catechin and (±)-
epicatechin in chocolate and cocoa. The method is the first such method developed by an
industry group such as NCA for this purpose.
Abbreviations
HPLC – High-Performance Liquid Chromatography; ISO – International Organization
for Standardization; mL – Milliliter; °C – Degrees Celsius; nm – Nanometer; mm –
Millimeter; µm – micrometer; PVDF – Polyvinylidene Fluoride; PTFE –
Polytertrafluoroethylene; L – Liter; mg – Milligram; g – Gram; Min – Minutes; µg –
Microgram; % - Percent; NIST – National Institute of Standards and Technology; SRM –
Standard Reference Method; LOD – Limit of Detection; LOQ – Limit of Quantification;
AOAC – Association of Official Analytical Chemists; UV -Ultraviolet
Competing interests
The authors declare that they have no competing interests.
Authors’ contributions
AB selected standard and sample preparation methods, chromatography parameters and
suitable commercial samples. LS distributed samples to participating laboratories,
collected and analyzed data and prepared the manuscript. All authors read and approved
the final manuscript.
Acknowledgements
The authors would like to thank the following company’s laboratories for their
participation in validating the method by testing commercial samples: The Hershey
Company, Archer Daniels Midland Company, Kraft Europe, Kraft-Cadbury and Barry
Callebaut. NCA is especially grateful to the following individuals for their commitment
throughout this process: Jeff Hurst, Mark Payne, Lindo Groff, Mark Collison, Eva-Maria
Berndt, Verena Jendreizik, Alison Branch and Olivier Nuytten.
References
1. Powis TG, Hurst WJ, Rodriguez MC, Ortiz CP, Blake M, Cheetham D, Coe MD,
Hodgson JG: The Origins of Cacao Use in Mesoamerica. Mexicon 2008, 30 (2):
35-38.
2. Crown PL, Hurst WJ: Evidence of Cacao Use in the Prehispanic American
Southwest. Proc Natl Acad Sci U S A. 2009, 106 (7): 2110-3.
3. Farouque H, Leung M, Hope S, Baldi M, Schechter C, Cameron J, Meredith I: Acute
and Chronic Effects of Flavanol-Rich Cocoa on Vascular Function in Subjects
With Coronary Artery Disease: a Randomized Double-Blind Placebo-
Controlled Study. Clinical Science 2006, 111: 71-80.
4. Flammer AJ, Hermann F, Sudano I, Spieker L, Hermann M, Cooper KA, Serafini M,
Luscher TF, Ruschitzka F, Noll G, Corti R: Dark Chocolate Improves Coronary
Vasomotion and Reduces Platelet Reactivity. Circulation 2007, 116 (21): 2376-
2382.
5. Corti R, Flammer AJ, Hollenberg NK. Luscher TF: Cocoa and Cardiovascular
Health. Circulation 2009, 119 (10): 1433-1441.
6. Heiss C, Dejam A, Kleinbongard P, Schewe T, Sies H, Kelm M: Vascular Effects of
Cocoa Rich in Flavan-3-Ols. Journal of American Medical Association 2003, 290
(8): 1030-1031.
7. Harborne JB: Phytochemical methods: a guide to modern techniques of plant
analysis. Springer: New Delhi, India; 1998
8. Merken HM, Beecher GR: Liquid Chromatographic Method for the Separation
and Quantification of Prominent Flavonoid Aglycones. Journal of
Chromatography 2000, 897 (1-2): 177-184.
9. Moon JK, Shibamoto T: Antioxidant Assays for Plant and Food Components. J
Agric Food Chem 2009, 57 (5): 1655-1666.
10. Beekwilder J, Jonker H, Meesters P, Hall RD, van der Meer IM, De Vos CHR:
Antioxidants in Raspberry: on-Line Analysis Links Antioxidant Activity to a
Diversity of Individual Metabolites. J Agric Food Chem 2005, 53 (9): 3313-3320.
11. Stewart AJ, Mullen W, Crozier A: On-Line High-Performance Liquid
Chromatography Analysis of the Antioxidant Activity of Phenolic Compounds
in Green and Black Tea. Mol Nutr Food Res 2005, 49 (1): 52-60.
12. Gotti R, Fiori J, Mancini F, Cavrini V: Modified Micellar Electrokinetic
Chromatography in the Analysis of Catechins and Xanthines in Chocolate.
Electrophoresis 2004, 25 (18-19): 3282-91.
13. Hammerstone, Lazarus, Mitchell, Rucker, Schmitz: Identification of Procyanidins
in Cocoa (Theobroma cacao) and Chocolate Using High Performance Liquid
Chromatography/Mass Spectrometry. J Agric Food Chem 1999, 47: 490-496.
14. International Organization for Standardization: Determination of Substances
Characterisic of Green and Black Tea -- Part 2: Content of Catechins in Green
Tea -- Method Using High-Performance Liquid Chromatography. Geneva,
Switzerland: ISO 14502-2, 2005.
15. INA International: Determination of Total Catechin and Gallic Acid in Green
Tea [http://www.nsf.org/business/ina/greentea.asp?program=INA]
16. Dean RB, Dixon WJ: Simplified Statistics for Small Numbers of Observations.
Anal. Chem 1951, 23 (4): 636–638.
17. Swartz M, Krull I: Analytical Method Development and Validation. Marcell Dekker:
New York, 1997; 21-35.
18. Serafini M, Bugianesi R, Maiani G, Valtuena S, De Santis S, Crozier A: Plasma
antioxidants from chocolate. Nature 2003, 424(6952): 1013.
19. The United States Pharmacopia: About the Columns Data.
[http://www.usp.org/USPNF/columnsIntro.html]
20. Alder L, Holland PT, Lantos J, Lee M, MacNeil, JD, O’Rangers, J, van Zoonen P,
Ambrus A: Guidelines for Single-Laboratory Validation of Analytical Methods
for Trace-Level Concentrations of Organic Chemicals. In Principles and
Practices of Method Validation. Edited by Fajgelj A, Ambrus A: The Royal Society
of Chemistry: Cambridge, U.K., 2000; 179–248
21. Wallace TC, Giusti MM: Extraction and Normal-Phase HPLC-Fluorescence-
Electrospray MS Characterization and Quantification of Procyanidins in
Cranberry Extracts. J Food Sci 2010, 75(8): C690-6.
22. Unachukwu UJ, Ahmed S, Kavalier A, Lyles JT, Kennelly EJ: White and green
teas (Camellia sinensis var. sinensis): variation in phenolic, methylxanthine, and
antioxidant profiles. J Food Sci 2010, 75(6):C541-8.
23. Sparzak B, Merino-Arevalo M, Vander Heyden Y, Krauze-Baranowska M, Majdan
M, Fecka I, Głód D, Bączek T: HPLC analysis of polyphenols in the fruits of
Rubus idaeus L. (Rosaceae). Nat Prod Res. 2010, 24(19):1811-22.
24. Furuuchi R, Yokoyama T, Watanabe Y, Hirayama M: Identification and
quantification of short oligomeric proanthocyanidins and other polyphenols in
boysenberry seeds and juice. J Agric Food Chem. 2011, 59(8):3738-46.
25. Chira K, Lorrain B, Ky I, Teissedre PL : Tannin composition of cabernet-
sauvignon and merlot grapes from the bordeaux area for different vintages
(2006 to 2009) and comparison to tannin profile of five 2009 vintage
mediterranean grapes varieties. Molecules. 2011, 16(2):1519-32.
26. Leitao C, Marchioni E, Bergaentzlé M, Zhao M, Didierjean L, Taidi B, Ennahar S:
Effects of processing steps on the phenolic content and antioxidant activity of
beer. J Agric Food Chem. 2011, 59(4):1249-55.
27. Neves AC, Spranger MI, Zhao Y, Leandro MC, Sun B: Effect of addition of
commercial grape seed tannins on phenolic composition, chromatic
characteristics, and antioxidant activity of red wine. J Agric Food Chem. 2010,
58(22):11775-82.
Figure legends
Figure 1: Chromatogram of Dark Chocolate Extract Analyzed Under Method Parameters
Peak at 11.964 is (±)-catechin while peak at 14.422 is (±)-epicatechin.
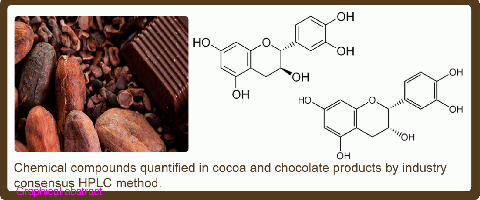
Figure 1


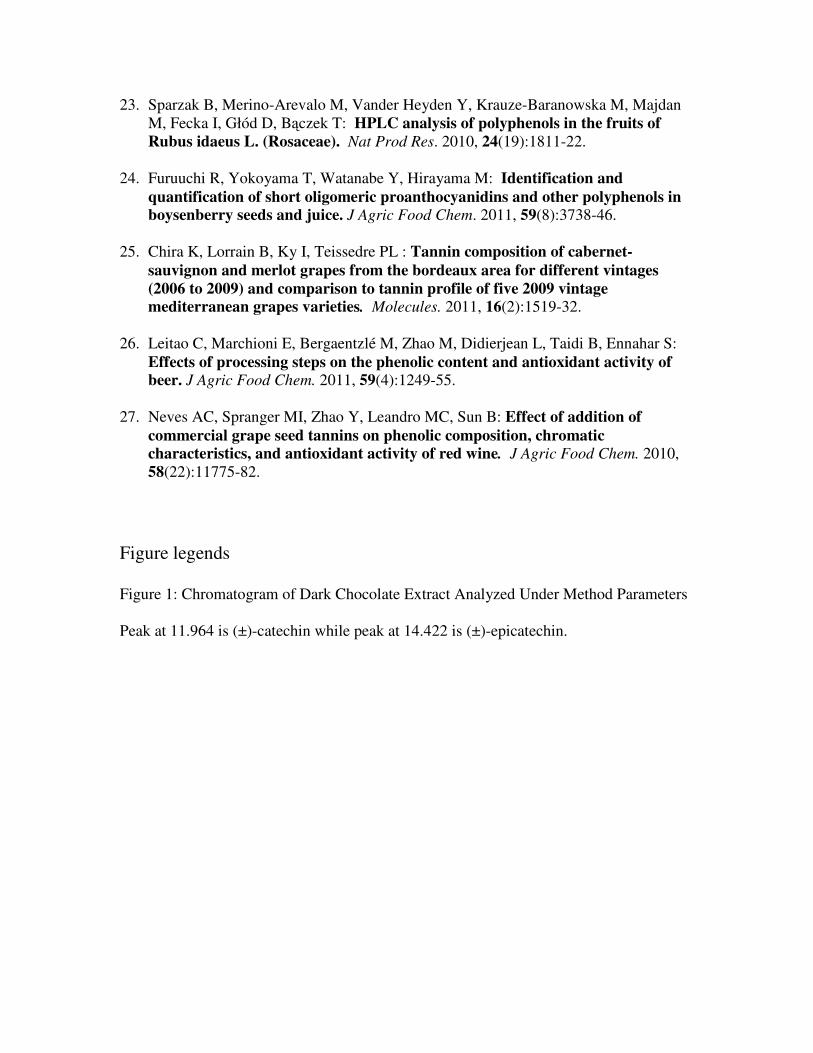
![Flavan-3-ols Are an Effective Chemical Defense against ... · Flavan-3-ols Are an Effective Chemical Defense against Rust Infection1[OPEN] Chhana Ullah,a Sybille B. Unsicker,a Christin](https://img.pdfslide.net/doc/110x75/5f6150569b455c300b5cf2f9/flavan-3-ols-are-an-effective-chemical-defense-against-flavan-3-ols-are-an-effective.jpg)