Embed Size (px)
Citation preview
8/2/2019 Chemo Metric in Chromatography
http://slidepdf.com/reader/full/chemo-metric-in-chromatography 1/34
Application of Chemometrics in
Separation Science
A. C. Duarte
Departamento de Quımica, Universidade de Aveiro, Aveiro, Portugal
S. Capelo
Departamento de Ecologia, Universidade de Evora, Evora, Portugal
Abstract: Chemometrics aims at extracting maximum information through the appli-
cation of statistics and mathematics to problems of a chemical nature. Over the years,
chemometrics has become an important chemical discipline with a significant impact in
analytical chemistry, including the incorporation of significant improvements in design
and selection of optimal experimental procedures, calibration of analytical instrumen-
tation, and advanced methods for analysis of chemical data.
The application of chemometrics methods to separation science, mainly chromato-
graphy and capillary electrophoresis, has followed the same increasing trend as in
any other field of analytical chemistry. However, reviews on the application of
chemometrics in separation science have been very scarce. Therefore, in this paper,
the development of chemometrics in chromatography and capillary electrophoresis
will be presented with a view of the current state of the-art and with the prospects
for the future.
Keywords: Chemometrics, Chromatography, HPLC, Capillary electrophoresis,Principal component analysis
INTRODUCTION
The major areas of chemometrics chosen to be reviewed in a recent paper[1]
about the evolution of chemometrics related to analytical chemistry,
included multivariate calibration, pattern recognition, and mathematical
Address correspondence to A. C. Duarte, Departamento de Quımica, Universidade
de Aveiro, 3810-193 Aveiro, Portugal. E-mail: [email protected]
Journal of Liquid Chromatography & Related Technologiesw, 29: 1143–1176, 2006
Copyright# Taylor & Francis Group, LLCISSN 1082-6076 print/1520-572X online
DOI: 10.1080/10826070600574929
1143
8/2/2019 Chemo Metric in Chromatography
http://slidepdf.com/reader/full/chemo-metric-in-chromatography 2/34
mixture resolution. Such a division seems most appropriate to follow also in
this review of applications of chemometrics to separation science for two
main reasons: (a) it becomes easy to compare and follow the evolution of
different studies in a specific area; and (b) for lecturing purposes it is useful
to have a review on this subject structured in well known areas.
In another review paper,[2] specific for optimization methods in chromato-
graphy and capillary electrophoresis, a distinction is made in what concerns
the use of chemometrics methods where no explicit models are required,
and hard modelling when models are available, and, in such a case, optimi-
zation can be performed by regression methods. Hard modelling can not be
left completely out of this review on the application of chemometrics toseparation science, since both the large variety of chromatographic parameters
and the vast number of relationships between them leads to the conclusion that
the combination of chemometrics methods with hard modelling will certainly
bring some improvements to the prediction of retention,[2,3] one of the most
specific application of chemometrics to separation sciences. Besides, if one
considers the general definition of chemometrics as mentioned at the top of
this review, there is no practical reason for making a distinction between
the application of chemometrics, and/or hard modelling to separation
science. They both aim at extracting maximal chemical information through
the application of statistical and mathematical methods.
Various textbooks on the major areas of Chemometrics, as well asdedicated journals are available, and as a first approach, the review paper
on the evolution of chemometrics[1] can be considered an excellent source
of references to start with, besides containing short introductions to several
relevant methods for multivariate calibration, pattern recognition, and
mixture resolution. Another recent review paper[4] on chemometrics in
Hungary, for the last 10 years, also deserves a special mention as a source
of important information on the work of chemometricians, although only
focused on the Hungarian works.
The specificities of separation science bring into play subjects such as
analysis of peak asymmetry, peak overlapping, and quantitative structure
retention relationship, which are not usually highlighted in reviews of
chemometrics. Although the general accepted classification of major areas
in chemometrics will be used in this review, one must bear in mind that the
same method (such as artificial neural networks) can be used in different
applications (such as multivariate calibration or prediction of retention).
Therefore, this review is an attempt to reach equilibrium between emphasizing
the applications of chemometrics methods, without loosing sight of the
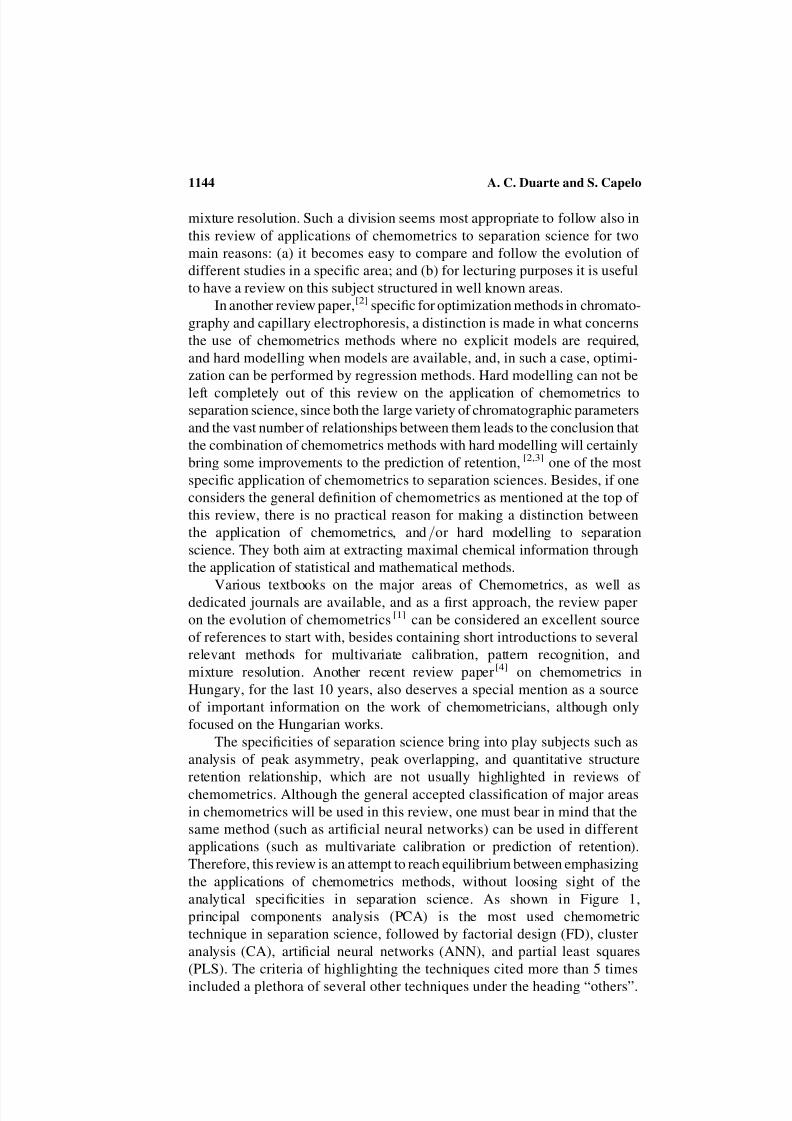
analytical specificities in separation science. As shown in Figure 1,
principal components analysis (PCA) is the most used chemometric
technique in separation science, followed by factorial design (FD), cluster
analysis (CA), artificial neural networks (ANN), and partial least squares
(PLS). The criteria of highlighting the techniques cited more than 5 times
included a plethora of several other techniques under the heading “others”.
A. C. Duarte and S. Capelo1144
8/2/2019 Chemo Metric in Chromatography
http://slidepdf.com/reader/full/chemo-metric-in-chromatography 3/34
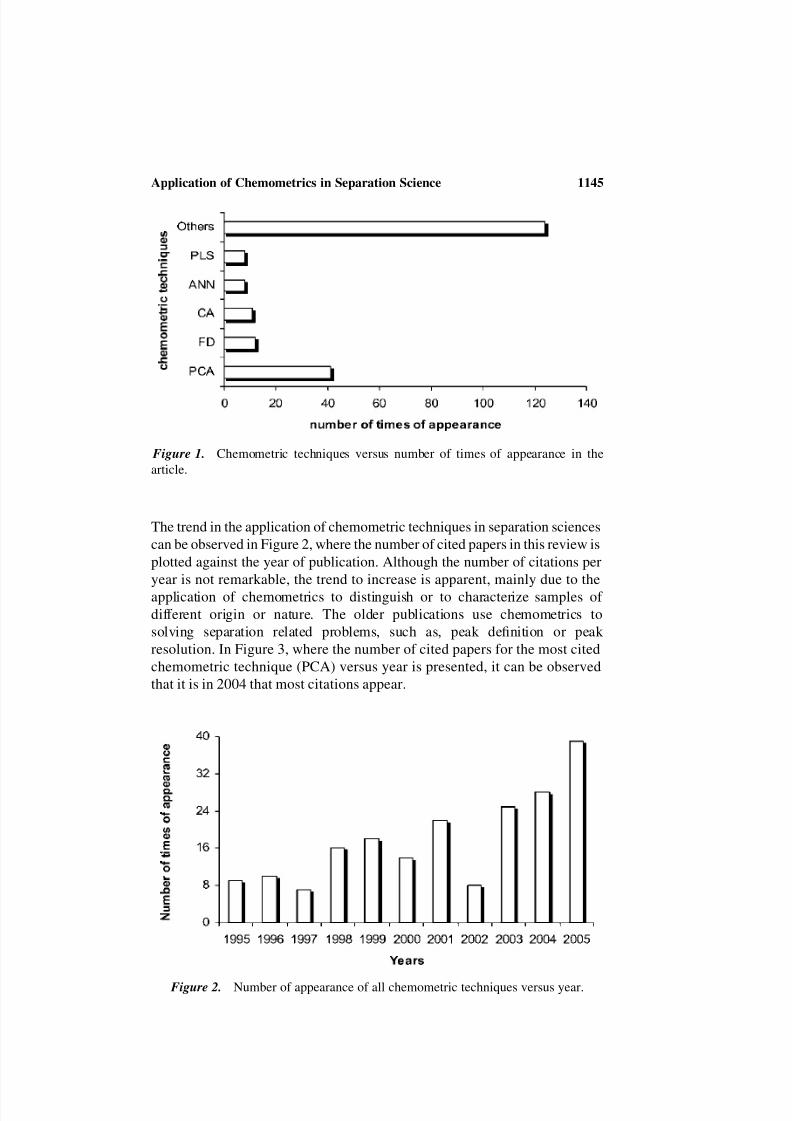
The trend in the application of chemometric techniques in separation sciences
can be observed in Figure 2, where the number of cited papers in this review is
plotted against the year of publication. Although the number of citations per
year is not remarkable, the trend to increase is apparent, mainly due to the
application of chemometrics to distinguish or to characterize samples of
different origin or nature. The older publications use chemometrics to
solving separation related problems, such as, peak definition or peak
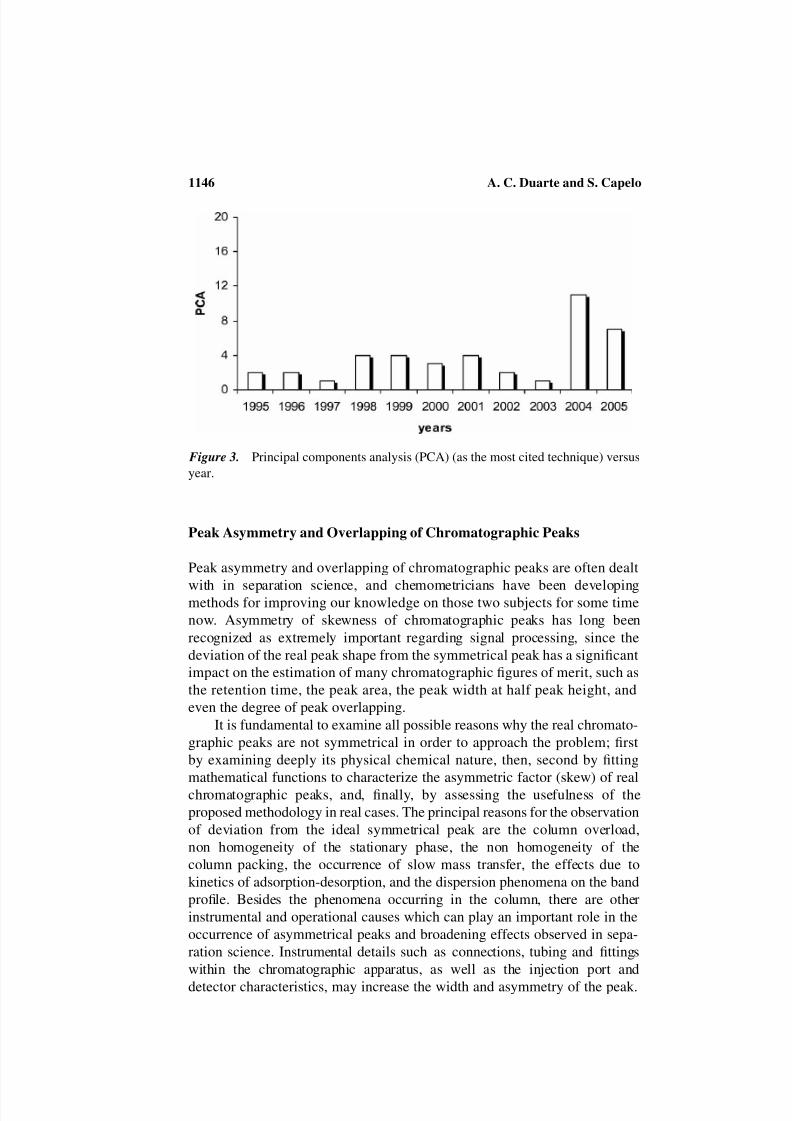
resolution. In Figure 3, where the number of cited papers for the most cited
chemometric technique (PCA) versus year is presented, it can be observed
that it is in 2004 that most citations appear.
Figure 1. Chemometric techniques versus number of times of appearance in the
article.
Figure 2. Number of appearance of all chemometric techniques versus year.
Application of Chemometrics in Separation Science 1145
8/2/2019 Chemo Metric in Chromatography
http://slidepdf.com/reader/full/chemo-metric-in-chromatography 4/34
Peak Asymmetry and Overlapping of Chromatographic Peaks
Peak asymmetry and overlapping of chromatographic peaks are often dealt
with in separation science, and chemometricians have been developingmethods for improving our knowledge on those two subjects for some time
now. Asymmetry of skewness of chromatographic peaks has long been
recognized as extremely important regarding signal processing, since the
deviation of the real peak shape from the symmetrical peak has a significant
impact on the estimation of many chromatographic figures of merit, such as
the retention time, the peak area, the peak width at half peak height, and
even the degree of peak overlapping.
It is fundamental to examine all possible reasons why the real chromato-
graphic peaks are not symmetrical in order to approach the problem; first
by examining deeply its physical chemical nature, then, second by fitting
mathematical functions to characterize the asymmetric factor (skew) of real
chromatographic peaks, and, finally, by assessing the usefulness of the
proposed methodology in real cases. The principal reasons for the observation
of deviation from the ideal symmetrical peak are the column overload,
non homogeneity of the stationary phase, the non homogeneity of the
column packing, the occurrence of slow mass transfer, the effects due to
kinetics of adsorption-desorption, and the dispersion phenomena on the band
profile. Besides the phenomena occurring in the column, there are other
instrumental and operational causes which can play an important role in the
occurrence of asymmetrical peaks and broadening effects observed in sepa-
ration science. Instrumental details such as connections, tubing and fittings
within the chromatographic apparatus, as well as the injection port and
detector characteristics, may increase the width and asymmetry of the peak.
Figure 3. Principal components analysis (PCA) (as the most cited technique) versus
year.
A. C. Duarte and S. Capelo1146
8/2/2019 Chemo Metric in Chromatography
http://slidepdf.com/reader/full/chemo-metric-in-chromatography 5/34
Operational details, such as when the temperature of the injection port in gas
chromatography is not high enough, may cause the occurrence of peaks with
a significant degree of tailing.
The above mentioned approach has been generally followed and conse-
quently, many methods can be found in the literature for the determination
of chromatographic peak parameters and calculation of factors related to
peak shape asymmetry. These methods have been revisited and reviewed to
the point of suggesting a new method for the determination of peak shape
asymmetry in chromatography.[5] First, the real chromatographic peak is
fitted to a mathematical function,[6] and then the peak width of the symmetri-
cal curve is fitted to the measured data with the same peak maximum positionand height of the fitted asymmetrical peak. The differences of the asymmetri-
cal and symmetrical peaks and the areas of the difference curve on the
ascending and descending half parts of the peak characterize the real
asymmetry of the measured peak.[5] The application of this concept to
separation of phenol derivatives by HPLC in the function of flow velocity,
allowed not only determination of asymmetry factors but also suggest that
the examination of asymmetry can give an insight into the physicochemical
processes occurring in the column.[5] The effect of intraparticle mass
transfer resistances on the chromatographic peak shape was studied both
theoretically and experimentally in chromatography of proteins,[7] where
very broad and highly asymmetrical peaks are usually observed.Besides skewed peaks, it is also usual to observe the occurrence of
overlapped (and skewed) peaks, which further increases the difficulties of
assessing the chromatographic figures of merit. Cai and Wu[8] developed a
method for calculating the statistical moments of overlapped peaks by using
a parameter determined from the leading half of the peak to indicate the
peak asymmetry, and the method was successfully applied for the deconvolu-
tion of a series of overlapping peaks. Papai and Pap[9] suggested a new mathe-
matical equation, result of the product of a Gaussian function and a
polynomial, to fit symmetric, asymmetric, and strongly fronting peaks,
adequate for the determination of chromatographic peak parameters by
nonlinear curve fitting using statistical moments; furthermore, the function
could be used, with acceptable results, for resolution of overlapped peaks,
correction of baseline drift and noise filtering. Fourier transformation (FT)
has been applied to multicomponent chromatograms in order to characterize
retention patterns,[10] to improve the signal to noise ratio of chromatographic
peaks[11] and, at a further stage, to unravel superposition of more complex
retention patterns.[12] A combination of a stochastic model with mobile
phase dispersion has been proposed by Felinger et al.,[13] as the stochastic-
dispersive theory of chromatography, to include the effects of slow mass
transfer or adsorption-desorption kinetics and the band profile axial dispersion
on the full description of the efficiency of separations, as well as the chromato-
graphic peak features. Pietrogrande et al.[14] reported a general method for
evaluating the statistical degree of peak overlapping in a multicomponent
Application of Chemometrics in Separation Science 1147
8/2/2019 Chemo Metric in Chromatography
http://slidepdf.com/reader/full/chemo-metric-in-chromatography 6/34
chromatogram, once the retention pattern is determined in advance. The same
basic principles were also used for deconvolution of overlapping skewed
peaks,[15]
and for determination of the critical degree of peak overlap[16]
in
multicomponent chromatograms. In this case, as the heights of adjacent
peaks may differ widely, no single value of critical peak resolution can be
determined in multicomponent chromatograms. Therefore, only a distribution
of critical peak resolutions can be determined by using the peak height
distribution. A mathematical function has been derived by Fellinger[16] for
the critical peak resolution, from which the average or maximum probable
peak resolution can be obtained by integration.
Besides further examples of utilization of Fourier transform[17,18]
fordecoding complex multicomponent chromatograms, the extended Kalman
filter in frequency domain[19] has also been a useful method to perform
parameter estimation on the basis of the FT of the signal, and used for the
evaluation of overlapping signals, mainly for noise filtering and for deconvo-
lution by peak sharpening.
Liu and Davis[20] evaluated the predictions of the statistical overlap
theory in the observed peak overlap of 38 neutral compounds by micellar elec-
trokinetic chromatography (MEKC), based on the assumption of an inhomo-
geneous Poisson distribution of migration times. Besides, the probability
distributions and statistical moments in the separation were computed by
Monte Carlo simulation.Zhang et al.[21] reported the successful application of multilayer percep-
tion artificial neural networks (ANN), based on genetic input selection for
quantification of the unresolved peaks in micellar electrokinetic capillary
chromatography-DAD.
Gao et al.[22] modified the non-negative matrix factorization introducing
the characteristics of the chemical signals, such as smoothness of spectra,
unimodality of chromatograms, and sparseness of mass spectra for resolving
overlapping spectra and, therefore, transforming the traditional NMF
algorithm adequate as a resolution method for complex samples.
Hu et al.[23] proposed a singular value ratio (SVR) for resolving peaks in
HPLC-DAD and detecting the presence of impurities in complex mixtures.
This simple chemometric approach is based on the technique of moving
fixed size windows along the retention time axis and extracts information
about selectivity in singular value evolving profiles, in order to more effec-
tively determine peak homogeneity for HPLC-DAD.
Quantitative Structure – (Chromatographic) Retention
Relationships (QSRR)
Reubsaet and Jinno[24] on reviewing and discussing the interactions between
an analyte and the stationary phase with relation to the physicochemical
properties of both, concluded that a chemometric approach provides insight
A. C. Duarte and S. Capelo1148
8/2/2019 Chemo Metric in Chromatography
http://slidepdf.com/reader/full/chemo-metric-in-chromatography 7/34
into combinations of these interactions that dominate the retention behaviour
of analytes in RP-HPLC.
Heberger,[25]
on examining QSRR of 20 hydrocarbons (mainly alkylben-
zenes) in silicone oil 550 (moderately polar phase) or bentone 34 (polar phase)
as the stationary phase, when establishing empirical correlations between gas
chromatography retention data and physical or topological properties of solute
molecules, has shown the superiority of a nonlinear fitting equation in describ-
ing retention time using a boiling point (BP) and another topological descrip-
tor. Also, Heberger[26] later proved the excellence of the predictive ability of
this nonlinear model for apolar and slightly polar stationary phases using alkyl
benzenes as model compounds. Finally, Heberger and Kowalska[27]
developedstudies on the thermodynamics of Kovats retention index-boiling point corre-
lations for alkylbenzenes in gas chromatography, which allowed prediction of
retention indices, standard chemical potential of partitioning of one methylene
group of n-alkane, and the average heat of vaporization/solution values for
low and moderately polar stationary phases.
Kaliszan[28] reviewed the combination of available data regarding the
application of affinity CD and HPLC and chemometrics (mainly MLR,
PCA, and Cluster Analysis (CA)) to evaluate the strength of drug-protein
interactions, and to provide information of relevance to molecular pharma-
cology and for drug design. QSRR equations derived for test series of drug
analytes are interpreted in terms of structural specificities of binding sites inbiomacromolecules. In another review on the role of chromatography and
capillary electrophoresis in modelling the basic processes of drug action,
Kaliszan[29] emphasized the combination of separation sciences and chemo-
metrics (such as PCA) for increasing speed and efficiency in establishing
quantitative relationships between the chemical structure of drugs and their
ability to participate in intermolecular interactions with the components of
living systems, besides reducing the research costs with new drugs and the
use of laboratory animals. The principles and methodology of QSRR using
biologically active chemicals are discussed by Kaliszan[29] in the context of
using the chromatographically measured parameters for describing the inter-
actions of drugs with biomolecules, in order to predict quantitative differences
in specific bioactivity parameters of a given pharmacological family, i.e.,
establishing quantitative structure activity relationships (QSAR) with
retention parameters serving as structure parameters.
The retention characteristics of a newly designed cholesterol bound silica
gel stationary phase for RP-HPLC were revealed by analysis of QSRR, which
was derived by multiple regression analysis (MRA), using three groups of
structural descriptors of analytes and the log k w data determined on the new
stationary phase.[30]
Baggiani et al.[31] used PCA combined with PCR to search for corre-
lations between the selectivity of a pentachlorophenol (PCP) imprinted
polymer packed in a HPLC column and the molecular descriptors of 52
PCP-related phenols. The QSRR procedures were applied to correlate the
Application of Chemometrics in Separation Science 1149
8/2/2019 Chemo Metric in Chromatography
http://slidepdf.com/reader/full/chemo-metric-in-chromatography 8/34
chromatographic behaviour of several phenols, mainly characterized by their
retention time, with structural parameters determined by molecular mecha-
nisms or semi empirical quantum chemical techniques. The magnitude of
the multivariate model’s parameters shows that selectivity is strongly influ-
enced by molecular descriptors having a structural character, while the
effect of molecular descriptors having an electronic character is much less
marked.
Bolliet and Poole[3] used statistical mixture design techniques associated
to the solvation parameter model, in order to predict retention time in reversed
phase liquid chromatography using ternary mobile phase compositions. The
solvation model is used to obtain system constants characteristic of thechromatographic capability for defined solvent-solvent and solute-solvent
interactions. The mixture design was used to build system surfaces, for each
system constant for all mobile phase concentrations, which could then be
used in models to predict the retention of a wide group of 36 solutes on a
porous polymer sorbent at a methanol-acetonitrile-water composition not
included in the data used to construct the system surfaces.
Quantum chemical calculations provide acceptable descriptors for
characterization of molecular properties in QSRR. Kortvelyesi et al.[32,33]
established correlations between the Kovats retention index and quantum
chemical descriptors for aliphatic ketones and aldehydes on stationary phases
of different polarity, besides developing calculations of quantum chemicaldescriptors (i.e., van der Waals’ surface areas and volumes), and highlighting
their good correlation with the Kovats retention index for alkanes, alkenes,
and azo compounds. Kortvelyesi et al.[32] used multiple linear regression
(MLR), cluster analysis (CA), and principal component analysis (PCA) for
the statistical evaluation of the relationships between Kovats retention
indices and the calculated molecular descriptors. Unusual retention relations
have been observed by Kivaly et al.[34] in the gas chromatography of
N,N0-dialkylhydrazones (DAHs), where different correlations are necessary
for calculation of retention indices for aldehyde and ketone DAHs, due to the
different resonance structures in the aldehyde and ketone derivatives.
A PLS model has been built by Heberger et al.[35] to estimate retention
data of 35 aliphatic ketones and aldehydes at different temperatures (50, 70,
90, and 1108C) and various stationary phases of different polarity, and also
to discriminate between ketones and aldehydes on the basis of their
retention date and physical properties (structural descriptors). Multiple
linear regression (MLR) was also used by Markuszewski et al. [36] to derive
QSRR (relating retention parameters to hydrophobicity parameters,
hydrogen bond descriptors and structural parameters from molecular
modelling) to evaluate the partition mechanism of environmental significant
compounds (mainly nitroaromatics and their transformation products around
former ammunition plants) on new stationary phase materials. Furthermore,
the chromatographic retention data, once subjected to PCA, allowed the
assignment of individual pollutants to defined metabolic routes.
A. C. Duarte and S. Capelo1150
8/2/2019 Chemo Metric in Chromatography
http://slidepdf.com/reader/full/chemo-metric-in-chromatography 9/34
Canonical correlation analysis (CCA) has been used in QSRR by Forga cs
and Cserhati[37] on their work to relate retention characteristics with physico-
chemical parameters of barbituric acid derivates on a porous graphitized
carbon column using water-tertrahydrofuran mixtures as solvents, and
concluded that the electronic parameters exerted the highest impact on the
retention, while the hydrophobicity was negligible.
Valko et al.[38] established relationships between the chromatographic
hydrophobicity indices (CHI) and solute descriptors obtained by using
several reversed-phase, diol, nitrile, cyclodextrin, and immobilised artificial
membrane bonded HPLC columns. The CHI data obtained on various
HPLC stationary phases were subjected to multiple regression analysis(MRA) and PCA.
Since the partitioning of drugs is often mainly ruled by their hydrophobi-
city character, a fast screening of new drug candidates is performed by corre-
lating the logarithm of the retention factors (log k ) from classical RP-HPLC
with hydrophobicity expressed by the partition coefficient, log P. The use of
new methods, which include stationary phase models of biological
membranes and micelles in their mobile phase (i.e., micellar liquid chromato-
graphy (MLC), micellar electrokinetic capillary chromatography (MECC)),
are alternatives for providing QSRR (as conventional RP-HPLC does), as
well as quantitative retention activity relationships (QRAR) using biological
parameters and wishfully mimicking biological partitioning.[39]
Detroyeret al.[39] used PCA score plots to differentiate between pharmacological
classes based on their retention characteristics on MLC, MECC, and IAM,
as well as on conventional methods, and concluded that the insertion of
these new methods would allow covering a whole range of retention mecha-
nisms, besides hydrophobicity, very useful to model QRAR. In another work,
Detroyer et al.[40] also explored the potential of PCA, CA, weighted holistic
invariant molecular (WHIM) descriptors (in a variant of PCA), sequential
projection pursuit (SPP) (another variant of PCA) for the classification of
83 substances, from 5 pharmacological families, based on chromatographic
data on 8 HPLC systems.
Artificial neural networks (ANN) were successfully developed by
Jalali-Heravi and Garkani-Nejad[41] for the modelling and prediction of
electrophoretic mobility of a series of sulfonamides, positively charged at
low pH and negatively charged at high pH, in capillary zone electrophoresis
(CZE) using, for modelling purposes, part of a set of 47 descriptors divided
into four groups of topological, geometric, and physicochemical parameters.
The results obtained using ANN compared very well with the experimental
values and showed some superiority to those obtained by MLR techniques.
Cserhati and Forgacs[42] applied PCA to prove that the hydrophobicity
parameters determined by RP-HPLC and RP thin-layer chromatography
(TLC) are slightly different, and herbicides and fungicides could not be
discriminated according to their hydrophobicity parameters. The significance
of this finding in terms of application of QSAR in agrochemical research is
Application of Chemometrics in Separation Science 1151
8/2/2019 Chemo Metric in Chromatography
http://slidepdf.com/reader/full/chemo-metric-in-chromatography 10/34
that differences in the biological activity of these pesticides cannot be attributed
to either their hydrophobicity or specific hydrophobic surface area alone.[42]
Farkas et al.[43]
compared RI prediction of three groups of saturated O-,
N-, and S-containing heterocycles using variable subset selection (VSS) and
PLS methods to select, from a large data set, the most appropriate independent
descriptors. After choosing the appropriate independent variables, predictive
models were then built, and compared, using MLR and PLS methods. PLS
failed to select boiling point (BP) or molecular mass as descriptors of the
RI, but after including the selected descriptors with BPs, PLS provided
proper models for RI prediction. The main conclusion was that combination
of the MLR for variable selection and PLS for model building should be auseful methodology for RI prediction.
The support vector machine (SVM) and the heuristic method (HM) were
used by Luan et al.[44] to develop the non-linear and linear models between the
retention time (RT) and five molecular descriptors of 149 volatile organic
compounds (VOCs). The HM was used for the prediction of RT using calcu-
lated structural descriptors and, even after the heuristic reduction, the pool of
descriptors was reduced to 150. In order to avoid over parameterization, a
number of 5 descriptors seemed to be enough for a successful linear model.
From the physical meaning of the descriptors in the linear model, it can be
suggested that the polar interactions and relative reactivity are likely to be
the two major factors controlling the retention behaviour of VOCs onnon-polar stationary phases of DB-1. The SVM was then used to built a
non-linear model based on the same set of descriptors obtained by the HM.
The performance of the SVM proved to have better predictive ability then
that provided by the HM.
SMV was also used, as a nonlinear regression method, by Liu et al. [45] to
develop a nonlinear quantitative structure mobility relationship model of
peptides based on the structural descriptors. MLR and SVM were used
to select the descriptors responsible for the electrophoretic mobility of
peptides and develop linear and non-linear models, respectively, for the
prediction of the electrophoretic mobilities of peptides. The performance of
the SVM model showed a better performance than the MLR, which highlights
that the non-linear model can describe better the relationship between the
structural descriptors and the electrophoretic mobilities of peptides.
Classification of Stationary Phases and Polarity Indicators
The column selection is not a straightforward process and stationary phases
can only be appropriately selected for a given separation when there is a
sound knowledge about the physical meaning and the classification of the
phases. Valko et al.[38] suggested the use of a high throughput chromato-
graphic hidrophicity index (CHI) for characterizing the different selectivities
of stationary phases according to the solute-stationary phase interaction
A. C. Duarte and S. Capelo1152
8/2/2019 Chemo Metric in Chromatography
http://slidepdf.com/reader/full/chemo-metric-in-chromatography 11/34
properties for each specific phase. Heberger[46] evaluated polarity indicators
and stationary phases in gas-liquid chromatography using PCA, and
suggested that no single polarity variable can be used on its own. Furthermore,
physical meaning could be associated to the most influential principal com-
ponents: PC1, attributed to polarity defined as usual; PC2, attributed to
hydrogen donating and hydrogen accepting ability with opposite signs; and
PC3, attributed to dipole interactions. Heberger et al.[47] also used PCA for
assessing polarity indicators and solute-solvent interaction parameters in
order to classify ketones, their oximes, and mixtures as stationary phases in
inverse gas chromatography. Forlay-Frick et al.[48] used PCA, as an unsuper-
vised pattern recognition technique, to unravel patterns, and test the possiblereplacement of HPLC systems from data on plate numbers and symmetry
factors measured for three solutes (benzoic acid, N,N0-dimethyl-aniline and
Vancomycin) in various chromatographic systems (stationary phases and
different mobile compositions). Although, the theoretical plate number
(column efficiency) is negatively correlated with the symmetry factor,
Forlay-Frick et al.[48] concluded that both are necessary for proper classifi-
cation and characterization of stationary phases. Ivanyi et al.[49] evaluated if
PCA could reduce the number of chromatographic test parameters, while
maintaining the classification of RP-HPLC stationary phases. Fewer para-
meters, only three or four, could be enough for keeping column clustering
and column differentiation without much loss of information and, in somecases, provided even more detailed results. Poole and Poole[50] also
recognized the role of PCA and CA to classify the stationary phases, by
their similarity for specific intermolecular interactions, on their study about
the chemometric classification of the solvent properties (selectivity) of
commonly used GC stationary phases.
Gyseghem et al.[51] measured chromatographic parameters representing
hydrophobicity, steric selectivity, efficiency, silanol activity, H-bonding
capacity, and ion exchange capacity, and compared the selection of
RP-HPLC columns with diverse selectivity towards the potential separation
of impurities in drugs. The initial selection was based on the visual inspection
and personal experience and a reevaluation was then performed using the
Pareto-optimality method, PCA, and Derringer’s desirability functions
approach. The selection by the chemometric approaches was found to be
fairly comparable with the initial selection.
Forlay-Frick et al.,[52] for the selection of orthogonal/similar chromato-
graphic systems using retention factor data of drugs, applied the generalized
pairwise correlation method (GPCM) using different statistical tests
(Williams’ t , Conditional Fisher’s, McNemar’s and Chi-square tests), and
the results were compared and validated with those obtained correlation coef-
ficients (Pearson’s product moment correlation coefficient, Spearman’s rho
and Kendall’s tau). The vast majority of retention data for chromatography
is not normally distributed, the classification of the systems was strongly
dependent on the applied method, and a comparison on the basis of the
Application of Chemometrics in Separation Science 1153
8/2/2019 Chemo Metric in Chromatography
http://slidepdf.com/reader/full/chemo-metric-in-chromatography 12/34
orthogonality ratios calculated using the different techniques to obtain infor-
mation about the discrepancies existing in the results allowed Forlay-Frick
et al.[52]
to use it, even when the distribution of the data is not normal.
Retention data of newly synthesized stationary phases and structural
descriptors derived by molecular modelling of nucleosides and cyclic nucleo-
tides were subjected to PCA, allowing Turowski et al.[53] to conclude that
from the 11 new materials, 8 hydrocarbon bonded silica phases had separation
properties regarding nucleosides and nucleotides similar to a standard
octylsilica phase. Furthermore, PCA of structural descriptors of solutes
facilitate the identification of structure features that affect retention, while
PCA of retention data provides a method for comparison characteristics andclassification of the HPLC systems.
Optimization of Operational Conditions Associated with
Chromatographic Processes
The optimization methods applied to parameters of interest in either
chromatography or capillary electrophoresis have been reviewed by Siouffi
and Phan-Tan-Luu.[2] The review[2] establishes a separation between
optimization methods using a chemometric approach and methods based on
models. The conclusion is that chemometrics tools such as the simplexalgorithm, the overlapping resolution maps, the factorial designs, the
response surface methodology, and the neural networks have the great
advantage of not needing an explicit equation for the objective function
with the desired criteria. However, chemometrics methods may require a
large number of experiments, and boundaries of the domain are not easy to
draw. Therefore, when models are available, optimization becomes straight-
forward by regression methods, and the review[2] also concludes, that
among the chemometric methods, the simplex and the overlapping resolution
maps are declining, while the use of artificial neural networks is increasing.
Besides, the factorial designs and central composite designs are becoming
more popular in capillary electrophoresis since the number of parameters to
optimize is much larger than in CG or LC.
The development and validation of a capillary electrophoresis (CE)
method by Wynia et al.[54] involved the use of several chemometric
methods, such as Box-Behnken design, PLS, and MLR, for assessing the suit-
ability of CE in the determination of drug substance, mirtazapine, and five
structurally related substances. The capillary efficiency and the overall
quality of separation of benzodiazepines in CE was assessed by Peyrin and
Guillaume[55] by means of a new response function, which was maximal
when both efficient separation conditions and a minimum analysis time
were met, and using Box-Benhken design followed by simplex optimization.
Guillaume and Peyrin[56] performed the optimization of the migration time,
height equivalent to a theoretical plate and separation of a mixture of
A. C. Duarte and S. Capelo1154
8/2/2019 Chemo Metric in Chromatography
http://slidepdf.com/reader/full/chemo-metric-in-chromatography 13/34
imidazole compounds by CE, with a method based on the application of
a simplex to a polynomial derived from preliminary experiments designed
by factorial designs.
Corradini et al.[57] applied a full factorial design to optimize the CZE con-
ditions (temperature, voltage, and percentage of methanol added to the back-
ground electrolyte) for characterization of fructooligosaccharides and inulin at
different degree of polymerization, in order to evaluate their prebiotic
properties.
The successful application of fractional factorial design and Plackett-
Burman designs have been reported[58] when addressing the robustness of
an HPLC assay method issued by the United States Pharmacopoeia for ginse-nosides, in Asian and American ginseng. The interpretation of the effects on
the responses were evaluated both graphically (with a half normal probability
plot) and numerically by a t -test. Perrin et al.[59] also used a Plackett-Burman
design on testing the robustness of enanteomeric separation of a basic
(propanolol), a neutral (praziquantel), and an acidic (warfarin) compound
by CE using highly sulfated cyclodextrins.
A fractional factorial design, together with a star design, were used for
studying the effects of 3 factors (the alkyl chain length, the concentration of
the ion interaction reagent, the concentration of the acetonitrile, and the pH
of mobile phase) and their interactions, in order to develop and optimize a
method of ion-interaction chromatography (IIR-RP-HPLC) for the simul-taneous separation of 21 polar aromatic sulfonates.[60] The failure to obtain
good predictions with a linear regression algorithm was overcome by using
the Box-Cox transformation after which Marengo et al.[60] located the
optimal experimental conditions for separations.
A fractional factorial design was used by Persson-Stubberud and
Astrom[61] for development and optimization of a capillary electrophoresis
separation of ibuprofen, codeine phosphate, their degradation products and
impurities. In the analysis of ranitidine and related compounds by capillary
electrophoresis. Morris et al.[62] used a strategy involving fractional
factorial designs to screen and determine the significant factors controlling
separation and central composite designs to determine the optimal conditions
for the separations. Models were generated by multilinear regression (MLR)
and canonical analyses were used to calculate the optimum conditions.
Wynia et al.[54] developed and validated a capillary electrophoresis separation
for the assay of antidepressant mirtazapine and five structurally related sub-
stances in a tablet formulation, following a Box-Behnken design and PLS
as multivariate modeling technique for relating the current profiles and both
migration times and peak areas.
The selection of optimum variable separation conditions (pH and concen-
tration of a complexing agent in the buffer electrolyte) of rare earth metal ions
in capillary zone electrophoresis (CZE) was accomplished by Jimidar et al.[63]
by application of a multicriteria approach: the separation method was
optimized using a central composite design for the two variables and the
Application of Chemometrics in Separation Science 1155
8/2/2019 Chemo Metric in Chromatography
http://slidepdf.com/reader/full/chemo-metric-in-chromatography 14/34
Derringer’s desirability function was applied to determine the most desirable
combination of separation, sensitivity, and analysis time.
The optimization and comparison of neurotransmitter amino acid separ-
ation in normal micellar electrokinetic chromatography (N-MEKC) and
reversed migration electrokinetic chromatography (RM-MEKC) were
carried by Wan et al.[64] using a central composite design with multivariate
linear regression. A face centred cube central composite design was also
used by Safa and Hadjmohammadi[65] to evaluate the effect of the concen-
tration of sodium dodecyl sulfate, propanol content, and pH of the mobile
phase in micellar HPLC separation of chlorophenol isomers. Besides, the
use of the Pareto-optimality method, an approach from the multicriteriadecision making, allowed Safa and Hadjmohammadi[65] the selection of the
best possible combination of separation quality and analysis time, with the
consequent production of chromatograms of superior quality.
A three-step procedure was followed by Brunnkvist et al.[66] in the search
of optimal chromatographic separation conditions of two different capillary
electrophoresis (CE) stationary phases (Hypersil phenyl and Hypersil C18)
for four basic peptides, using peak resolution and peak efficiency as
response function: a) initial studies for determination of the experimental
variables and their respective domains for the two stationary phases; b) appli-
cation of a Plackett-Burman design and PLS models were preferred to MLR’s,
due to their higher predictive ability; and c) optimization according to acentral composite design combined with both MLR and PLS models for
each stationary phase.
Chiralcel OD-R, as a chiral stationary phase with mobile phase containing
acetonitrile (modifier) and sodium perchlorate (buffering component), was
found by Wsol and Fell[67] to be the most suitable system for chromato-
graphic enantioresolution of rac-11-dihydrooracin. The Box-Wilson central
composite design was employed to find the optimal conditions of temperature,
modifier concentration, and buffer concentration for new proposals of chroma-
tographic response functions, based on the resolution and the retention time
of the last component eluted.
In terms of sample preparation, extraction, and other conditions prior to
separation, Romvari et al.[68,69] developed a rugged sample preparation
approach, based on Taguchi’s method, which allowed obtaining high
accuracy and reliability in the use of HPLC for the determination of two
main metabolites of albenzadole (albenzadole-sulfoxide and albenzadole-
sulfone) in cow’s milk. Designed experiments according to Taguchi’s
method were also used by Ehmann et al.[70] for investigation of alkaline and
acid prerinsing techniques in capillary preconditioning for analysis of
anions using indirect UV detection in capillary zone electrophoresis.
Keszler and Heberger[71] used PCA for studying the influence of extraction
parameters and medium on the efficiency of solid phase microextraction
(SPME) sampling, in the analysis of aliphatic aldehydes by GC-MS. Tukai
et al.[72] used factorial design (for selecting the most significant factors) and
A. C. Duarte and S. Capelo1156
8/2/2019 Chemo Metric in Chromatography
http://slidepdf.com/reader/full/chemo-metric-in-chromatography 15/34
central composite design for optimization of the conditions of microwave
assisted extraction, prior to HPLC-IPMS analysis of arsenic species in
marine macroalgae. Johansen and Rasmussen[73]
used a factorial design and
response surface modelling (RSM) for screening and optimization of
dialysis recoveries of antidepressant drugs in human plasma prior to HPLC.
Beijersten and Westerlund[74] optimized the conditions of derivatization
of dipeptides for separation by micellar electrokinetic chromatography,
using a fractional factorial design for screening experiments and a central
composite design for response surface modeling. A central composite
design was also followed by Daali et al. [75] to optimize the conditions of
chemical hydrolysis (acid concentration, hydrolysis temperature, and hydroly-sis time) of sialic acid in a soluble caseinoglycomacropeptide, and the sialic
acid release was monitored by high performance anion exchange chromato-
graphy with pulsed amperometric detection (HPAEC-PAD).
The optimization of RP-HPLC separation of p-hydroxybenzoic acid and
its esters, was performed by Guillaume and Peyrin[76] with a new algorithm
based on Glover’s taboo search (TS), with better results than those obtained
with pure random search and simplex search. A novel chromatographic
response function (CRF) already used by Peyrin and Guillaume,[55] which
was maximal when both efficient separation conditions and a minimum
analysis time were met, allowed obtaining the optimal conditions for
column temperature, the water fraction in the mobile phase, and its flow rate.In order to avoid a blank chromatographic run, Boelens et al.[77]
developed a two step process, which takes into account the shape and
also the intensity differences of the background eluent spectrum during the
HPLC separation process coupled to spectroscopic detection: first, the
baseline spectra are modelled using a limited number of PCs; subsequently,
an asymmetric least squares regression method allows for correction of the
spectra during elution for the background correction.
Doehlert matrix design, as a chemometric tool, deserves a special mention
since its application to analytical chemistry has been recently reviewed by
Ferreira et al.[78] The review paper[78] discusses the advantage of Doehlert
design with other response surface designs, such as central composite and
Box-Behnken designs, and discusses the application of Doehlert matrices in
chromatography, besides a reference to the first demonstration that application
of this design in analytical chemistry is more appropriate and more economi-
cal than the central composite design for optimization of a separation process
using HPLC.[79] Considerable reduction of analysis time in lengthy HPLC was
obtained by Araujo[80] when the Doehlert design was selected for systematic
and simultaneous optimization of the gradient solvent system and the instru-
mental/experimental variables associated to the HPLC-DAD chromatograms
of chloropigments, chlorophyll a, hydroxyl chlorophyll a, and methoxylac-
tone chlorophyll a. Further applications to the HPLC separation of orto,
meta, and para cresol in antiseptic products, and polyaromatic hydrocarbons
in synthetic mixtures, allowed also a significant reduction in analysis time.
Application of Chemometrics in Separation Science 1157
8/2/2019 Chemo Metric in Chromatography
http://slidepdf.com/reader/full/chemo-metric-in-chromatography 16/34
A two factor Doehlert design was also chosen by Garcıa et al.[81] to fit a second
order model, and jointly optimize the resolution and the peak width through a
global desirability function for the determination of hormones (diethylstil-
bestrol, hexestrol, dienestrol, nor-testosterone, methyl-testosterone, 17-a-
estradiol, 17-b -estradiol, and 17-a-ethynylestradiol)) by GC-MS without
derivatization. Prior to the optimization step, a design similar to a reflected
Plackett-Burman design was carried out to select, with a reduced number of
experiments, the most important factors and how their responses affect the
resolution and the peak widths.
Farkova et al.[82] has shown that artificial neural networks (ANN) can be
used to estimate peak parameters and, in combination with central compositedesign (CCD), can be applied for efficient prediction of optimal conditions in
capillary zone electrophoresis with a lower analytical effort. The application
of ANN in optimization of CZE methods has been examined by Havel
et al.,[83] and a new method has been developed based on the combination
of central composite design (CCD) and ANN with the back propagation
technique, which showed considerable effectiveness.
A chemometric tool, based on the function of mutual information (FUMI)
theory, has been suggested by Kotani et al.[84] for predicting the measurement
uncertainty in HPLC with electrochemical detection (HPLC-ECD) with only
one chromatogram, and consequently allowing the optimization, in a very short
time, of the analytical operational parameters for determination of catechins.The separation of pharmaceutical residues of environmental concern has
been used by Cela et al.[85] to demonstrate the practical advantages and
working procedures of multiobjective optimization using evolutionary algo-
rithms (EA), which allow easy and direct definition objectives without the
need for chromatographic response functions (CRF), and also provides not
only a single optimum, but a well populated Pareto front of non dominated
solutions. The problem of modelling the CRF for optimization purposes of
HPLC methods has been approached by Dewe et al.[86] using the separation
of S-timolol, R-timolol, and related substances as a case study: a Box-
Behnken experimental design was followed to perform the experiments, a
Derringer’s function was defined for each response, and overall desirability
was derived. Marini et al.[87] assessed the uncertainty associated to an
HPLC method for determination of R-timolol and other related substances
in S-timolol maleate, by applying a two level Placket-Burman design and per-
forming the experiments, which could be assimilated to laboratories from an
interlaboratory exercise; different uncertainty components were estimated
using the data obtained from the robustness test.
Holık and Mannschreck [88] discussed the errors involved in the calcu-
lation of the enanteomeric excess determined from overlapping HPLC
peaks when a dual detector, i.e., UV/VIS and circular dichroism (CD), is
used. The best results were obtained when two different methods of calcu-
lation of errors are used, and those errors are about one order lower than the
possible error due to wrong selection of the range of data.
A. C. Duarte and S. Capelo1158
8/2/2019 Chemo Metric in Chromatography
http://slidepdf.com/reader/full/chemo-metric-in-chromatography 17/34
Sanli et al.[89] applied three different model fitting strategies for the
experimental designs, in order to optimize the HPLC resolution of a series
of polyphenolic acids with water-acetonitrile mobile phases: a) nonlinear
regression to all data points; b) four data points; c) only two data points.
The models for the retention behaviour of the polyphenolic acids were
based on the relationships between retention factors of solutes with the pH
and solvatochromic parameter of the mobile phase, and between the
dissociation constants of the compounds and the molar fraction of the
organic modifier.
Chemical Analysis: Clustering, Detection, Calibration,
and Quantification
The use of chemometrics for clustering samples, multivariate calibration, and
quantification of analytes is the most common activity among the chemome-
tricians, and in various laboratories is still the main activity of the analytical
chemists interested in chemometrics.
Classical analysis of variance (ANOVA), outliers testing, precision
calculations, and other statistics based on the ISO 5725-2 norm, were applied
by De Beer et al.[90] to evaluate the measurement uncertainty in the HPLC-
DAD analysis of several hydro- and lipo-soluble vitamins in multivitaminpreparations on the results of the analysis. A demonstration of an entire
validation programme, exemplified for an HPLC method for the determination
of captopril in human plasma, is given by Wieling et al.[91] using a nested design
for the evaluation of several performance characteristics, using several classical
statistics tests (ANOVA, Grubbs test, and regression analysis).
PCA is a popular method used for the purpose of pattern recognition,
classification, modelling, and other aspects of data evaluation with chromato-
graphic retention data. However, Brereton et al.[92] assessed different prepro-
cessing approaches (mean centred data sequential scores, mean centred
sequential loadings, and uncentred data) for determining the number of signifi-
cant factors in window factor analysis using principal component based
methods of chromatographic data, and concluded that the general practice,
in HPLC-DAD, of calculating scores for the sequential (time) direction
should be carefully reviewed, and it is likely that loadings in this dimension
is preferable. The best way is to use a variety of methods for calculating
and compare the results in order to detect eventual anomalies or problems
with the chromatographic data. PCA has been applied by Csomos et al.[93]
to biogenic amines, polyphenols, and resveratrol in Hungarian wines. In this
latest example, PCA was able to characterize wines according to their
biogenic amine and polyphenols contents,[93] while cluster analysis failed to
do so. A classification of German wines was performed by PCA (and CA)
based on the HPLC relative anthocyanin pattern, that is the ratio of antho-
cyanin to each other, and it helped to establish the genuiness regarding the
Application of Chemometrics in Separation Science 1159
8/2/2019 Chemo Metric in Chromatography
http://slidepdf.com/reader/full/chemo-metric-in-chromatography 18/34
variety of the different wines.[94] PCA allowed Masino et al.[95] to suggest
some clues on the ageing process of Italian balsamic vinegar by using an
HPLC-Diode array detector to obtain analytical data on the following
furanic compounds: hydroxymethylfurfural, furoic acid, furfural, and
5-acetoxymethylfurfural. PCA was applied by Nemati et al.[96] to classify
and characterize the gelatine components of 14 bovine and 5 porcine
gelatines separted by RP-HPLC-UV after hydrolysis and precolumn derivati-
zation. The application of PCA to HPLC data on chorophyls, pheophytins, and
carotenoids in olive oils, allowed Cichelli and Pertesana[97] to discriminate
olive cultivars and to assess the genuineness of olive oils. PCA and CA of
HPLC separated preparations of soybean and milk proteins and their trypsinhydrolysates enabled Dziuba et al.[98] to determine the type of milk protein
preparations added to a soybean protein preparation. Nemati et al.[96] used
HPLC data on gelatine components (peak height, area, area percentage and
width) to differentiate between bovine and porcine gelatines. PCA, CA, and
correlation analysis were used by Yawei et al.[99] to investigate the relation-
ship between the methylmercury (determined by HPLC-AFS) and total
mercury contamination in gastropod and bivalve species along the Chinese
Bohai Sea. The data from HPLC-TOF/MS (and 1H NMR spectroscopy),
when combined with PCA, could be used to fingerprint endogenous metab-
olites and identify compounds or a group of compounds that can be
assigned as markers for the effects toxins, as in the case of nephrotoxicityof cyclosporin A in rats.[100] The application of PCA to data on the volatile
organic compounds (VOCs) obtained from the headspace of truffle samples
and fingerprinted by GC-MS, allowed Gioacchini et al.[101] to distinguish
between different species of truffles.
PCA was applied by Lu et al.[102] to HPLC fingerprints of herbal extracts
for distinguishing Chinese Angelica from related umbellifera herbs. Gong
et al.[103] combined GC-MS with heuristic evolving latent projections
(HELP) and iterative optimization procedure for resolving embedded peaks
(IPREP), as a method that could enhance the chromatographic separation
and spectral qualitative ability, as shown in the qualitative and quantitative
determination of volatile compounds in Cortex cinnamoni (traditional
herbal medicine) from four main producing areas. PCA was at first used to
confirm the background and correct the baseline drift. The chromatographic
and electrophoretic techniques commonly used in the instrumental inspection
of herbal medicines, as well as the chemometric methods used for evaluating
the fingerprints of herbal products, such as the method based on information
theory, similarity estimation, chemical pattern recognition, spectral correla-
tive chromatogram, multivariate resolution have been extensively reviewed
by Liang et al.[104] The review[104] concludes that the combination of chroma-
tographic fingerprints of herbal medicines and the chemometric evaluation
could become a powerful tool for discrimination and quality control of
herbal products, but the complex relationship between the chromatographic
fingerprints and efficacy of herbal medicines is yet to be properly approached.
A. C. Duarte and S. Capelo1160
8/2/2019 Chemo Metric in Chromatography
http://slidepdf.com/reader/full/chemo-metric-in-chromatography 19/34
Hendriks et al.[105] emphasized the importance of the different methods
for preprocessing data (peak alignment, normalization, standardization, trans-
formation) before PCA is performed on HPLC profiles of plant extracts to
clustering and classifying samples from different origins. Furthermore, the
use of weighted PCA is advised, instead of ordinary PCA, since this
technique allows the nonconstant error variances to be analyzed. Chen and
Yu[106] demonstrated the benefits of combining a background constraining
technique to mitigate the influence of relatively common deviations in each
data matrixes of the three way data (for example, such as in the case of
HPLC-DAD) associated to iterative correcting procedures, to prevent the
distortion effect of large unique deviations and nonlinear response in eachof the same data matrices.
Linear discriminant analysis (LDA) has been used by Jakab et al.[107] for
comparative analysis of different plant oils by HPLC atmospheric pressure
chemical ionization mass spectrometry. LDA was able to distinguish the
oils based on their triacylglycerols composition.
The chromatographic data on triglycerides and tocopherols present in
Arabic and Robusta coffees, both green and roasted, were considered as
chemical descriptors and used by Gonzalez et al.[108] to discriminate coffee
varieties by application of PCA and LDA. Tocopherols proved to be best
suited for coffee authentication processes, not only because they are easier
to determine, but also they can differentiate coffee varieties even afterroasting. Baiocchi et al.[109] applied PCA and the kth nearest neighbour classi-
fication (KNN) to the analyses by RP-HHPLC-DAD of phenolic compounds
from bark extracts of clones of poplar trees, in order to discriminate among the
clones obtainable from the variation of the phenolic content of the bark
extracts. Klemenc[110] applied PCA, hierarchical clustering (HCA), and k
nearest neighbours (K-NN) on the normalised and scaled analytical data
obtained by GC-MS on heroin samples, with the purpose of searching for
batch links among a limited number of investigated heroin samples. Marini
et al.[111] applied linear discriminant analysis (LDA) and artificial neural
networks (ANN) trained by back propagation algorithm to discriminate rice
bran oils manufactured in three different countries (Italy, Thailand, and
Switzerland) according to their geographical origin, using variables such as
fatty acids, triglycerides, and sterols determined by GC (methyl-esters derivatives
of fatty acids and sylil-ethers derivatives of sterols) and HPLC (triglycerides).
Chemometric optimization based on central composite design was
employed by Gong et al.[112] to find the optimum CE resolution, in terms of
buffer concentration, pH, and concentration of acetonitrile as organic
modifier, for the simultaneous determination of six main nucleosides and
bases, including adenine, uracil, adenosine, guanosine, uridine, and inosine in
natural and cultured Cordyceps. Cluster analyses (CA) based on the
characteristics of the peaks in CE profiles, showed that adenosine and inosine
could be used as discriminators and markers for quality control of natural
and cultured Cordyceps.[112] CA also allowed Alonso-Salces et al.[113]
Application of Chemometrics in Separation Science 1161
8/2/2019 Chemo Metric in Chromatography
http://slidepdf.com/reader/full/chemo-metric-in-chromatography 20/34
a preliminary study of the HPLC-DAD data structure obtained from a set of
analyses of the polyphenolic content of extracts of freeze dried apple pulps
and peels, followed by LDA. K-nearest neighbours, soft independent
modelling of class analogy, and multilayer feed-forward artificial neural
networks (MLF-ANN) were used to develop decision rules for the classification
of apples according to their maturity state based on the polyphenolic
compositions.
The application of evolving factor analysis (EFA) allowed Pasadakis
et al.[114] the accurate determination of aromatic groups in heavy gas oil
fractions based on their elution times and UV spectrum patterns using
HPLC-UV-DAD, even when strong overlapping of the eluting aromaticcomponent groups occurred.
Lilley and Wheat[115] used PCA and iteractive target factor analysis
(ITFA) to inspect each electropherogram obtained by capillary electrophoresis
for spectral homogeneity of the peaks and to deconvolute comigrations. The
methodology was tested and demonstrated for drug identification in biological
matrices, i.e., analysis of amphetamine and common interferences in human
urine.
Partial least squares (PLS) methodology has been used by Heberger
et al.[35] on chromatographic retention data of oxo compounds in gas chrom-
atography. PLS regression also enabled Latorre et al.[116] the determination of
amino acids by capillary electrophoresis-DAD, since PLS overcame thepartial overlap of phenylalanine, isoleucine, and tyrosine, and the complete
overlap of histidine and leucine. Mean centring and the selection of a chroma-
tographic region were found advantageous by Frenich et al.,[117] when
applying partial least squares (PLS1 and PLS2) and principal component
regression (PCR), as multivariate calibration methods, to the simultaneous
determination of highly overlapped cypermethrin, fenvalerate, and cis- and
trans-permethrin by HPLC-DAD. Other preprocessing techniques such as
smoothing, baseline correction, and averaging did not make any improve-
ments, whereas differentiation had a detrimental effect.
Sentellas et al.[118] showed that the performance of principal component
regression (PCR), partial least squares (PLS1 and PLS2), and nonlinear PLS
(NL-PLS) were comparable as multivariate calibration methods for quantifi-
cation of strongly overlapped peaks, as is the case of CZE-DAD applied to
the separation of ebrotidine and its metabolites. Furthermore, data pretreat-
ment to correct baseline and spectral drifts and peak shifting should always
be addressed beforehand.
The detection and quantification of residues of simazine, prometon,
atrazine, and propazine in apples by gas chromatography selected ion monitor-
ing (GC-SIM) were performed by Jalali-Heravi and Vosough,[119] using the
generalized rank annihilation method (GRAM). The GRAM, as a second
order calibration technique, allowed obtaining the mass chromatograms and
the true ion abundance of each analyte and to quantify the triazines in
different samples with only one standard data matrix. The application of
A. C. Duarte and S. Capelo1162
8/2/2019 Chemo Metric in Chromatography
http://slidepdf.com/reader/full/chemo-metric-in-chromatography 21/34
GRAM required different steps of data preprocessing, such as background cor-
rection, deskewing, and standardization for rank alignment. The effect of a
relatively high background baseline is removed by a linear background correc-
tion on every data set before further processing. The deskewing and standardi-
zation (for rank alignment) algorithm were used for bilinearity and trilinearity
correction, respectively.[119]
Gimeno et al.[120] used second order bilinear generalized rank annihil-
ation method (GRAM) for calibration of PAH compounds by HPLC-DAD
where a spiked sample was used instead of a standard solution, because the
complexity of the samples led to the suspicion of the presence of a matrix
effect. The quantification of PAHs in marine sediment samples with theGRAM calibration compared favourable in various aspects with univariate
standard addition calibration.
Bogomolov and McBrien[121] evaluated the theoretical basis of a new
method of peak matching in a series of simulated HPLC-DAD analyses of
the same mixture obtained under varying separation conditions. The
matching of the main peaks is based on defining a key set of spectra by
interactive key set factor analysis (IFSFA) after PCA, which is then
subjected to validation and selection. The new method, named mutual
automated peak (MAP) matching, shows an appropriate performance under
simulated poor separation conditions, while peak intensities vary enormously.
Walczak and Wu[122]
proposed the application of a fuzzy matchingapproach to chromatographic signal alignment (or warping), requiring
detection of a few more intense peaks in individual chromatograms only,
and it aligns signals once the correspondence of the detected peaks is
established.
The GRAM was also used by Gross et al.[123] to enhance the selectivity
and quantitative precision of RP-HPLC separations using a parallel column
configuration with two complementary stationary phases, and Comas
et al.[124] used this second order calibration method for identifying and quan-
tifying aromatic sulfonates in water by HPLC-DAD in the presence of
coeluting interferences. In this later case, the problem of the time shift in
different chromatographic runs and improvement of trilinearity necessary to
the application of the GRAM, has been dealt with using iterative target trans-
formation factor analysis (ITTFA). The use of correlation optimised warping
(COW) has been suggested by Nielsen et al.[125] to perform the alignment of
single and multiple wavelength chromatographic profiles prior to chemo-
metric data analysis. The suggested method uses the entire chromatographic
data matrices, only relying on two input parameters which can be estimated
from the observed peak width, and it proved its suitability on processing the
HPLC-DAD chromatograms of fungal extracts.[125]
De Braekeleer et al.[126] analysed tetracycline hydrochloride samples by
HPLC-DAD and assessed the purity of the samples using orthogonal projec-
tion approach (OPA) and the fixed size moving window evolving factor
analysis (FWEFA), followed by resolution of the data matrix by multivariate
Application of Chemometrics in Separation Science 1163
8/2/2019 Chemo Metric in Chromatography
http://slidepdf.com/reader/full/chemo-metric-in-chromatography 22/34
curve resolution alternate least squares (MCR-ALS), which allowed obtain-
ment of the pure component spectra and the individual concentration profiles.
HPLC-MS, in combination with NMR analysis, has been used by
Williams et al.[127] to detect differences between normal and obese rats in
order to provide markers of the metabolic disease. Both analytical techniques
were used to obtain metabolite fingerprints for the metabonomic analysis of
urine from rats, and the resulting data were subjected PCA and partial least
squares discriminant analysis to asses the effects of strain differences,
diurnal variation in strains, diurnal variation and gender, and gender on metab-
olite profiles.
PCA of reverse-phase HPLC chromatograms and data from individualfree amino acid analysis allowed assessing the effect of defined strain
surface starters on the ripening of Tilsti cheese[128] and highlighting the
different proteolytic systems associated with the organisms in the different
smears used, as compared to the traditional technique of using smear liquid
from older cheese.
Korany et al.[129] applied derivatives, and derivatives followed by
convolution with discrete Fourier functions, to chromatographic response
data in order to eliminate interferences and improve calibration and statistical
parameters, in a model mixture containing ascorbic acid, paracetamol, and
guaiphenesin subjected to non ideal conditions of operation. Calibration
using Theil’s method, instead of the usual least squares regression,improved quantification of the chromatographic signals.
A combination of chemometric procedures has been devised by Gong
et al.[130] for correction of retention time shifts for chromatographic finger-
prints of herbal medicines. First, a selection of marked compounds is
performed by fixed size moving window evolving factor analysis (FWEFA),
which then allow to resolve the two-dimensional HPLC-DAD data matrix
into pure chromatograms and spectra profiles with local full rank analysis;
the top points of the pure chromatographic profiles are used as the retention
time points to correct the retention time shifts, and finally reconstruct the chro-
matographic fingerprints with cubic spline interpolation. The application of
PCA to chromatographic fingerprints from real herbal medicines, before and
after correction of time shifts, allowed identifying their inhomogenities and
further improving their interpretation.
A 2 level, full factorial design was used by Gennaro et al.[131] for
assessing the effect of the cheese making process on contents of biogenic
amines, measured by HPLC-UV, in a semi hard Italian cheese (Toma) and
found that the conditions for minimizing the formation of amines were
dependent on the type of amine.
In order to estimate concentration and elution profiles of compounds,
Dunkerley et al.[132] compared several deconvolution methods to a HPLC-
DAD-MS data matrix of 2- and 3-hydroxypyridine at varying pH in the
presence of severely tailing peak shapes. This work [132] contains an
extensive review and comparison of several methods (i.e., PCA, evolving
A. C. Duarte and S. Capelo1164
8/2/2019 Chemo Metric in Chromatography
http://slidepdf.com/reader/full/chemo-metric-in-chromatography 23/34
factor analysis (EFA), fixed window evolving factor analysis (FWEFA)) of
two way chromatographic data and suggested a deconvolution method,
which allows the inclusion of restrictions prior to the regression analysis,
and it is used only for determination of profiles from the purity curves.
Windig[133] has recently introduced the use of Durbin-Watson criterion as
a tool for reducing the noise and baseline problems in LC/MS of surfactants,
and a similarity index (SIM) for better discriminating between minor differ-
ences in samples, both as improvements of an algorithm called component
detection algorithm (CODA) that selected only low noise and low background
chromatograms from complex LC/MS data and determined which mass
chromatograms are different based on simples logical rules.[134,135]
The predictive ability of artificial neural network was found by Zhao
et al.[136] to be better than PCA and canonical discriminant analysis (CDA)
for the clinical diagnosis of tumours based on capillary electrophoresis of
urinary nucleosides. The structural changes in pine Kraft lignin during
pulping were studied by Malkavaara et al.[137] by applying PCA, PCR, and
projection to latent structures, to data obtained on lignin samples subjected
to alkaline cupric oxide oxidation followed by capillary electrophoretic-UV
analysis.
Strasık et al.[138] used chemometric procedures (target transformation
factor analysis (TTFA), fixed size moving window-evolving factor analysis
(FSW-EFA), orthogonal projection approach (OPA), and fixed sizedmoving window-target transformation factor analysis (FSW-TTFA)) to
assess the feasibility of the use of a wide bore (320 m ID) capillary tube,
and also the use of tandem-coupled columns for the detection and identifi-
cation of CZE analytes by optical fiber coupled DAD, even in critical
situations of peak overlapping. Dankova et al.[139] then applied the above
mentioned procedures as referred by Strasık et al.[138] in processing data
acquired by CZE in the separation system with tandem-coupled columns to
the spectral identification and determination of orotic acid in urine by DAD,
coupled to the separation system by optical fibers.
For the development and validation of a method for determination of
pesticides in groundwater, Rodrıguez-Cuesta et al.[140] used bilinear-
trilinear multivariate curve resolution alternating least squares (MCR-ALS)
for resolution and calibration of a HPLC-DAD data region where severely
overlapped peaks appeared: vinclozolin, chlorfenvinphos, tebuconazole, and
parathion-ethyl. Pere-Trepat et al.[141] evaluated the application of
multivariate curve resolution alternating least squares (MCR-ALS) in the
analysis of complex biocide environmental sample mixtures by HPLC-
DAD, showing that the lack of chromatographic resolution and lack of
spectral selectivity of UV-VIS diode array detection is compensated by
chemometric resolution using MCR.
Rodrıguez-Cuesta et al.[140]
also used PCA for checking the presence of
outliers or influential samples, EFA, and SIMPLISMA for finding out the
proper number of components and the sources of variability, parallel factor
Application of Chemometrics in Separation Science 1165
8/2/2019 Chemo Metric in Chromatography
http://slidepdf.com/reader/full/chemo-metric-in-chromatography 24/34
(PARAFAC) analysis for sources of comparison of the resolution strategy
adopted.
Xie et al.,[42]
based on the difference of the behaviour of the chemical
signal and noise components, proposed the two mode subspace comparison
(TMSC) approach to estimate the chemical rank of three way analytical
data array (such as HPLC-DAD) with two full rank modes. The method
showed great robustness to a very high degree of collinearity between the
chromatograms involved or to a very high level noise contained in a three
way array. Sanchez-Ponce and Rutan[143] incorporated a kinetic based hard
model as constraint in a soft modelling technique, such as multivariate
curve resolution alternating least squares analysis (MCR-ALS) to extractenzyme kinetic information (such as the Michaelis constant, the maximum
velocity, and the inhibition constants) from three way LC-MS analytical
data from simultaneous incubation of two CYP450 isoenzymes. Webb-
Robertson et al.[144] introduced a new sequential projection pursuit (SPP)
algorithm, a random scan sampling algorithm (RSSA), that significantly
reduces computation time, thus, becoming an attractive alternative to PCA
when performing clustering or classification analysis, since it achieved a
higher accuracy with a lower number of latent variables as shown, for
example, with a data set containing diesel fuel chromatographic signatures.
Kubicka et al.[145] showed that soft independent modelling of classifi-
cation class analogy (SIMCA) could be successfully applied for originaland preprocessed GC-MS data on C10-bicycloalkanes, in order to assist evalu-
ation of kinetic experiments involving complex mixture of C10-hydrocarbons.
CONCLUSIONS
Chemometrics provides valuable tools for enhancing the application of
chromatographic separations in chemistry, leading to faster acquisition of data
and better data quality with less laboratory work. This review produces a
plethora of successful combinations between chromatography and chemometrics
in various areas of chemical research, namely the study of peak asymmetry and
overlapping peaks, the quantitative structure– (chromatographic) retention
relationships (QSRR), the classification of stationary phases and polarity indi-
cators, the optimization of operational conditions associated to chromatographic
processes and chemical analysis related subjects such as clustering, detection,
calibration and quantification.
The applications of chemometrics in separation science follow a general
trend: increasing exploration of available well tested techniques, together with
more advanced ones for extracting chemical information obtained with the
help of chromatography. However, there is a promising strategy in biologi-
cally oriented research, resulting from increased speed and efficiency in
establishing quantitative relationships between the chemical structure of
xenobiotics and their ability to participate in intermolecular interactions
A. C. Duarte and S. Capelo1166
8/2/2019 Chemo Metric in Chromatography
http://slidepdf.com/reader/full/chemo-metric-in-chromatography 25/34
with the components of a living system. The development of such work can
lead to a decrease in costs of a search for new drugs and the use of laboratory
animals. The perspectives now are especially attractive because of the
availability of isolated pharmacological receptors obtained by modern
biotechnology.[28]
REFERENCES
1. Hopke, P.K. The evolution of chemometrics. Anal. Chim. Acta. 2003, 500,365–377.
2. Siouffi, A.M.; Phan-Tan-Luu, R. Optimization methods in chromatography and
capillary electrophoresis. J. Chromatogr. A. 2000, 892, 75–106.3. Bolliet, D.; Poole, C.F. Mixture-design approach to retention prediction using
the solvation parameter model and ternary solvent systems in reversed-phaseliquid chromatography. Anal. Commun. 1998, 35, 253–256.
4. Heberger, K. Chemometrics in Hungary (the last 10 years). Chemom. Intell. Lab.Syst. 2004, 72, 115–122.
5. Papai, Zs.; Pap, T.L. Analysis of peak asymmetry in chromatography.J. Chromatogr. A 2002, 953, 31–38.
6. Pap, T.L.; Papai, Zs. Application of a new mathematical function for describingchromatographic peaks. J. Chromatogr. A 2001, 930, 53–60.
7. Farnan, D.; Frey, D.D.; Horvath, C. Intraparticle mass transfer in high-speedchromatography of proteins. Biotechnol. Prog. 1997, 13, 429–439.
8. Cai, C.P.; Wu, N.S. Statistical moment analysis and deconvolution of overlappingchromatographic peaks. Chromatographia 1991, 31 (11/12), 595–599.
9. Papai, Zs.; Pap, T.L. Determination of chromatographic peak parameters bynon-linear curve fitting using statistical moments. Analyst 2002, 127 , 494–498.
10. Felinger, A.; Pasti, L.; Dondi, F. Fourier analysis of multicomponent chromato-grams. Recognition of retention patterns. Anal. Chem. 1992, 64, 2164–2174.
11. Felinger, A.; Pap, T.L.; Inczedy, J. Improvement of the signal-to-noise ratioof chromatographic peaks by Fourier transform. Anal. Chim. Acta 1991, 248,
441–446.
12. Felinger, A. Superposition of chromatographic retention patterns. Anal. Chem.1995, 67 , 2078– 2087.
13. Felinger, A.; Cavazzini, A.; Remelli, M.; Dondi, F. Stochastic-dispersive theoryof chromatography. Anal. Chem. 1999, 71, 4472– 4479.
14. Pietrogrande, M.C.; Dondi, F.; Felinger, A.; Davies, J.M. Statistical study of peak overlapping multicomponent chromatograms: importance of the retention
pattern. Chemom. Intell. Lab. Syst. 1995, 28, 239–258.15. Felinger, A. Deconvolution of overlapping skewed peaks. Anal. Chem. 1994, 66 ,
3066–3072.16. Felinger, A. Critical peak resolution in multicomponent chromatograms. Anal.
Chem. 1997, 69, 2976–2979.17. Pietrogrande, M.C.; Dondi, F.; Felinger, A. HRGC separation performance
evaluation by a simplified Fourier analysis approach. J. High Resol. Chromatogr.1996, 19, 327–332.
18. Felinger, A.; Pietrogrande, M.C. Decoding complex multicomponent chromato-
grams. Anal. Chem. 2001, 73, 619A –626A.
Application of Chemometrics in Separation Science 1167
8/2/2019 Chemo Metric in Chromatography
http://slidepdf.com/reader/full/chemo-metric-in-chromatography 26/34
19. Felinger, A.; Pap, T.; Inczedy, J. Curve fitting to asymmetrical chromatograms by
the extended Kalman filter in frequency domain. Talanta 1994, 41 (7),
1119–1126.
20. Liu, S.; Davis, J.M. Verification of statistical-overlap theory in micellar electro-
kinetic chromatography. Anal. Bional. Chem. 2005, 382, 765–776.
21. Zhang, Y.; Li, H.; Hou, A.; Havel, J. Artificial neural networks based on genetic
input selection for quantification in overlapped capillary electrophoresis peaks.
Talanta 2005, 65, 118–128.
22. Gao, H.-T.; Li, T.-H.; Chen, K.; Li, W.-G.; Bi, X. Overlapping spectra resolution
using non-negative matrix factorisation. Talanta 2005, 66 , 65–73.
23. Hu, Y.; Shen, W.; Yao, W.; Massart, D.L. Using singular value ratio for resolving
peaks in HPLC-DAD data sets. Chemom. Intell. Lab. Syst. 2005, 77 , 97–103.24. Reubsaet, J.L.E.; Jinno, K. Characterisation of important interactions controlling
retention behaviour of analytes in reversed-phase high-performance liquid
chromatography. Trends in Anal. Chem. 1998, 17 (3), 157–165.
25. Heberger, K. Empirical correlations between gas-chromatographic retention
data and physical or topological properties of solute molecules. Anal. Chim.
Acta 1989, 223, 161–174.
26. Heberger, K. Discrimination between linear and non-linear models describing
retention data of alkylbenzenes in gas-chromatography. Chomatographia 1990,
29 (7/8), 375– 384.
27. Heberger, K.; Kowalska, T. Quantitative structure-retention relationships VI.
Thermodynamics of Kovats retention index-boiling point correlations for alkyl-
benzenes in gas chromatography. Chemom. Intell. Lab. Syst. 1999, 47 , 205– 217.
28. Kaliszan, R. Retention data from affinity high-performance liquid chromato-graphy in view of chemometrics. J. Chromatogr. B 1998, 715, 229–244.
29. Kaliszan, R. Chromatography and capillary electrophoresis in modelling the
basic processes of drug action. Trends in Anal. Chem. 1999, 18 (6), 400–410.
30. Al-Haj, M.A.; Haber, P.; Kaliszan, R.; Buszewski, B.; Jezierska, M.;
Chilmonzyk, Z. Mechanism of separation on cholesterol-silica stationary phase
for high-performance liquid chromatography as revealed by analysis of quantitat-
ive structure-retention relationships. J. Pharm. Bio. Anal. 1998, 18, 721–728.
31. Baggiani, C.; Anfossi, L.; Giovannoli, C.; Tozzi, C. Multivariate analysis of
the selectivity for a pentachlorophenol-imprinted polymer. J. Chromatogr. B2004, 804, 31–41.
32. Kortvelyesi, T.; Gorgenyi, M.; Heberger, K. Correlation between retention
indices and quantum-chemical descriptors of ketones and aldehydes on stationary
phases of different polarity. Anal. Chim. Acta 2001, 428, 73– 82.33. Kortvelyesi, T.; Gorgenyi, M.; Seres, L. Correlation of retention indices with van
der Waals’ volumes and surface areas: alkanes and azo compounds. Chomatogra-
phia 1995, 41 (5/6), 282–286.
34. Kiraly, Z.; Kortvelyesi, T.; Seres, L.; Gorgenyi, M. Structure-retention relation-
ships in the gas chromatography of N,N-dialkylhydrazones. Chromatographia1996, 42 (11/12), 653–659.
35. Heberger, K.; Gorgenyi, M.; Sjostrom, M. Partial least squares modelling of
retention data of oxo compounds in gas chromatography. Chromatographia2000, 51 (9/10), 595–600.
36. Markuszewski, M.; Krass, J.D.; Hippe, T.; Jastorff, B.; Kaliszan, R. Separation of
nitroaromatics and their transformation products in soil around ammunition
plants: new high performance liquid chromatographic charge transfer stationary
phases. Chemosphere 1998, 37 (3), 559–575.
A. C. Duarte and S. Capelo1168
8/2/2019 Chemo Metric in Chromatography
http://slidepdf.com/reader/full/chemo-metric-in-chromatography 27/34
37. Forgacs, E.; Cserhati, T. Relationship between retention characteristics and
physicochemical parameters of solutes on a porous graphitized carbon column
studied by canonical correlation analysis. Anal. Lett. 1999, 32 (9), 1867–1878.
38. Valko, K.; Plass, M.; Bevan, C.; Reynolds, D.; Abraham, M.H. Relationships
between the chromatographic hydrophobicity indices and solute descriptors
obtained by using several reversed-phase, diol, nitrile, cyclodextrin and immobi-
lised artificial membrane-bonded high-performance liquid chromatography
columns. J. Chromatogr. A 1998, 797 , 41–55.
39. Detroyer, A.; Heyden, Y.V.; Cambre, I.; Massart, D.L. Chemometric comparison
of recent chromatographic and electrophoretic methods in a quantitative
structure-retention and retention-activity relationship context. J. Chromatogr. A
2003, 986 , 227–238.40. Detroyer, A.; Schoonjans, V.; Questier, F.; Heyden, Y.V.; Borosy, A.P.; Guo, Q.;
Massart, D.L. Exploratory chemometric analysis of the classification of
pharmaceutical substances based on chromatographic data. J. Chromatogr. A
2000, 897 , 23– 36.
41. Jalali-Heravi, M.; Garkani-Nejad, Z. Prediction of electrophoretic mobilities of
sulfonamides in capillary zone electrophoresis using artificial neural networks.
J. Chromatogr. A 2001, 927 , 211–218.
42. Cserhati, T.; Forgacs, E. Relationship between the hydrophobicity and specific
hydrophobic surface area of pesticides determined by high-performance liquid
chromatography compared with reversed-phase thin-layer chromatography.
J. Chromatogr. A 1997, 771, 105–109.
43. Farkas, O.; Heberger, K.; Zenkevich, I.G. Quantitative structure-retention
relationships XIV Prediction of gas chromatographic retention indices for
saturated O-, N-, and S-heterocyclic compounds. Chemom. Intell. Lab. Syst.
2004, 72, 173–184.
44. Luan, F.; Xue, C.; Zhang, R.; Zhao, C.; Liu, M.; Hu, Z.; Fan, B. Prediction of
retention time of a variety of volatile organic compounds based on the
heuristic method and support vector machine. Anal. Chim. Acta 2005, 537 ,
101–110.
45. Liu, H.; Yao, X.; Xue, C.; Zhang, R.; Liu, M.; Hu, Z.; Fan, B. Study of quanti-
tative structure-mobility relationship of the peptides based on the structural
descriptors and support vector machines. Anal. Chim. Acta 2005, 542, 249– 259.
46. Heberger, K. Evaluation of polarity indicators and stationary phases by principal
component analysis in gas-liquid chromatography. Chemom. Intell. Lab. Syst.
1999, 47 , 41– 49.47. Heberger, K.; Milczewska, K.; Voelkel, A. Principal component analysis of
polarity interaction parameters in inverse gas chromatography. J. Chromatogr.
Sci. 2001, 39, 375–384.
48. Forlay-Frick, P.; Fekete, J.; Heberger, K. Classification and replacement test of
HPLC systems using principal component analysis. Anal. Chim. Acta 2005,
536 , 71–81.
49. Ivanyi, T.; Heyden, Y.V.; Visky, D.; Baten, P.; De Beer, J.; Lazar, I.;
Massart, D.L.; Roets, E.; Hoogmartens, J. Minimal number of chromatographic
test parameters for the characterisation of reversed-phase liquid chromatographic
stationary phases. J. Chromatogr. A 2002, 954, 99–114.
50. Poole, S.K.; Poole, C.F. Chemometric classification of the solvent properties
(selectivity) of commonly used gas chromatographic stationary phases.
J. Chromatogr. A 1995, 697 , 415–427.
Application of Chemometrics in Separation Science 1169
8/2/2019 Chemo Metric in Chromatography
http://slidepdf.com/reader/full/chemo-metric-in-chromatography 28/34
51. Gyseghem, E.V.; Jimidar, M.; Sneyers, R.; Redlich, D.; Verhoeven, E.;
Massart, D.L.; Heyden, Y.V. Selection of reversed-phase liquid chromatographic
columns with diverse selectivity towards the potential separation of impurities
on drugs. J. Chromatogr. A 2004, 1042, 69– 80.
52. Forlay-Frick, P.; Gyseghem, E.V.; Heberger, K.; Heyden, Y.V. Selection of
orthogonal chromatographic systems based on parametric and non-parametric
statistical tests. Anal. Chim. Acta 2005, 539, 1–10.
53. Turowski, M.; Kaliszan, R.; Lullmann, C.; Genieser, H.G.; Jastorff, B. New
stationary phases for the high-performance liquid chromatographic separation
of nucleosides and cyclic nucleotides. Synthesis and chemometric analysis of
retention data. J. Chromatogr. A 1996, 728, 201–211.
54. Wynia, G.S.; Windhorst, G.; Post, P.C.; Maris, F.A. Development and validationof a capillary electrophoresis method within a pharmaceutical quality control
environment and comparison with high-performance liquid chromatography.
J. Chromatogr. A 1997, 773, 339–350.
55. Peyrin, E.; Guillaume, Y.C. Chemometric approach to the treatment of
benzodiazepine separation and peak broadening in capillary electrophoresis.
J. Chromatogr. A 1999, 849, 563–573.
56. Guillaume, Y.C.; Peyrin, E. Chemometric method to optimise chiral separation
of imidazole derivatives by capillary electrophoresis. Talanta 1999, 50, 533– 540.
57. Corradini, C.; Bianchi, F.; Matteuzzi, D.; Amoretti, A.; Rossi, M.; Zanoni, S.
High-performance anion-exchange chromatography coupled with pulsed
amperometric detection and capillary zone electrophoresis with indirect ultra
violet detection as powerful tools to evaluate prebiotic properties of fructooligo-
saccharides and inulin. J. Chromatogr. A 2004, 1054, 165–173.58. Li, Y.G.; Liu, H.; Heyden, Y.V.; Chen, M.; Wang, Z.T.; Hu, Z.B. Robustness
tests on the United States Pharmacopeia XXVI HPLC assay for ginsenosides in
Asian and American ginseng using an experimental design. Anal. Chim. Acta2005, 536 , 29–38.
59. Perrin, C.; Fabre, H.; Maftouh, M.; Massart, D.L.; Heyden, Y.V. Robustness
testing of chiral separations by capillary electrophoresis using highly-sulfated
cyclodextrins. J. Chromatogr. A 2003, 1007 , 165–177.
60. Marengo, E.; Gennaro, M.C.; Gianotti, V. Chemometrically assisted simul-
taneous separation of 21 aromatic sulfonates in ion-interaction RP-HPLC.
Chemom. Intell. Lab. Syst. 2000, 53, 57–67.
61. Persson-Stubberud, K.; Astrom, O. Separation of ibuprofen, codeine phosphate,
their degradation products and impurities by capillary electrophoresis
I. Method development and optimisation with fractional factorial design.J. Chromatogr. A 1998, 798, 307–314.
62. Morris, V.M.; Hargreaves, C.; Overall, K.; Marriott, P.J.; Hughes, J.G. Optimiz-
ation of the capillary electrophoresis separation of ranitidine and related
compounds. J. Chromatogr. A 1997, 766 , 245–254.
63. Jimidar, M.; Bourguignon, B.; Massart, D.L. Application of Derringer’s desir-ability function for the selection of optimum separation conditions in capillary
zone electrophoresis. J. Chromatogr. A 1996, 740, 109–117.
64. Wan, H.; Ohman, M.; Blomberg, L.G. Chemometric modelling of neurotransmit-
ter amino acid separation in normal and reversed migration micellar electroki-
netic chromatography. J. Chromatogr. A 2001, 916 , 255–263.
65. Safa, F.; Hadjmohammadi, M.R. Chemometric approach in optimization of
micellar liquid chromatographic separation of some halogenated phenols. Anal.
Chim. Acta 2005, 540, 121–126.
A. C. Duarte and S. Capelo1170
8/2/2019 Chemo Metric in Chromatography
http://slidepdf.com/reader/full/chemo-metric-in-chromatography 29/34
66. Brunnkvist, H.; Karlberg, B.; Gunnarsson, L.; Granelli, I. Experimental design
as tool when evaluating stationary phases for the capillary electrochromato-
graphic separation of basic peptides. J. Chromatogr. B 2004, 813, 67–73.
67. Wsol, V.; Fell, A.F. Central composite design as a powerful optimisation
technique for enantioresolution of the rac-11-dihydrooracin—the principal
metabolite of the potential cytostatic drug oracin. J. Biochem. Biophys.
Methods 2002, 54, 377–390.
68. Romvari, Zs.; Fekete, J.; Kemeny, S.; Pokol, G.; Gebefugi, I.; Kettrup, A.
Determination of two metabolites of albendazole, albendazole-sulfoxide and
albendazole-sulfone in cow’s milk using an HPLC method—a systematic
approach to optimise extraction conditions. Chromatographia 1998, 48 (11/12),
777–784.69. Romvari, Zs.; Kemeny, S.; Pokol, G.; Fekete, J. A new approach for development
of rugged sample preparation of metabolites of albenzadole in cow milk.
Mikrochim. Acta 1999, 130, 155–163.
70. Ehmann, T.; Bachmann, K.; Fabry, L.; Rufer, H.; Serwe, M.; Ross, G.; Pahlke, S.;
Kotz, L. Capillary preconditioning for analysis of anions using indirect UV
detection in capillary zone electrophoresis. Systematic investigation of alkaline
and acid prerinsing techniques by designed experiments. J. Chromatogr. A
1998, 816 , 261–275.
71. Keszler, A; Heberger, K. Influence of extraction parameters and medium on effi-
ciency of solid-phase microextraction sampling in the analysis of aliphatic
aldehydes. J. Chromatogr. A 1999, 845, 337–347.
72. Tukai, R.; Maher, W.A.; McNaught, I.J.; Ellwood, M.J. Measurement of arsenic
species in marine macroalgae by microwave-assisted extraction and high per-formance liquid chromatography-inductively coupled plasma mass spectrometry.
Anal. Chim. Acta 2002, 457 , 173–185.
73. Johansen, K.; Rasmussen, K.E. Automated on-line dialysis for sample prep-
aration and HPLC analysis of antidepressant drugs in human plasma. Inhibition
of interaction with the dialysis membrane. J. Pharm. Biomed. Anal. 1998, 16 ,
1159–1169.
74. Beijersten, I.; Westerlund, D. Derivatization of dipeptides with 4-fluoro-7-nitro-
2,1,3-benzoxadiazole for laser-induced fluorescence and separation by micellar
electrokinetic chromatography. J. Chromatogr. A 1995, 716 , 389–399.
75. Daali, Y.; Cherkaoui, S.; Veuthey, J-L. Capillary electrophoresis and high-per-
formance anion exchange chromatography for monitoring caseinoglycomacro-
peptide sialylation. J. Pharm. Biomed. Anal. 2001, 24, 849–856.
76. Guillaume, Y.C.; Peyrin, E. Optimising mobile phase composition, its flow-rateand column temperature in HPLC using taboo search. Talanta 2000, 51,
579–586.
77. Boelens, H.F.M.; Dijkstra, R.J.; Eilers, P.H.C.; Fitzpatrick, F.; Westerhuis, J.A.
New background correction method for liquid chromatography with diode
array detection, infrared spectroscopic detection and Raman spectroscopic
detection. J. Chromatogr. A 2004, 1057 , 21–30.
78. Ferreira, S.L.C.; dos Santos, W.N.L.; Quintella, C.M.; Neto, B.B.; Bosque-
Sendra, J.M. Doehlert matrix: a chemometric tool for analytical chemistry-
review. Talanta 2004, 63, 1061– 1067.
79. Hu, Y.; Massart, D.L. Uniform shell designs for optimization in reversed-phase
liquid chromatography. J. Chromatogr. 1989, 485, 311–323.
80. Araujo, P. A new high performance liquid chromatography multifactor method-
ology for systematic and simultaneous optimisation of the gradient solvent
Application of Chemometrics in Separation Science 1171
8/2/2019 Chemo Metric in Chromatography
http://slidepdf.com/reader/full/chemo-metric-in-chromatography 30/34
system and the instrumental/experimental variables. Trends in Anal. Chem.2000, 19 (9), 524–529.
81. Garcıa, I.; Sarabia, L.A.; Ortiz, M.C.; Aldama, J.M. Optimization of the chroma-
tographic conditions for the determination of hormones by gas chromatography
with mass spectrometry detection. Anal. Chim. Acta 2005, 544, 26–35.
82. Farkova, M.; Pena-Mendez, E.M.; Havel, J. Use of artificial neural networks in
capillary zone electrophoresis. J. Chromatogr. A 1999, 848, 365–374.
83. Havel, J.; Pena, E.M.; Rojas-Hernandez, A.; Doucet, J.-P.; Panaye, A. Neural
networks for optimization of high-performance capillary zone electrophoresis
methods. A new method using a combination of experimental design and artificial
neural networks. J. Chromatogr. A 1998, 793, 317–329.
84. Kotani, A.; Hayashi, Y.; Matsuda, R.; Kusu, F. Prediction of measurementprecision of apparatus using a chemometric tool in electrochemical detection
of high-performance liquid chromatography. J. Chromatogr. A 2003, 986 ,
239–246.
85. Cela, R.; Martınez, J.A.; Gonzalez-Barreiro, C.; Lores, M. Multi-objective optim-
isation using evolutionary algorithms: its application to HPLC separations.
Chemom. Intell. Lab. Syst. 2003, 69, 137–156.
86. Dewe, W.; Marini, R.D.; Chiap, P.; Hubert, Ph.; Crommen, J.; Boulanger, B.
Development of response models for optimising HPLC methods. Chemom.
Intell. Lab. Syst. 2004, 74, 263–268.
87. Marini, R.D.; Boulanger, B.; Heyden, Y.V.; Chiap, P.; Crommen, J.; Hubert, Ph.
Uncertainty assessment from robustness testing applied on an LC assay for
R-timolol and other related substances in S -timolol maleate. Anal. Chim. Acta
2005, 531, 131–140.88. Holık, M.; Mannschreck, A. Determining enantiomeric excess from overlapping
HPLC peaks: discussion of errors in the methods. Chemom. Intell. Lab. Syst.2004, 72, 153–160.
89. Sanli, N.; Fonrodona, G.; Barbosa, J.; Ozkan, G.A.; Beltran, J.L. Modelling
retention in liquid chromatography of polyphenolic acids. Prediction of solvent
composition and pH of the mobile phase. Anal. Chim. Acta 2005, 537 , 53– 61.
90. De Beer, J.O.; Baten, P.; Nsengyumva, C.; Smeyers-Verbeke, J. Measurement
uncertainty from validation and duplicate analysis results in HPLC analysis of
multivitamin preparations and nutrients with different galenic forms. J. Pharm.
Biomed. Anal. 2003, 32, 767–811.
91. Wieling, J.; Hendriks, G.; Tamminga, W.J.; Hempenius, J.; Mensink, C.K.;
Oosterhuis, B.; Jonkman, J.H.G. Rational experimental design for bioanalytical
methods validation. Illustration using an assay method for total captopril inplasma. J. Chromatogr. A 1996, 730, 381–394.
92. Brereton, R.G.; Gurden, S.P.; Groves, J.A. Use of eigenvalues for determining
the number of components in window factor analysis of spectroscopic and
chromatographic data. Chemom. Intell. Lab. Syst. 1995, 27 , 73–87.
93. Csomos, E.; Heberger, K.; Simon-Sarkadi, L. Principal component analysis of
biogenic amines and polyphenols in Hungarian wines. J. Agric. Food Chem.
2002, 50, 3768– 3774.
94. Berente, B.; De la Calle Garcıa, D.; Reichenbacher, M.; Danzar, K. Method
development for the determination of anthocyanins in red wines by high-perform-
ance liquid chromatography and classification of German red wines by means of
multivariate statistical methods. J. Chromatogr. A 2000, 871, 95–103.
95. Masino, F.; Chinnici, F.; Franchini, G.C.; Ulrici, A.; Antonelli, A. A study of
the relationships among acidity, sugar and furanic compound concentrations in
A. C. Duarte and S. Capelo1172
8/2/2019 Chemo Metric in Chromatography
http://slidepdf.com/reader/full/chemo-metric-in-chromatography 31/34
set of casks for Aceto Balsamico Tradizionale of Reggio Emilia by multivariate
techniques. Food Chem. 2005, 92, 673–679.
96. Nemati, M.; Oveisi, M.R.; Abdollahi, H.; Sabzevari, O. Differentiation of
bovine and porcine gelatins using principal component analysis. J. Pharm.
Biomed. Anal. 2004, 34, 485–492.
97. Cichelli, A.; Pertesana, G.P. High-performance liquid chromatographic analysis
of chlorophylls, pheophytins and caratenoids in virgin olive oils: chemometric
approach to variety classification. J. Chromatogr. A 2004, 1046 , 141–146.
98. Dziuba, J.; Nałecz, D.; Minkiewicz, P.; Dziuba, B. Identification and determi-
nation of milk and soybean protein preparations using enzymatic hydrolysis
followed by chromatography and chemometrical data analysis. Anal. Chim.
Acta 2004, 521, 17–24.99. Yawei, W.; Lina, L.; Jianbo, S.; Guibin, J. Chemometrics methods for the inves-
tigation of methylmercury and total mercury contamination in mollusks samples
collected from coastal sites along the Chinese Bohai Sea. Environ. Pollution
2005, 135, 457–467.
100. Lenz, E.M.; Bright, J.; Knight, R.; Wilson, I.D.; Major, H. Cyclosporin
A-induced changes in endogenous metabolites in rat urine: a metabonomic
investigation using high field 1H NMR spectroscopy, HPLC-TOF/MS and
chemometrics. J. Pharm. Biomed. Anal. 2004, 35, 599–608.
101. Gioacchini, A.M.; Menotta, M.; Bertini, L.; Rossi, I.; Zeppa, S.; Zambonelli, A.;
Piccoli, G.; Stocchi, V. Solid-phase microextraction gas chromatography/mass
spectrometry: a new method for species identification of truffles. Rapid
Commun. Mass Spectrom. 2005, 19, 2365–2370.
102. Lu, G.-H.; Chan, K.; Liang, Y.-Z.; Leung, K.; Chan, C.-L.; Jiang, Z.-H.;Zhao, Z.-Z. Development of high-performance liquid chromatographic finger-
prints for distinguishing Chinese Angelica from related umbelliferae herbs.
J. Chromatogr. A 2005, 1073, 383–392.
103. Gong, F.; Liang, Y.-Z.; Fung, Y.-S. Analysis of volatile components from Cortex
cinnamomi with hyphenated chromatography and chemometric resolution.
J. Pharm. Biomed. Anal. 2004, 34, 1029– 1047.
104. Liang, Y.-Z.; Xie, P.; Chan, K. Quality control of herbal medicines.
J. Chromatogr. B 2004, 812, 53–70.105. Hendriks, M.M.W.B.; Cruz-Juarez, L.; De Bont, D.; Hall, R.D. Preprocessing and
exploratory analysis of chromatographic profiles of plant extracts. Anal. Chim.
Acta 2005, 545, 53–64.
106. Chen, Z.-P.; Yu, R.-Q. Mitigating model deficiency in three-way data analysis by
the combination of background constraining and iterative correcting techniques.Anal. Chim. Acta 2003, 487 , 171–180.
107. Jakab, A.; Heberger, K.; Forgacs, E. Comparative analysis of different plant oils
by high-performance liquid chromatography-atmospheric pressure chemical
ionization mass spectrometry. J. Chromatogr. A 2002, 976 , 255–263.
108. Gonzalez, A.G.; Pablos, F.; Martın, M.J.; Leon-Camacho, M.; Valdenebro, M.S.HPLC analysis of tocopherols and triglycerides in coffee and their use as authen-
tication parameters. Food Chem. 2001, 73, 93–101.
109. Baiocchi, C.; Marengo, E.; Roggero, M.A.; Giacosa, D.; Giorcelli, A.; Toccori, S.
Chromatographic and chemometric investigation of the chemical defence
mechanism of poplar tree genotypes against a bark fungine parasite.
J. Chromatogr. A 1995, 715, 95–104.
110. Klemenc, S. In common batch searching of illicit heroin samples—evaluation of
data by chemometrics methods. Forensic Sci. Int. 2001, 115, 43–52.
Application of Chemometrics in Separation Science 1173
8/2/2019 Chemo Metric in Chromatography
http://slidepdf.com/reader/full/chemo-metric-in-chromatography 32/34
111. Marini, F.; Balestrieri, F.; Bucci, R.; Magrı, A.L.; Marini, D. Supervised pattern
recognition to discriminate the geographical origin of rice bran oils: a first study.
Microchem. J. 2003, 74, 239–248.
112. Gong, Y.X.; Li, S.P.; Li, P.; Liu, J.J.; Wang, Y.T. Simultaneous determination of
six main nucleosides and bases in natural and cultured Cordyceps by capillary
electrophoresis. J. Chromatogr. A 2004, 1055, 215–221.
113. Alonso-Salces, R.M.; Herrero, C.; Barranco, A.; Berrueta, L.A.; Gallo, B.;
Vicente, F. Classification of apple fruits according to their maturity state by
the pattern recognition analysis of their polyphenolic compositions. Food
Chem. 2005, 93, 113–123.
114. Pasadakis, N.; Gaganis, V.; Varotsis, N. Accurate determination of aromatic
groups in heavy petroleum fractions using HPLC-UV-DAD. Fuel 2001, 80,147–153.
115. Lilley, K.A.; Wheat, T.E. Drug identification in biological matrices using
capillary electrophoresis and chemometric software. J. Chromatogr. B 1996,
683, 67– 76.
116. Latorre, R.M.; Saurina, J.; Hernandez-Cassou, S. Determination of amino acids
in overlapped capillary electrophoresis peaks by means of partial least-squares
regression. J. Chromatogr. A 2000, 871, 331–340.
117. Frenich, A.G.; Galera, M.M.; Vidal, J.L.M.; Garcia, M.D.G. Partial least-squares
and principal component regression of multi-analyte high performance liquid
chromatography with diode-array detection. J. Chromatogr. A 1996, 727 , 27–38.
118. Sentellas, S.; Saurina, J.; Hernandez-Cassou, S.; Galceran, M.T.; Puignou, L.
Multivariate calibration methods for quantification in strongly overlapping
capillary electrophoretic peaks. J. Chromatogr. A 2001, 909, 259–269.
119. Jalali-Heravi, M.; Vosough, M. Use of second-order calibration for residue
screening of some triazines in the presence of coeluting interferences by gas
chromatography-selected ion mass spectrometry. Anal. Chim. Acta 2005, 537 ,
89–100.
120. Gimeno, R.A.; Comas, E.; Marce, R.M.; Ferre, J.; Rius, F.X.; Borrull, F. Second-
order bilinear calibration for determining polycyclic aromatic compounds in
marine sediments by solvent extraction and liquid chromatography with diode-
array detection. Anal. Chim. Acta 2003, 498, 47–53.
121. Bogomolov, A.; McBrien, M. Mutual peak matching in a series of HPLC-DAD
mixture analysis. Anal. Chim. Acta 2003, 490, 41–58.
122. Walczak, B.; Wu, W. Fuzzy warping of chromatograms. Chemom. Intell. Lab.
Syst. 2005, 77 , 173–180.123. Gross, G.M.; Prazen, B.J.; Synovec, R.E. Parallel column liquid chromatography
with a single multi-wavelength absorbance detector for enhanced selectivity
using chemometric analysis. Anal. Chim. Acta 2003, 490, 197–210.
124. Comas, E.; Gimeno, R.A.; Ferre, J.; Marce, R.M.; Borrull, F.; Rius, F.X. Using
second-order calibration to identify and quantify aromatic sulfonates in water
by high-performance liquid chromatography in the presence of coeluting
interferences. J. Chromatogr. A 2003, 988, 277–284.
125. Nielsen, N-P V.; Carstensen, J.M.; Smedsgaard, J. Aligning of single and
multiple wavelength chromatographic profiles for chemometric data analysis
using correlation optimised warping. J. Chromatogr. A 1998, 805, 17–35.
126. De Braekeleer, K.; de Juan, A.; Massart, D.L. Purity assessment and resolution of
tetracycline hydrochloride samples analysed using high-performance liquid
chromatography with diode array detection. J. Chromatogr. A 1999, 832, 67–86.
A. C. Duarte and S. Capelo1174
8/2/2019 Chemo Metric in Chromatography
http://slidepdf.com/reader/full/chemo-metric-in-chromatography 33/34
127. Williams, R.E.; Lenz, E.M.; Evans, J.A.; Wilson, I.D.; Granger, J.H.;
Plumb, R.S.; Stumpf, C.L. A combined 1H NMR and HPLC-MS-based metabo-
nomic study of urine from obese (fa/fa) Zucker and normal Wistar-derived rats.
J. Pharm. Biomed. Anal. 2005, 38 (3), 465–471.
128. Hannon, J.A.; Sousa, M.J.; Lillevang, S.; Sepulchre, A.; Bockelmann, W.;
McSweeney, P.L.H. Effect of defined-strain surface starters on the ripening of
Tilsit cheese. Int. Dairy J. 2004, 14, 871–880.
129. Korany, M.A.; Fahmy, O.T.; Mahgoub, H.; Maher, H.M. Non-parametric linear
regression of discrete Fourier transform convoluted chromatographic peak
responses in non-ideal conditions. Talanta 2005, 66 (4), 1073–1087.
130. Gong, F.; Liang, Y.-Z.; Fung, Y.-S.; Chau, F.-T. Correction of retention time
shifts for chromatographic fingerprints of herbal medicines. J. Chromatogr. A2004, 1029, 173–183.
131. Gennaro, M.C.; Gianotti, V.; Marengo, E.; Pattono, D.; Turi, R.M. A chemo-
metric investigation of the effect of the cheese-making process on contents of
biogenic amines in a semi-hard Italian cheese (Toma). Food Chem. 2003, 82,
545–551.
132. Dunkerley, S.; Brereton, R.G.; Crosby, J. A comparison of deconvolution
methods as applied to high performance liquid chromatography-diode array
detector-electrospray mass spectrometry of 2- and 3-hydroxypyridine at
varying pH in the presence of severely tailing peak shapes. Chemom. Intell.
Lab. Syst. 1999, 48, 99–119.
133. Windig, W. The use of the Durbin-Watson criterion for noise and background
reduction of complex liquid chromatography/mass spectrometry data and a
new algorithm to determine sample differences. Chemom. Intell. Lab. Syst.
2005, 77 , 206–214.
134. Windig, W.; Phalp, J.M.; Payne, A.W. A noise and background reduction method
for component detection in liquid chromatography/mass spectrometry. Anal.
Chem. 1996, 68, 3602–3606.
135. Windig, W.; Smith, W.F.; Nichols, W.F. Fast interpretation of complex LC/MS
data using chemometrics. Anal. Chim. Acta 2001, 446 , 467–476.
136. Zhao, R.; Xu, G.; Yue, B.; Liebich, H.M.; Zhang, Y. Artificial neural network
classification based on capillary electrophoresis of urinary nucleosides for the
clinical diagnosis of tumors. J. Chromatogr. A 1998, 828, 489–496.
137. Malkavaara, P.; Harjula, P.; Alen, R.; Knuutinen, J. Chemometric investigation
on structural changes in pine kraft lignin during pulping. Chemom. Intell. Lab.
Syst. 2000, 52, 117–122.138. Strasık, S.; Dankova, M.; Molnarova, M.; Olvecka, E.; Kaniansky, D. Capillary
zone electrophoresis in wide bore capillary tubes with fiber-coupled diode array
detection. J. Chromatogr. A 2003, 990, 23– 33.
139. Dankova, M.; Strasık, S.; Kaniansky, D. Determination of orotic acid in urine by
capillary zone electrophoresis in tandem-coupled columns with diode array
detection. J. Chromatogr. A 2003, 990, 121–132.
140. Rodrıguez-Cuesta, M.J.; Boque, R.; Rius, F.X.; Vidal, J.L.M.; Frenich, A.G.
Development and validation of a method for determining pesticides in ground-
water from complex overlapped HPLC signals and multivariate curve resolution.
Chemom. Intell. Lab. Syst. 2005, 77 , 251–260.
141. Pere-Trepat, E.; Hildebrandt, A.; Barcelo, D.; Lacorte, S.; Tauler, R. Fast
chromatography of complex biocide mixtures using diode array detection and
multivariate curve resolution. Chemom. Intell. Lab. Syst. 2004, 74, 293–303.
Application of Chemometrics in Separation Science 1175
8/2/2019 Chemo Metric in Chromatography
http://slidepdf.com/reader/full/chemo-metric-in-chromatography 34/34
142. Xie, H.-P.; Jiang, J.-H.; Long, N.; Shen, G.-L.; Wu, H.-L.; Yu, R.-Q. Estimationof chemical rank of a three-way array using a two-mode subspace comparison
approach. Chemom. Intell. Lab. Syst. 2003, 66 , 101–115.143. Sanchez-Ponce, R.; Rutan, S.C. Steady state kinetic model constraint for multi-
variate curve resolution-alternating least squares analysis. Chemom. Intell.
Lab. Syst. 2005, 77 , 50– 58.144. Webb-Robertson, B.-J.M.; Jarman, K.H.; Harvey, S.D.; Posse, C.; Wright, B.W.
An improved optimisation algorithm and a Bayes factor termination criterionfor sequential projection pursuit Chemom. Intell. Lab. Syst. 2005, 77 , 149–160.
145. Kubicka, D.; Ronnholm, M.; Reinikainen, S.-P.; Salmi, T.; Murzin, D.Y.Improved kinetic data from analysis of complex hydrocarbon mixtures by
using SIMCA. Anal. Chim. Acta 2005, 537 , 339–348.
Received September 27, 2005
Accepted December 21, 2005
Manuscript 6770H
A. C. Duarte and S. Capelo1176