Embed Size (px)
Citation preview
Optimization of Sodium Hydroxide Pretreatment Conditions to Improve Biogas Production from 1
Asparagus Stover 2
Chen Sun, Ronghou Liu∗, Weixing Cao, Kun Li, Lijuan Wu 3
(Biomass Energy Engineering Research Centre, School of Agriculture and Biology, 4
Shanghai Jiao Tong University, 800 Dongchuan Road, Minhang District, Shanghai 200240, P.R.China) 5
Abstract 6
Alkaline pretreatment was employed to enhance biogas production from asparagus stover with 7
anaerobic digester in laboratory scale batch fermentation. Different pretreatment times (10 d, 18 d, 25 d), 8
NaOH concentrations (2.5%, 5%, 7.5%), and water dose (20 mL, 60 mL, 100 mL) were tested to select 9
the best pretreatment conditions. With Response Surface Method (RSM) applied, the optimum 10
pretreatment conditions were pretreatment time of 19d, NaOH concentration of 4.2%, water dose of 11
74g.The biogas yield was predicted as 275.65 mL/g VS, while it was observed as 277.86 mL/g VS in the 12
verification test, with the relative error of 0.80%. Further more, the verification tests show that contents of 13
hemi-cellulose, cellulose and lignin after pretreatment were decreased by 65.20%, 29.06% and 13.51%, 14
respectively. The above results suggest that the effects of NaOH on degradations of hemi-cellulose and 15
cellulose are higher than that on lignin. 16
Keywords: Alkaline pretreatment, Agricultural waste, Anaerobic digestion, Response surface method 17
1. Introduction 18
As a source of clean energy and a competitive way of dealing with organic waste, biogas 19
fermentation has long been considered bearing immense development potential in China, especially in 20
rural areas, where agricultural waste is abundant and even superfluous. For an example, the annual yield 21 ∗ Corresponding author, Ronghou Liu, Telephone (Fax): 0086 21 34205744. Email address: [email protected].
of straw in China is about 6.81×10⁹ ton [1]. But merely a small proportion of this sort of waste is handled 22
and disposed properly such as converting into biomass energy, composting, and paper making. Most of 23
the straws and stalks are incinerated or air-dried in the open air just for saving time and labor[1, 2]. 24
Similarly, the amount of asparagus stover generated in the planting base, Chongming Island, Shanghai, 25
China is estimated to around 1x10³ ton per year. But without a proper disposal method, this agriculture 26
waste is simply piled up on the side of country road, giving out bad smell after rotting naturally. 27
Among several ways of waste recycling, anaerobic digestion (AD) can not only yield biogas, 28
the comparatively clean fuel with methane as the major gas, but also produce solid and liquid fertilizers. It 29
is an ideal waste management method which combines waste reducing, recycling and reusing into one 30
process [3]. Due to some technological and historical problems, the commercial production has not been 31
completely realized so far. Nowadays, household biogas, the most feasible and prevalent biogas 32
production pattern in rural China, accounts for only about 19% of the biogas potential of the country [2]. 33
The physico-chemical structure of lignocellulosic agricultural wastes slows down the hydrolysis rate 34
during AD. One method to overcome the technological obstacle is applying pretreatment, so as to obtain 35
more hydrolytic products for subsequent biogas production. Pretreatment can help to break up the 36
stubborn physical structure, dissolve the linear and nonlinear macromolecules and therefore improve the 37
biodegradability of lignocellulosic materials. At present, the pretreatment methods include physical, 38
chemical, biological and mixed ones [4]. Unlike physical and biological methods, chemical pretreatment is 39
comparatively effective with relative low cost. Among several kinds of chemical pretreatment such as 40
acidic, alkaline and oxidized ones, alkaline pretreatment represented by sodium hydroxide pretreatment 41
gains more and more attention because of its operability [5]. 42
During alkaline pretreatment, the first reactions are solvation and saponification. In this process, the 43
raw material is swollen, thus making it more accessible to microorganisms. Then, if with a relatively high 44
concentration of alkali, the reaction of “peeling” end-groups, alkaline hydrolysis, and polysaccharides 45
decomposition will carry on. And these reactions will greatly contribute to the later conversion [4]. 46
Pavlostathis and Gossett (1985) reported a 100% increase in methane production from wheat straw 47
brought by alkaline pretreatment[6]. He and Pang demonstrated that the biogas yield of rice straw (in the 48
solid state) with 6% NaOH pretreatment was increased by 27.3-64.5% [7]. Also, a degradation of 16.4% 49
cellulose, 36.8% hemicellulose and 28.4% lignin as well as an increase of 122.5% in water-soluble 50
substances were observed. Also, Zhu and Wan mentioned a 37.0% higher biogas yield of corn stover with 51
5% NaOH-pretreatment than that of the control [14]. 52
Currently, there are two categories of criterions for assessing the alkaline pretreatment effects. One is 53
detecting the degradation and decomposition level of lignocelluloses, as well as the increasing level of 54
soluble substance. In conducting this sort of valuation, the content and physicochemical characterization 55
changes of lignin, hemicellulose, cellulose, and monosaccharide in raw material should be investigated. 56
The other is linear comparison of fermentation indicators such as methane or biogas yield during 57
subsequent AD between the treated and untreated. By combining the assessing criterions with scientific 58
tests design methods, the optimal condition of alkaline pretreatment for lignocellulosic waste can be 59
revealed. 60
Response surface method (RSM) is collection of mathematical and statistical techniques, which can 61
be used in designing the tests, building models, evaluating significance of independent variables, and 62
optimizing conditions for desirable responses.8 It has been applied in optimizing AD conditions of 63
methane/hydrogen production from waste water and sludge [21,22], pretreatment conditions of certain kinds 64
of wastes [23,24], the culture medium conditions of culturing anaerobic microorganism [25] and so on. Often, 65
RSM is conducted after the ‘change-one-factor-at-a-time’ method, in which the ranges of independent 66
variables can be roughly given out when the peak response value turns up. Later, these ranges of variables 67
will be selected to design multi-factor tests, take the RSM for example, to show the best conditions of the 68
variables whether they interact with each other or not. 69
Our previous study of ‘change-one-factor-at-a-time’ tests showed that asparagus stover, the 70
hard-to-digest lignocellulosic material, can be used for biogas production after alkaline pretreatment [9]. 71
The objectives of our current work were to investigate the interactions among the factors and to optimize 72
conditions of sodium hydroxide pretreatment when asparagus stover sample was used as raw material in 73
order to increase biogas yield. The biogas yield was monitored in batch anaerobic digestion tests on lab 74
level. The effects of different treatment conditions on biogas yield and the optimal condition for sodium 75
hydroxide pretreatment were statistically evaluated by RSM. 76
2. Materials and methods 77
2.1 Raw material and inoculum preparation 78
The asparagus stover used in the experiments was rejected materials collected from the roadsides of 79
asparagus planting base, located in the town of Gangyan, Chongming Island, Shanghai, P.R.China. Most 80
of the stover was asparagus rhizome, and a small part was stems and leaves. Both of which were naturally 81
air-dried. The stover was firstly grinded by kneading miller; and then, the longer segments were cut into 82
small pieces shorter than 2.5cm. Before pretreatment experiments, the samples were dried in drying oven 83
at 105°C for 6h, making sure its moisture content was less than 0.1%. 84
The inoculum was enriched from anaerobic sludge, which originally came from a pilot scale CSTR 85
reactor treating pig manure in the town of Shuxin, Chongming Island, Shanghai, P.R.China. The inoculum 86
has been acclimated to substrates of asparagus stover in four anaerobic fermentation batch tests 87
previously. The chemical characteristics of asparagus stover (in naturally dried form) and inoculum are 88
shown in Table 1. 89
Table 1 The chemical characteristics of asparagus stover and inoculum 90
items Asparagus stover inoculum Total Solid (wt.% dry basis) 88.12 5.78 Volatile Solid (wt.% dry basis) 80.1 63.62 Total Organic Carbon (wt.% dry basis) 75.1 3.09 Total Nitrogen(wt.% dry basis) 2.88 0.24 Hemi-cellulose(wt.% dry basis) 18.22 - Cellulose (wt.% dry basis) 33.52 - Lignin (wt.% dry basis) 11.1 - pH - 8.13
2.2 Sodium hydroxide pretreatment 91
20 runs were performed in the pretreatment process. According to the tests design, each treatment 92
involves a corresponding amount(20 mL, 60 mL, or 100 mL) of distilled water, an according 93
amount(2.654 g, 5.263 g, and 8.108 g) of sodium hydroxide solid, and 100 g total solid (TS). The amount 94
of distilled water (water dose) stands for the moisture content in the pretreatment experiment. And the 95
NaOH concentration means the amount of NaOH quantity per gram TS of the treatment in this study. 96
Each treatment was repeated twice. The pretreatment experiments were carried out in 2.5 L plastic 97
buckets, sealed by vaseline and preservative film to avoid moisture change and rot fungi infection, and 98
put in incubator of 25±1°C, which is close to the average value of room temperature. 99
2.3 Biogas production 100
Biogas fermentation is conducted in 1 L flask reactor with the working volume of 0.8 L at 35°C. The 101
inoculum content is 30% of the fermentation feed liquid. A 6% solid content of the fermentation broth 102
was used in the study. The pH value of the feed liquid was adjusted by acetic acid to 7.2-7.5 prior to 103
fermentation. The reactor was fixed on a constant temp oscillator stirred at 100 rpm to ensure a total 104
mixing and facilitate the diffusion of biogas. When the daily biogas yield is less than 0.1% of the 105
accumulative biogas yield, it is deemed as the termination of fermentation tests. A blank test without 106
asparagus stover is conducted to subtract the biogas generated from dead bacteria of inoculum. The 107
biogas production was calculated into standard volume at STP condition (273.15K, 101.325KPa). 108
2.4 Tests design 109
In this study, 3 independent variations—pretreatment time, NaOH concentration and water dose, were 110
selected. Biogas yield during the anaerobic fermentation was chosen as the dependent variation. In order 111
to determine the sodium hydroxide pretreatment conditions for the maximum production of biogas, the 112
Face-centered Central Composite Design (CCD) was employed. It allows estimating the second-order 113
polynomial of the independent variables regarding to the response, and gives information about the 114
interaction between independent variables in relation to the response. For statistical calculation, the 115
variables were coded according to Eq. A: 116
X i=(x i-x0)/Δx i (A) 117
where X i is the coded value of the independent variable; x i is the actual value of the independent 118
value; x0 is the value of x i at the centre point of the investigated area; and Δx i is the step size of the 119
independent variable. Pretreatment time (x1), NaOH concentration (x2), and water dose (x3) were chosen 120
as three independent variables in the experimental design. The range and central point values of the 121
independent variables, which were selected as close as possible to the optimum response values based on 122
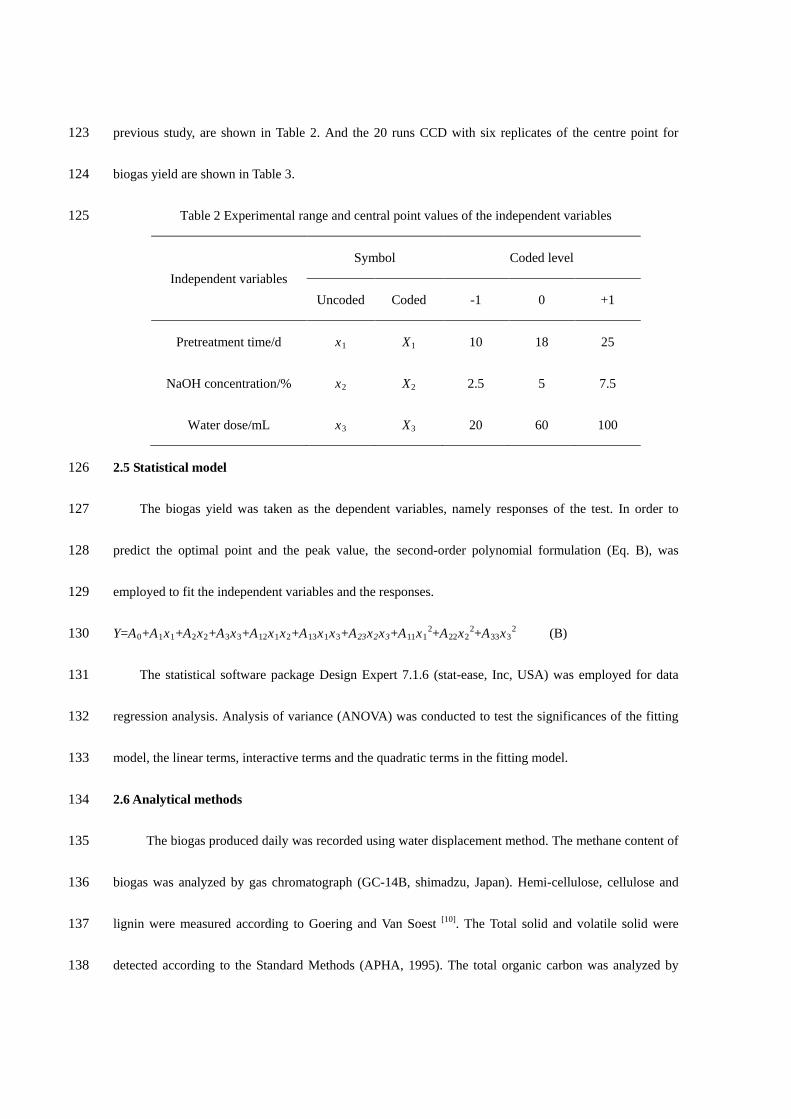
previous study, are shown in Table 2. And the 20 runs CCD with six replicates of the centre point for 123
biogas yield are shown in Table 3. 124
Table 2 Experimental range and central point values of the independent variables 125
Independent variables Symbol Coded level
Uncoded Coded -1 0 +1
Pretreatment time/d x1 X1 10 18 25
NaOH concentration/% x2 X2 2.5 5 7.5
Water dose/mL x3 X3 20 60 100
2.5 Statistical model 126
The biogas yield was taken as the dependent variables, namely responses of the test. In order to 127
predict the optimal point and the peak value, the second-order polynomial formulation (Eq. B), was 128
employed to fit the independent variables and the responses. 129
Y=A0+A1x1+A2x2+A3x3+A12x1x2+A13x1x3+A23x2x3+A11x12+A22x2
2+A33x32 (B) 130
The statistical software package Design Expert 7.1.6 (stat-ease, Inc, USA) was employed for data 131
regression analysis. Analysis of variance (ANOVA) was conducted to test the significances of the fitting 132
model, the linear terms, interactive terms and the quadratic terms in the fitting model. 133
2.6 Analytical methods 134
The biogas produced daily was recorded using water displacement method. The methane content of 135
biogas was analyzed by gas chromatograph (GC-14B, shimadzu, Japan). Hemi-cellulose, cellulose and 136
lignin were measured according to Goering and Van Soest [10]. The Total solid and volatile solid were 137
detected according to the Standard Methods (APHA, 1995). The total organic carbon was analyzed by 138
organic carbon analyzer (multi C/N 3000, Jena, Germany). The total nitrogen was determined by Kjeldahl 139
method. The pH value was detected by pH meter (PHS-3C, Leici, Shanghai). 140
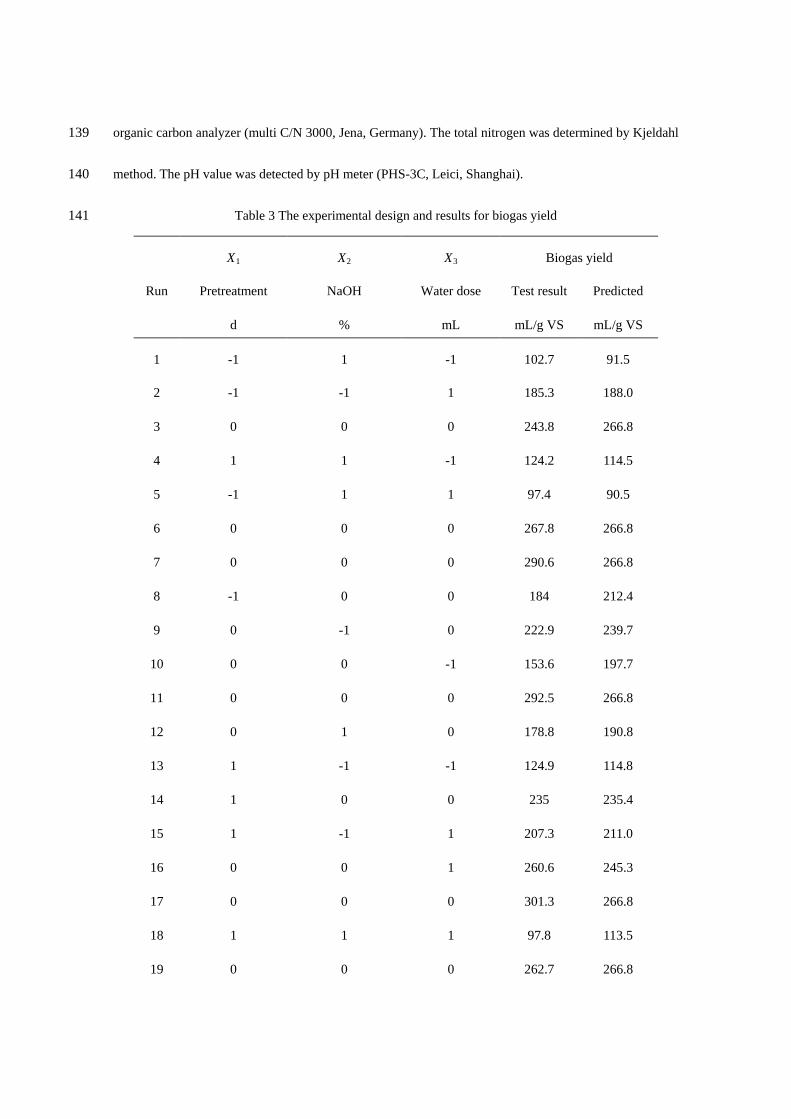
Table 3 The experimental design and results for biogas yield 141
X1 X2 X3 Biogas yield
Run Pretreatment
NaOH
Water dose Test result Predicted
d % mL mL/g VS mL/g VS
1 -1 1 -1 102.7 91.5
2 -1 -1 1 185.3 188.0
3 0 0 0 243.8 266.8
4 1 1 -1 124.2 114.5
5 -1 1 1 97.4 90.5
6 0 0 0 267.8 266.8
7 0 0 0 290.6 266.8
8 -1 0 0 184 212.4
9 0 -1 0 222.9 239.7
10 0 0 -1 153.6 197.7
11 0 0 0 292.5 266.8
12 0 1 0 178.8 190.8
13 1 -1 -1 124.9 114.8
14 1 0 0 235 235.4
15 1 -1 1 207.3 211.0
16 0 0 1 260.6 245.3
17 0 0 0 301.3 266.8
18 1 1 1 97.8 113.5
19 0 0 0 262.7 266.8
20 -1 -1 -1 105 91.8
3. Results and Discussion 142
3.1 Statistical Analysis 143
3.1.1 Model fitting 144
The experimental results of the 20 runs summarized in Table 3 were subjected to regression analysis. 145
And Eq. C was obtained by using Eq. B to fit the experimental data. 146
Y=-381.79+29.39x1+89.68x2+5.35x3-0.13x1x2-7.92×10-3x1x3-0.24x2x3-0.763x12-8.25x2
2-0.03x32 147
(C) 148
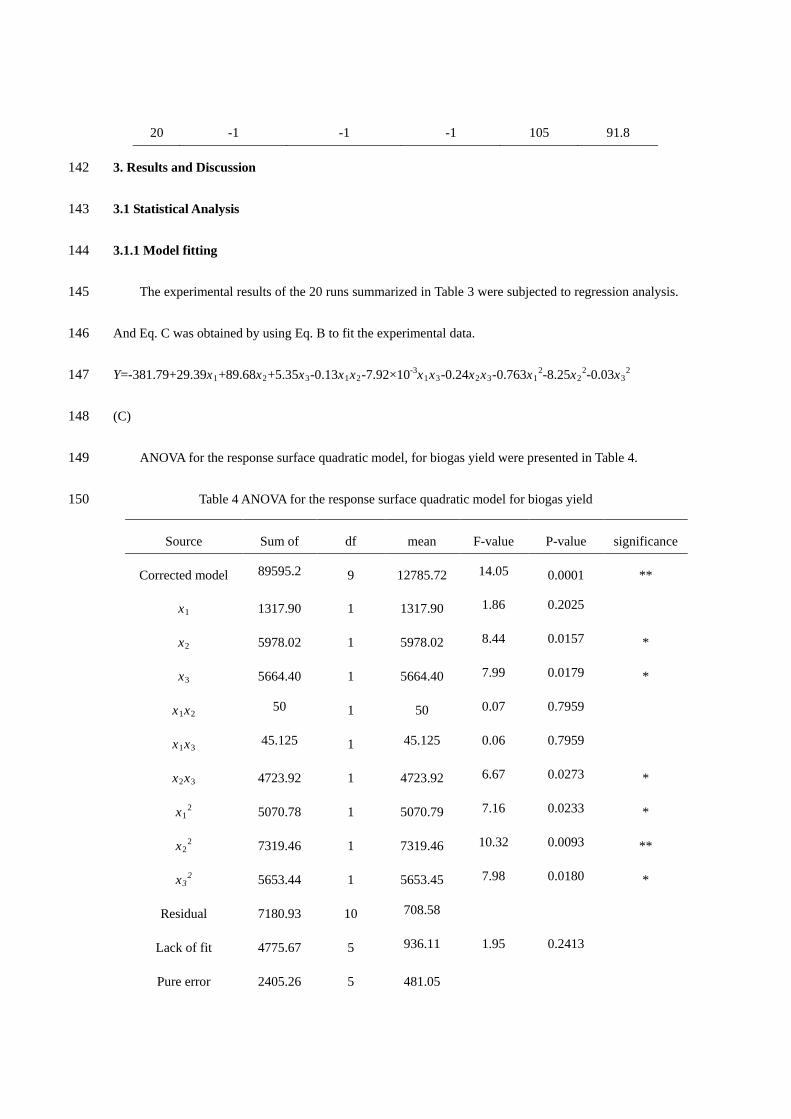
ANOVA for the response surface quadratic model, for biogas yield were presented in Table 4. 149
Table 4 ANOVA for the response surface quadratic model for biogas yield 150
Source Sum of
df mean
F-value P-value significance
Corrected model 89595.2 9 12785.72 14.05 0.0001 **
x1 1317.90 1 1317.90 1.86 0.2025
x2 5978.02 1 5978.02 8.44 0.0157 *
x3 5664.40 1 5664.40 7.99 0.0179 *
x1x2 50 1 50 0.07 0.7959
x1x3 45.125 1 45.125 0.06 0.7959
x2x3 4723.92 1 4723.92 6.67 0.0273 *
x12 5070.78 1 5070.79 7.16 0.0233 *
x22 7319.46 1 7319.46 10.32 0.0093 **
x32 5653.44 1 5653.45 7.98 0.0180 *
Residual 7180.93 10 708.58
Lack of fit 4775.67 5 936.11 1.95 0.2413
Pure error 2405.26 5 481.05
Total 96681.00 19
SD 26.6192 R2 0.92671 pred- R2 0.6519
CV/% 13.5184 adj-R2 0.8607 Adeq
9.5565
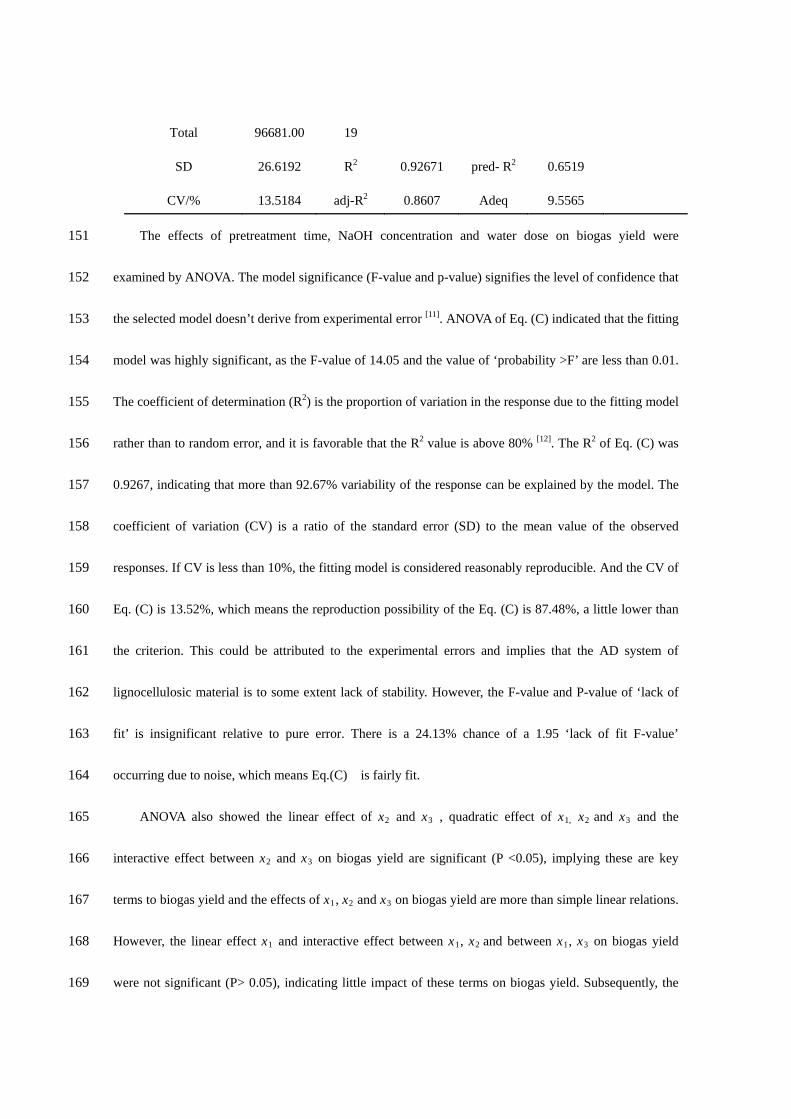
The effects of pretreatment time, NaOH concentration and water dose on biogas yield were 151
examined by ANOVA. The model significance (F-value and p-value) signifies the level of confidence that 152
the selected model doesn’t derive from experimental error [11]. ANOVA of Eq. (C) indicated that the fitting 153
model was highly significant, as the F-value of 14.05 and the value of ‘probability >F’ are less than 0.01. 154
The coefficient of determination (R2) is the proportion of variation in the response due to the fitting model 155
rather than to random error, and it is favorable that the R2 value is above 80% [12]. The R2 of Eq. (C) was 156
0.9267, indicating that more than 92.67% variability of the response can be explained by the model. The 157
coefficient of variation (CV) is a ratio of the standard error (SD) to the mean value of the observed 158
responses. If CV is less than 10%, the fitting model is considered reasonably reproducible. And the CV of 159
Eq. (C) is 13.52%, which means the reproduction possibility of the Eq. (C) is 87.48%, a little lower than 160
the criterion. This could be attributed to the experimental errors and implies that the AD system of 161
lignocellulosic material is to some extent lack of stability. However, the F-value and P-value of ‘lack of 162
fit’ is insignificant relative to pure error. There is a 24.13% chance of a 1.95 ‘lack of fit F-value’ 163
occurring due to noise, which means Eq.(C) is fairly fit. 164
ANOVA also showed the linear effect of x2 and x3 , quadratic effect of x1, x2 and x3 and the 165
interactive effect between x2 and x3 on biogas yield are significant (P <0.05), implying these are key 166
terms to biogas yield and the effects of x1, x2 and x3 on biogas yield are more than simple linear relations. 167
However, the linear effect x1 and interactive effect between x1, x2 and between x1, x3 on biogas yield 168
were not significant (P> 0.05), indicating little impact of these terms on biogas yield. Subsequently, the 169
valid terms of Eq. (C) are involving x2, x3, x2x3 and x12, x2
2, x32. And for improving the fitting model, Eq. 170
(C) can be reduced to Eq. (D) as below: 171
Y=-361.81+28.25x1+87.35x2+5.21x3-0.24x2x3-0.76x12-8.25x2
2-0.03x32 (D) 172
The F-value and P-value of the items and R2 indicated that Eq. (D) could describe the effect of 173
pretreatment time, NaOH concentration and water dose on the biogas yield of this study quite well. And 174
The pred-R2 was in reasonable agreement with the adj-R2. The adeq precision was 9.5565, which 175
measures the signal to noise ratio and it is desirable when greater than 4. The model could be used to 176
navigate the design space in every aspect. 177
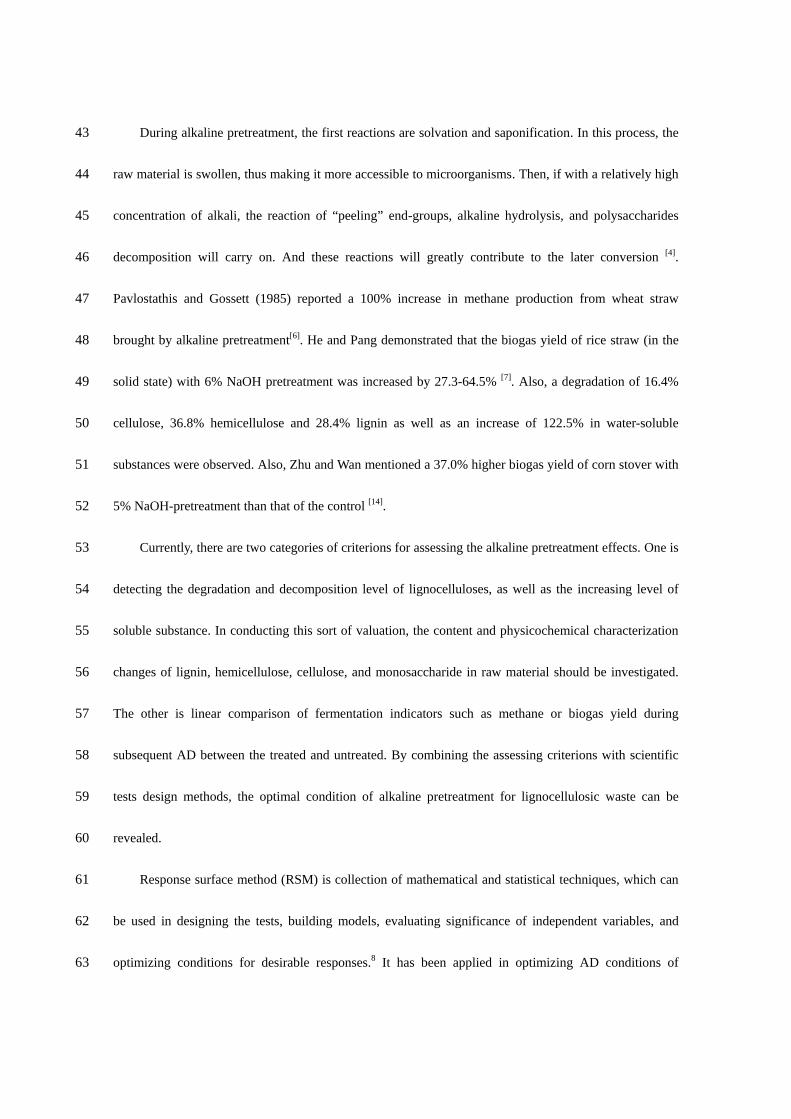
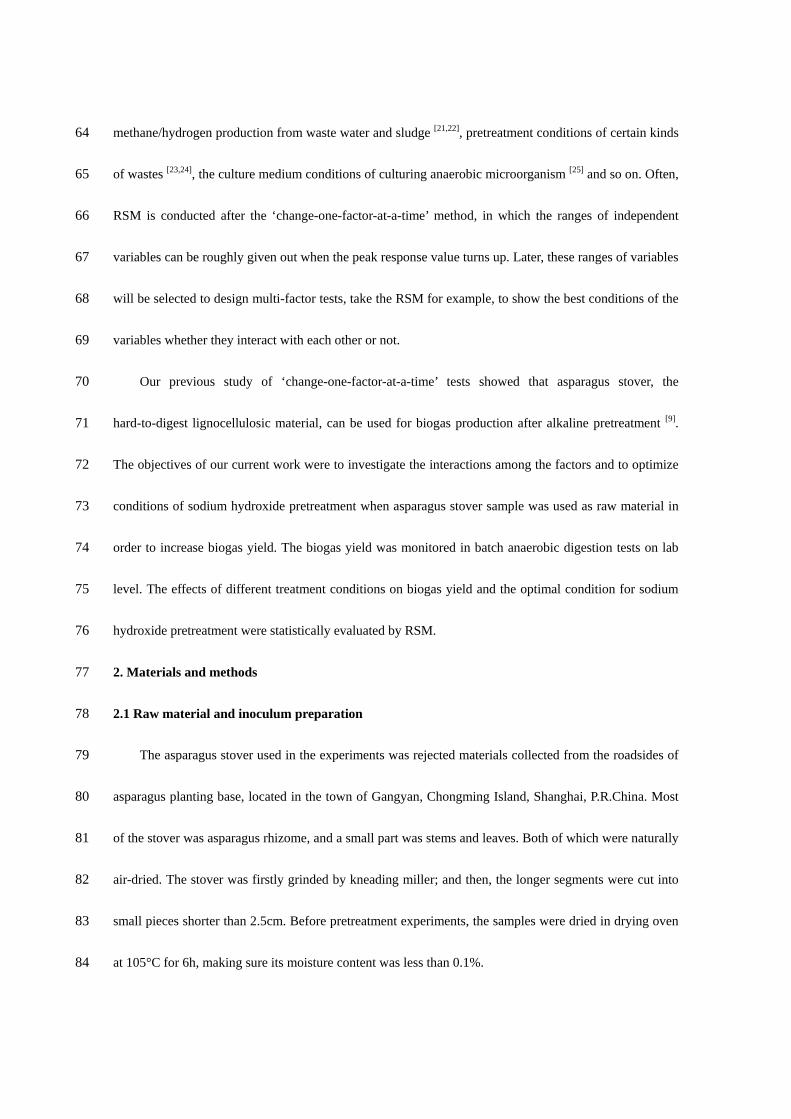
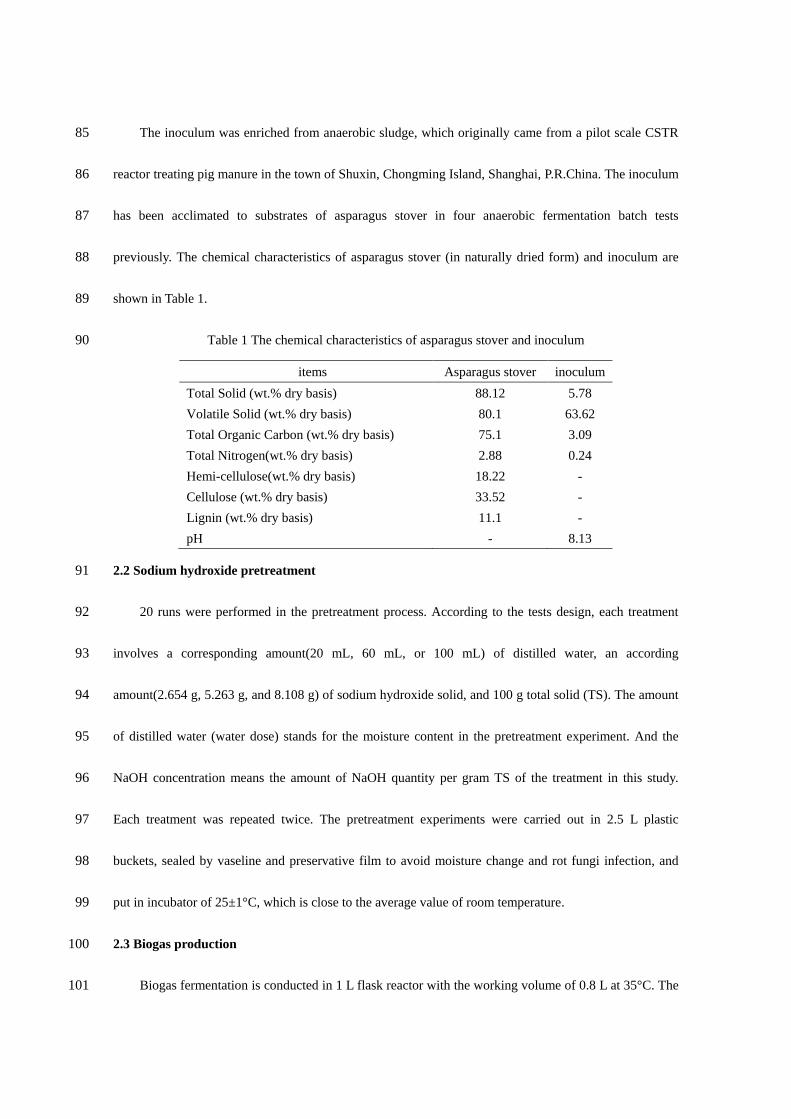
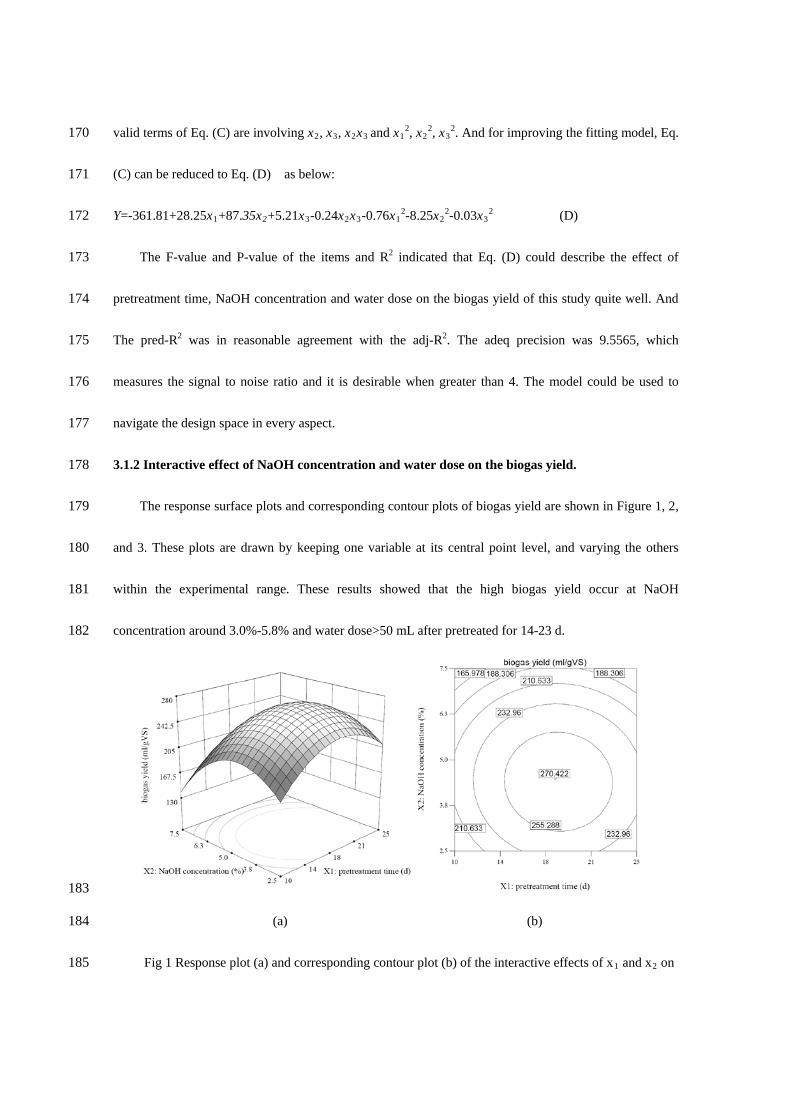
3.1.2 Interactive effect of NaOH concentration and water dose on the biogas yield. 178
The response surface plots and corresponding contour plots of biogas yield are shown in Figure 1, 2, 179
and 3. These plots are drawn by keeping one variable at its central point level, and varying the others 180
within the experimental range. These results showed that the high biogas yield occur at NaOH 181
concentration around 3.0%-5.8% and water dose>50 mL after pretreated for 14-23 d. 182
183
(a) (b) 184
Fig 1 Response plot (a) and corresponding contour plot (b) of the interactive effects of x1 and x2 on 185
biogas yield (fixed x3=60%) 186
187
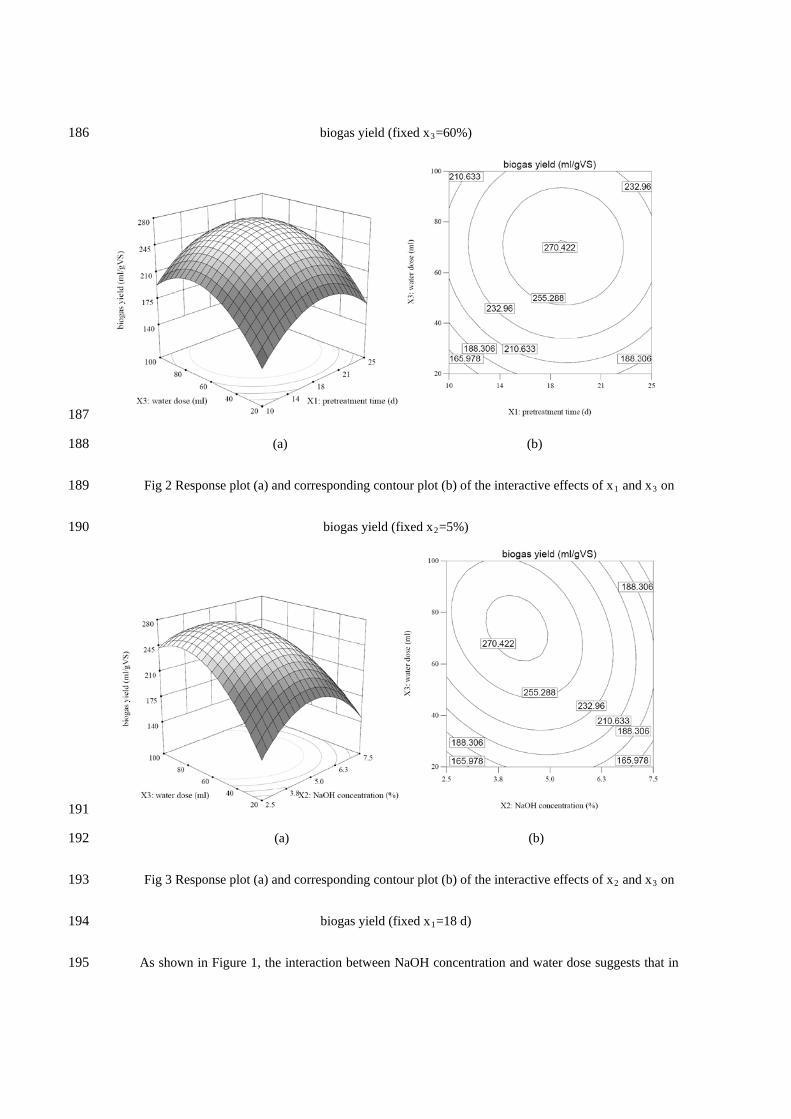
(a) (b) 188
Fig 2 Response plot (a) and corresponding contour plot (b) of the interactive effects of x1 and x3 on 189
biogas yield (fixed x2=5%) 190
191
(a) (b) 192
Fig 3 Response plot (a) and corresponding contour plot (b) of the interactive effects of x2 and x3 on 193
biogas yield (fixed x1=18 d) 194
As shown in Figure 1, the interaction between NaOH concentration and water dose suggests that in 195
order to obtain the maximum digestibility of the raw material, the NaOH concentration needed in 196
pretreatment system is different under different conditions of water dose, or vice versa. According to 197
Figure 1, at the low level of water dose, the biogas yield was considerably low and it increased first and 198
then decreased with the increased NaOH concentration from 2.5% to 7.5% slightly. But at the high level 199
of water dose, a considerable high biogas yield could be achieved under a relatively low level of NaOH 200
concentration. Besides, with such water dose, high dosage of NaOH reduced the biogas production 201
potential during AD. This may be due to the reasons that high NaOH dosage would inhibit AD because 202
over-high Na+ level would do harm to microorganisms by disturbing their osmotic pressure balances [26]. 203
Similarly, an increase in water dose at the low NaOH concentration led to a distinct increase in biogas 204
yield, whereas the increase of biogas yield at the high NaOH concentration was inferior to the former. 205
Therefore, it could be seen that besides alkaline action on lignocelluloses degradation, H2O in the 206
pretreatment system also had positive effect on improving digestibility of lignocelluloses and thereby 207
improving biogas yield. It is unfavorable for pretreating procedure if moisture content is deficient. 208
Sufficient moisture content in pretreatment system would save the alkaline dosage and achieve the similar 209
results for pretreatment and biogas production. In short, at low NaOH concentration, high water dose 210
resulted in more biogas yield; at high water dose, low NaOH concentration promoted biogas yield; high 211
NaOH concentration and low water dose would not benefit biogas yield. 212
3.2 Optimization analysis 213
For NaOH pretreatment-AD systems, biogas yield is the main target to be maximized. The optimum 214
values of selected variables were determined as pretreatment time 19 d, NaOH concentration 4.2%, and 215
water dose 74 g by regression analysis, which gave rise to maximum biogas yield of 275.65 mL/g VS and 216
desirability of 0.874. The NaOH concentration in this study was agreeable with previous studies. Many 217
literatures reported that 2%~7.5% NaOH concentration is beneficial for lignocellulosic material to 218
decompose [7,13,14], though most raw materials used in previous studies belong to the grass family, such as 219
rice, wheat and corn, while asparagus is a typical plant included in Asparagaceae. 220
Results in this study showed that RSM is effective in optimizing NaOH pretreatment conditions for 221
AD from asparagus stover. But the validity of the quadratic regression model by RSM was merely 222
amenable to the designed range of raw data. It could not be used universally to reckon biogas yield from 223
asparagus stover after NaOH pretreatment. So the scale-up tests determining pretreatment parameters 224
should be conducted in the further studies. 225
3.3 Verification test 226
In order to testify the validity of the fitting model and the authenticity of the set of optimized 227
parameters, verification tests were performed in triplicate according to the acquired optimization results 228
and the desirability functions. The test was carried out under pretreatment conditions of 19 d, 4.2% NaOH 229
concentration and 74 g water dose. 230
The lignocelluloses mass percentage content after pretreatment and biogas fermentation (w/w) were 231
shown in Table 5. Compared with naturally dried raw materials, in which lignocelluloses accounted for 232
62.84% total weight of the asparagus stover, the lignocelluloses content after pretreatment were merely 233
39.76%, which means lignocelluloses have been resolved into some soluble saccharide due to NaOH 234
pretreatment [15]. And after AD, this content turned out to be 76.19%, which could be attributed to that the 235
resolvable part of the substrate was converted into carbonic gases and volatile fatty acid [16]. Consequently, 236
the refractory part of the substrate left took a large weight percentage of the fermented asparagus stover. 237
Furthermore, lignin content after AD took nearly 45% percentage of the total lignocelluloses weight, 238
while this percentage was only 17.66% in naturally dried asparagus stover and nearly 23% after NaOH 239
pretreatment. This phenomenon suggested that NaOH exert limited effect on lignin degradation and AD 240
could hardly utilize the under-degraded lignin, which could be supported by other authors’ studies [17]. 241
Furthermore, it is reported that the finite soluble part of lignin also would exhibit inhibitory effect on the 242
consequential biogas production [4]. 243
Table 5 The lignocelluloses mass percentage content after pretreatment and biogas fermentation 244
Items Hemi-cellulose
(wt.% dry basis)
Cellulose
(wt.% dry basis)
Lignin(ADL)
(wt.% dry basis)
After pretreatment 6.34 23.78 9.60
After AD 9.62 30.99 35.58
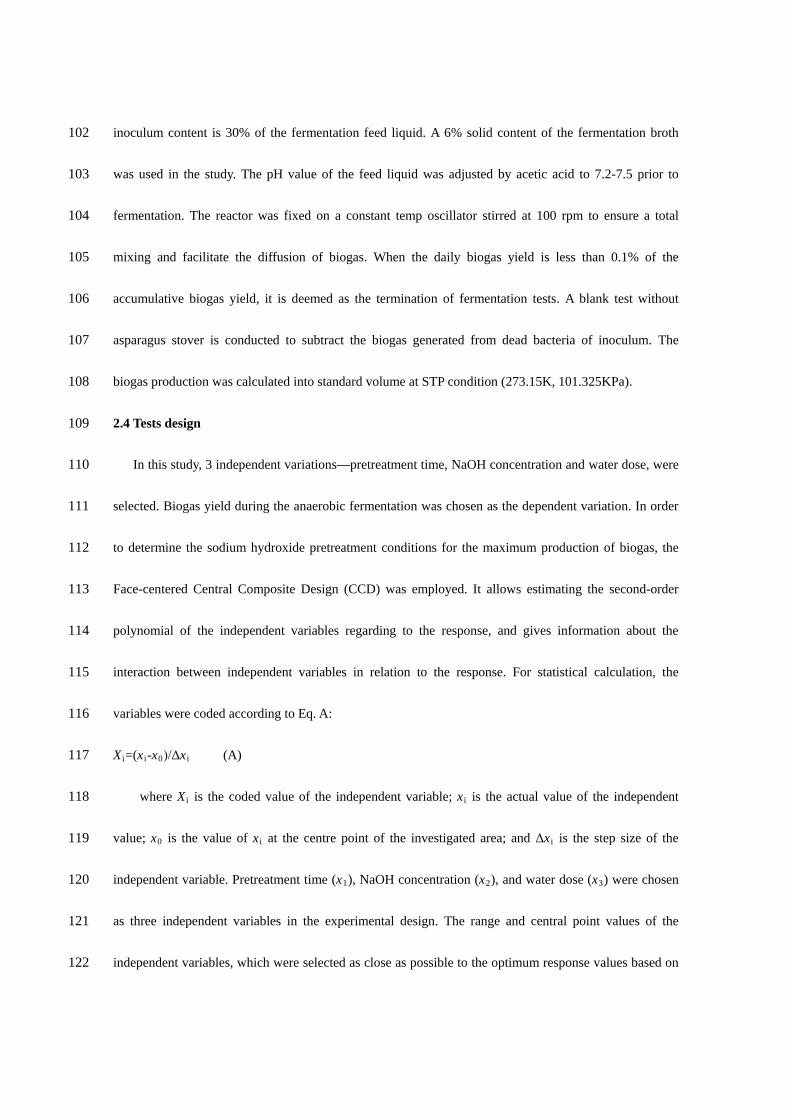
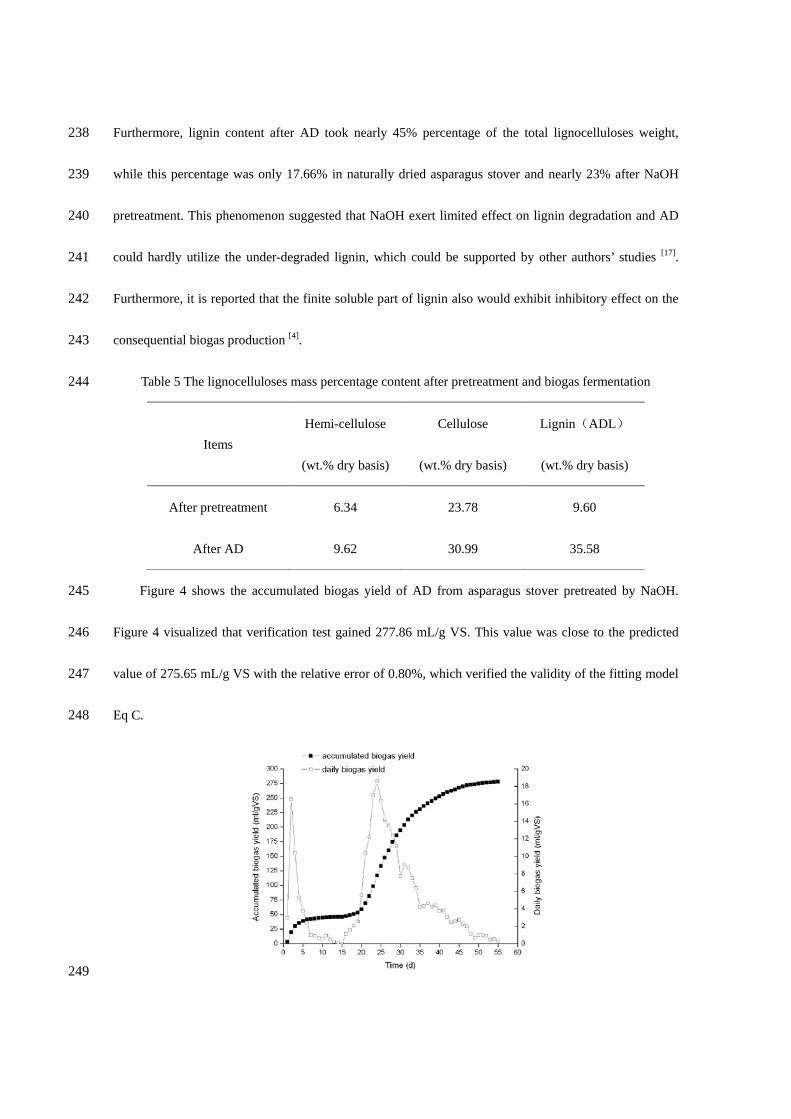
Figure 4 shows the accumulated biogas yield of AD from asparagus stover pretreated by NaOH. 245
Figure 4 visualized that verification test gained 277.86 mL/g VS. This value was close to the predicted 246
value of 275.65 mL/g VS with the relative error of 0.80%, which verified the validity of the fitting model 247
Eq C. 248
249
Fig 4 The daily and accumulated biogas yields of AD from asparagus stover pretreated by NaOH 250
Methane production from AD involves a series of five different groups of anaerobic microorganisms, 251
among which one group utilizes metabolic products of other groups and therefore they jointly form a food 252
web [18]. With CH4, CO2 and some trace gas as the final product, the mixture of microorganisms in AD 253
can theoretically realize entire degradation of organic waste, even including some inhibiting compounds 254
such as furfural and soluble lignin, if only they are not in too high concentration [4]. The complicated 255
metabolic reactions of the five different groups of anaerobic microorganisms can be divided into four 256
main stages, namely, hydrolysis, acidogenesis, acetogenesis and methanogenesis [19]. 257
In the hydrolysis stage, macromolecules are decomposed into oligomers and monomers, typically 258
including monosaccharide from polysaccharide, amino acid from protein, glycerol and fatty acid from 259
lipid and so on. As the metabolism carrying on, these oligomers and monomers are converted into volatile 260
products like propionate, butyrate, ethanol, etc. Since most of these products are classified as volatile fatty 261
acid (VFA), which may cause the pH value of the fermentation broth dropped sharply, the second stage is 262
called acidogenesis. During the third stage, acetate is generated in great amount, which will account for 263
more than 80% of the VFA in the fermentation broth [20]. Simultaneously, hydrogen is generated as an 264
important metabolic intermediate which is one of the substrates to form the final products CH4 in the last 265
stage of methanogenesis, otherwise to form H2 due to pH value or heat inhibition, in an occasion that 266
methane producing procedure is interrupted. When the process comes to methanogenesis, the formation 267
of methane and carbon dioxide are taking place, and little bubbles can be observed in the fermentation 268
liquid. 269
In this study, during fermentation, the second period of rapid biogas production proceeded about 15 270
days after the first period of rapid biogas production. Both of which were characterized by a 271
comparatively greater slope of the accumulated biogas yield curve. In the time slot between the two 272
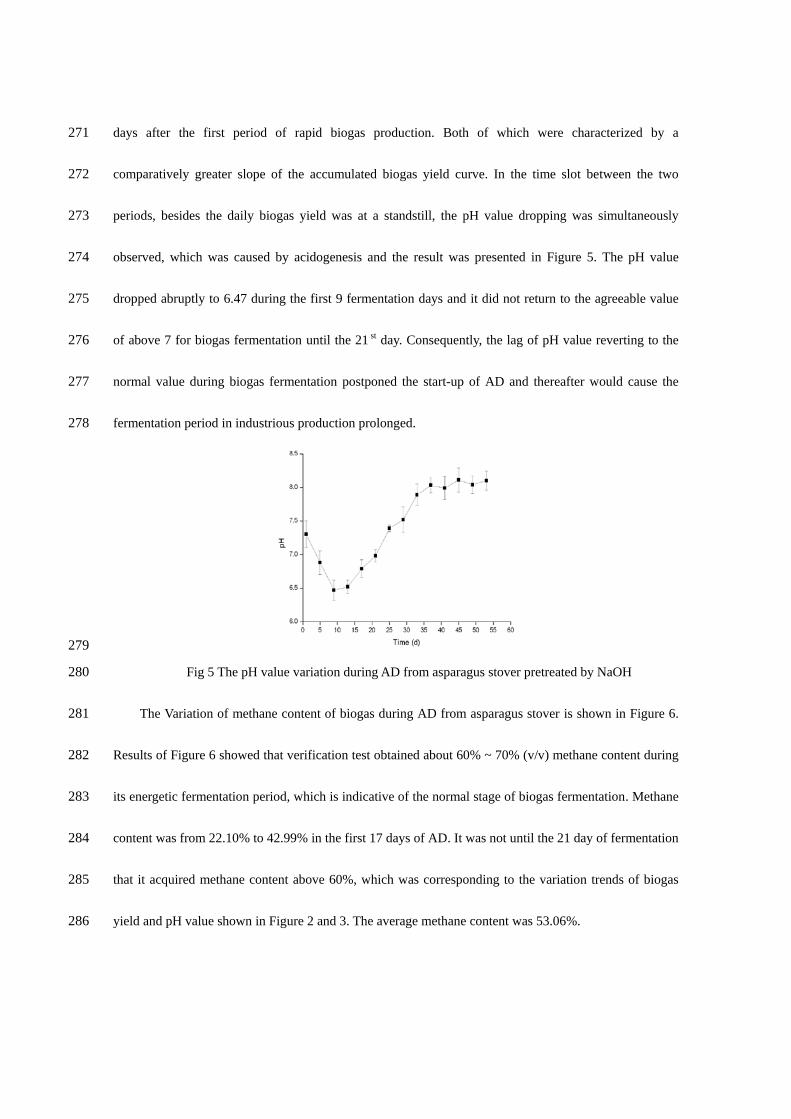
periods, besides the daily biogas yield was at a standstill, the pH value dropping was simultaneously 273
observed, which was caused by acidogenesis and the result was presented in Figure 5. The pH value 274
dropped abruptly to 6.47 during the first 9 fermentation days and it did not return to the agreeable value 275
of above 7 for biogas fermentation until the 21 st day. Consequently, the lag of pH value reverting to the 276
normal value during biogas fermentation postponed the start-up of AD and thereafter would cause the 277
fermentation period in industrious production prolonged. 278
279
Fig 5 The pH value variation during AD from asparagus stover pretreated by NaOH 280
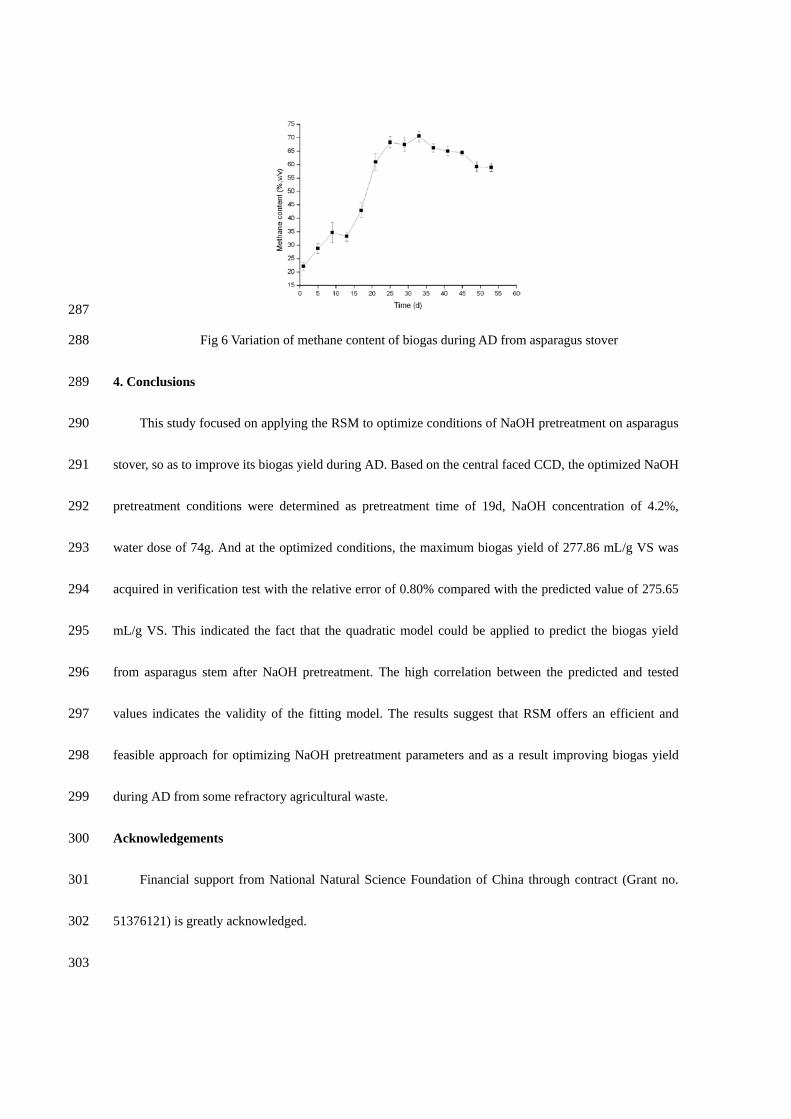
The Variation of methane content of biogas during AD from asparagus stover is shown in Figure 6. 281
Results of Figure 6 showed that verification test obtained about 60% ~ 70% (v/v) methane content during 282
its energetic fermentation period, which is indicative of the normal stage of biogas fermentation. Methane 283
content was from 22.10% to 42.99% in the first 17 days of AD. It was not until the 21 day of fermentation 284
that it acquired methane content above 60%, which was corresponding to the variation trends of biogas 285
yield and pH value shown in Figure 2 and 3. The average methane content was 53.06%. 286
287
Fig 6 Variation of methane content of biogas during AD from asparagus stover 288
4. Conclusions 289
This study focused on applying the RSM to optimize conditions of NaOH pretreatment on asparagus 290
stover, so as to improve its biogas yield during AD. Based on the central faced CCD, the optimized NaOH 291
pretreatment conditions were determined as pretreatment time of 19d, NaOH concentration of 4.2%, 292
water dose of 74g. And at the optimized conditions, the maximum biogas yield of 277.86 mL/g VS was 293
acquired in verification test with the relative error of 0.80% compared with the predicted value of 275.65 294
mL/g VS. This indicated the fact that the quadratic model could be applied to predict the biogas yield 295
from asparagus stem after NaOH pretreatment. The high correlation between the predicted and tested 296
values indicates the validity of the fitting model. The results suggest that RSM offers an efficient and 297
feasible approach for optimizing NaOH pretreatment parameters and as a result improving biogas yield 298
during AD from some refractory agricultural waste. 299
Acknowledgements 300
Financial support from National Natural Science Foundation of China through contract (Grant no. 301
51376121) is greatly acknowledged. 302
303
References 304
[1] Yu Chen, Gaihe Yang , Sandra Sweeney, Yongzhong Feng. Household biogas use in rural China: A 305
study of opportunities and constraints. Renew Sust Energ Rev 2010; 14: 545–549. 306
[2] Ministry of Agriculture. China’s rural biogas project planning (2006–2010).Beijing: Science and 307
Technology Education Department of Ministry of Agriculture 2007 [in Chinese]. 308
[3] H. Katuwal, A.K. Bohara. Biogas: A promising renewable technology and its impact on rural 309
households in Nepal. Renew Sust Energ Rev 2009; 13: 2668-2674. 310
[4] A.T.W.M. Hendriks,G. Zeeman. Pretreatments to enhance the digestibility of lignocellulosic biomass. 311
Bioresource Technol 2009; 100: 10–18. 312
[5] Lin Yunqin,Wang Dehan,Wu Shaoquan,Wang Chunmin. Alkali pretreatment enhances biogas 313
production in the anaerobic digestion of pulp and paper sludge J Hazard Mater 2009;170: 366–373. 314
[6] Spyros G. Pavlostathis, James M. Gossett. Alkaline treatment of wheat straw for increasing anaerobic 315
biodegradability. Biotechnol Bioeng 1985; 27: 334–344. 316
[7] Yanfeng He, Yunzhi Pang, Physicochemical Characterization of Rice Straw Pretreated with Sodium 317
Hydroxide in the Solid State for Enhancing Biogas Production. Energ Fuel 2008: 22 (4): 2775–2781. 318
[8] Draper N, John JA. Response-surface designs for quantitative and qualitative variables. Technometrics 319
1988; 30(4):423–8. 320
[9] Sun Chen, Liu Ronghou, Q in Guodong. Experiments on Pretreatment and Anaerobic Digestion of 321
Asparagus Stalk for Biogas Production. Trans CSAM 2010; 8(41): 1000-1298. [in Chinese] 322
[10] Goering, H.K., van Soest, P.J., 1970. Forage Fiber Analysis (Apparatus, Reagents, Procedures, and 323
Some Applications). Agricultural Handbook, No. 379. United States Department of Agriculture, 324
Washington, DC. 325
[11] Khuri AI, Cornell JA. Response surface design and analyses. New York: Marcel Dekker Inc; 1987. 326
[12] Oglekar AM, May AT. Product excellence through design of experiments. Cereal Food World 1987; 327
32: 857–68. 328
[13] Mingxia Zheng, Xiujin Li, Laiqing Li, Xiaojin Yang, Yanfeng He. Enhancing anaerobic 329
biogasification of corn stover through wet state NaOH pretreatment. Bioresource Technol 2009; 100: 330
5140-5145. 331
[14] Jiying Zhu, Caixia Wan, Yebo Li. Enhanced solid-state anaerobic digestion of corn stover by alkaline 332
pretreatment. Bioresource Technol 2010; 101(19):7523-7528. 333
[15] B. Xiao, X.F. Suna, RunCang Sun. Chemical, structural, and thermal characterizations of 334
alkali-soluble lignins and hemicelluloses, and cellulose from maize stems, rye straw, and rice straw. 335
Polym Degrad Stabil 2001; 74 :307–319. 336
[16] H. N. Chanakya, R. Venkatsubramaniyam, Jayant Modak. Fermentation and methanogenic 337
characteristics of leafy biomass feedstocks in a solid phase biogas fermentor. Bioresource Technol 2001; 338
62: 71-78. 339
[17] Ewa Klimiuk, Tomasz Pokój, Wojciech Budzyn ski, Bogdan Dubis. Theoretical and observed biogas 340
production from plant biomass of different fibre contents. Bioresource Technol 2010; 101: 9527–9535. 341
[18] McCarty, P.L.1964.Anaerobic waste treatment fundamentals. Public works, 1964. 342
[19] O.M. Pakarinen, H.P. Tähti, J.A. Rintala. One-stage H2 and CH4 and two-stage H2+CH4 production 343
from grass silage and from solid and liquid fractions of NaOH pre-treated grass silage. Biomass Bioenerg 344
2009; 33: 1419 – 1427. 345
[20] Alastair J. Ward, Phil J. Hobbs, Peter J. Holliman, David L. Jones. Optimisation of the anaerobic 346
digestion of agricultural resources. Bioresource Technol 2008; 99: 7928–7940. 347
[21] A.A.L. Zinatizadeh, A.R. Mohamed, A.Z. Abdullah, M.D. Mashitah, M. Hasnain Isa, G.D. Najafpour 348
Process modeling and analysis of palm oil mill effluent treatment in an up-flow anaerobic sludge fixed 349
film bioreactor using response surface methodology (RSM) . Water Res 2006; 17(40): 3193-3208. 350
[22] Jianlong Wang, Wei Wan. Optimization of fermentative hydrogen production process by response 351
surface methodology. Int J Hydrogen Energ 2008; 33: 6976 – 6984. 352
[23] Marimuthu Jeya, Ye-Wang Zhang, In-Won Kim, Jung-Kul Lee. Enhanced saccharification of 353
alkali-treated rice straw by cellulase from Trametes hirsuta and statistical optimization of hydrolysis 354
conditions by RSM. Bioresource Technol 2009; 100: 5155-5161. 355
[24] N. Bhaskar, N.S. Mahendrakar. Protein hydrolysate from visceral waste proteins of Catla (Catla 356
catla): Optimization of hydrolysis conditions for a commercial neutral protease. Bioresource Technol 357
2008; 10(99): 4105-4111. 358
[25] Zhen-Hu Hu, Han-Qing Yu, Jia-Chuan Zheng. Application of response surface methodology for 359
optimization of acidogenesis of cattail by rumen cultures. Bioresource Technol 2006; 97: 2103-2109. 360
[26] Ye Chen, Jay J. Cheng, Kurt S. Creamer. Inhibition of anaerobic digestion process: A review. 361
Bioresource Technol 2008; 99: 4044-4064. 362