Embed Size (px)
Citation preview
7/23/2019 Chernenko, Nadia. The Russian Electricity Supply Industry. From Reform to Reform_October 2013
http://slidepdf.com/reader/full/chernenko-nadia-the-russian-electricity-supply-industry-from-reform-to-reformoctober 1/66
UNIVERSITY OF
CAMBRIDGE
Cambridge WorkingPapers in Economics
The Russian Electricity Supply Industry:
from Reform to Reform?
Nadia Chernenko
CWPE 1342 & EPRG 1319
7/23/2019 Chernenko, Nadia. The Russian Electricity Supply Industry. From Reform to Reform_October 2013
http://slidepdf.com/reader/full/chernenko-nadia-the-russian-electricity-supply-industry-from-reform-to-reformoctober 2/66
The Russian Electricity Supply Industry: from
Reform to Reform?
Nadia Chernenko
October 2013
CWPE 1342 & EPRG 1319
7/23/2019 Chernenko, Nadia. The Russian Electricity Supply Industry. From Reform to Reform_October 2013
http://slidepdf.com/reader/full/chernenko-nadia-the-russian-electricity-supply-industry-from-reform-to-reformoctober 3/66
www.eprg.group.cam.ac.uk
The Russian electricity supply industry:from reform to reform?
EPRG Working Paper 1319
Cambridge Working Paper in Economics -
Nadia Chernenko
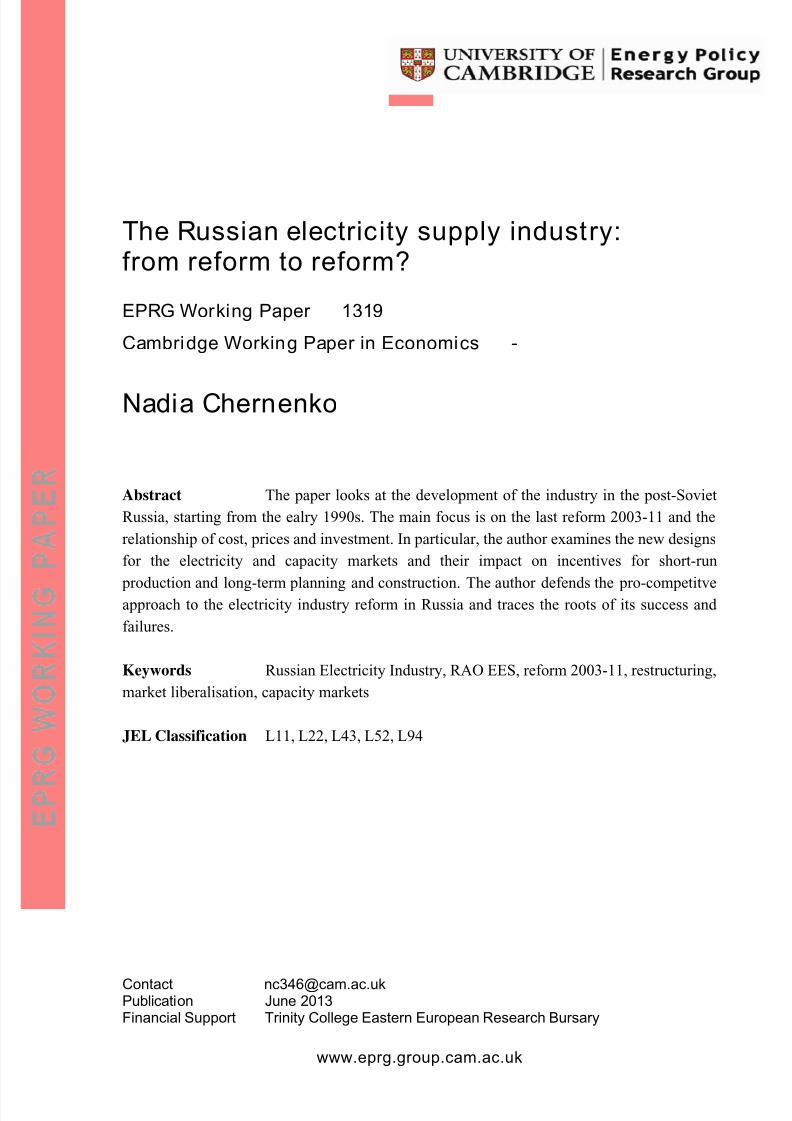
Abstract The paper looks at the development of the industry in the post-Soviet
Russia, starting from the ealry 1990s. The main focus is on the last reform 2003-11 and the
relationship of cost, prices and investment. In particular, the author examines the new designs
for the electricity and capacity markets and their impact on incentives for short-run
production and long-term planning and construction. The author defends the pro-competitveapproach to the electricity industry reform in Russia and traces the roots of its success and
failures.
Keywords Russian Electricity Industry, RAO EES, reform 2003-11, restructuring,
market liberalisation, capacity markets
JEL Classification L11, L22, L43, L52, L94
Contact [email protected] June 2013Financial Support Trinity College Eastern European Research Bursary
7/23/2019 Chernenko, Nadia. The Russian Electricity Supply Industry. From Reform to Reform_October 2013
http://slidepdf.com/reader/full/chernenko-nadia-the-russian-electricity-supply-industry-from-reform-to-reformoctober 4/66
EPRG 1319
1
The Russian electricity supply industry:
from reform to reform?
1. Introduction
The modern Russian electricity supply industry (ESI) has undergone a series of radical
transformations in the last twenty years, yet its written history remains fragmented and
scattered among relatively few sources and research publications. Many other reforms around
the world have been studied extensively and then summarised, for example by Sioshansi and
Pfaffenberger (2006)1.The Russian case consists essentially of two reforms: transformation
from a planned system into a state-owned monopoly in the early 1990s, followed bymonopoly restructuring, together with market liberalisation, in 2003-11. The first reform
consisted mostly of emergency measures in a fast-transforming environment and was
therefore very unlikely to produce satisfactory results. By contrast, the second reform relied
extensively on international experience and reform templates, and appears to have created a
sensible industry structure and reasonable market design, although further policy decisions
may have undermined some of the early-stage achievements. The key message that the second
reform of the Russian ESI can offer to international observers is that restructuring and market
liberalisation of a large-scale industry is feasible from both economic and political
perspectives.
In the early 1990s, the Soviet electricity system was replaced by a vertically integrated
monopoly. The new industry structure and market design led to inefficient decisions in
production schedules and dispatching. The overall economic decline in the economy
negatively affected the financial performance of the ESI. Eventually growing general
dissatisfaction with the situation paved the way to a new reform: the preparatory stage
included heated public debates, with reference to the Soviet experience and contemporary
examples of ESI reforms around the world. The choice was made in favour of competitive
markets for generation and retail supply, combined with natural monopolies for transmission
and dispatch. The unbundling of the monopoly was undertaken in 2004-8, and the electricity
1
The most recent volume by Sioshansi and Pfaffenberger (2013) also has a chapter on Russia
7/23/2019 Chernenko, Nadia. The Russian Electricity Supply Industry. From Reform to Reform_October 2013
http://slidepdf.com/reader/full/chernenko-nadia-the-russian-electricity-supply-industry-from-reform-to-reformoctober 5/66
EPRG 1319
2
markets were liberalised from January 2011. The main events of the Russian ESI
development are listed in the appendix and discussed further in the paper.
International experience already comprises a mass of ESI reforms, starting with the
pioneering reform in Chile in 1982 and the now-textbook example of the reform in Englandand Wales in 1989. A reform typically consists of industry restructuring and market
liberalisation, with varying degrees of advancement in an attempt, e.g., to overcome the
inefficiency of the incumbent utility provider or to attract new investment. The California
electricity market crisis in 1999-2000 demonstrated major reform failure at large financial
cost, the roots and policy response of which have been widely studied (Borenstein et al.,
2002; Wolak 2003).
While ESI reforms in most other countries, or markets, have been well-documented and
examined, a review of the literature on the Russian ESI reveals the scarcity of research in this
area. The number of papers published by international experts and institutions is quite limited,
which could be partly explained by the language barrier. What is less expected is that the
amount of ‘domestic’ research (i.e. in Russian) is also quite small2. Currently, there are two
major strands of research: the first set of papers deals with the history of the industry in the
1990s, up to the recent reform; the second set of works examines the reform and its
consequences.
Early reports by the International Energy Agency (1993, 1995) and somewhat later by the
World Bank (1999) reviewed the Russian energy sector at the time, while Opitz (2000)
provided an interim picture between the two reforms. To our knowledge, there has not yet
been any work in Russian on the same period, so the international reviews sometimes serve as
the only source of information, especially on the early 1990s.
The preparation for the second reform received much attention from the IEA (2003, 2005), as
well as independent researchers (Yi-Chong 2001; Kennedy 2003; Tompson 2004). After the
reform was largely completed, a few papers presented brief summaries of the modern market
structure3. Later works by Solanko (2011) and Gore et al. (2012) discuss in greater detail the
2 Solanko (2011) makes a similar observation, p. 16: “Given its magnitude and its relative success in attractingthe necessary new investments, the reform has attracted surprisingly little attention both in domestic politicaldiscussions and in the international community”.3
See, for example, Oksanen et al. (2009) or Doeh et al (2009).
7/23/2019 Chernenko, Nadia. The Russian Electricity Supply Industry. From Reform to Reform_October 2013
http://slidepdf.com/reader/full/chernenko-nadia-the-russian-electricity-supply-industry-from-reform-to-reformoctober 6/66
EPRG 1319
3
outcomes of the reform, with a focus on the new industry structure and market design, in
particular the design of the capacity markets.
It appears that no work has yet attempted to link the two historic periods of the industry. The
present paper aims at comparing the main components of the last reform with the changes inthe 1990s, in order to outline successful steps and persistent problems that still need to be
addressed. The paper is organised as follows: the next section provides a summary of the
reforms with a focus on the main components; section 3 presents comparative statistics for the
Russian electricity industry versus other national jurisdictions; section 4 deals with the
development of the industry in the 1990s; section 5 outlines the problems that accumulated;
sections 6 and 7 discuss the 2003 reform, with section 7 focussing specifically on the
investment and capacity mechanism; the final section concludes.
2. Reforming an ESI – international theory and practice
Increasing efficiency is the broad aim of electricity industry reform. Theoretically, moving
away from a monopoly to a pure competitive market is the best way to reduce prices, increase
output and eliminate deadweight loss. Therefore, the key principle of electricity industry
reform is to introduce competition where possible, i.e. in generation and retail supply, and
maintain regulation where competition is not feasible, i.e. in transmission and distribution.
This implies restructuring the industry, designing markets for competitive sectors and
developing regulation for the non-competitive sector.
International experience and lessons to be learned are well summarised in many sources.
General reviews can be found, e.g. in Littlechild (2006), Joskow (2006) or in a more recent
paper by Pollitt (2012). A summary of various reforms around the world at the time was
presented by Newbery (2003) while Pollitt (2009) looked at the European countries only.
A comprehensive list of steps for a successful reform can be broadly grouped into the
following blocks4:
Restructuring: separating generation, distribution and retail; creating a sufficient number of
generation and retail companies; creating an independent system operator;
4
We do not discuss here environmental policy, e.g. support for renewable energy sources or emission tradingschemes. These issues were raised later, when most competitive electricity markets were already in operation.
7/23/2019 Chernenko, Nadia. The Russian Electricity Supply Industry. From Reform to Reform_October 2013
http://slidepdf.com/reader/full/chernenko-nadia-the-russian-electricity-supply-industry-from-reform-to-reformoctober 7/66
EPRG 1319
4
Market design: markets for electricity, ancillary services and (sometimes) capacity, markets
for contracts, spot pool/exchange and financial markets; wholesale and retail markets,
geographical zoning, rules for price determination, interaction between different markets;
Regulation: creating an independent regulatory authority; regulation of transmission anddistribution, including transmission charges and rules for accessing the grid; regulation of
generators and markets, if necessary (e.g. price caps).
The move from a regulated industry to a market-based one requires its own ‘road map’ and
must be designed together with the main reform. The post-reform period inevitably has its
own problems and issues to solve and requires an additional set of policies, or ‘reform of the
reform’. Various electricity market reforms show that a complex approach to reform is more
convincing. Partial or poor implementation of some measures is more likely to lead to the
reform failing.
The developing state of the economy complicates the design of any reform and may increase
the risk of failure (at any stage), but it should not be regarded as an insurmountable obstacle
to the reform per se. A developing country is likely to implement extra reforms that
specifically address the developing character of the industry or economy. Measures might
include improving the technical performance of the industry (e.g. developing the distribution
network to reduce losses and increase connectivity), re-structuring upstream fuel markets (e.g.
developing competition or improving fuel price regulation) or developing financial markets
(e.g. for better and cheaper access to capital).
Restructuring
Good restructuring helps avoid many problems with competition once the reform is
completed. A good industry structure would involve a sensible number of generation and
retail companies that are not associated in any way with each other or with distributioncompanies through, for example, common owners. Newly created companies should not have
significant asset concentration in a particular area, in order to minimise the risk of local
market power, nor should one company have a technological advantage over its competitors
(e.g. having only newer or more efficient plants).
A small number of generation companies creates obvious problems for competition and may
lead to market power abuse. The early part of the reform in England and Wales in the 1990s
gives a prime example: two generation companies created in the initial stages, National Power
7/23/2019 Chernenko, Nadia. The Russian Electricity Supply Industry. From Reform to Reform_October 2013
http://slidepdf.com/reader/full/chernenko-nadia-the-russian-electricity-supply-industry-from-reform-to-reformoctober 8/66
EPRG 1319
5
and PowerGen, appeared to have manipulated prices and consequently were subject to price
caps and compulsory divestiture. Experience shows that it is important not only to create a
reasonable number of companies, but also to sustain mergers and acquisitions, which end up
inevitably being proposed.
Maintaining links between a generator and distribution company (e.g. via a common holding
company as in Chile) prevents fair access for other generation companies to the network or
fair access for customers to generators other than those affiliated with the distribution. Links
between a generator and retail supplier might create some economy of scale, although this
should not compromise competition, either in the generation sector or the retail sector 5.
In Russia, the first reform of the 1990s was implemented with much haste, and a vertically
integrated monopoly was established, in order to maintain state control of the industry. The
second reform took a pro-competitive approach so that many generation companies (above 20
in total) were created in lieu of the former monopoly. The new companies were endowed with
assets in such a way as to ensure equal starting positions, but also to avoid local market
power.
Creating an independent system operator is usually never a disputed choice. However, the
first Russian reform shows (as section 4.3 discusses) what happens when the dominating
vertically-integrated utility, which competes with smaller independent power producers (IPP),
is in charge of the dispatch operation. The result was the inefficient dispatch from the utility
provider’s power plants, which often had higher production costs than the power plants of the
IPPs.
In addition to reform of the electricity industry, changes might be required in fuel supply
markets. In the UK, British Gas was privatised prior to the electricity industry reform in
England and Wales, but the regulators still had to deal with the inefficient coal industry.
Chile, after the main industry reform was completed, experienced problems with gas supply
from Argentina, on which it was dependent. The Russian case is probably one of the most
difficult, as the gas supply industry is still a public monopoly and the gas tariffs appear to be
greatly distorted in comparison with European gas prices.
Market design
5
Joskow (2006) “Introduction to Electricity Sector Liberalization: Lessons Learned from Cross-Country Studies” p. 27. (In Sioshansi and Pfaffenberger, 2006)
7/23/2019 Chernenko, Nadia. The Russian Electricity Supply Industry. From Reform to Reform_October 2013
http://slidepdf.com/reader/full/chernenko-nadia-the-russian-electricity-supply-industry-from-reform-to-reformoctober 9/66
EPRG 1319
6
Market zoning provides a basis for price determination and the pricing of transmission
congestion. A relatively compact country with a developed network may have a single zone
and consequently a single market price. When a transmission constraint is binding, extra
generation or load shedding is paid for separately. If there are multiple zones, these can be
geographically fixed (Sweden and Finland) or dynamic (Norway); they may be time-
permanent or arise only during congestion. Locational or nodal pricing is a limiting case of
multi-zoning and is implemented in the Pennsylvania-New Jersey-Maryland (PJM) market
and the post-reform Russian market. A price differential between any two nodes reflects the
transmission congestion cost and highlights potential bottlenecks in the grid.
The design of wholesale and retail markets represents two different tasks. Wholesale markets
are usually introduced at the start of the main reform and typically include contract markets,
day-ahead and spot-exchanges or pools to trade real-time imbalances. Contractual obligations
might be voluntary or compulsory (e.g. to mitigate potential market power abuse). Low
contractual cover (between generators and the retail supplier), hence higher incentives for
manipulating available capacity and spot prices, is deemed one of the main reasons for the
California electricity crisis 2000-01 (Borenstein et al., 2002).
To ensure smooth transition from a regulated industry to competitive markets, reformers
sometimes use vesting contracts (e.g. in England and Wales, or Spain) or require generators tosell forward some of their output. Russia used vesting (“regulatory”) contracts, although once
they expired, voluntary contracting did not expand and remained at a low level. Perhaps in
anticipation of this and to curb potential price manipulation, the government introduced a
bidding code and required the companies to bid at a variable cost. To solve the “missing
money” problem6, a capacity market was put in place, but, as we discuss in section 7, it is
subject to heavy regulation.
The design of retail markets is a more sensitive issue, as it concerns, at its fullest extent, any
private household. Some jurisdictions (e.g. in England and Wales, the Nordic countries, parts
of Australia) eventually open up the retail market to any final consumer; others limit the retail
market to small commercial customers and maintain price regulation in the residential sector
(as it is currently implemented in Russia). In the latter case, great care is needed to design the
retail tariffs in order that they should match (somehow) liberalised wholesale prices.
6 The “missing money” problem arises when the market operates as a uniform price auction and requires bidding
at a variable cost so that the marginal, or peaking, plant earns just enough revenue to cover its variable cost andnothing to cover its fixed cost.
7/23/2019 Chernenko, Nadia. The Russian Electricity Supply Industry. From Reform to Reform_October 2013
http://slidepdf.com/reader/full/chernenko-nadia-the-russian-electricity-supply-industry-from-reform-to-reformoctober 10/66
EPRG 1319
7
Wholesale markets can trade only energy (Hogan 2005) or electricity and capacity separately
(Crampton 2005). Most electricity market reforms were conducted in industries with an
adequate reserve margin or excess spare capacity. As demand is growing and existing power
plants are ageing, the problem of adequate capacity becomes more and more serious. In all
probability, the key issue is not to separate traded commodities, but rather to create correct
price signals for investing in new capacity. An energy-only market relies on price spikes that
have a very short duration (e.g. only a few hours per year), but are politically and socially
unacceptable. Capacity trading is therefore a potential solution to the “missing money”
problem and seems an inevitable option for long-term development. Capacity markets are part
of some US markets, but are virtually absent in Europe (although capacity remuneration
mechanisms can be found in most European countries).
Regulation
Active regulation of the industry is inevitable, due to the presence of natural monopolies,
namely in transmission and distribution. Regulation can also apply to markets and specific
generators or suppliers, e.g. in the form of price caps or individualised tariffs. The very
absence of a regulatory authority can impede industry reform, as the German case
demonstrates. A regulator might be used to create suitable incentives or to support political
objectives. Whatever form of regulation is implemented, it has to be carefully analysed
against other alternatives in terms of social welfare.
Regulation of natural monopolies typically deals with transmission charges, rules for
connecting to the grid and network development. Transmission charges can be based on a
cost-plus methodology or performance-based schemes. The latter approach has the advantage
that it incentivises cost-saving and the use of better technology, and is implemented, by way
of example, in the UK. In a developing country, an incentive-based mechanism is perhaps a
better option, as it can be used to improve drastically the technical performance of thenetwork in a short period of time (e.g. to reduce losses) and, as such, to demonstrate the
benefits of reform.
Russia’s network and distribution grid has traditionally relied on cost-plus tariffs. As part of
the second reform, the cost-plus method was replaced with a regulatory-asset based (RAB)
approach, with the particular goal of helping the network and distribution companies to
finance extensive investment programmes of expansion and refurbishment. The RAB method
allows higher return rates on capital, but leads to higher transmission tariffs; the tariffs,
7/23/2019 Chernenko, Nadia. The Russian Electricity Supply Industry. From Reform to Reform_October 2013
http://slidepdf.com/reader/full/chernenko-nadia-the-russian-electricity-supply-industry-from-reform-to-reformoctober 11/66
EPRG 1319
8
however, are fixed for several years. Companies thus have a stronger incentive to complete
their investment programme sooner and lower the overall cost, while for consumers tariffs
actually decline in real terms over time (rather than being indexed against inflation, as in the
cost-plus method).
Network development typically follows a regulatory approach when decisions are made by
the transmission company and are approved by the regulator (in most countries, including
Russia). Two other schemes have also been developed: merchant interconnector lines (within
a single country) and the public contest method 7. Merchant interconnectors were built in
Australia, but the lines turned out to be less profitable than expected (due to a large entry in
the high-price area) and it was necessary to switch to a regulatory regime. The public contest
method used in Argentina specifies that the users who will directly benefit from a new line
pay for its construction; the method was carefully designed and proved to be efficient in
developing the transmission system.
In some instances, a regulator is required if a competitive market is not in put in place, e.g.
there is a single-buyer model instead of retail competition. The regulator then has to decide
how much energy to buy and at what price, given a certain forecast of energy consumption. A
mistake in future quantities and tariffs can be very costly to consumers and potentially to
regulators (not to mention political forces). In the USA, regulators, both the FERC and somestate regulatory authorities, only approve price agreements between a utility company and its
customers, rather than nominating tariffs.
When deciding on a suitable regulatory regime in the industry, developing countries might
require, first of all, the very establishment of a regulatory body, or the re-enforcement of an
existing one. Re-enforcement might mean independence from the government and stronger
authority in decision-making, better qualified staff and improvement of informational support.
7
Littlechild (2011) offers a detailed discussion of both models.
7/23/2019 Chernenko, Nadia. The Russian Electricity Supply Industry. From Reform to Reform_October 2013
http://slidepdf.com/reader/full/chernenko-nadia-the-russian-electricity-supply-industry-from-reform-to-reformoctober 12/66
EPRG 1319
9
3. Overview of the Russian ESI
This section provides a statistical summary of the industry, first providing data on the electric
efficiency of the Russian economy, together with international comparison, and then
discussing output/capacity relations and the development of the transmission system.
In general, the statistics reveals poor starting conditions of the economy and the industry. The
Russian economy was characterised by high energy efficiency as compare to other developing
countries or countries with similar northern climate. Price regulation in the industry was
inconsistent, with the regulated tariffs often below production cost. Even such low tariffs were
difficult to collect due to widespread non-payment of bills.
As a result of the economic decline and the inevitable decrease of the electricity demand, the
reserve margin in the industry was quite high which had two implications for investment
decisions. On one hand, the high reserves meant there was no need for new investment (which
could not be paid for anyway with low energy tariffs and the bills non-payment). On the other
hand, the economic revival that finally followed, coupled with ageing of the equipment,
meant that significant investment would be needed both in construction of new capacity and
in refurbishment of the existing power plants.
3.1.
Some (in)efficiency
measures
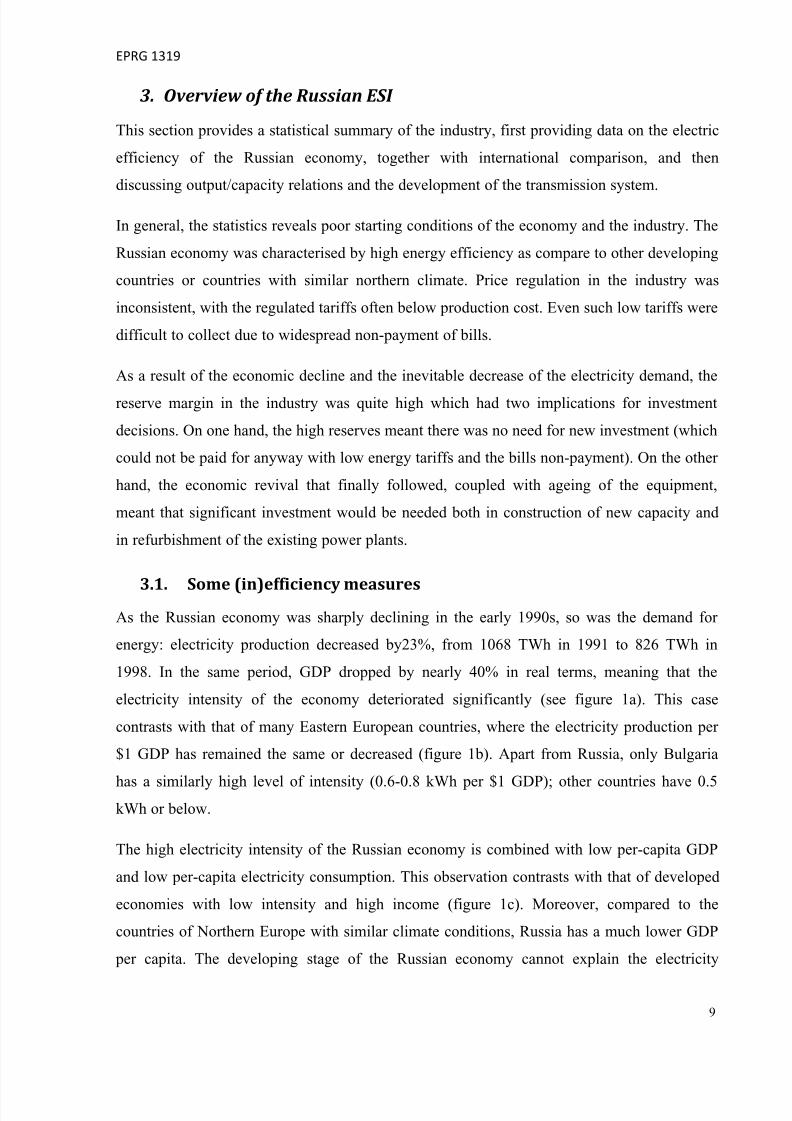
As the Russian economy was sharply declining in the early 1990s, so was the demand for
energy: electricity production decreased by23%, from 1068 TWh in 1991 to 826 TWh in
1998. In the same period, GDP dropped by nearly 40% in real terms, meaning that the
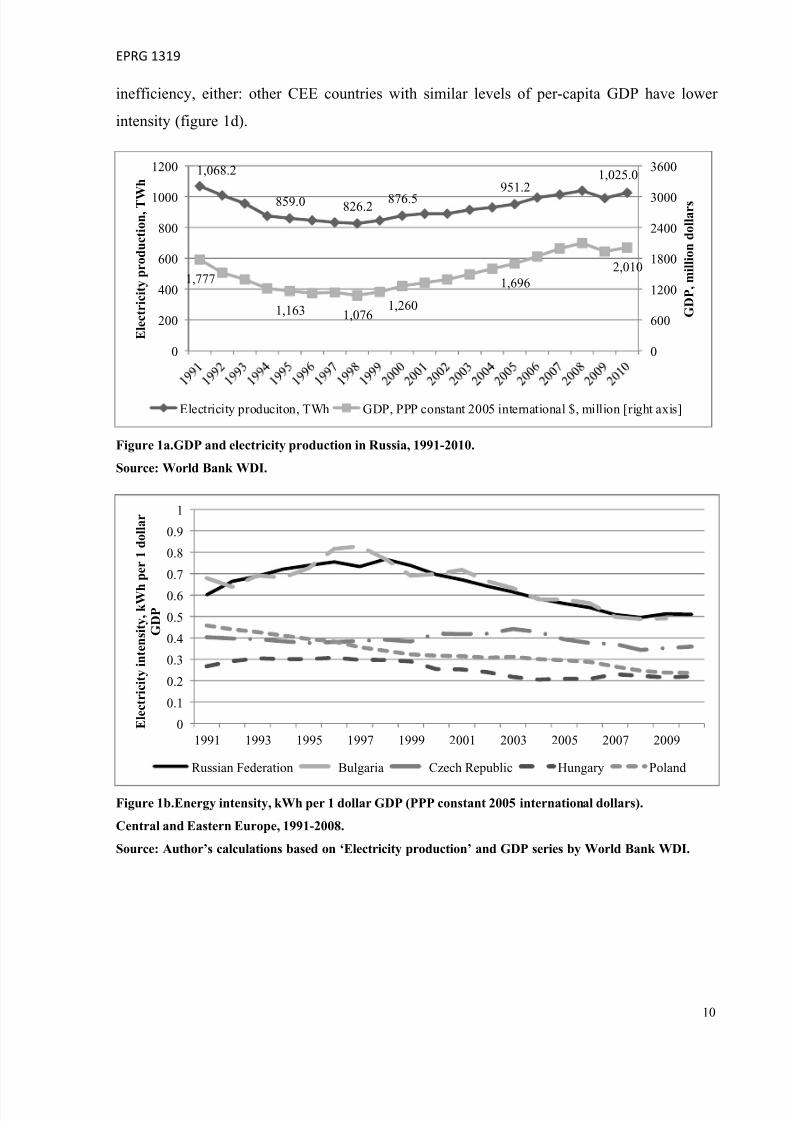
electricity intensity of the economy deteriorated significantly (see figure 1a). This case
contrasts with that of many Eastern European countries, where the electricity production per
$1 GDP has remained the same or decreased (figure 1b). Apart from Russia, only Bulgaria
has a similarly high level of intensity (0.6-0.8 kWh per $1 GDP); other countries have 0.5kWh or below.
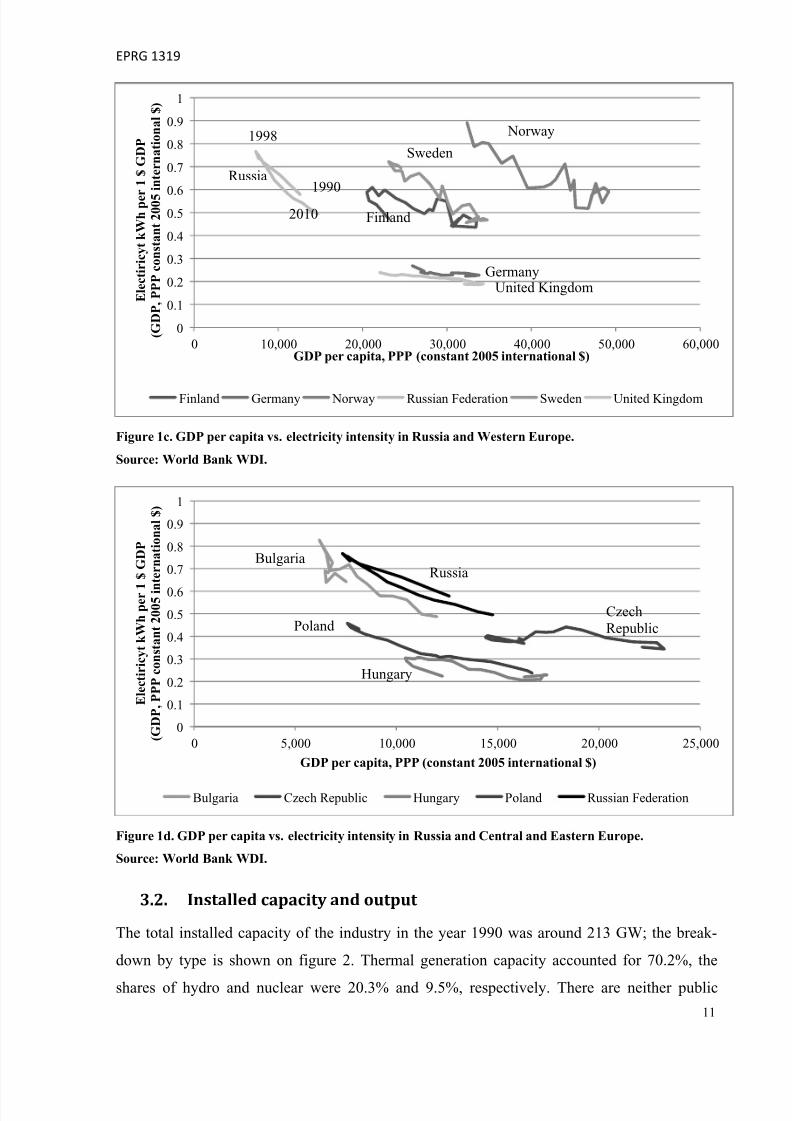
The high electricity intensity of the Russian economy is combined with low per-capita GDP
and low per-capita electricity consumption. This observation contrasts with that of developed
economies with low intensity and high income (figure 1c). Moreover, compared to the
countries of Northern Europe with similar climate conditions, Russia has a much lower GDP
per capita. The developing stage of the Russian economy cannot explain the electricity
7/23/2019 Chernenko, Nadia. The Russian Electricity Supply Industry. From Reform to Reform_October 2013
http://slidepdf.com/reader/full/chernenko-nadia-the-russian-electricity-supply-industry-from-reform-to-reformoctober 13/66
EPRG 1319
10
inefficiency, either: other CEE countries with similar levels of per-capita GDP have lower
intensity (figure 1d).
Figure 1a.GDP and electricity production in Russia, 1991-2010.
Source: World Bank WDI.
Figure 1b.Energy intensity, kWh per 1 dollar GDP (PPP constant 2005 international dollars).
Central and Eastern Europe, 1991-2008.
Source: Author’s calculations based on ‘Electricity production’ and GDP series by World Bank WDI.
1,068.2
859.0 826.2 876.5951.2
1,025.0
1,777
1,163 1,0761,260
1,696
2,010
0
600
1200
1800
2400
3000
3600
0
200
400
600
800
1000
1200
G D P , m i l l i o n d o l l a r s
E l e c t r i c i t y p r o d u c t i o n , T W
h
Electricity produciton, TWh GDP, PPP constant 2005 international $, million [right axis]
0
0.1
0.2
0.3
0.4
0.5
0.6
0.7
0.8
0.9
1
1991 1993 1995 1997 1999 2001 2003 2005 2007 2009
E l e c t r i c i t y i n t e n s i t y , k W h
p e r 1 d o l l a r
G D P
Russian Federation Bulgaria Czech Republic Hungary Poland
7/23/2019 Chernenko, Nadia. The Russian Electricity Supply Industry. From Reform to Reform_October 2013
http://slidepdf.com/reader/full/chernenko-nadia-the-russian-electricity-supply-industry-from-reform-to-reformoctober 14/66
EPRG 1319
11
Figure 1c. GDP per capita vs. electricity intensity in Russia and Western Europe.
Source: World Bank WDI.
Figure 1d. GDP per capita vs. electricity intensity in Russia and Central and Eastern Europe.
Source: World Bank WDI.
3.2.
Installed capacity and output
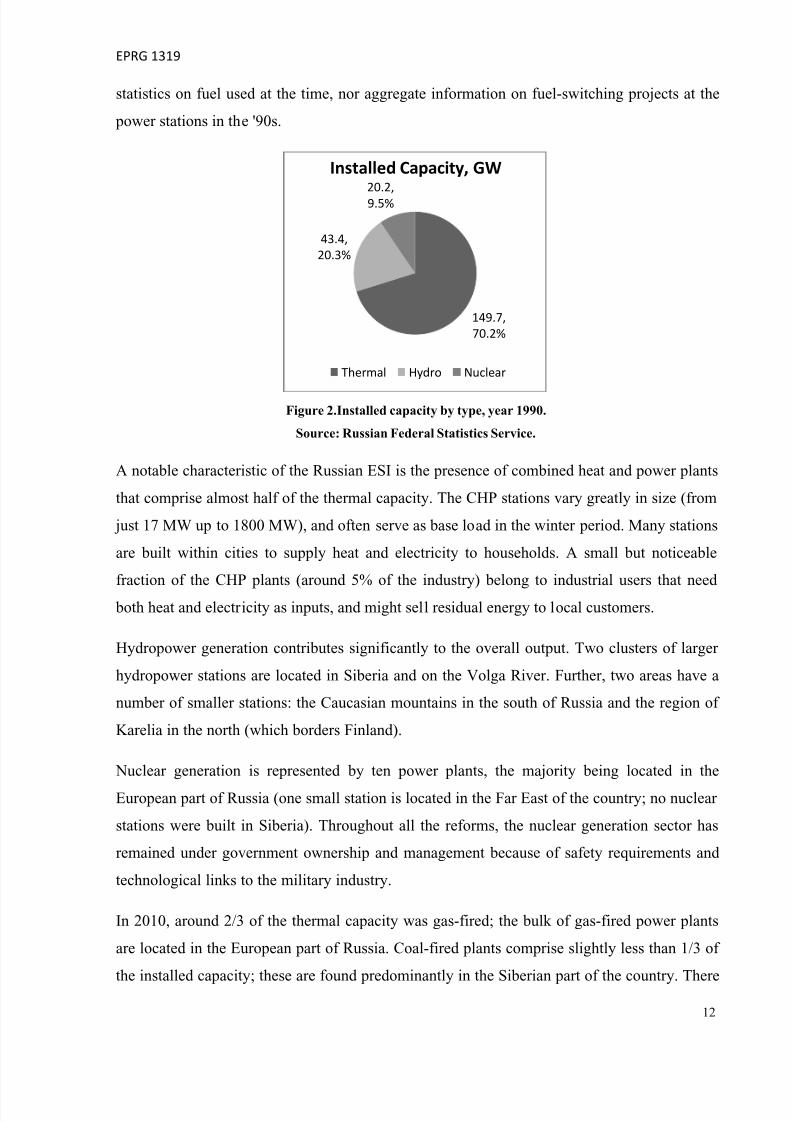
The total installed capacity of the industry in the year 1990 was around 213 GW; the break-
down by type is shown on figure 2. Thermal generation capacity accounted for 70.2%, the
shares of hydro and nuclear were 20.3% and 9.5%, respectively. There are neither public
0
0.1
0.2
0.3
0.4
0.50.6
0.7
0.8
0.9
1
0 10,000 20,000 30,000 40,000 50,000 60,000
E l e c t i r i c y t k W h p e r 1 $ G D P
( G D P , P P P c o n s t a n t 2 0 0 5
i n t e r n a t i o n a l $ )
GDP per capita, PPP (constant 2005 international $)
Finland Germany Norway Russian Federation Sweden United Kingdom
Russia
1998
1990
2010 Finland
Sweden
Norway
GermanyUnited Kingdom
0
0.1
0.2
0.3
0.4
0.5
0.6
0.7
0.8
0.9
1
0 5,000 10,000 15,000 20,000 25,000
E l e c t i r i c y t k W h p e r 1
$ G D P
( G D P , P P P c o n s t a n t 2 0 0 5 i n
t e r n a t i o n a l $ )
GDP per capita, PPP (constant 2005 international $)
Bulgaria Czech Republic Hungary Poland Russian Federation
RussiaBulgaria
Poland CzechRepublic
Hungary
7/23/2019 Chernenko, Nadia. The Russian Electricity Supply Industry. From Reform to Reform_October 2013
http://slidepdf.com/reader/full/chernenko-nadia-the-russian-electricity-supply-industry-from-reform-to-reformoctober 15/66
EPRG 1319
12
statistics on fuel used at the time, nor aggregate information on fuel-switching projects at the
power stations in the '90s.
Figure 2.Installed capacity by type, year 1990.
Source: Russian Federal Statistics Service.
A notable characteristic of the Russian ESI is the presence of combined heat and power plants
that comprise almost half of the thermal capacity. The CHP stations vary greatly in size (from
just 17 MW up to 1800 MW), and often serve as base load in the winter period. Many stations
are built within cities to supply heat and electricity to households. A small but noticeable
fraction of the CHP plants (around 5% of the industry) belong to industrial users that need
both heat and electricity as inputs, and might sell residual energy to local customers.
Hydropower generation contributes significantly to the overall output. Two clusters of larger
hydropower stations are located in Siberia and on the Volga River. Further, two areas have a
number of smaller stations: the Caucasian mountains in the south of Russia and the region of
Karelia in the north (which borders Finland).
Nuclear generation is represented by ten power plants, the majority being located in the
European part of Russia (one small station is located in the Far East of the country; no nuclear
stations were built in Siberia). Throughout all the reforms, the nuclear generation sector has
remained under government ownership and management because of safety requirements and
technological links to the military industry.
In 2010, around 2/3 of the thermal capacity was gas-fired; the bulk of gas-fired power plants
are located in the European part of Russia. Coal-fired plants comprise slightly less than 1/3 of
the installed capacity; these are found predominantly in the Siberian part of the country. There
149.7,
70.2%
43.4,
20.3%
20.2,
9.5%
Installed Capacity, GW
Thermal Hydro Nuclear
7/23/2019 Chernenko, Nadia. The Russian Electricity Supply Industry. From Reform to Reform_October 2013
http://slidepdf.com/reader/full/chernenko-nadia-the-russian-electricity-supply-industry-from-reform-to-reformoctober 16/66
EPRG 1319
13
are a few stations that use both types of fuel (e.g. two turbines are gas-fired; one turbine is
coal-fired). The fraction of renewables in the mix is negligible- less than 1%.
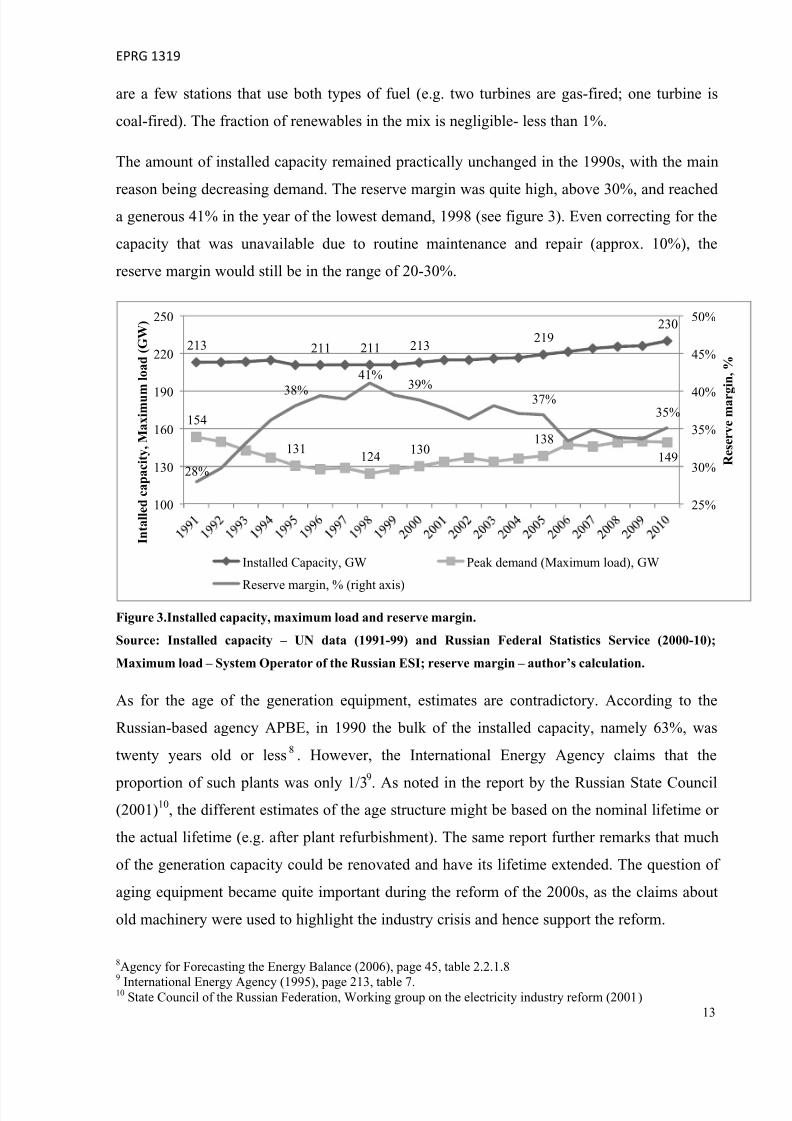
The amount of installed capacity remained practically unchanged in the 1990s, with the main
reason being decreasing demand. The reserve margin was quite high, above 30%, and reacheda generous 41% in the year of the lowest demand, 1998 (see figure 3). Even correcting for the
capacity that was unavailable due to routine maintenance and repair (approx. 10%), the
reserve margin would still be in the range of 20-30%.
Figure 3.Installed capacity, maximum load and reserve margin.
Source: Installed capacity – UN data (1991-99) and Russian Federal Statistics Service (2000-10);
Maximum load – System Operator of the Russian ESI; reserve margin – author’s calculation.
As for the age of the generation equipment, estimates are contradictory. According to the
Russian-based agency APBE, in 1990 the bulk of the installed capacity, namely 63%, was
twenty years old or less 8 . However, the International Energy Agency claims that the
proportion of such plants was only 1/39
. As noted in the report by the Russian State Council(2001)10, the different estimates of the age structure might be based on the nominal lifetime or
the actual lifetime (e.g. after plant refurbishment). The same report further remarks that much
of the generation capacity could be renovated and have its lifetime extended. The question of
aging equipment became quite important during the reform of the 2000s, as the claims about
old machinery were used to highlight the industry crisis and hence support the reform.
8Agency for Forecasting the Energy Balance (2006), page 45, table 2.2.1.89
International Energy Agency (1995), page 213, table 7.10 State Council of the Russian Federation, Working group on the electricity industry reform (2001)
213 211 211 213219
230
154
131124
130138
14928%
38%
41%39%
37%35%
25%
30%
35%
40%
45%
50%
100
130
160
190
220
250
R e s e r v e m a r g
i n , %
I n t a l l e d c a p a c i t y , M a x i m u m
l o a d ( G W )
Installed Capacity, GW Peak demand (Maximum load), GW
Reserve margin, % (right axis)
7/23/2019 Chernenko, Nadia. The Russian Electricity Supply Industry. From Reform to Reform_October 2013
http://slidepdf.com/reader/full/chernenko-nadia-the-russian-electricity-supply-industry-from-reform-to-reformoctober 17/66
EPRG 1319
14
3.3. Dispatch zones and transmission system
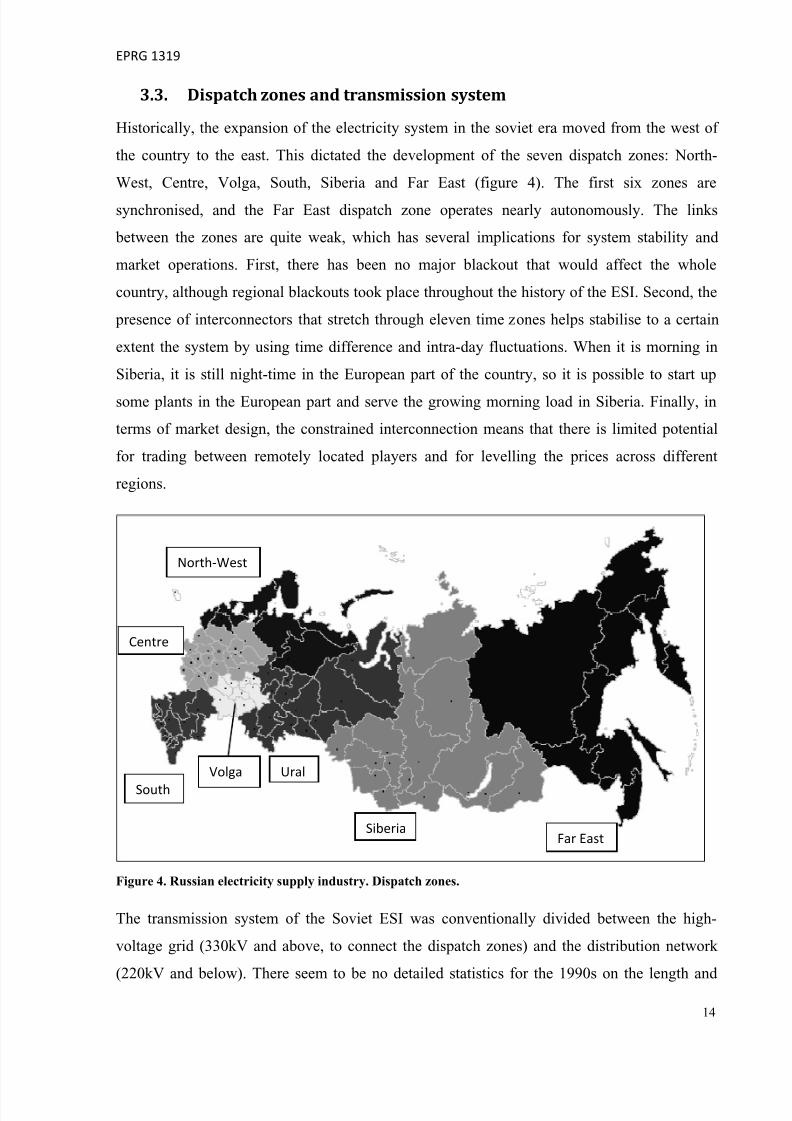
Historically, the expansion of the electricity system in the soviet era moved from the west of
the country to the east. This dictated the development of the seven dispatch zones: North-
West, Centre, Volga, South, Siberia and Far East (figure 4). The first six zones are
synchronised, and the Far East dispatch zone operates nearly autonomously. The links
between the zones are quite weak, which has several implications for system stability and
market operations. First, there has been no major blackout that would affect the whole
country, although regional blackouts took place throughout the history of the ESI. Second, the
presence of interconnectors that stretch through eleven time zones helps stabilise to a certain
extent the system by using time difference and intra-day fluctuations. When it is morning in
Siberia, it is still night-time in the European part of the country, so it is possible to start up
some plants in the European part and serve the growing morning load in Siberia. Finally, in
terms of market design, the constrained interconnection means that there is limited potential
for trading between remotely located players and for levelling the prices across different
regions.
Figure 4. Russian electricity supply industry. Dispatch zones.
The transmission system of the Soviet ESI was conventionally divided between the high-
voltage grid (330kV and above, to connect the dispatch zones) and the distribution network
(220kV and below). There seem to be no detailed statistics for the 1990s on the length and
South
Centre
North‐West
Volga Ural
SiberiaFar East
7/23/2019 Chernenko, Nadia. The Russian Electricity Supply Industry. From Reform to Reform_October 2013
http://slidepdf.com/reader/full/chernenko-nadia-the-russian-electricity-supply-industry-from-reform-to-reformoctober 18/66
EPRG 1319
15
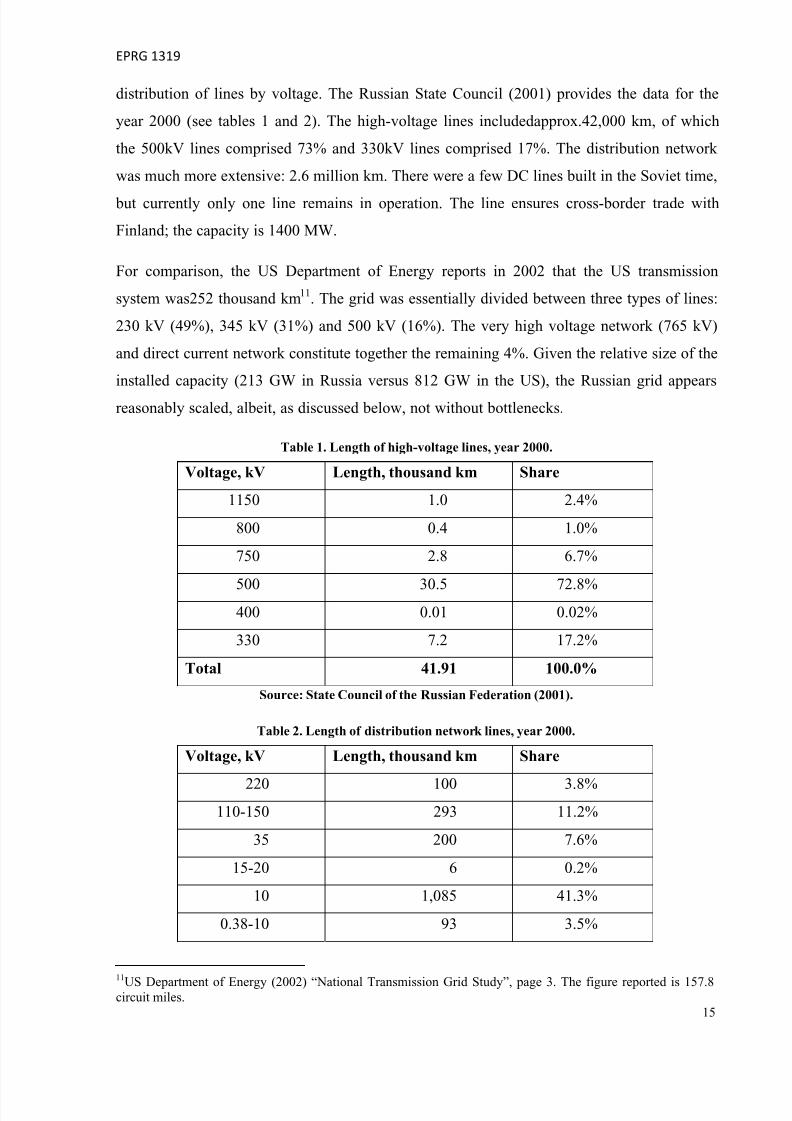
distribution of lines by voltage. The Russian State Council (2001) provides the data for the
year 2000 (see tables 1 and 2). The high-voltage lines includedapprox.42,000 km, of which
the 500kV lines comprised 73% and 330kV lines comprised 17%. The distribution network
was much more extensive: 2.6 million km. There were a few DC lines built in the Soviet time,
but currently only one line remains in operation. The line ensures cross-border trade with
Finland; the capacity is 1400 MW.
For comparison, the US Department of Energy reports in 2002 that the US transmission
system was252 thousand km11. The grid was essentially divided between three types of lines:
230 kV (49%), 345 kV (31%) and 500 kV (16%). The very high voltage network (765 kV)
and direct current network constitute together the remaining 4%. Given the relative size of the
installed capacity (213 GW in Russia versus 812 GW in the US), the Russian grid appears
reasonably scaled, albeit, as discussed below, not without bottlenecks.
Table 1. Length of high-voltage lines, year 2000.
Voltage, kV Length, thousand km Share
1150 1.0 2.4%
800 0.4 1.0%
750 2.8 6.7%
500 30.5 72.8%400 0.01 0.02%
330 7.2 17.2%
Total 41.91 100.0%
Source: State Council of the Russian Federation (2001).
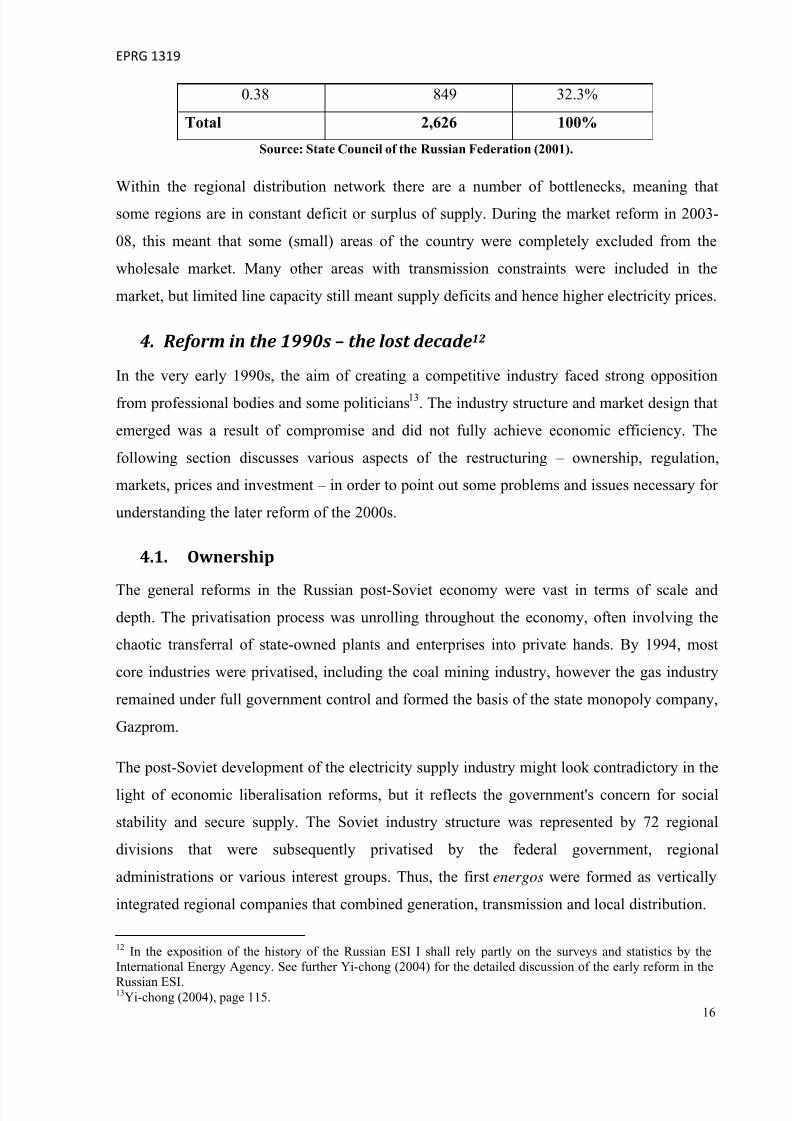
Table 2. Length of distribution network lines, year 2000.
Voltage, kV Length, thousand km Share
220 100 3.8%
110-150 293 11.2%
35 200 7.6%
15-20 6 0.2%
10 1,085 41.3%
0.38-10 93 3.5%
11
US Department of Energy (2002) “National Transmission Grid Study”, page 3. The figure reported is 157.8circuit miles.
7/23/2019 Chernenko, Nadia. The Russian Electricity Supply Industry. From Reform to Reform_October 2013
http://slidepdf.com/reader/full/chernenko-nadia-the-russian-electricity-supply-industry-from-reform-to-reformoctober 19/66
EPRG 1319
16
0.38 849 32.3%
Total 2,626 100%
Source: State Council of the Russian Federation (2001).
Within the regional distribution network there are a number of bottlenecks, meaning that
some regions are in constant deficit or surplus of supply. During the market reform in 2003-
08, this meant that some (small) areas of the country were completely excluded from the
wholesale market. Many other areas with transmission constraints were included in the
market, but limited line capacity still meant supply deficits and hence higher electricity prices.
4. Reform in the 1990s – the lost decade12
In the very early 1990s, the aim of creating a competitive industry faced strong opposition
from professional bodies and some politicians13. The industry structure and market design that
emerged was a result of compromise and did not fully achieve economic efficiency. The
following section discusses various aspects of the restructuring – ownership, regulation,
markets, prices and investment – in order to point out some problems and issues necessary for
understanding the later reform of the 2000s.
4.1. Ownership
The general reforms in the Russian post-Soviet economy were vast in terms of scale and
depth. The privatisation process was unrolling throughout the economy, often involving the
chaotic transferral of state-owned plants and enterprises into private hands. By 1994, most
core industries were privatised, including the coal mining industry, however the gas industry
remained under full government control and formed the basis of the state monopoly company,
Gazprom.
The post-Soviet development of the electricity supply industry might look contradictory in the
light of economic liberalisation reforms, but it reflects the government's concern for social
stability and secure supply. The Soviet industry structure was represented by 72 regional
divisions that were subsequently privatised by the federal government, regional
administrations or various interest groups. Thus, the first energos were formed as vertically
integrated regional companies that combined generation, transmission and local distribution.
12 In the exposition of the history of the Russian ESI I shall rely partly on the surveys and statistics by theInternational Energy Agency. See further Yi-chong (2004) for the detailed discussion of the early reform in the
Russian ESI.13Yi-chong (2004), page 115.
7/23/2019 Chernenko, Nadia. The Russian Electricity Supply Industry. From Reform to Reform_October 2013
http://slidepdf.com/reader/full/chernenko-nadia-the-russian-electricity-supply-industry-from-reform-to-reformoctober 20/66
EPRG 1319
17
The federal government regarded the formation of energos as a threat to the overall security
of supply (or rather it feared losing control over the strategic assets). As a result, a counter-
process of corporatisation was launched. In 1992, the federal government formed the holding
company “Russian Joint-Stock Company United Energy Systems”, abbreviated to RAO EES
in Russian. The new company became the owner of large power plants, in particular thermal
plants with capacity above 100 MW and hydropower plants with capacity above 300 MW. It
also received 49% of the capital of almost every energo company, and quickly managed to
gain control of 50% or more of the capital in 51 energos14. The complex property and
operational structure that emerged as a result of the corporatisation process reflected, to a
large extent, the compromise between central and regional authorities15.
The very few energos (in Irkutsk, Novosibirsk, Tatarstan and Bashkiria) that maintained
independence from RAO EES were privatised as early as 1991 by the regional governments.
RAO subsequently tried to reverse the privatisation decisions at the High Court of Russia, but
was unsuccessful.
The total installed capacity directly belonging to RAO EES amounted to 57.5 GW; the
monopoly controlled twice that amount through its dependent energos. In total, RAO EES ran
nearly 78% of the industry generation of 212 GW. The company also owned the high-voltage
transmission lines (330 kV and above)16
, while the low-voltage distribution network was inthe hands of energo companies.
As for nuclear generation, the federal government maintained direct ownership and control of
the sector, which consists of ten power stations, varying in size from 600 to 4,000 MW17,
totalling 23,000 GW. All the stations are located in the European part of the country.
The early stage of the Russian reform resembles to a certain extent the nationalisation of the
electricity industry in Brazil in the 1970s,where the “power system was never completely
centralized”18. RAO EES did not have full control over the installed capacity and distribution,
but was responsible for dispatch operations.
14RAO EES company (1997). Annual report.15 International Energy Agency (1995), page 200.For a detailed review of privatisation in the very early 1990s,see Xu, Yi-chong (2004) pages 167-169.16 International Energy Agency (1995), page 201.17The smallest nuclear station is only 50MW but it is located in the Far East of the country in the Chukotkaregion and has been considered as an isolated producer.. 18
João Lizardo R. Hermes de Araújo “The Case of Brazil: Reform by Trial And Error?” Ch. 16 in Sioshansi andPfaffenberger, ed. (2007), p.570.
7/23/2019 Chernenko, Nadia. The Russian Electricity Supply Industry. From Reform to Reform_October 2013
http://slidepdf.com/reader/full/chernenko-nadia-the-russian-electricity-supply-industry-from-reform-to-reformoctober 21/66
EPRG 1319
18
4.2.
Government regulation of the industry
The regulation of the electricity industry was assigned to the Federal Energy Commission that
was formed in 1992 as a part of the Price Committee of the Ministry for the Economy. The
FEC moved under direct governmental control in 1995. The regional level of regulatory
authorities was represented by the Regional Energy Commissions (REC). The very first
commissions emerged as public committees formed of professional and political
representatives, however very soon the commissions became part of regional administrations.
The status of the RECs was formalised by the federal government in 1995, alongside that of
the FEC.
The Federal Energy Commission was responsible for setting the following19:
•
guidelines for tariff setting on electricity and heat;
• the minimum and maximum price level for energy sold on the wholesale market;
• charges for transmission and distribution;
• service charges on the wholesale market;
• investment plans of the industry (and controlling the implementation of the investment
programmes by the energos).
The Commission was also responsible for defining the minimum and maximum level ofresidential prices, as well as monitoring the decisions of the Regional Energy Commissions
and resolving disputes between RECs and third parties. In practice, “many RECs faced local
political pressure to keep tariffs below those recommended by the FEC”20, in particular
residential tariffs, hence the need to maintain higher tariffs for industry customers and the
resulting problem of cross-subsidies.
The methodology for defining tariffs in the very early 1990s was rather obscure. There seems
to be no publicly available document, either legislation or research, that describes rules or
guidelines for setting tariffs at the time. Some features of the methodology can be deduced
from later documents issued by the regulatory authorities in 1997 and beyond.
The first tariffs were one-tier and based on reported costs, including variable and fixed
components, as well as investment charges. The charge seemed to be designed to cover the
19As defined by the article 5, the Federal Law No. 41-FZ issued on 14.04.1995“On the State Regulation of the
Tariffs for Electricity and Heat Energy”.20 International Energy Agency (2002), page 207.
7/23/2019 Chernenko, Nadia. The Russian Electricity Supply Industry. From Reform to Reform_October 2013
http://slidepdf.com/reader/full/chernenko-nadia-the-russian-electricity-supply-industry-from-reform-to-reformoctober 22/66
EPRG 1319
19
cost of constructing new capacity. It is not clear whether there was any norm on capital return,
and whether it could be used to pay for construction. Since the early 1990s were marked by
vast transformation, cost reporting was often inaccurate. Moreover, hyperinflation invalidated
price and cost estimates, so pre-set tariffs could not, in general, reflect the actual cost of
running a power plant.
Formal rules on price regulation seem to have been adopted only in 1997. The rules
introduced the two-tier tariff 21, as well as a specific investment charge.
The tariff consisted of prices for electricity and for capacity. The electricity tariff was to cover
the fuel cost, any other types of expenditure that vary with the output (some taxes, in
particular) and the normal rate of return. The rate of return was set as equal for any thermal
station, but seems to have never been published. The capacity tariff was to cover all the other
operational costs of the power plant not included in the electricity tariff. The general
perception (well documented in various international and domestic studies) is that the tariffs
were low and did not reflect the true cost of generating and transmitting electricity.
The investment charge (discussed below in greater detail) was part of a more general service
fee that covered the expenses of the RAO EES as the dispatch and market operator. The
service fee was added to the retail price and thus was paid for by any retail customer
(including large industrial consumers at the time).
Tariff regulations did not specify separately any transmission charges or payments, as the cost
of transmitting the electricity was included in the service fee.
4.3. Wholesale market
The Federal Wholesale Electricity and Capacity Market (FOREM) was established as early as
199322, but its legal framework was finalised only by 1996 23.Although called a market,
FOREM was rather a mechanism for balancing electricity flows between the federal power
plants and regional energos. The energo supplied energy to local customers from its own
21Federal Energy Commission Decree No. 76 issued on 06.05.1997. “Temporary methodology for defining thewholesale two-tier tariffs”.22
Xu, Yi-chong (2004), page 216.23 Federal Law No. 41-FZissued on 14.04.1995 and Government Decree No. 793 on 12.07.1996 .
7/23/2019 Chernenko, Nadia. The Russian Electricity Supply Industry. From Reform to Reform_October 2013
http://slidepdf.com/reader/full/chernenko-nadia-the-russian-electricity-supply-industry-from-reform-to-reformoctober 23/66
EPRG 1319
20
power stations and entered the FOREM only to sell surplus energy or buy deficit. The amount
of electricity supplied to the market was around 1/3 of industry production24.
The Federal Energy Commission regulated the price (or tariff, in Roubles per MWh), both for
the energy supplied to and purchased on the FOREM
25
. In other words, the energos wouldsell surplus at the nominated price or would buy extra energy also at the nominated price.
The Commission set the tariffs for electricity and capacity individually for every power plant.
The planned generation mix (dispatch schedule) together with individual station tariffs
determined the average production cost of the energo companies, which was the basis for the
sell tariff 26. The buy tariff was uniform for all energos: it was an average of the sell tariffs
weighted by the amount of electricity sold. As for the supply to local customers, the energos
were subject to tariffs set by the Regional Energy Commissions.
Apart from completely regulated pricing, the organisation of the FOREM had other major
deficiencies27. First, RAO EES, the major electricity producer, acted simultaneously as the
market operator. The conflict of interest was obvious, as RAO EES would order dispatches
from its own thermal stations instead of hydropower plants belonging to independent energos.
Second, direct bilateral contracts were not permitted: all transactions had to be completed via
the wholesale market. Finally, large consumers could not purchase energy on the market at
wholesale prices, and had to buy energy from local energos at higher prices (the reason being
the desire of regional political forces to support local energy producers).
4.4.
Prices and profitability
As described above, wholesale prices were completely regulated. It is worth noting that tariffs
were low by international standards, especially tariffs for households, which seems to be a
typical situation throughout the 1990s. The World Bank (1999) provides a summary of power
tariffs in Russia in different dispatch zones in 1996 (table 3). The price for industrial
customers varied between 2.05 and 9.66 US cents/kWh. The lowest tariff was observed in the
Siberia dispatch zone, which is endowed with large hydro resources. The households paid
24 RAO EES company (1998).Annual report.
25Federal Energy Commission, Resolution No. 123/1 issued on 24.11.1997 “On the tariff son electric and heatenergy (capacity)”
26
International Energy Agency (1995), page 208.
27 International Energy Agency (2002), page 205. See also Opitz (2000).
7/23/2019 Chernenko, Nadia. The Russian Electricity Supply Industry. From Reform to Reform_October 2013
http://slidepdf.com/reader/full/chernenko-nadia-the-russian-electricity-supply-industry-from-reform-to-reformoctober 24/66
EPRG 1319
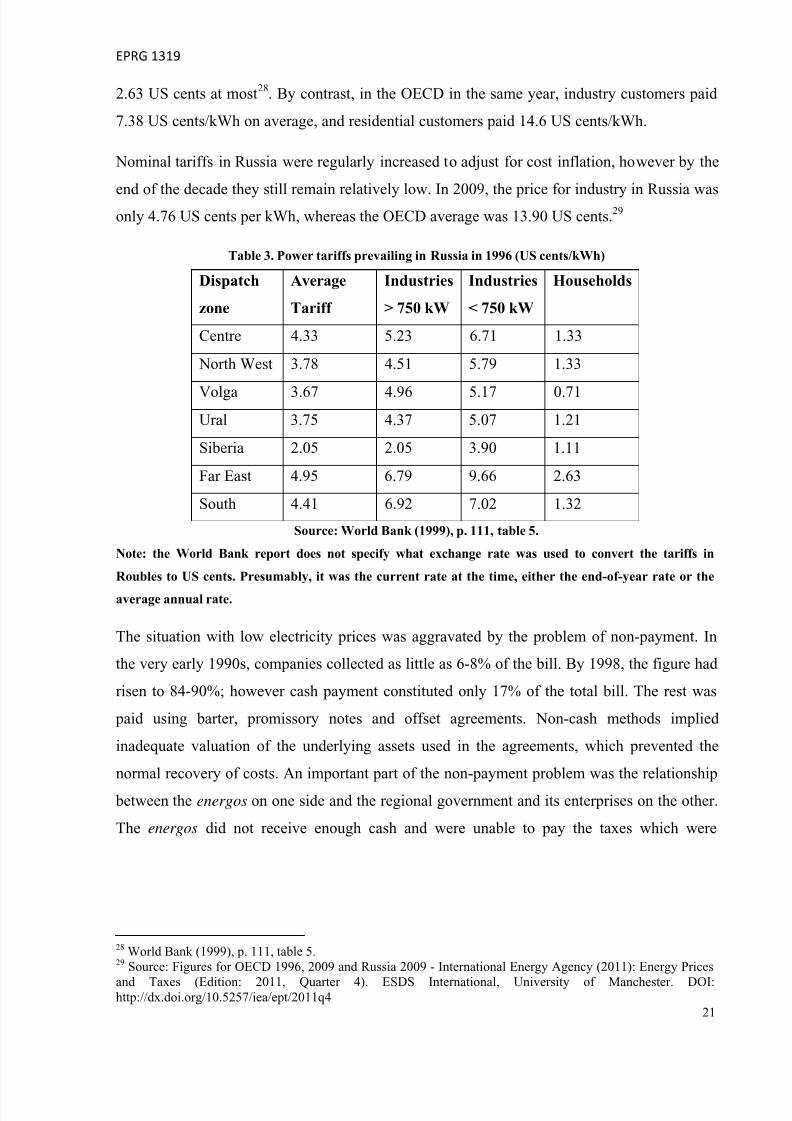
21
2.63 US cents at most28. By contrast, in the OECD in the same year, industry customers paid
7.38 US cents/kWh on average, and residential customers paid 14.6 US cents/kWh.
Nominal tariffs in Russia were regularly increased to adjust for cost inflation, however by the
end of the decade they still remain relatively low. In 2009, the price for industry in Russia wasonly 4.76 US cents per kWh, whereas the OECD average was 13.90 US cents. 29
Table 3. Power tariffs prevailing in Russia in 1996 (US cents/kWh)
Dispatch
zone
Average
Tariff
Industries
> 750 kW
Industries
< 750 kW
Households
Centre 4.33 5.23 6.71 1.33
North West 3.78 4.51 5.79 1.33
Volga 3.67 4.96 5.17 0.71
Ural 3.75 4.37 5.07 1.21
Siberia 2.05 2.05 3.90 1.11
Far East 4.95 6.79 9.66 2.63
South 4.41 6.92 7.02 1.32
Source: World Bank (1999), p. 111, table 5.
Note: the World Bank report does not specify what exchange rate was used to convert the tariffs in
Roubles to US cents. Presumably, it was the current rate at the time, either the end-of-year rate or the
average annual rate.
The situation with low electricity prices was aggravated by the problem of non-payment. In
the very early 1990s, companies collected as little as 6-8% of the bill. By 1998, the figure had
risen to 84-90%; however cash payment constituted only 17% of the total bill. The rest was
paid using barter, promissory notes and offset agreements. Non-cash methods implied
inadequate valuation of the underlying assets used in the agreements, which prevented the
normal recovery of costs. An important part of the non-payment problem was the relationship
between the energos on one side and the regional government and its enterprises on the other.
The energos did not receive enough cash and were unable to pay the taxes which were
28 World Bank (1999), p. 111, table 5.29 Source: Figures for OECD 1996, 2009 and Russia 2009 - International Energy Agency (2011): Energy Prices
and Taxes (Edition: 2011, Quarter 4). ESDS International, University of Manchester. DOI:http://dx.doi.org/10.5257/iea/ept/2011q4
7/23/2019 Chernenko, Nadia. The Russian Electricity Supply Industry. From Reform to Reform_October 2013
http://slidepdf.com/reader/full/chernenko-nadia-the-russian-electricity-supply-industry-from-reform-to-reformoctober 25/66
EPRG 1319
22
necessary to finance the public and municipal entities, who were often the worst non-payers
(the phenomenon labelled “vicious circle of non-payment” by the World Bank)30.
Finally, the low tariffs were not supported by adequately low input prices. In contrast to
regulated electricity industry and energy tariffs, the markets for equipment and coal fuel wereliberalised, and hyperinflation pushed up the cost of inputs. As a result, the energos were in
constant financial deficit. The IEA report (1993) estimated the aggregate accounting losses of
the industry at the time at $1.5 million, with a caveat that this figure could be even worse due
to the widespread non-payment of bills31.
4.5.
Investment
As the demand for energy was low in the early 1990s, so was the demand for new capacity.
The main source of financing investment needs was the one-tier tariff that included the
investment component together with other costs.
The federal government introduced an investment charge in 1997specifically to finance the
investment needs of the RAO EES monopoly32. In addition, the Federal Energy Commission
became responsible for approving the part of the monopoly’s investment plan that was
financed with the charge. As an example, the monopoly reported its investment cost in 1999
at $1.21 billion (nominal terms), whereas the investment approved by the FEC and thus
financed by the charge was $0.17 billion, or 14% of the total cost.
RAO EES stated that the monopoly financed its capital expenditures mainly from
depreciation payments (63%) and from the profits of dependent energo companies (15%)33.
The contribution of the investment charge is not reported, but given other sources of financing
it could not constitute more than 10%.
The total investment cost of the RAO EES was constantly increasing in nominal terms during
the ‘90s, but it dropped in real terms by nearly 2/334.As demand was in decline, the monopoly
focused mainly on refurbishment and renovation of the existing capacity.
30World Bank (1999). 31 IEA report (1993) “Russian Energy Prices, Taxes and Costs”, page 76.32 Government resolution No. 390 issued on 03.04.1997. “On the measure to improve the formation of theinvestment resources in the electricity industry and on the government control of the use of the resources”.33 RAO EES company (1998). Annual report. The use of different annual reports is due to inconsistent reporting
by the monopoly where one type of cost might be reported in one year and not in the following one.34
RAO EES (1999) Annual report, Section on investment and innovation. See also International Energy Agency(2002), page 203
7/23/2019 Chernenko, Nadia. The Russian Electricity Supply Industry. From Reform to Reform_October 2013
http://slidepdf.com/reader/full/chernenko-nadia-the-russian-electricity-supply-industry-from-reform-to-reformoctober 26/66
EPRG 1319
23
After the demand trend reverse in 1999, electricity consumption grew by 2% for several years.
Since there was no lead-in for the 90s, concerns were growing about the reserve margin and
adequacy of the installed capacity. Positive demand dynamics, together with the general
economic revival, pushed RAO EES to adopt an extensive investment programme. The
programme was based on rather optimistic scenarios of 6% growth p.a., which was met with
strong criticism. Nonetheless, when RAO EES was restructured, the programme was not
abandoned, but passed, in a reduced form, onto new generation companies, which
complicated the design of the electricity markets in the following reform.
5. Preparation for the new reform
The structure of the industry that emerged in 1990s was complex and non-transparent. RAO
EES was a holding company in the monopoly position, and the regulatory bodies lacked the
power to curb RAO’s ambitions. Numerous inefficiencies of the FOREM market and the poor
economic performance of the energo companies contributed to overall dissatisfaction. The
need for reform was clear, and the discussion was open as to what measures to take to
improve the situation.
The presidential decree in 1997 on the reform of the natural monopolies offered quitesensible, although mostly general, solutions35. In the electricity industry, the decree prescribed
the unbundling of the monopoly and the creation of independent generation companies, a grid
company and an independent market/dispatch operator. Market liberalisation, i.e. competitive
trading, free pricing and free entry for large customers, should have been completed by the
year 2000, though the plans were only completed eleven years behind schedule, in 2011.
As for RAO EES, the monopoly began by employing consultants from Hagler Baily to
develop a reform plan36. The project envisaged that RAO EES would consolidate its thermal
generation (mostly old and inefficient), but keep control over the high-voltage grid and
hydropower stations (more valuable assets in the industry). The US Agency for International
Development (USAID) that supported the study (as part of more general support for
reforming the natural monopolies in Russia) criticised the final report, saying that it should
have explained how to reform the industry, not how to reform the monopoly.
35 Decree of the President No. 426 issued on 28.04.1997. Natural monopolies were electricity, railways,
telecommunication and gas production.36Xu, Yi-chong (2004), page 217.
7/23/2019 Chernenko, Nadia. The Russian Electricity Supply Industry. From Reform to Reform_October 2013
http://slidepdf.com/reader/full/chernenko-nadia-the-russian-electricity-supply-industry-from-reform-to-reformoctober 27/66
EPRG 1319
24
Appointing Anatoly Chubais as the head of RAO EES in 1998 was an important step towards
the reform of the monopoly: Mr. Chubais was one of the prominent figures in the economic
reforms of the early ‘90s, and ‘the industry welcomed Chubais as the head [...] because it
wanted somebody who had both management competence and political influence in the
government’37.
Discussions on the reform are summarised in the report by the Russian State Council (April
2001). The report outlines the main concepts proposed by the Ministry for Economic
Development, by RAO EES and various institutions and think-tank groups, for a total of
eleven concepts. Both the Ministry and RAO reform plans offered the following:
(i) to keep the holding company;
(ii) to create generation companies and endow them with hydropower and thermal
stations and CHP, but keep these companies as subsidiary properties of RAO EES;
(iii) to keep the energo companies (the report is a summary and does not provide
details what generation assets would be left to the energos).
RAO EES suggested that the transmission grid (both the high and low voltage networks)
should be consolidated as a grid company-subsidiary of RAO EES, but the Ministry insisted
that the grid company should become a separate entity, both in terms of ownership and
management.
Most other reform concepts were similarly minded. The authors offered partial divestiture of
RAO EES generation assets and energo companies, but kept the vertically integrated structure
of either RAO or the energos. Only two plans recommended the full unbundling of RAO and
the separation of power plants, the grid and distribution networks38.
The State Council report also summarises international experience of reforms in the electricity
industry, more specifically the cases of England, Nordpool, PJM, California and Argentina.
The summaries are diverse, with a focus on different aspects of the reform in each case
(industry structure in England, customer switching in PJM, regulatory issues in California,
etc.) The report concludes that after divestiture and market liberalisation new generation
37Xu, Yi-chong (2004), page 171.38Concepts 4 and 6 as numbered in the report of the State Council (2001). The first plan was presented by the
National Investment Council, non-government non-for-profit organisation that aims to improve the investment
climate in Russia. The second plan came from the RAO EES competitor, the nuclear generation companyRos EnergoAtom.
7/23/2019 Chernenko, Nadia. The Russian Electricity Supply Industry. From Reform to Reform_October 2013
http://slidepdf.com/reader/full/chernenko-nadia-the-russian-electricity-supply-industry-from-reform-to-reformoctober 28/66
EPRG 1319
25
companies generally seek to consolidate their assets (by mergers and acquisitions) and
integrate their business (upstream, to gain control over fuel supply companies, and
downstream, to gain control over retail suppliers).
Among the key elements of the reform, the report lists the financial separation ofgeneration/transmission/retail, the independent status of the regulatory body, the system
(dispatch) operator and commercial operator, and the creation of the proper markets.
However, the same list of key elements stipulates that vertically integrated companies
guarantee the stability of supply, that asset consolidation ensures competition, a lower cost of
production and higher investment returns.
The time-lapse between the presidential decree of 1997 and the final report by the State
Council of 2001 gives an idea of the lengthy discussions and the underlying difficulties in
finding a suitable reform plan. The State Council report shows that most opinions were in
favour of maintaining the status quo, possibly with slight modifications, rather than
profoundly transforming the electricity industry and design of the markets.
In the light of strong opposition to the reform, the final list of measures as listed in the
Government resolution (July 2001)39 should be regarded, perhaps, not without surprise. The
document mentions the following as the main components of the industry reform:
• Competition in energy production and supply (implying the separation of generation
from distribution);
• State monopoly over the transmission and dispatch service;
• Equal access to market infrastructure for any producer or consumer;
• Unified technical standards and rules;
• Financial transparency in the markets and regulated sectors of the industry;
•
Protection of investors’ and shareholders’ rights during the restructuring.
The first phase of the reform saw the adoption of two major laws in March 2003:no. 35-FZ
“On the electricity industry” and no. 36-FZ “On the electricity industry in the transition
period”. The main law on electricity defined the principles of the network functions, dispatch
service, regulatory framework and rules of the wholesale market. The law on the transition
period stipulated the priority order of legal acts that could become contradictory during the
divestiture of the monopoly. Other notable changes in the legislation included the
39Government resolution No. 526 issued on 11.07.2001. Also enlisted by Xu, Yi-chong (2004), page 222.
7/23/2019 Chernenko, Nadia. The Russian Electricity Supply Industry. From Reform to Reform_October 2013
http://slidepdf.com/reader/full/chernenko-nadia-the-russian-electricity-supply-industry-from-reform-to-reformoctober 29/66
EPRG 1319
26
modification of the Civil Code and of the laws on natural monopolies, on state regulation of
the tariffs and on energy conservation.
Subsequently, as the reform was unrolling, RAO EES announced its revised reform
programme, dubbed “5 plus 5”. The plan divided the reform into two stages, each five yearslong (hence the title).The first block of measures planned for 1998-2003included finalising
the new market structure and the adoption of necessary legislation, including acts on
regulation, tariff setting and wholesale market rules. The second phase of the reform in 2003-
08 envisaged the actual restructuring of the industry, with the dismantling of RAO EES,
vertical disintegration of the energos, and the creation of independent generation companies.
In the programme, RAO EES emphasised the need for higher efficiency in power generation
and stability in energy supply.40 It was further declared that the unbundling of the vertically
integrated companies and creation of the competitive markets was necessary to improve the
situation and to attract private capital into the industry. RAO EES admitted that the
government was an inefficient manager and proclaimed that only private investors would
have incentives to lower the production cost.
The final programme published by RAO EES is in line with the general principles of the
electricity market liberalisation and contrasts the initial plans and concepts of limited
restructuring. However, the actual course of the reform, in particular the ownership structure
that emerged, has demonstrated that opposition to liberal markets is quite strong and the
whole process of industry liberalisation might be at risk of slowdown or even reversal.
6. Liberalisation reform in 2003-08
The reform of the electricity industry took several directions. The monopoly was dismantled
to create private generation companies, whereas the dispatch and grid operators were
transformed into two (separate) state monopolies. The regulatory framework was amended
and clarified, and finally the wholesale and retail markets were introduced. An important part
of the reform was the investment programme and the development of capacity mechanisms.
40
RAO EES company. Reform Strategy Concept.http://www.rao-ees.ru/en/reforming/conc/show.cgi?con2003.htm#2 [accessed on July, 1st, 2012].
7/23/2019 Chernenko, Nadia. The Russian Electricity Supply Industry. From Reform to Reform_October 2013
http://slidepdf.com/reader/full/chernenko-nadia-the-russian-electricity-supply-industry-from-reform-to-reformoctober 30/66
EPRG 1319
27
The unbundling of the monopoly is a typical step towards industry liberalisation. In Russia,
the total number of generation companies created was above twenty, which contrasts with the
case of other markets with just a few companies. The large number reflects the size of the
Russian ESI, the geographical scope and the need to ensure competition not only at a national
level but also in the regions. The functions of the grid operator and the system operator are
separated (cf. the case of an Independent Transmission Operator who is also in charge of
dispatch), which also reflects the size of the industry and the associated degree of
responsibility.
The wholesale market for electricity was created almost from scratch (including a market-
clearing mechanism to compute prices and quantities, bilateral contracts, financial markets
etc.). The baseline model relies on locational marginal pricing rather than on unique national
or zonal prices. The retail market has been partially de-regulated, with household tariffs still
under stringent government control.
Finally, the RAO EES investment programme was ‘imposed’ on the newly-created generation
companies with a special kind of guarantee of investment returns. The capacity market was
introduced, though investment obligations complicated the design. Moreover, the new
capacity market is subject to severe regulation, which means that market trading has been
virtually replaced with government planning and control.
6.1. Price zones and generation mix
Before discussing the restructuring of the industry, it is useful to describe changes in market
zoning (important when designing the composition of new generation companies). As a result
of the reform, the zoning of the Russian electricity market has become more complex41. The
dispatch zone formed the basis for the pricing areas of the wholesale market. The first five
dispatch regions (North-West, Centre, South, Volga, and Urals) are united into the Europe
price area. Two administrative regions in the North-West dispatch area are excluded from the
market due to weak transmission links. They are combined into the non-pricing zone 1, which
is regulated by the government. The Siberia dispatch region is left as a second single price
area and the Far East remains under regulation (non-pricing zone 2). The map of the dispatch
zones and the price areas is given as figure 5.
41
Zones not mentioned here include those of the Federal Grid Company and those of the holding distributioncompany. Neither of these zoning schemes coincides entirely with the dispatch regions.
7/23/2019 Chernenko, Nadia. The Russian Electricity Supply Industry. From Reform to Reform_October 2013
http://slidepdf.com/reader/full/chernenko-nadia-the-russian-electricity-supply-industry-from-reform-to-reformoctober 31/66
EPRG 1319
28
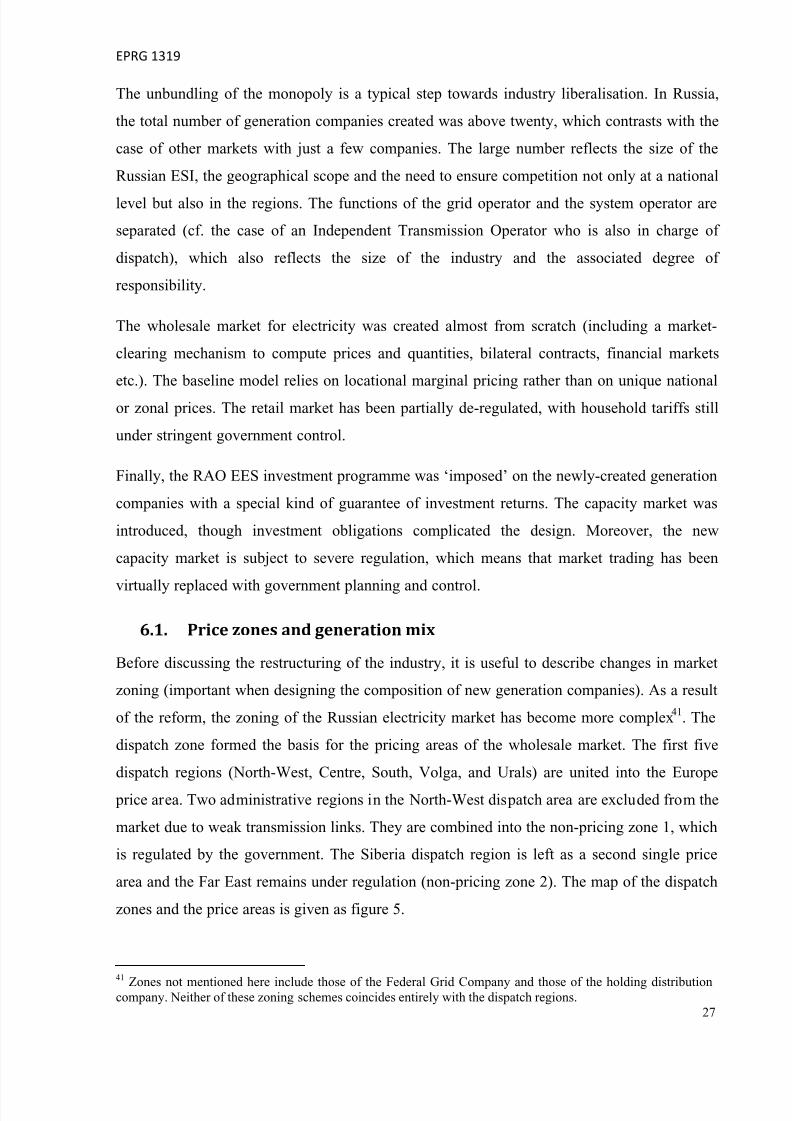
Figure 5.Russian wholesale market. Pricing and non-pricing zones.
The total installed capacity of the industry in 2010 reached 230 GW. The overall generation
mix in the industry has largely remained unchanged. The European price area has 144 GW,
and the Siberia price area 39.5 GW (the rest belongs to the non-pricing zones). The
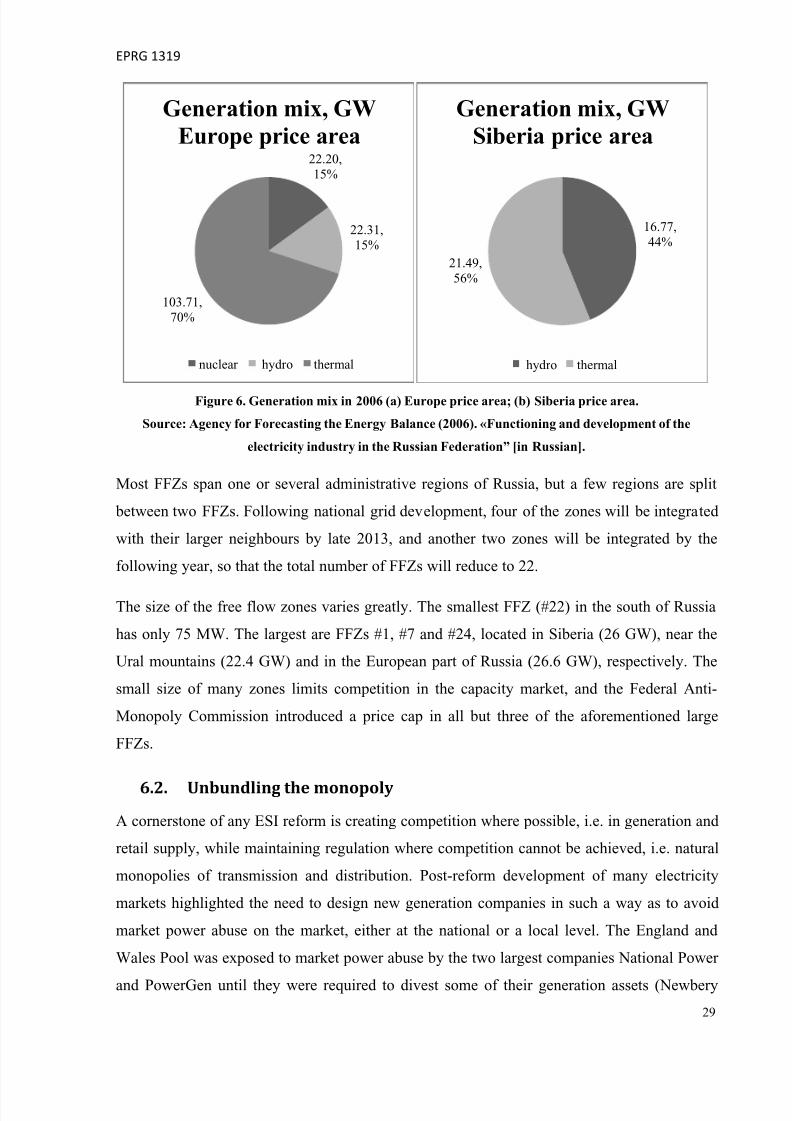
distribution of generation by type in each area is shown in figure 6. The ‘European’ zone
houses all three main types of technology, with predominantly gas-fired thermal stations. The
‘Siberian’ zone does not have nuclear stations, yet it is rich with hydro resources and its
thermal power plants are mostly coal-fired.
The two pricing zones are further subdivided into 28 free flow zones (FFZ), of which 6
belong to Siberia and 22 are located in Europe. The zones are defined on the basis of
transmission constraints. Inside the FFZ, energy trading is not limited, but the flow between
the zones inbounded by the capacity of major transmission lines. The transmission constraints
for electricity flows and capacity flows are different. Given the geographical location of the
FFZs, only 102 export-import lines can possibly exist. Data from the Commercial Operator
shows that eighty-five lines are currently active (with positive flows on several days in the
year).
Price zone ‘Europe’
Price zone ‘Siberia’ Non‐ rice zone 2
Non‐price zone 1
7/23/2019 Chernenko, Nadia. The Russian Electricity Supply Industry. From Reform to Reform_October 2013
http://slidepdf.com/reader/full/chernenko-nadia-the-russian-electricity-supply-industry-from-reform-to-reformoctober 32/66
EPRG 1319
29
Figure 6. Generation mix in 2006 (a) Europe price area; (b) Siberia price area.
Source: Agency for Forecasting the Energy Balance (2006). «Functioning and development of the
electricity industry in the Russian Federation” [in Russian].
Most FFZs span one or several administrative regions of Russia, but a few regions are split
between two FFZs. Following national grid development, four of the zones will be integrated
with their larger neighbours by late 2013, and another two zones will be integrated by the
following year, so that the total number of FFZs will reduce to 22.
The size of the free flow zones varies greatly. The smallest FFZ (#22) in the south of Russia
has only 75 MW. The largest are FFZs #1, #7 and #24, located in Siberia (26 GW), near the
Ural mountains (22.4 GW) and in the European part of Russia (26.6 GW), respectively. The
small size of many zones limits competition in the capacity market, and the Federal Anti-
Monopoly Commission introduced a price cap in all but three of the aforementioned large
FFZs.
6.2.
Unbundling the
monopoly
A cornerstone of any ESI reform is creating competition where possible, i.e. in generation and
retail supply, while maintaining regulation where competition cannot be achieved, i.e. natural
monopolies of transmission and distribution. Post-reform development of many electricity
markets highlighted the need to design new generation companies in such a way as to avoid
market power abuse on the market, either at the national or a local level. The England and
Wales Pool was exposed to market power abuse by the two largest companies National Power
and PowerGen until they were required to divest some of their generation assets (Newbery
22.20,15%
22.31,15%
103.71,70%
Generation mix, GW
Europe price area
nuclear hydro thermal
16.77,44%
21.49,56%
Generation mix, GW
Siberia price area
hydro thermal
7/23/2019 Chernenko, Nadia. The Russian Electricity Supply Industry. From Reform to Reform_October 2013
http://slidepdf.com/reader/full/chernenko-nadia-the-russian-electricity-supply-industry-from-reform-to-reformoctober 33/66
EPRG 1319
30
2002). The Spanish ESI restructuring did not involve strict ownership separation in
generation, distribution and upstream fuel production, but only the separation of accounts, so
the market is highly concentrated, with the two major firms, Endesa and Iberdrola, controlling
over 70% of generation assets.
Since the Russian electricity industry is on a larger scale than any other European market,
having a few dominant companies would greatly exacerbate the market power problem.
Consequently, the composition of new generation companies, or in other words the
distribution of existing power plants among them, had to be carefully designed. Apart from
geographical location, technology (in particular combined heat and power - CHP), fuel use
and plant size must also be considered. The specificity of CHP means that local monopolies
on energy production cannot be entirely avoided and some companies end up endowed with
groups of local CHP stations.
The hydropower station represents a large fixed asset, with a significant fixed cost (as
compared to thermal power plants). There was political fear that no private investor would be
able to properly finance the maintenance expenditure, hence the idea to keep the sector under
government control. The initial plan of the reform was to create four companies, one per
hydro-station cluster, but eventually one state-owned company was formed. The company
now manages the plants in Siberia, in the Volga region and in the south of Russia. Thestations in Karelia were transferred to a private generation company (TGC-1).Nuclear
generation remained under government control, albeit reorganised from a government agency
into a state-owned company.
The restructuring of the industry was largely completed by 2008, when the new companies
were legally singled out of the monopoly and RAO EES ceased to exist as a separate entity.
The current structure of the wholesale market incorporates generation companies, large
business customers and retail suppliers. The market is run by the Administrator of the Trading
System (as Commercial Operator) and the System Operator. The ATS is broadly responsible
for the electricity market and for commercial transactions between market players. The
System Operator surveys the technical parameters of the system and organises the capacity
market. Large business customers (with aloud above 750 kVA) are entitled to enter the
wholesale market directly and buy electricity from the generation companies. The retail
suppliers sell the energy to residential and small business customers.
7/23/2019 Chernenko, Nadia. The Russian Electricity Supply Industry. From Reform to Reform_October 2013
http://slidepdf.com/reader/full/chernenko-nadia-the-russian-electricity-supply-industry-from-reform-to-reformoctober 34/66
EPRG 1319
31
After reforming RAO EES, the following companies were created:
• 6 wholesale generation companies. Each consists of large thermal stations only, which
are dispersed across the country, i.e. in different free flow zones. The WGCs have
between 8.3 and 9.2 GW.• 14 territorial generation companies. Each company spans one or several administrative
regions and is typically located within one free flow zone. Assets include small
thermal stations, small hydro stations, combined heat and power plants, and district
heating boilers. Installed capacity of the TGCs varies from 600 MW up to 11 GW.
• RusHydro - a state-owned generation company that controls the hydro stations of
Russia (25.5 GW in total).
•
RosEnergoAtom - a state-owned company that manages ten nuclear stations of 22.25GW in total.
• InterRAO - a state-owned company that has monopoly over the export-import
operations and owns a number of small plants near the state borders.
The independent energo companies continue to operate on the restructured wholesale market.
To comply with the industry reform, the companies had to divest generation and network and
form legally independent entities (ownership of capital has not been completely separated).
The companies are NovosibirskEnergo, IrkutskEnergo , TatEnergo , and BashkirEnergo. Their
total capacity is 26.7 GW.
Despite efforts to create ex ante competition, the new industry structure looks quite
concentrated. The HHI based on installed capacity varies from 1,466 up to 10,000 across the
free flow zones (these zones are critical for the capacity market; see below). The median
value is 3,914. Out of 29 free flow zones, only six have an index below 2,500 - these zones
are large in size and have a sufficient number of producers. Three FFZs have only one station
each.
As for the owners of the new generation companies, the main stakeholder turns out to be the
federal government. The WGC-1 did not attract private investment and remained a state
property. The second and sixth WGCs were bought by Gazprom, the gas monopoly, and later
merged into a single company. The major shareholders of the Third wholesale company
became Norilsk Nickel (a Russian ore producer). The fourth and fifth WGCs were sold to
7/23/2019 Chernenko, Nadia. The Russian Electricity Supply Industry. From Reform to Reform_October 2013
http://slidepdf.com/reader/full/chernenko-nadia-the-russian-electricity-supply-industry-from-reform-to-reformoctober 35/66
EPRG 1319
32
E.On (Germany) and Enel (Italy), respectively. Some of the territorial generation companies
were acquired by Gazprom, including one of the largest – MosEnergo (or TGC-3). The
private energy holding IES secured control of capital in four TGCs (numbered 5, 6, 7 and 9),
as well as minor shares in other generation companies. Only one foreign company invested in
TGC: Fortum (Finland) bought shares in TGC-1 and secured full control in TGC-10.
The merger and acquisition wave that followed initial restructuring narrowed the pool of
investors. The lead part in the merger wave belongs to state-owned companies Gazprom and
InterRAO. Gazprom merged its two subsidiaries (the Second and Sixth WGCs) into one
company. InterRAO, initially a small producer, acquired controlling shares in the first and
third WGCs, as well as in TGC-11 (with 19.6 GW in total). The company also has non-
controlling but significant shares (20-40%) in five other companies, with a total capacity of
35.2 GW. All the merged or acquired companies are located in different market zones, so the
post-merger HHI did not change much, with the lowest value now being 1,628 but the median
value remaining the same 3,914. Yet, the situation might change if and when some zones are
integrated with each other (as a result of grid development).
To summarise, despite extensive privatisation the government controls directly or indirectly,
via Gazprom and InterRAO, over 50% of the newly created companies. The remaining
capacity is distributed between a few private shareholders. Given the high concentration ofownership, it is doubtful whether the declared goal of developing competition in the industry
has been achieved.
6.3.
Transmission and distribution. Last -mile contract.
The transmission network was subject to substantial restructuring during the reform. Two
companies were singled out of the RAO EES monopoly and the former energo companies.
The first, the Federal Grid Company (FSK, in the Russian abbreviation), became responsible
for the high-voltage grid (330kV and above), but also for the 220kV lines that were
transferred to it from the former energos. The second company, Holding MRSK, is in charge
of the distributional network across the whole country (lines of 150kV and below). Holding
MRSK is not an integrated company but consists of 11 regional distribution companies
(labelled MRSK in Russian). Both companies belong to the federal government42.
42
FSK and Holding MRSK have recently been merged into one company “Russian Network”, thus the entirenetwork has been consolidated.
7/23/2019 Chernenko, Nadia. The Russian Electricity Supply Industry. From Reform to Reform_October 2013
http://slidepdf.com/reader/full/chernenko-nadia-the-russian-electricity-supply-industry-from-reform-to-reformoctober 36/66
EPRG 1319
33
There was no special regulation of the transmission charges within the RAO EES monopoly.
However, two network companies, being both natural monopolies, necessarily require explicit
price regulation for the service they provide. The Federal Tariff Service (a new regulatory
body in lieu of the FEC) now approves the relevant tariffs, which are the connection charge
and the transmission charge.
The connection charge is paid only once by the consumer, depending on the amount of load
added to the grid. The payment only covers the direct cost of linking a new customer to the
nearest substation. The tariff for connection is pre-set for the low-voltage network and small
load (i.e. small businesses and households). The charge for larger customers depends on the
amount of load, the grid voltage and other technical parameters, which leads to almost
individual pricing. There have been numerous complaints that the resulting connection cost is
often too high, to such an extent that some industrial users find it more profitable to build
their own generator and sell the residual energy to small local consumers43.
The tariff for transmission was until recently set on a cost-plus basis. From 2010 the Federal
Grid Company and some distribution companies moved to the RAB-based tariffs44 that allow
faster recovery of investment expenditures. Currently, the norm of the investment return for
these companies is set at nominal11%. As a result of the RAB-methodology, transmission
charges have increased significantly, which in turn translate into the upsurge of retail tariffs.
The pricing for connection and transmission, apart from being unclear and excessive, hides
another problem, that of the cross-subsidy. Before the reform, higher wholesale tariffs for
large customers were established, so as to subsidise residential energy consumption. With the
wholesale de-regulation of the market, a price distortion could no longer be implemented, so
the cross-subsidy scheme became more sophisticated. The scheme is now known as the last-
mile contract and the practice is officially fixed by a Government resolution45.
Most industrial users are directly connected to the high-voltage transmission grid, which
belongs to the Federal Grid Company. Normally, the user would pay for the relevant
transmission to the grid company at its tariff. Now, the last mile of the high voltage grid is
rented out to the local distribution network. The user is forced to pay transmission charges to
43Business World Agency. 25th January 2010 “Rossiya: Proryv Tarifa” [in Russian; accessed via Factiva]44The Federal Government and the Federal Tariff Service have already adopted the necessary legislation, andsome regional distribution companies have tried using the new method.http://www.holding-mrsk.ru/clients/rab/ [in Russian]45
Government resolution No. 1173 issued on 27.12.2010 “On the lease of the objects of the national electricitygrid to the territorial network companies”.
7/23/2019 Chernenko, Nadia. The Russian Electricity Supply Industry. From Reform to Reform_October 2013
http://slidepdf.com/reader/full/chernenko-nadia-the-russian-electricity-supply-industry-from-reform-to-reformoctober 37/66
EPRG 1319
34
the distribution company at the appropriate tariff, which is generally higher than that of the
grid company. Thus, extra revenue is generated simply from the difference in tariffs, and the
revenue goes to the distribution company to keep the prices low for households. The amount
of cross-subsidy in 2010 is quoted as varying from 60 to 200 billion Roubles ($2 to $6.7
billion)46. Some industrial consumers tried, successfully or not, to appeal in court against the
obligation of the last-mile rule, hoping to enforce a direct contract with the Federal Grid
Company47.
6.4.
Fuel supply
There are two main features of fuel supply in the Russian ESI. First, the gas industry is
dominated by a monopoly under government regulation (for both prices and volumes of
consumption), which obviously distorts the fuel markets. Second, vertical integration betweenfuel suppliers and some generation companies was not prevented at the privatisation phase
and it appears to create favourable conditions for some generators (although the benefits of
integration appear to be outweighed by other negative factors).
Roughly 70% of generation in Russia is thermal; two thirds of it is gas-fired while the rest is
coal-fired (hard coal or brown coal). Coal mines are found predominantly in southern Siberia
(Kuzbass area) and in north-eastern Kazakhstan (Ekibastuz mines), so most coal-fired stations
are concentrated in the south of Siberia. Gas-fired power plants dominate the European part of
Russia, supplied by a developed pipeline network from major gas fields found in the north
areas of Siberia. The gas industry in Russia is monopolistic and the prices are regulated by the
government, whereas the coal industry is oligopolistic and operates mostly under long-term
privately negotiated contracts.
The gas industry is dominated by Gazprom, a state-owned monopoly, with the remaining
supply being produced by smaller gas and oil companies (associated petroleum gas). The
electricity supply industry consumes c. 43% of total gas production (Gas strategy 2030);
Gazprom supplies c. 28% of its production to the ESI. Gazprom prices, or tariffs, are
regulated by the government and are differentiated by region. According to various estimates,
the tariffs are too low compared to their European counterparts (the so-called "netback value"
46Various estimates were quoted in the media but no formal calculation was ever presented.47
Successful publicised case of the legal battle against the last-mile contract is the Rusal aluminium company vs.MRSK (distribution company) of Siberia. Unsuccessful case is the SUAL coal company vs. MRSK of Ural.
7/23/2019 Chernenko, Nadia. The Russian Electricity Supply Industry. From Reform to Reform_October 2013
http://slidepdf.com/reader/full/chernenko-nadia-the-russian-electricity-supply-industry-from-reform-to-reformoctober 38/66
EPRG 1319
35
comparison, see Tsygankova 2008, Stern et al. 2009)48.Gas consumption is regulated by the
government: any customer, including power stations, has a pre-set annual amount, which it
prices at the tariff level. Any amount above the quota can be purchased from Gazprom at
commercial (negotiated) prices or from independent suppliers. The proportion of quota (or
limited) gas, commercial gas from Gazprom and gas from independent suppliers varies
greatly from one generation company to another.
At the start of privatisation of RAO EES, the government signed five-year contracts between
Gazprom and generation companies, which in the short-term secured the positions of the gas
monopoly in the electricity industry. However, many generation companies complained about
Gazprom's inflexible price policy: the gas monopolist insists on “take-or-pay” contracts and
charges highly for above-quota gas. Not surprisingly, when the contracts expired some
generation companies preferred to switch to alternative suppliers: WGC-1, WGC-5 and TGC-
10 signed long-term agreements with independent gas producers, Novatek and Rosneft.
Interestingly, MosEnergo (TGC-3), controlled by Gazprom, also switched part of its supply
(roughly 1/3) from Gazprom to Novatek.
Whether low gas tariffs are problematic in the long-run is an open question and is related to
issues of plant efficiency and carbon policy. Low tariffs influence investment decisions by
stimulating construction of gas-fired power plants. However, existing thermal plants inRussia, whether coal-fired or gas-fired, typically have low to moderate thermal efficiency, up
to 40-42%. New owners of generation companies invest in CCGT technology with high
efficiency, which is more resilient against gas price increases or possible carbon taxes.
Owners of coal-fired power plants also aim at improving efficiency, and may be more
competitive should the gas market be liberalised (although not so competitive if carbon taxes
were introduced in the industry).
Lower gas tariffs in Russia, as compared to domestic coal prices to European export gas
prices, give the existing (relatively inefficient) thermal generation in Russia a great cost
advantage. The entry of efficient and compact CCGT power plants which was observed in
many port-reformed markets elsewhere is practically absent in Russia: the share of the CCGT-
based capacity is c. 3-5% of the industry and would probably remain at this level for the next
decade.
48Although there are objections to these estimates that in gas-abundant Russia gas tariffs may be lower than gas
prices in gas-deficit Europe, there is no reason why gas should be cheap per se, e.g. in extremely cold winter thegas price might be very high.
7/23/2019 Chernenko, Nadia. The Russian Electricity Supply Industry. From Reform to Reform_October 2013
http://slidepdf.com/reader/full/chernenko-nadia-the-russian-electricity-supply-industry-from-reform-to-reformoctober 39/66
EPRG 1319
36
In addition to gas market distortions, vertical integration between fuel suppliers and
generation companies may act as yet another impediment to the development of the electricity
industry. The integration process works both ways: fuel producers acquire control over
generation companies, while some generation companies buy fuel sources (e.g. coal mines).
Examples of the first type of integration have already been presented: Gazprom invested
heavily in generation companies (WGC-2 and 6, TGC-1 and 3); the Russian coal company
SUEK acquired shares in TGC-12 and TGC-13; the holding company IES controls both
generation assets as well as the gas and oil producer company TNK-BP which facilitates fuel
supplies from TNK-BP to generation companies. An example of the second type of
integration is given by WGC-3, which bought a coal mine near one of its stations. The coal
mine and the station were built in the Soviet period as two parts of one technological process,
the coal mine and the station thus being in a monopoly-monopsony relationship.
Given the monopoly on the gas market, vertical integration between fuel producers and
generation companies may put at risk competition in the long-run. Gazprom, as the owner of
generation companies, secures its supply, but may prevent its subsidiaries from finding the
most efficient solutions, and thus limit overall potential for improving market efficiency.
Moreover, as the sole owner of the gas pipeline network, Gazprom may constrain the supply
of independent producers if it feels that they threaten its own positions on the gas market.
6.5. Retail companies
The retail suppliers were formed from the remainders of the energos and kept the term
‘energo’ in the title. Their primary role is electricity sales to residential and small commercial
customers. Like the energy sold to large consumers, the energy sold on the wholesale market
to a retail supplier and designated for smaller commercial customers, can be priced in a free
manner. The energy sold to a retail supplier and designated for households is traded under
regulated contracts. Consequently, the Federal Tariff Service continues to set wholesale tariffs
for any power station as it might (and would eventually) supply residential demand. Note that
the tariff is not a price cap, as it applies to the whole volume of such demand.
As for the price customers pay, households are charged an average tariff based on energy
consumption and capacity needs. The tariff for households is set by regional energy
commissions. Small commercial customers may choose one-tier (average) or two-tier
(separate) pricing, as well as time-differentiated or time-uniform pricing, subject to installing
necessary metering equipment. The prices vary depending on the amount of energy contracted
7/23/2019 Chernenko, Nadia. The Russian Electricity Supply Industry. From Reform to Reform_October 2013
http://slidepdf.com/reader/full/chernenko-nadia-the-russian-electricity-supply-industry-from-reform-to-reformoctober 40/66
EPRG 1319
37
(e.g. 4500 or 6500 MWh per year) and on the possibility of paying for deviations from the
scheduled consumption.
Each administrative region of Russia has one or several guaranteed retail suppliers who
cannot refuse to provide energy to any customer (as opposed to non-guaranteeing/privatesuppliers). Currently, any region has 2-4 guaranteeing suppliers, which provides a basis for
competition among them (not only vis-à-vis private retail companies). The competition matter
is quite important, as guaranteed suppliers currently buy up to 75% of electricity on the
wholesale market on a winter day and 58% on a summer day.
As for ownership, the consolidation of assets anticipated in the early reform plans gradually
took place. Direct ownership of retail companies by generators is not permitted, but the
shareholders of generators may acquire the capital of retail companies.
The financial situation of the all-retail suppliers is under constant risk because of the cash gap.
Payments to the wholesale market have to be cleared the next trading day, whereas retail
customers have 45 days to pay their bill. Suppliers have to rely on credit lines, and include
interest in the retail price.
The guaranteeing suppliers still suffer from the non-payment issue. Since they cannot refuse
service to any customer, the latter might abuse their rights and delay bill payment as long as possible. Often, such problematic customers are local authorities and municipal enterprises
who cannot be disconnected from the grid for the reason of social security.
6.6.
Advances in regulation
To improve the regulatory mechanism, a new body, the Federal Tariff Service (FTS), was
established in 2004 49 . In the electricity industry, the FTS replaced the Federal Energy
Commission and became broadly responsible for the same amount of work: setting guidelines
for tariff formation, as well as the tariffs themselves. The Federal Tariff Service preserved the
two-tier structure of tariffs, so that the electricity tariff reflects the variable cost of production
whereas the capacity charge (increased substantially in comparison with the fixed part of the
tariff in ‘90s) covers the replacement cost of the equipment.
The Regional Energy Commissions (RECs) have been preserved, although their privileges
have been greatly reduced. To avoid huge discrepancies in tariffs throughout the country and
49 Government resolution No. 332 issued on 30.06.2004 “On the Federal Tariff Service”.
7/23/2019 Chernenko, Nadia. The Russian Electricity Supply Industry. From Reform to Reform_October 2013
http://slidepdf.com/reader/full/chernenko-nadia-the-russian-electricity-supply-industry-from-reform-to-reformoctober 41/66
EPRG 1319
38
between neighbouring regions, FTS now sets maximum and minimum tariffs for each region,
so that a REC can only adopt local tariffs within the prescribed limits. In this way, FTS, being
the regulator of a single market, enjoys much broader authority over local regulators, unlike
e.g. FERC in the United States, where FERC is responsible chiefly for the general oversight
of multiple electricity markets and inter-market communication.
Although the FTS advanced tariff-setting procedures and regularly increased nominal tariffs,
the issue of cost recovery was still critical. According to the author’s estimates50, electricity
tariffs for power stations might constitute only 50-90% of actual operational expenses. It
appears that wholesale tariffs were, in general, insufficient to cover the variable costs of the
generating companies. The issue was not resolved, but rather ‘disappeared’ from the agenda,
when the market was liberalised and moved to free pricing. However, initially low tariffs led
to unavoidable price increases, which provoked dissatisfaction and criticism among public
and political forces, albeit without much practical consequence.
6.7. New wholesale market: liberalisation and trading rules
An important part of the reform was the re-organisation of the wholesale market FOREM
( federal wholesale electricity and capacity market) into N OREM ( new [...]), under the
supervision of the newly created non-profit partnership Market Council. The new market
began its operation in September 2006 (initially with trading under tariffs only).
The market design had to be completely revised. The system created in the 1990s gave
priority to dispatch rules that balanced the physical flows of electricity, whereas the energy
exchange served only as a place for clearing payments at regulated prices. Although called a
market, such a system did not allow for the free choice of a counterparty, prices or quantities
to buy/sell, and hence was obviously inefficient. The aim of the reform was to introduce
proper trading, where the players would have freedom both in making bids and/or signing
bilateral contracts, and where the dispatch schedule follows their choice.
The Market Council, in conjunction with the Administrator of the Trade System (Commercial
Operator) and the System Operator, elaborates the rules and procedures both for energy and
capacity markets. Electricity trading now takes place on the one-day-ahead and balancing (or
real-time) market. Capacity is traded separately in annual auctions with monthly prices. There
50
Unpublished Master thesis. Estimates were made for the six power stations of the Third Wholesale GenerationCompany (WGC-3).
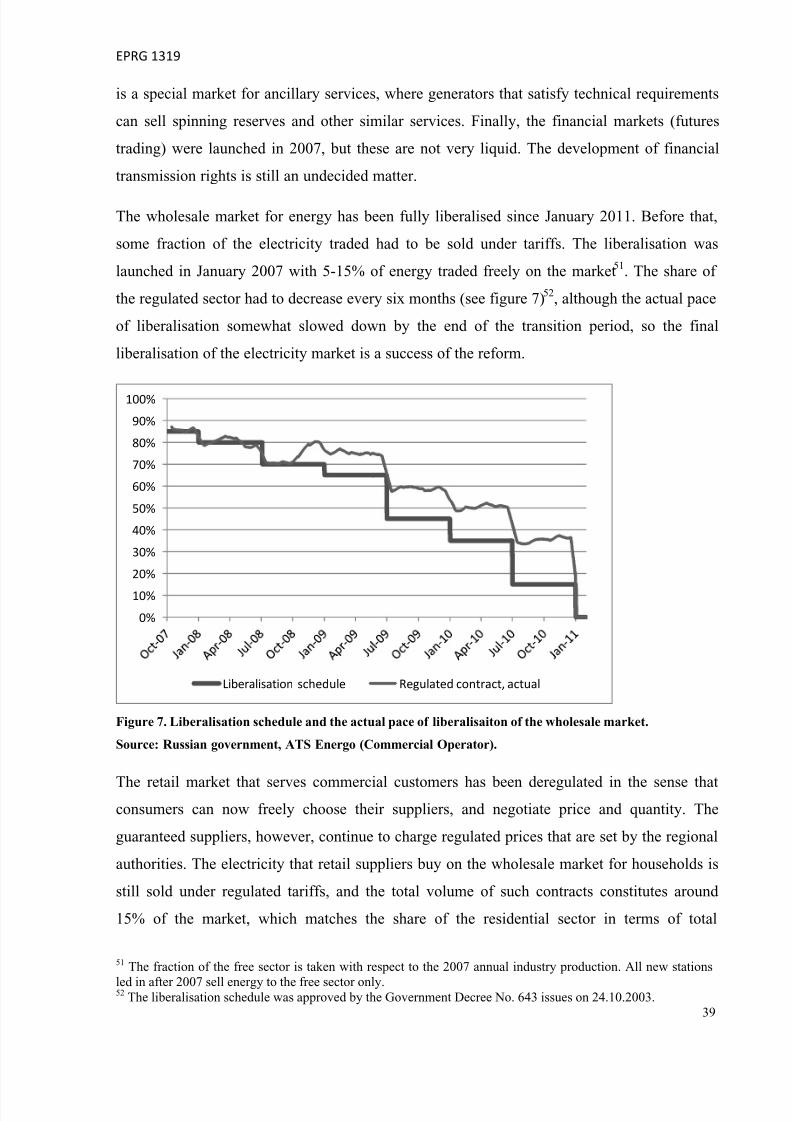
7/23/2019 Chernenko, Nadia. The Russian Electricity Supply Industry. From Reform to Reform_October 2013
http://slidepdf.com/reader/full/chernenko-nadia-the-russian-electricity-supply-industry-from-reform-to-reformoctober 42/66
EPRG 1319
39
is a special market for ancillary services, where generators that satisfy technical requirements
can sell spinning reserves and other similar services. Finally, the financial markets (futures
trading) were launched in 2007, but these are not very liquid. The development of financial
transmission rights is still an undecided matter.
The wholesale market for energy has been fully liberalised since January 2011. Before that,
some fraction of the electricity traded had to be sold under tariffs. The liberalisation was
launched in January 2007 with 5-15% of energy traded freely on the market51. The share of
the regulated sector had to decrease every six months (see figure 7)52, although the actual pace
of liberalisation somewhat slowed down by the end of the transition period, so the final
liberalisation of the electricity market is a success of the reform.
Figure 7. Liberalisation schedule and the actual pace of liberalisaiton of the wholesale market.
Source: Russian government, ATS Energo (Commercial Operator).
The retail market that serves commercial customers has been deregulated in the sense thatconsumers can now freely choose their suppliers, and negotiate price and quantity. The
guaranteed suppliers, however, continue to charge regulated prices that are set by the regional
authorities. The electricity that retail suppliers buy on the wholesale market for households is
still sold under regulated tariffs, and the total volume of such contracts constitutes around
15% of the market, which matches the share of the residential sector in terms of total
51 The fraction of the free sector is taken with respect to the 2007 annual industry production. All new stations
led in after 2007 sell energy to the free sector only.52 The liberalisation schedule was approved by the Government Decree No. 643 issues on 24.10.2003.
0%
10%
20%
30%
40%
50%
60%
70%
80%
90%
100%
Liberalisation schedule Regulated contract, actual
7/23/2019 Chernenko, Nadia. The Russian Electricity Supply Industry. From Reform to Reform_October 2013
http://slidepdf.com/reader/full/chernenko-nadia-the-russian-electricity-supply-industry-from-reform-to-reformoctober 43/66
EPRG 1319
40
electricity consumption, namely 16% (cf. 26% in Europe). The liberalisation of the retail
market that serves households was planned for the year 2011, but was postponed until 2014
(and there is a risk of further delay).
Market players can privately negotiate free contracts for energy, with a fixed or variablesupply schedule. Free contracts can be used to cover regulated sales, and may include both
energy and capacity. Standardised free contracts are traded on the Moscow Energy
Exchange53.
Non-contracted energy is offered on the day-ahead market54. Market participants must submit
bids to the ATS by 13.00 Moscow time the preceding day, and the System Operator provides
the relevant technical information. ATS then solves the computational model for the 24 hours
of the following day to define equilibrium hourly prices and quantities. ATS returns the
individual results to the market players by 16.00; the final aggregate data is published on the
ATS web-site by 19.00. The balancing market operates on the day of actual energy production
and consumption, and the financial settlement takes place the following day.
On the day-ahead market, generators are required to bid at variable cost (in particular for fuel
expenses)55, while the fixed cost is recovered on the capacity market. A specific variable
generation cost (e.g. start-up time, minimal running time) is not incorporated into the price
component of the bid, but comprises the third part of the bid. The Federal Anti-Monopoly
Commission is entitled to monitor bidding and may (indeed, does) impose fines on those
violating the rule56.
Given the large scale of the industry and the territory, the computational model is based on
nodal pricing, or equivalently locational marginal pricing, LMP. The total number of nodes is
around 700057. The model incorporates price-quantity bids, the forecast of consumption,
transmission constraints and various technical requirements (minimum production, ramp-up
speed etc.) Given the consumer bids <bcons
, Qcons
> and producer bids <bprod
, Qprod
>, the
objective function is formulated as Σi (bicons
* Picons
–biprod
* Piprod
) –> max {Picons
, Piprod
},
53 http://www.arena-trade.ru/eng/54 Regulation No. 7 of the NOREM “Competitive selection of the price bids for the day ahead”55 Irish electricity market has a similar requirement, see Bidding Code of Practice (2007), Single ElectricityMarket Operator (Ireland), available at[www.allislandproject.org/GetAttachment.aspx?id=6ce5b381-927e-4e4f-8642-341d53985720]56Successful cases against TGC-11 in 2008, MosEnergo in 2009 and BiyskEnergo (a small IPP) in 2010.57
The System Operator lists around 5700 nodes (by index), see, for example, http://monitor.so-ups.ru/Files/File.aspx?id=439. Approximately extra 2300 nodes are introduced in the model as ‘dummies’.
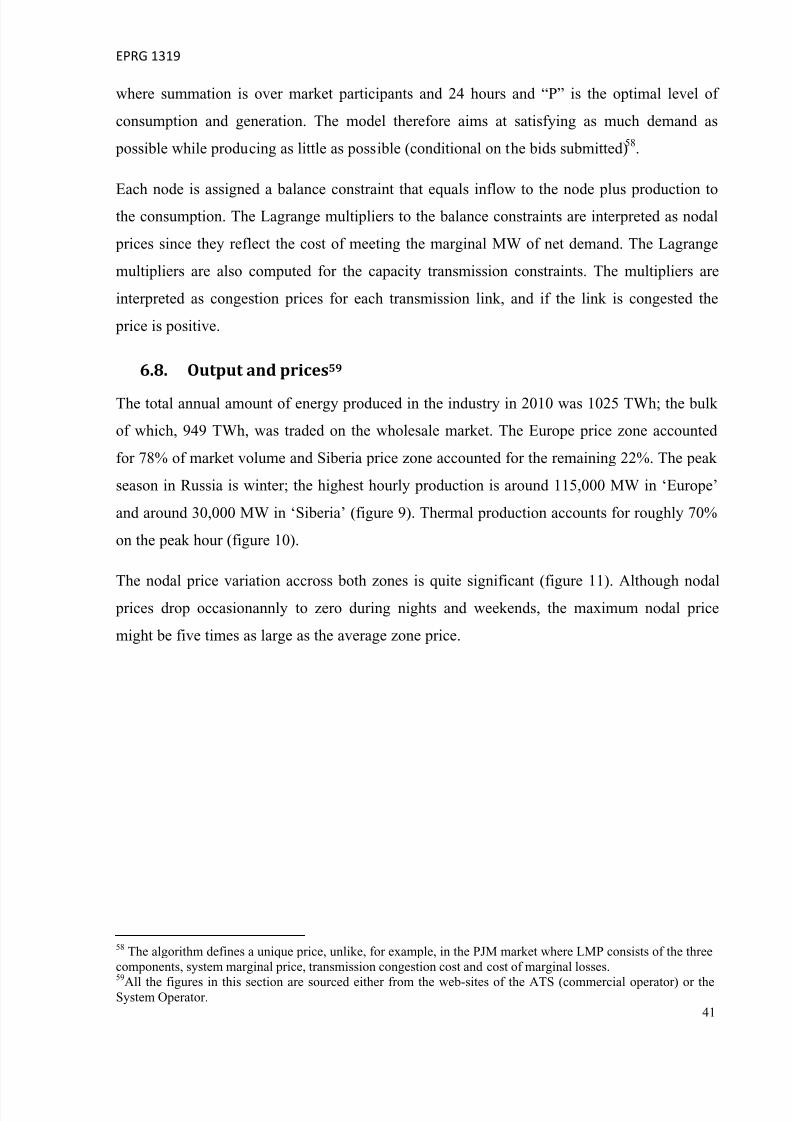
7/23/2019 Chernenko, Nadia. The Russian Electricity Supply Industry. From Reform to Reform_October 2013
http://slidepdf.com/reader/full/chernenko-nadia-the-russian-electricity-supply-industry-from-reform-to-reformoctober 44/66
EPRG 1319
41
where summation is over market participants and 24 hours and “P” is the optimal level of
consumption and generation. The model therefore aims at satisfying as much demand as
possible while producing as little as possible (conditional on the bids submitted)58.
Each node is assigned a balance constraint that equals inflow to the node plus production tothe consumption. The Lagrange multipliers to the balance constraints are interpreted as nodal
prices since they reflect the cost of meeting the marginal MW of net demand. The Lagrange
multipliers are also computed for the capacity transmission constraints. The multipliers are
interpreted as congestion prices for each transmission link, and if the link is congested the
price is positive.
6.8.
Output and prices59
The total annual amount of energy produced in the industry in 2010 was 1025 TWh; the bulk
of which, 949 TWh, was traded on the wholesale market. The Europe price zone accounted
for 78% of market volume and Siberia price zone accounted for the remaining 22%. The peak
season in Russia is winter; the highest hourly production is around 115,000 MW in ‘Europe’
and around 30,000 MW in ‘Siberia’ (figure 9). Thermal production accounts for roughly 70%
on the peak hour (figure 10).
The nodal price variation accross both zones is quite significant (figure 11). Although nodal
prices drop occasionannly to zero during nights and weekends, the maximum nodal price
might be five times as large as the average zone price.
58 The algorithm defines a unique price, unlike, for example, in the PJM market where LMP consists of the threecomponents, system marginal price, transmission congestion cost and cost of marginal losses.59
All the figures in this section are sourced either from the web-sites of the ATS (commercial operator) or theSystem Operator.
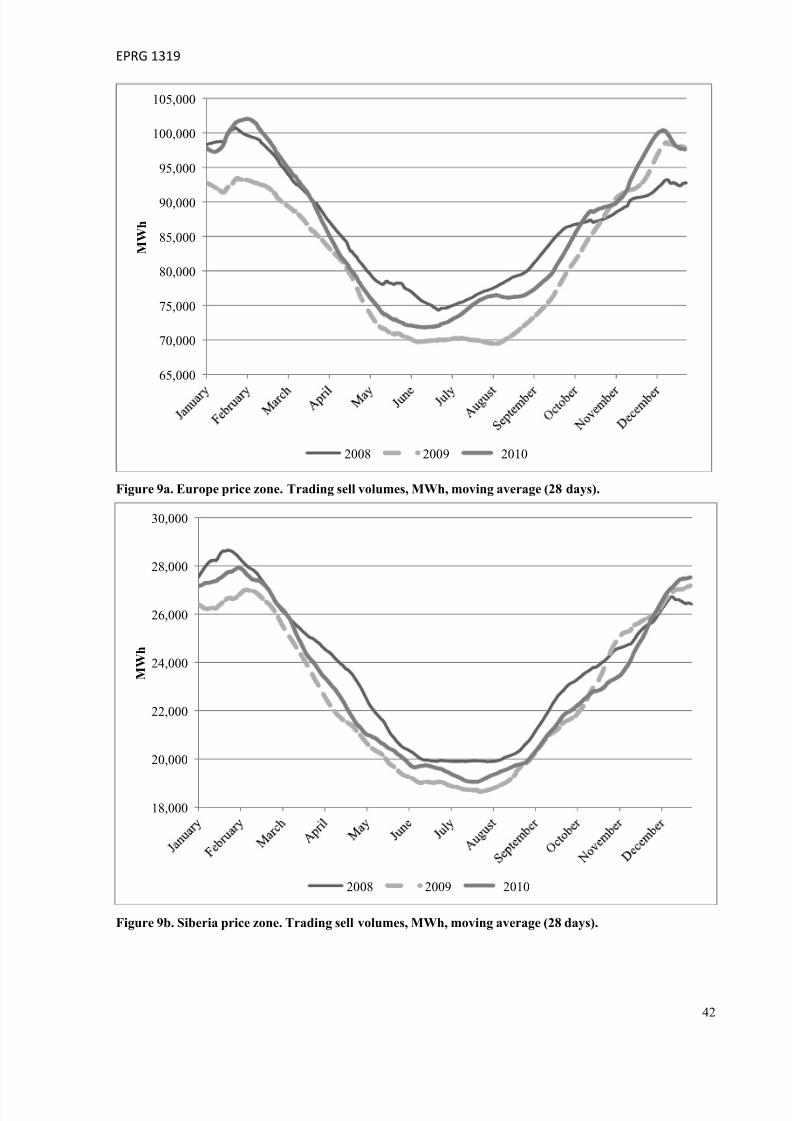
7/23/2019 Chernenko, Nadia. The Russian Electricity Supply Industry. From Reform to Reform_October 2013
http://slidepdf.com/reader/full/chernenko-nadia-the-russian-electricity-supply-industry-from-reform-to-reformoctober 45/66
EPRG 1319
42
Figure 9a. Europe price zone. Trading sell volumes, MWh, moving average (28 days).
Figure 9b. Siberia price zone. Trading sell volumes, MWh, moving average (28 days).
65,000
70,000
75,000
80,000
85,000
90,000
95,000
100,000
105,000
M W h
2008 2009 2010
18,000
20,000
22,000
24,000
26,000
28,000
30,000
M W h
2008 2009 2010
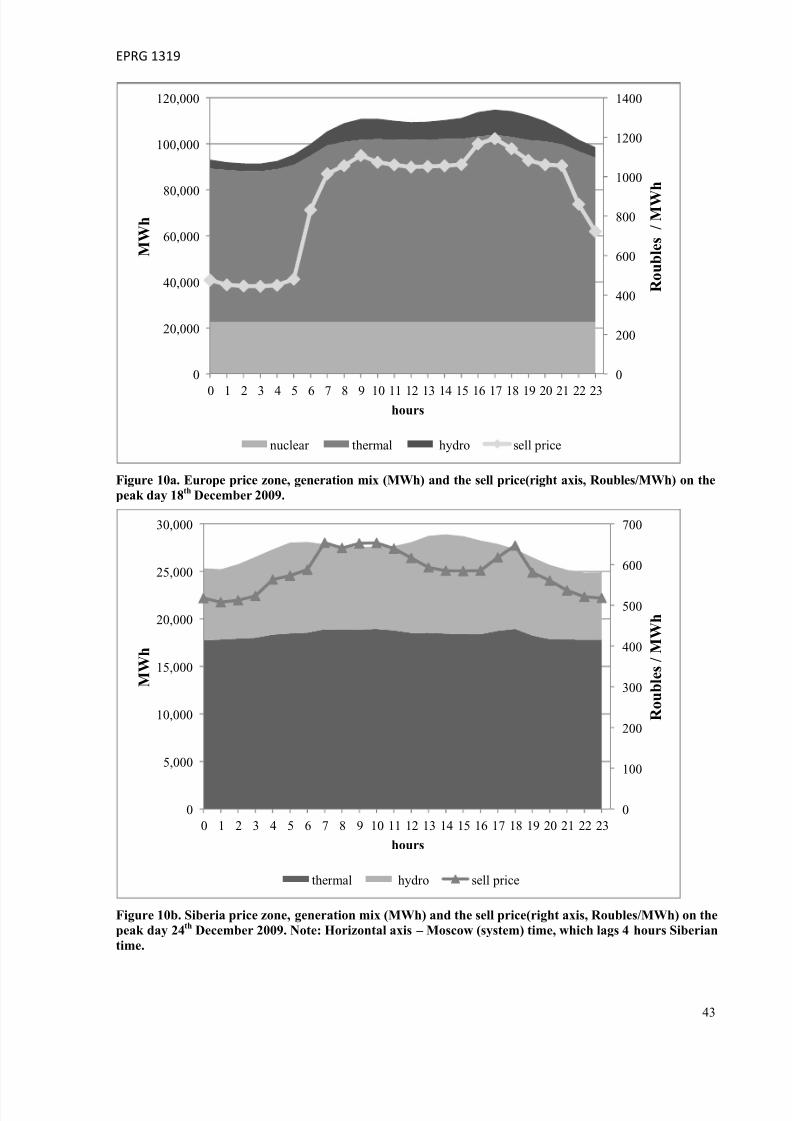
7/23/2019 Chernenko, Nadia. The Russian Electricity Supply Industry. From Reform to Reform_October 2013
http://slidepdf.com/reader/full/chernenko-nadia-the-russian-electricity-supply-industry-from-reform-to-reformoctober 46/66
EPRG 1319
43
Figure 10a. Europe price zone, generation mix (MWh) and the sell price(right axis, Roubles/MWh) on the
peak day 18th
December 2009.
Figure 10b. Siberia price zone, generation mix (MWh) and the sell price(right axis, Roubles/MWh) on the
peak day 24th
December 2009. Note: Horizontal axis – Moscow (system) time, which lags 4 hours Siberian
time.
0
200
400
600
800
1000
1200
1400
0
20,000
40,000
60,000
80,000
100,000
120,000
0 1 2 3 4 5 6 7 8 9 10 11 12 13 14 15 16 17 18 19 20 21 22 23
R o u b l e s / M W
h
M W h
hours
nuclear thermal hydro sell price
0
100
200
300
400
500
600
700
0
5,000
10,000
15,000
20,000
25,000
30,000
0 1 2 3 4 5 6 7 8 9 10 11 12 13 14 15 16 17 18 19 20 21 22 23
R o u b l e s / M W h
M W h
hours
thermal hydro sell price
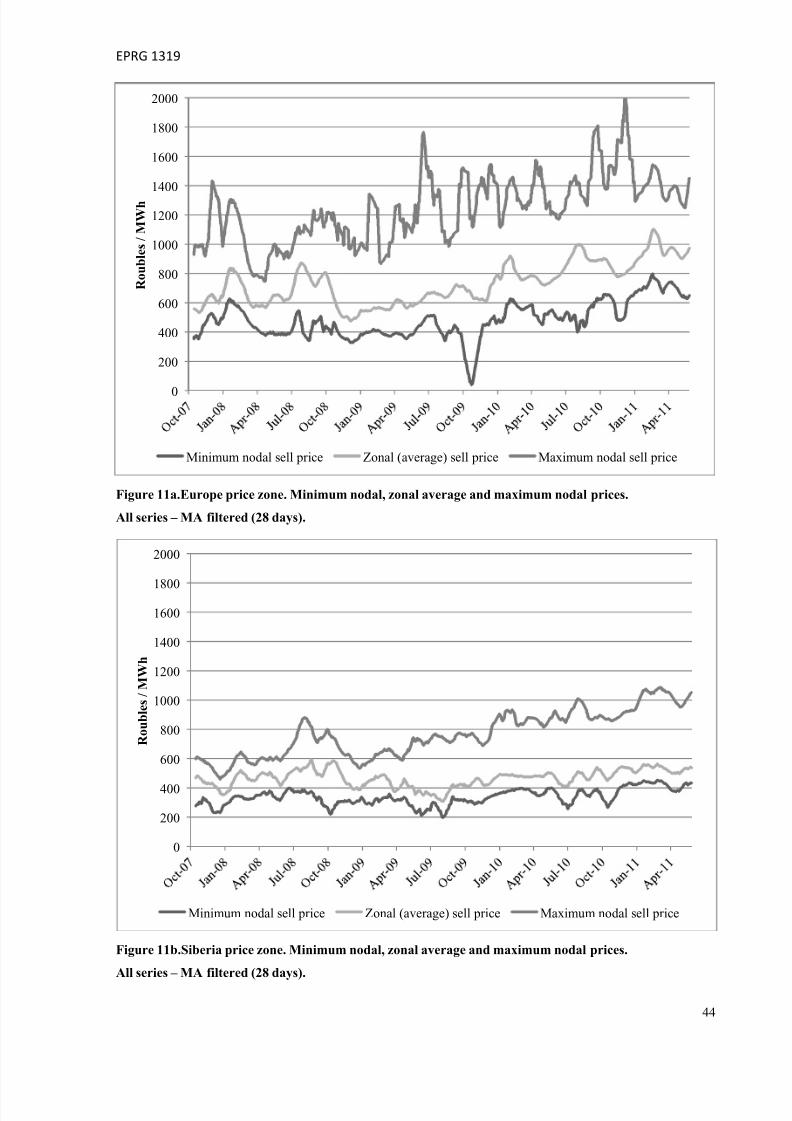
7/23/2019 Chernenko, Nadia. The Russian Electricity Supply Industry. From Reform to Reform_October 2013
http://slidepdf.com/reader/full/chernenko-nadia-the-russian-electricity-supply-industry-from-reform-to-reformoctober 47/66
EPRG 1319
44
Figure 11a.Europe price zone. Minimum nodal, zonal average and maximum nodal prices.
All series – MA filtered (28 days).
Figure 11b.Siberia price zone. Minimum nodal, zonal average and maximum nodal prices.
All series – MA filtered (28 days).
0
200
400
600
800
1000
1200
1400
1600
1800
2000
R o u b l e s / M W h
Minimum nodal sell price Zonal (average) sell price Maximum nodal sell price
0
200
400
600
800
1000
1200
1400
1600
1800
2000
R o u b l e s / M W h
Minimum nodal sell price Zonal (average) sell price Maximum nodal sell price
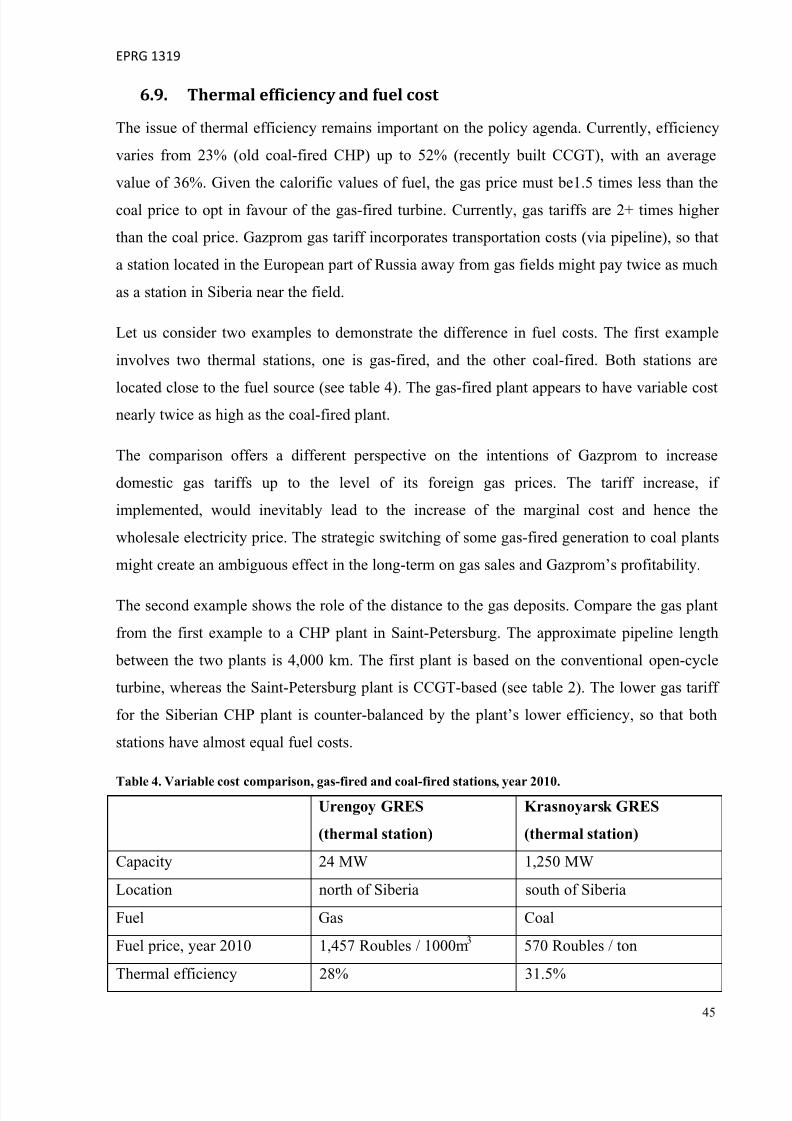
7/23/2019 Chernenko, Nadia. The Russian Electricity Supply Industry. From Reform to Reform_October 2013
http://slidepdf.com/reader/full/chernenko-nadia-the-russian-electricity-supply-industry-from-reform-to-reformoctober 48/66
EPRG 1319
45
6.9.
Thermal efficiency and fuel cost
The issue of thermal efficiency remains important on the policy agenda. Currently, efficiency
varies from 23% (old coal-fired CHP) up to 52% (recently built CCGT), with an average
value of 36%. Given the calorific values of fuel, the gas price must be1.5 times less than the
coal price to opt in favour of the gas-fired turbine. Currently, gas tariffs are 2+ times higher
than the coal price. Gazprom gas tariff incorporates transportation costs (via pipeline), so that
a station located in the European part of Russia away from gas fields might pay twice as much
as a station in Siberia near the field.
Let us consider two examples to demonstrate the difference in fuel costs. The first example
involves two thermal stations, one is gas-fired, and the other coal-fired. Both stations are
located close to the fuel source (see table 4). The gas-fired plant appears to have variable costnearly twice as high as the coal-fired plant.
The comparison offers a different perspective on the intentions of Gazprom to increase
domestic gas tariffs up to the level of its foreign gas prices. The tariff increase, if
implemented, would inevitably lead to the increase of the marginal cost and hence the
wholesale electricity price. The strategic switching of some gas-fired generation to coal plants
might create an ambiguous effect in the long-term on gas sales and Gazprom’s profitability.
The second example shows the role of the distance to the gas deposits. Compare the gas plant
from the first example to a CHP plant in Saint-Petersburg. The approximate pipeline length
between the two plants is 4,000 km. The first plant is based on the conventional open-cycle
turbine, whereas the Saint-Petersburg plant is CCGT-based (see table 2). The lower gas tariff
for the Siberian CHP plant is counter-balanced by the plant’s lower efficiency, so that both
stations have almost equal fuel costs.
Table 4. Variable cost comparison, gas-fired and coal-fired stations, year 2010.
Urengoy GRES
(thermal station)
Krasnoyarsk GRES
(thermal station)
Capacity 24 MW 1,250 MW
Location north of Siberia south of Siberia
Fuel Gas Coal
Fuel price, year 2010 1,457 Roubles / 1000m3 570 Roubles / ton
Thermal efficiency 28% 31.5%
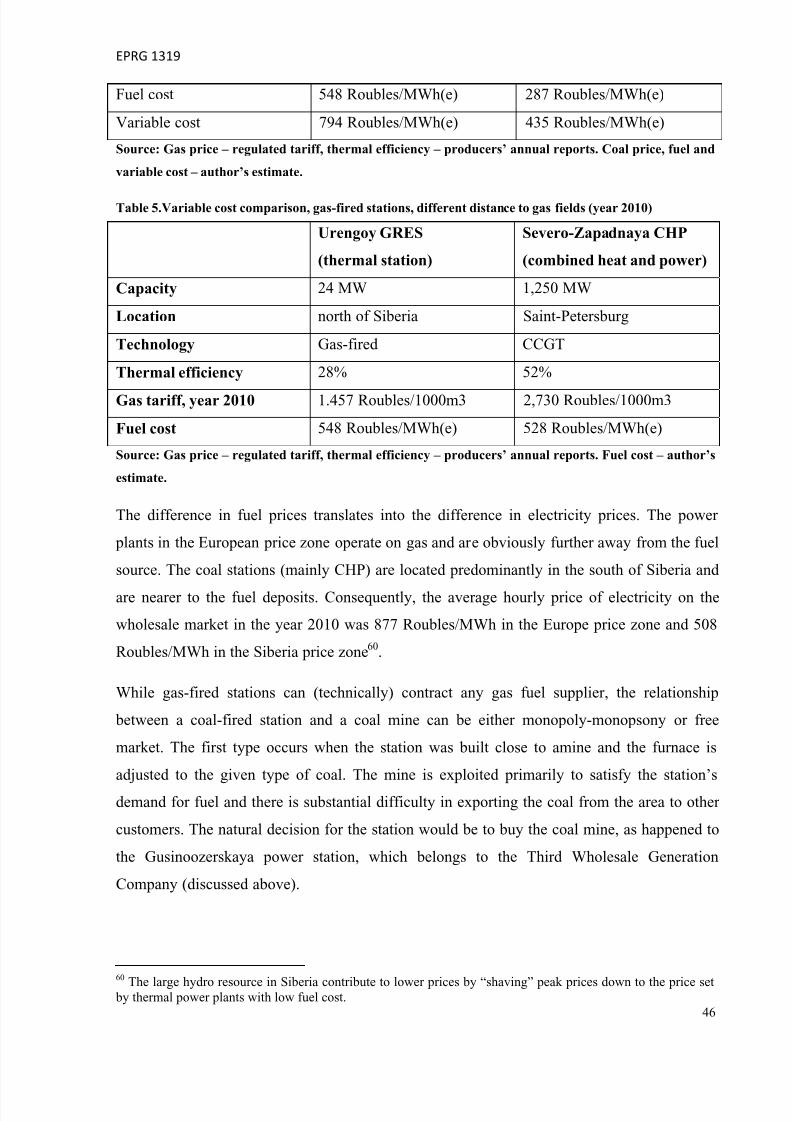
7/23/2019 Chernenko, Nadia. The Russian Electricity Supply Industry. From Reform to Reform_October 2013
http://slidepdf.com/reader/full/chernenko-nadia-the-russian-electricity-supply-industry-from-reform-to-reformoctober 49/66
EPRG 1319
46
Fuel cost 548 Roubles/MWh(e) 287 Roubles/MWh(e)
Variable cost 794 Roubles/MWh(e) 435 Roubles/MWh(e)
Source: Gas price – regulated tariff, thermal efficiency – producers’ annual reports. Coal price, fuel and
variable cost – author’s estimate.
Table 5.Variable cost comparison, gas-fired stations, different distance to gas fields (year 2010)
Urengoy GRES
(thermal station)
Severo-Zapadnaya CHP
(combined heat and power)
Capacity 24 MW 1,250 MW
Location north of Siberia Saint-Petersburg
Technology Gas-fired CCGT
Thermal efficiency 28% 52%
Gas tariff, year 2010 1.457 Roubles/1000m3 2,730 Roubles/1000m3
Fuel cost 548 Roubles/MWh(e) 528 Roubles/MWh(e)
Source: Gas price – regulated tariff, thermal efficiency – producers’ annual reports. Fuel cost – author’s
estimate.
The difference in fuel prices translates into the difference in electricity prices. The power
plants in the European price zone operate on gas and are obviously further away from the fuel
source. The coal stations (mainly CHP) are located predominantly in the south of Siberia and
are nearer to the fuel deposits. Consequently, the average hourly price of electricity on the
wholesale market in the year 2010 was 877 Roubles/MWh in the Europe price zone and 508
Roubles/MWh in the Siberia price zone60.
While gas-fired stations can (technically) contract any gas fuel supplier, the relationship
between a coal-fired station and a coal mine can be either monopoly-monopsony or free
market. The first type occurs when the station was built close to amine and the furnace is
adjusted to the given type of coal. The mine is exploited primarily to satisfy the station’s
demand for fuel and there is substantial difficulty in exporting the coal from the area to other
customers. The natural decision for the station would be to buy the coal mine, as happened to
the Gusinoozerskaya power station, which belongs to the Third Wholesale Generation
Company (discussed above).
60
The large hydro resource in Siberia contribute to lower prices by “shaving” peak prices down to the price set by thermal power plants with low fuel cost.
7/23/2019 Chernenko, Nadia. The Russian Electricity Supply Industry. From Reform to Reform_October 2013
http://slidepdf.com/reader/full/chernenko-nadia-the-russian-electricity-supply-industry-from-reform-to-reformoctober 50/66
EPRG 1319
47
7. Capacity market after the reform
The capacity market in the Russian ESI was introduced (or developed) in order to: (i) cover
the fixed cost of the existing power plants (in this way it superseded the capacity tariff of the
two-tier system); and (ii) induce new construction and guarantee investment returns.
There are several factors that complicated the design of the capacity market. First, the RAO
EES investment programme was passed onto the new generation companies. Related to this
problem is the preferential treatment of the nuclear and hydro generation capacity, which is
owned by the government. Second, it is the transmission-constrained FFZ where the capacity
price is to be regulated or capped. Since the number of such FFZs is 26 out of 29, regulatory
intervention creates a strong bias in the pricing of capacity.
The section opens with a discussion of the investment programme and the industry
development as seen by the government. Then the three main components of capacity trading
are presented: the capacity delivery agreement, auctions for existing capacity and auctions for
future capacity reserves.
7.1. RAO EES investment programme and the General Scheme-2020
In March 2008, shortly before disappearing into history, RAO EES adopted an extensive
investment programme for 2008-12. The total amount of capacity to be built (thermal and
hydro) was nearly 42 GW, which meant expanding the existing 210 GW of installed capacity
by 20%. When the new generation companies were singled out, roughly half of the projects
were passed onto them, together with the existing generation assets (the other half was
abandoned or postponed at this point).
A month previously, in February 2008, the federal government presented a general plan for
industrial development until 2020, entitled General Scheme-2020 61 . Both documents are
linked to the reform and the capacity market, as they describe long-term capacity planning.
Obviously, the General Scheme has a longer planning horizon, and includes in its first part
(for 2006-10) the bulk of the investment projects of the former monopoly. The General
Scheme focuses on the following major aspects: (i) construction of new capacity and
transmission lines, and (ii) renovation of the old power block and transmission equipment.
61
Government Decree No. 215-r issued on 22.02.2008 “General Scheme for location of the energy facilities upto the year 2020”.
7/23/2019 Chernenko, Nadia. The Russian Electricity Supply Industry. From Reform to Reform_October 2013
http://slidepdf.com/reader/full/chernenko-nadia-the-russian-electricity-supply-industry-from-reform-to-reformoctober 51/66
EPRG 1319
48
To justify the needs for new generation, the Scheme assumed the 4.1% growth in electricity
demand in the basic scenario and the 5.2% growth in the optimistic scenario. In fact, the 5%
rate was observed only in 2006, one year prior to the elaboration and adoption of the
programme62. The average growth of electricity consumption in Russia in 2000-07 was 2.1%
p.a. The programme for new construction was obviously inflated and, not surprisingly, was
widely criticised. The economic crisis in 2009-10 reduced energy demand and hence the
demand for new capacity, and also made it difficult to finance the excessive construction
projects.
To strengthen the network, the Scheme envisages construction of high-voltage lines that
would run through several dispatch zones. Shorter high-voltage links would help remove the
“bottlenecks” or connect new power stations to the network. The network development aims
at doubling the overall length of the high-voltage grid (48,000 km as of 2010) 63 .It is
anticipated that the new lines would enable the integration of some of the free flow zones and
hence remove price caps.
Another aspect of the Scheme is the refurbishment of older stations and network equipment.
The Scheme claims that in 2006 nearly 40% of generation capacity was outdated and needed
replacement, and that by 2020 the proportion of obsolete stations would increase to 57%.
However, as discussed in the overview section, the estimates of the age structure might bemisleading if they use the lead-in date rather than expected lifetime of the (refurbished)
plants.
The capital expenditure associated with the modernisation of the industry seemed too high to
be borne solely by the government (as the main asset holder), hence the idea of privatising
companies in order to attract private investment and improve production efficiency (cf. the
above-mentioned reform goals as declared in the “5 plus 5” programme).Indeed, most power
stations were privatised on the condition of implementing deep refurbishment or capacity
enlargement. To guarantee investment returns to new shareholders, the government
introduced capacity delivery agreements.
62
Russian Federal Statistics Service. http://www.gks.ru/free_doc/new_site/business/prom/natura/natura4g.htm63Federal Grid Company (2010) Annual report.
7/23/2019 Chernenko, Nadia. The Russian Electricity Supply Industry. From Reform to Reform_October 2013
http://slidepdf.com/reader/full/chernenko-nadia-the-russian-electricity-supply-industry-from-reform-to-reformoctober 52/66
EPRG 1319
49
7.2.
Types of capacity contracts and auction
Capacity sales were completely regulated before the reform; both the price (tariff) and volume
to be sold were determined by the regulatory authorities. The liberalisation of the capacity
market started in July 2008, with the share of the free sector at 30%. Further expansion of the
free sector was in line with the electricity market liberalisation, so that liberal pricing started
in January 2011. The proportion of the free market was determined with respect to the 2007
installed capacity (in both price zones); any new lead-in would automatically enter the free
sector.
The total volume of capacity that is located in the price zones, and hence could be sold on the
market, is roughly 180GW. For the purposes of trading, the period of delivery is one month,
i.e. the capacity price is specified as Roubles per MW per month. Monthly frequency meansthat there are only 12 price figures for one year for any free flow zones (unlike, say, some of
the US markets with hourly capacity trading).
The capacity, both existing and under construction, could be traded under:
• A capacity delivery agreement;
• Regulated contracts (RC), in particular special regulated contracts for hydro and
nuclear generation;
• Free bilateral contracts for the supply of energy and capacity, both on and outside the
energy exchange;
• Auctions (entitled “competitive selection of capacity”, abbreviated in Russian as
KOM).
To plan future development of the industry and new construction, the government introduced
auctions for capacity reserves. The auction rules are already available for analysis and
discussion but no auction has yet taken place.
As will be shown later, the government heavily regulates the capacity price, save in the case
of free bilateral contracts. Such intervention creates an obvious discrepancy between the
actual fixed cost and revenue received. The main reasons for excessive regulation are deemed
to be political, as the government fears that uncontrolled prices would soar and thus threaten
social stability.
7/23/2019 Chernenko, Nadia. The Russian Electricity Supply Industry. From Reform to Reform_October 2013
http://slidepdf.com/reader/full/chernenko-nadia-the-russian-electricity-supply-industry-from-reform-to-reformoctober 53/66
EPRG 1319
50
7.3.
Capacity delivery agreement (DPM scheme)
The capacity delivery agreement (abbreviated in Russian as DPM) was created as part of the
RAO EES reform to guarantee future capacity sales, and thus investment returns, to new
generation companies. The scheme was subject to many public discussions, as well as
negotiations between companies and regulatory authorities, and the final details of the DPM
were only published during the summer of 2010.
From a legal point of view, the DPM contract is an agency agreement between a generator
and the Commercial Operator 64, which is complemented by a contract for capacity sales
between the CO and customers. The DPM contract stipulates the obligation to construct a new
station or to modernise existing equipment by a given date. The maximum possible delay to
the lead-in is one year; further delay is subject to heavy penalties.
The total volume of new thermal generation to be built during 2010-17 is around 22.5 GW65.
Around ¾ is based on the CCGT technology, which has higher thermal efficiency, i.e. above
50% (cf. 36-38% of the existing stations). The nuclear company RosEnergoAtom plans to
build 9,800 MW. The investment programme of RusHydro is for three years only (2011-13)
and envisages construction of 4,700 MW. The amount of new capacity construction under the
DPM scheme totals 37 GW and the breakdown by lead-in year is shown on figure 12. Given
the existing capacity of 226 GW, the overall expansion looks quite significant (at 14.3%), yet
the increase per year is quite modest: 1.5-2.0% of the existing volume.
64 Contract form D-15 of the NOREM “Standard form of the agency contract that ensure the implementation ofthe investment program by the wholesale and Territorial Generation Companies”.65
Government Decree No. 1334-r issued on 11.08.2010 “The List of Generation Facilities Covered by theDPM”.
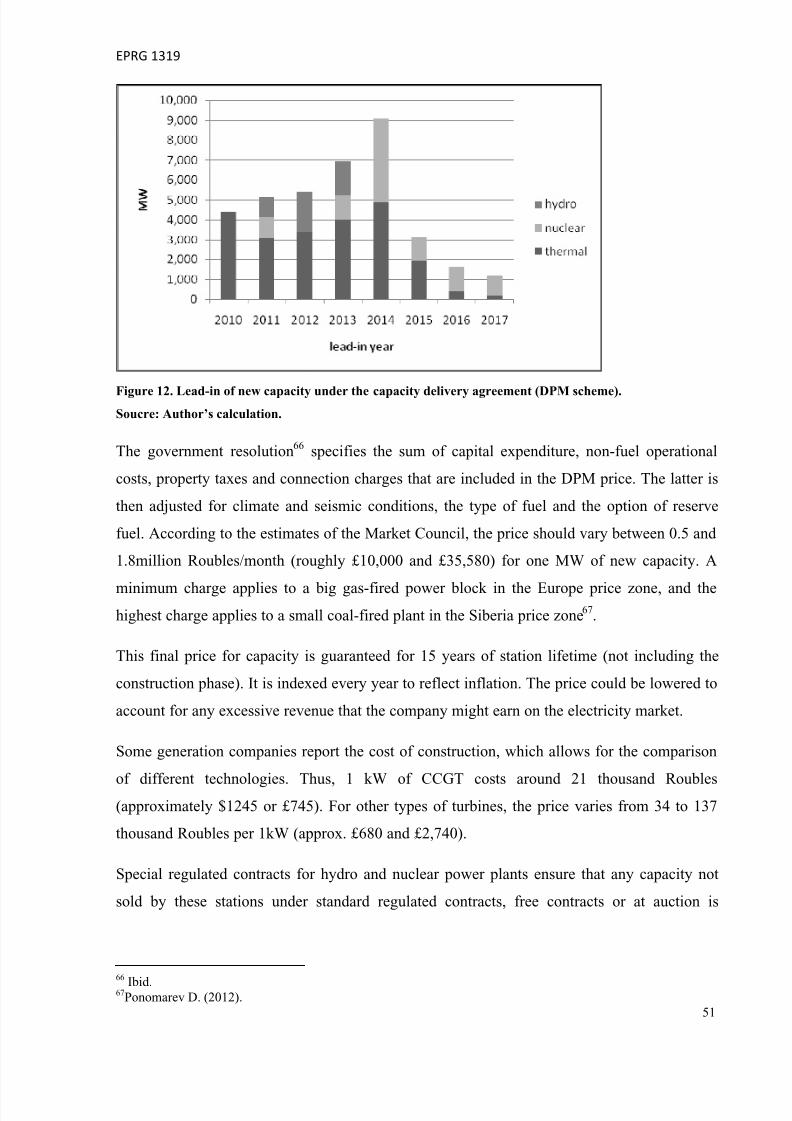
7/23/2019 Chernenko, Nadia. The Russian Electricity Supply Industry. From Reform to Reform_October 2013
http://slidepdf.com/reader/full/chernenko-nadia-the-russian-electricity-supply-industry-from-reform-to-reformoctober 54/66
EPRG 1319
51
Figure 12. Lead-in of new capacity under the capacity delivery agreement (DPM scheme).
Soucre: Author’s calculation.
The government resolution66 specifies the sum of capital expenditure, non-fuel operational
costs, property taxes and connection charges that are included in the DPM price. The latter is
then adjusted for climate and seismic conditions, the type of fuel and the option of reserve
fuel. According to the estimates of the Market Council, the price should vary between 0.5 and
1.8million Roubles/month (roughly £10,000 and £35,580) for one MW of new capacity. A
minimum charge applies to a big gas-fired power block in the Europe price zone, and the
highest charge applies to a small coal-fired plant in the Siberia price zone67.
This final price for capacity is guaranteed for 15 years of station lifetime (not including the
construction phase). It is indexed every year to reflect inflation. The price could be lowered to
account for any excessive revenue that the company might earn on the electricity market.
Some generation companies report the cost of construction, which allows for the comparison
of different technologies. Thus, 1 kW of CCGT costs around 21 thousand Roubles(approximately $1245 or £745). For other types of turbines, the price varies from 34 to 137
thousand Roubles per 1kW (approx. £680 and £2,740).
Special regulated contracts for hydro and nuclear power plants ensure that any capacity not
sold by these stations under standard regulated contracts, free contracts or at auction is
66
Ibid.67Ponomarev D. (2012).
7/23/2019 Chernenko, Nadia. The Russian Electricity Supply Industry. From Reform to Reform_October 2013
http://slidepdf.com/reader/full/chernenko-nadia-the-russian-electricity-supply-industry-from-reform-to-reformoctober 55/66
EPRG 1319
52
forcibly sold to consumers in proportion with their peak demand 68 . Since all nuclear
generation and the bulk of hydro generation belong to the federal government, such contracts
create an unjustified advantage over private thermal plants. The price of hydro/nuclear
capacity sold is often quoted to be excessive, but no formal regulation is published that
outlines the price formation for this type of contracts.
6.4. Capacity auction
The auction for the competitive selection of capacity (KOM) is designed as a mechanism to
determine capacity market prices. The System Operator is responsible for running the auction;
it verifies the technical parameters of the generation equipment and collects price-quantity
offers from the generators. The SO calculates the ‘actual’ demand for capacity based on the
historic peak load. The customers, either large-scale consumers or retail companies, cannot bid directly in the market and have to pay for all capacity selected by the SO at the auctions.
From the theoretical point of view, the KOM auction is:
• simultaneous – all the capacity is sold during one procedure;
• one-stage – the equilibrium price and quantities are determined once only;
• multi-unit – multiple power stations sell their capacity;
• identical-good – there are no substitutes/complements for a MW of capacity (in a
given month);
• sealed-bid – generators do not know each other’s bids;
• uniform-price – one equilibrium price is calculated for the whole of the free flow
zone;
There are two periods in the development of the auctions, which differ drastically in terms of
pricing and the state of the capacity market. The liberalisation phase, when the market was
still partially regulated, appears to be more market-oriented, whereas the liberalised stagelooks more like a planning system.
The first KOM auction took place in June 2008, for the delivery of capacity in the second half
of the year. Three transitory auctions for the delivery of the following year were held in
December 2008-10 for 2009-11, respectively. These were used partly to test the auction
mechanism and help the market players learn the rules of the game. Capacity trading during
68 Regulation No. 6.5 of the NOREM
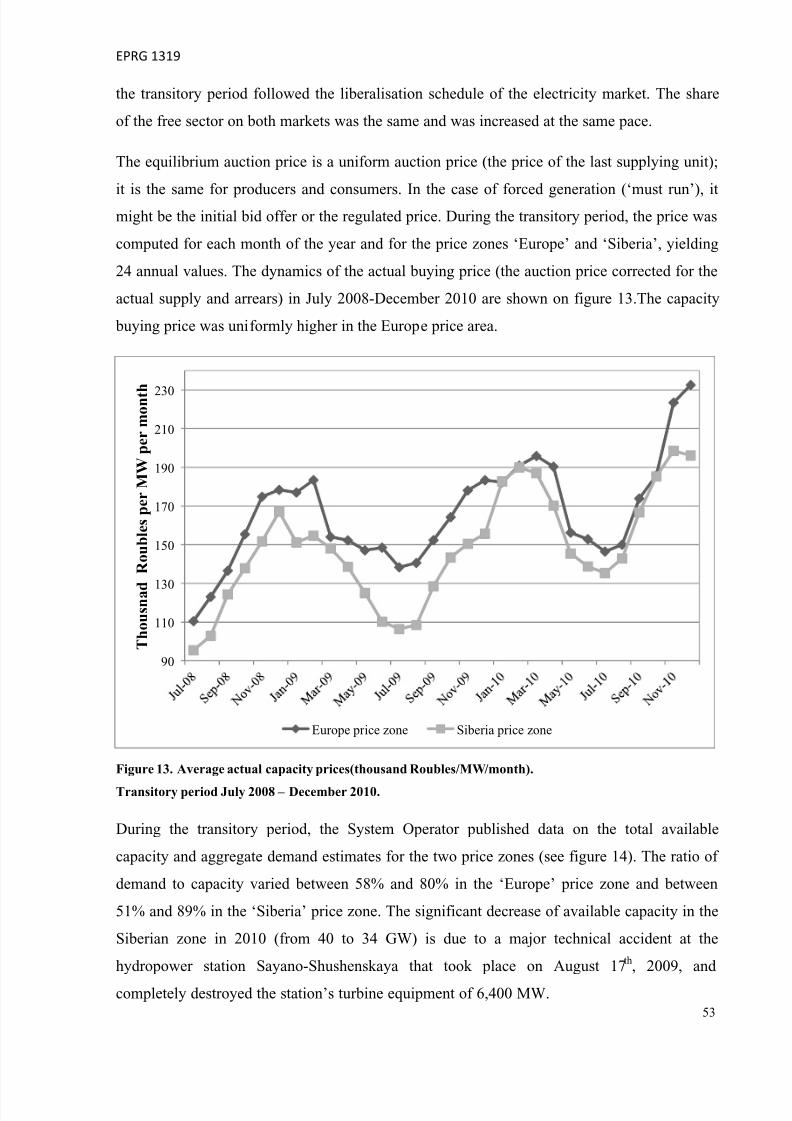
7/23/2019 Chernenko, Nadia. The Russian Electricity Supply Industry. From Reform to Reform_October 2013
http://slidepdf.com/reader/full/chernenko-nadia-the-russian-electricity-supply-industry-from-reform-to-reformoctober 56/66
EPRG 1319
53
the transitory period followed the liberalisation schedule of the electricity market. The share
of the free sector on both markets was the same and was increased at the same pace.
The equilibrium auction price is a uniform auction price (the price of the last supplying unit);
it is the same for producers and consumers. In the case of forced generation (‘must run’), itmight be the initial bid offer or the regulated price. During the transitory period, the price was
computed for each month of the year and for the price zones ‘Europe’ and ‘Siberia’, yielding
24 annual values. The dynamics of the actual buying price (the auction price corrected for the
actual supply and arrears) in July 2008-December 2010 are shown on figure 13.The capacity
buying price was uniformly higher in the Europe price area.
Figure 13. Average actual capacity prices(thousand Roubles/MW/month).
Transitory period July 2008 – December 2010.
During the transitory period, the System Operator published data on the total available
capacity and aggregate demand estimates for the two price zones (see figure 14). The ratio of
demand to capacity varied between 58% and 80% in the ‘Europe’ price zone and between
51% and 89% in the ‘Siberia’ price zone. The significant decrease of available capacity in the
Siberian zone in 2010 (from 40 to 34 GW) is due to a major technical accident at the
hydropower station Sayano-Shushenskaya that took place on August 17 th, 2009, and
completely destroyed the station’s turbine equipment of 6,400 MW.
90
110
130
150
170
190
210
230
T h o u s n a d
R o u b l e s p e r M W p e r m o n t h
Europe price zone Siberia price zone
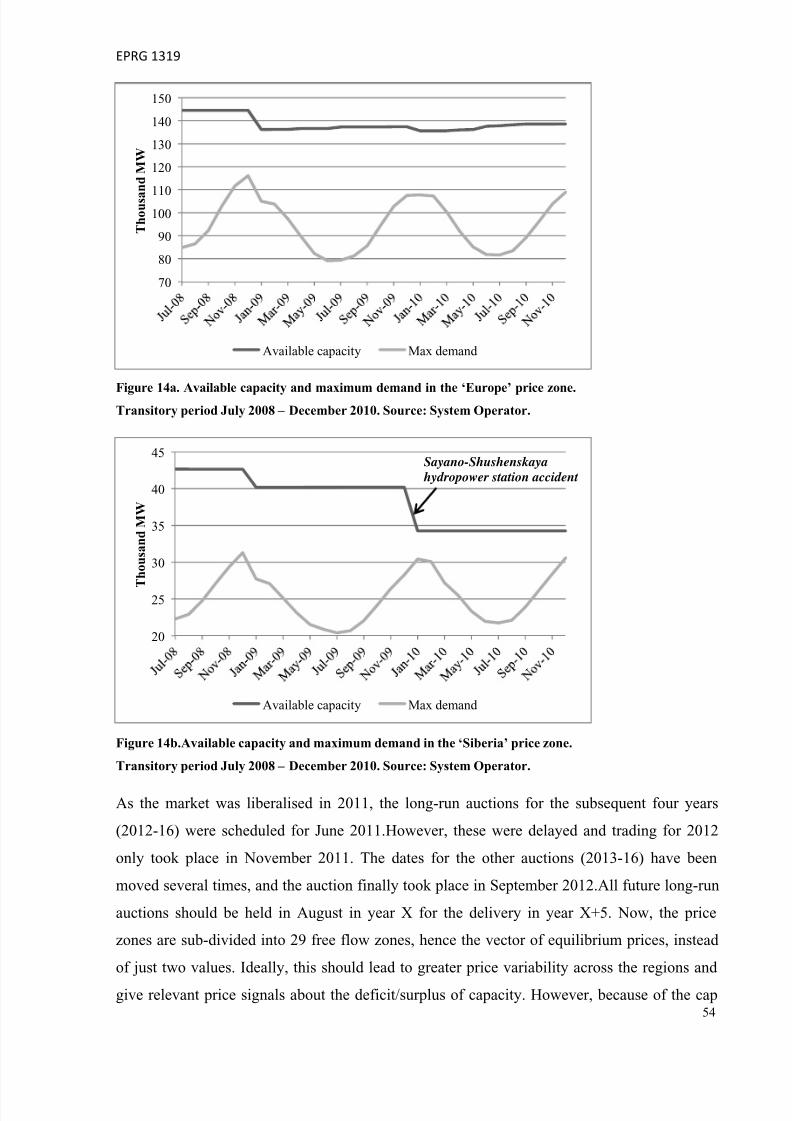
7/23/2019 Chernenko, Nadia. The Russian Electricity Supply Industry. From Reform to Reform_October 2013
http://slidepdf.com/reader/full/chernenko-nadia-the-russian-electricity-supply-industry-from-reform-to-reformoctober 57/66
EPRG 1319
54
Figure 14a. Available capacity and maximum demand in the ‘Europe’ price zone.Transitory period July 2008 – December 2010. Source: System Operator.
Figure 14b.Available capacity and maximum demand in the ‘Siberia’ price zone.
Transitory period July 2008 – December 2010. Source: System Operator.
As the market was liberalised in 2011, the long-run auctions for the subsequent four years
(2012-16) were scheduled for June 2011.However, these were delayed and trading for 2012
only took place in November 2011. The dates for the other auctions (2013-16) have been
moved several times, and the auction finally took place in September 2012.All future long-run
auctions should be held in August in year X for the delivery in year X+5. Now, the price
zones are sub-divided into 29 free flow zones, hence the vector of equilibrium prices, instead
of just two values. Ideally, this should lead to greater price variability across the regions and
give relevant price signals about the deficit/surplus of capacity. However, because of the cap
70
80
90
100110
120
130
140
150
T h o u s a
n d M W
Available capacity Max demand
20
25
30
35
40
45
T h o u s a n d M W
Available capacity Max demand
Sayano-Shushenskaya
hydropower station accident
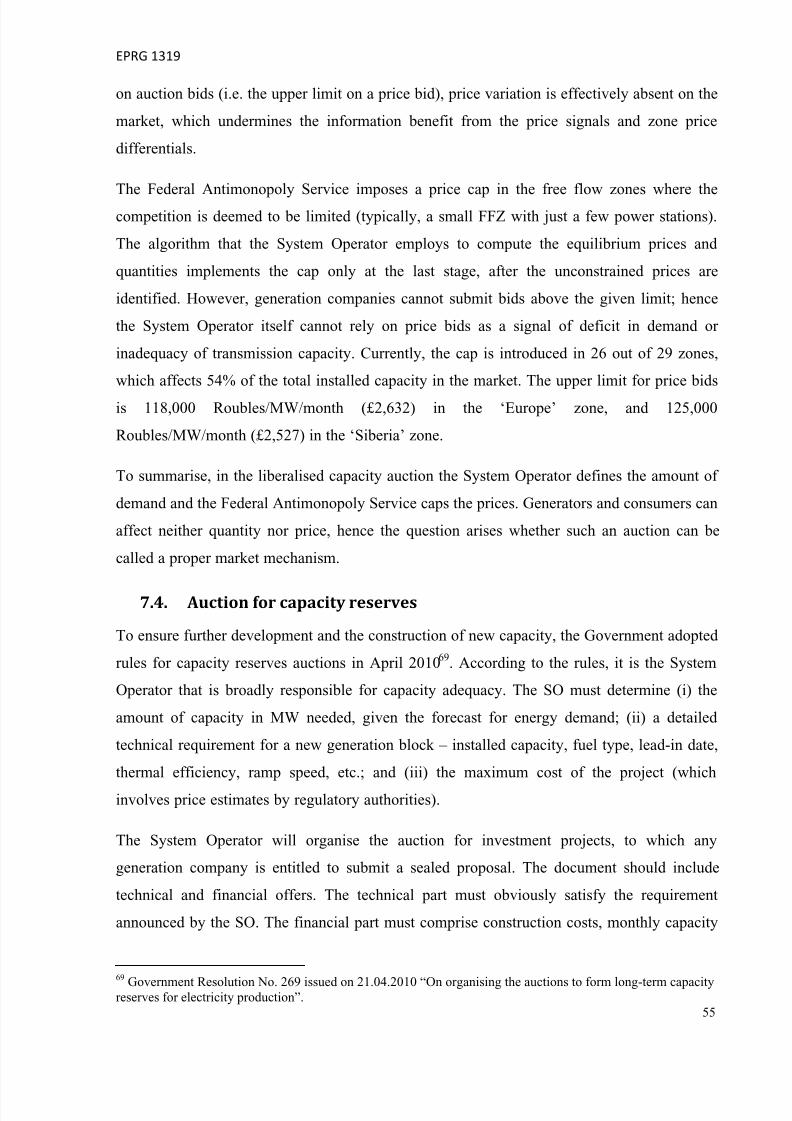
7/23/2019 Chernenko, Nadia. The Russian Electricity Supply Industry. From Reform to Reform_October 2013
http://slidepdf.com/reader/full/chernenko-nadia-the-russian-electricity-supply-industry-from-reform-to-reformoctober 58/66
EPRG 1319
55
on auction bids (i.e. the upper limit on a price bid), price variation is effectively absent on the
market, which undermines the information benefit from the price signals and zone price
differentials.
The Federal Antimonopoly Service imposes a price cap in the free flow zones where thecompetition is deemed to be limited (typically, a small FFZ with just a few power stations).
The algorithm that the System Operator employs to compute the equilibrium prices and
quantities implements the cap only at the last stage, after the unconstrained prices are
identified. However, generation companies cannot submit bids above the given limit; hence
the System Operator itself cannot rely on price bids as a signal of deficit in demand or
inadequacy of transmission capacity. Currently, the cap is introduced in 26 out of 29 zones,
which affects 54% of the total installed capacity in the market. The upper limit for price bids
is 118,000 Roubles/MW/month (£2,632) in the ‘Europe’ zone, and 125,000
Roubles/MW/month (£2,527) in the ‘Siberia’ zone.
To summarise, in the liberalised capacity auction the System Operator defines the amount of
demand and the Federal Antimonopoly Service caps the prices. Generators and consumers can
affect neither quantity nor price, hence the question arises whether such an auction can be
called a proper market mechanism.
7.4. Auction for capacity reserves
To ensure further development and the construction of new capacity, the Government adopted
rules for capacity reserves auctions in April 201069. According to the rules, it is the System
Operator that is broadly responsible for capacity adequacy. The SO must determine (i) the
amount of capacity in MW needed, given the forecast for energy demand; (ii) a detailed
technical requirement for a new generation block – installed capacity, fuel type, lead-in date,
thermal efficiency, ramp speed, etc.; and (iii) the maximum cost of the project (which
involves price estimates by regulatory authorities).
The System Operator will organise the auction for investment projects, to which any
generation company is entitled to submit a sealed proposal. The document should include
technical and financial offers. The technical part must obviously satisfy the requirement
announced by the SO. The financial part must comprise construction costs, monthly capacity
69
Government Resolution No. 269 issued on 21.04.2010 “On organising the auctions to form long-term capacityreserves for electricity production”.
7/23/2019 Chernenko, Nadia. The Russian Electricity Supply Industry. From Reform to Reform_October 2013
http://slidepdf.com/reader/full/chernenko-nadia-the-russian-electricity-supply-industry-from-reform-to-reformoctober 59/66
EPRG 1319
56
payments and the forecast of fuel prices, or a contract for future fuel supply. The auctioneer
then estimates the price for electricity and total cost of the investment project. The latter can
be understood as a one-tier tariff that incorporates the forecast energy price and the offered
capacity payment. The proposal that has the lowest investment cost (i.e. lowest one-tier tariff)
wins the auction.
In short, the development of new capacity remains a highly regulated system. There is no
room for a company to act on its own incentive to build a power plant. Not only is the size of
the plant pre-determined, but also the technical parameters, such as fuel type. It is not clear
how sustainable the auction is regarding moral hazards from the company that wins the
auction, e.g. when a company offers a low bid, but then overstates construction costs, and
lobbies for higher electricity and capacity tariffs.
8. Conclusions
The reform of the Russian ESI in 2003-2011 was induced by the unsuccessful transformations
of the early 1990s. The Soviet industry relied on low prices, had excessive capacity and was
quite inefficient. In the ‘90s it was transformed into a vertically integrated monopoly with
heavy government regulation. The industry inherited the centrally-planned spirit and many of
the existing problems (technical inefficiency, excess reserve margin). Low tariffs and overall
economic decline contributed negatively to industry financial performance.
The last reform aimed at restructuring the monopoly and creating a competitive wholesale
market for energy and capacity. These goals seem to be half-achieved. The monopoly was
unbundled, and the new generation companies appeared to have sensible composition of the
assets. However, the merger wave soon followed the restructuring. It was led by the state-
owned companies Gazprom and InterRAO, and ss a result of the mergers the government now
controls half of the industry installed capacity.
The wholesale markets are in full operation, yet the market players are subject to the bidding
code of practice and suffer from retail tariff regulation. The bid-at-cost rule induced the
introduction of the capacity market but the market turned out to be regulated and resembles a
planned system. On the capacity market, once the DPM scheme expires, that is once the bulk
of compulsory capacity is built, more attention should be devoted to design of a competitive
market which gives more freedom to generation companies in planning their investment.
7/23/2019 Chernenko, Nadia. The Russian Electricity Supply Industry. From Reform to Reform_October 2013
http://slidepdf.com/reader/full/chernenko-nadia-the-russian-electricity-supply-industry-from-reform-to-reformoctober 60/66
EPRG 1319
57
Demand-side bidding, and more broadly demand-side response and management (which is
now barely discussed), can contribute significantly to development of the capacity markets.
Development of the distribution network is under full swing, however pricing and financing
of the network raised much concern. The new RAB methodology fixes prices for longer periods which should add stability to the sector. Perhaps, questions about prices would be less
relevant when the network expansion will contributes significantly to lowering prices in the
currently locked areas and widening access to, and interaction between, more generators and
customers.
Reforming the gas fuel market in Russia seems a more distant perspective, although not an
improbable. In the present conditions the regulators can focus on improving the tariff
methodology to better reflect the production cost (and possibly prepare Gazprom
restructuring) and ensuring fair access to the pipeline network for IPPs.
Finally, complete retail competition, in particular, household access to the market, is still a
sensitive and tough matter. Smart metering project which has been recently launched in
Russia should collect relevant statistics on household consumption and provide basis for
further policy development.
To summarise, the Russian ESI reform borrowed a lot from international experience and atfirst glance appears to be sensibly designed. However, further development showed that the
government still tries to hold the grip, so this needs to be realised for better industry
performance and completeness of the reform.
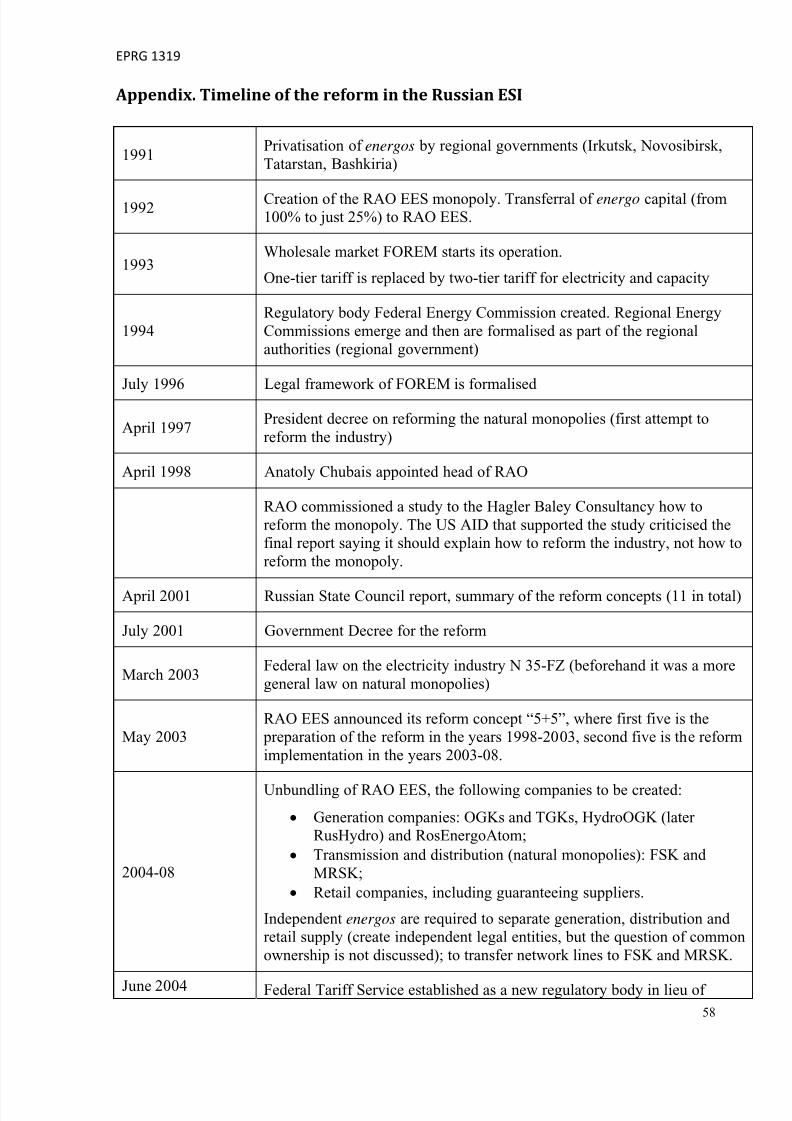
7/23/2019 Chernenko, Nadia. The Russian Electricity Supply Industry. From Reform to Reform_October 2013
http://slidepdf.com/reader/full/chernenko-nadia-the-russian-electricity-supply-industry-from-reform-to-reformoctober 61/66
EPRG 1319
58
Appendix. Timeline of the reform in the Russian ESI
1991Privatisation of energos by regional governments (Irkutsk, Novosibirsk,Tatarstan, Bashkiria)
1992 Creation of the RAO EES monopoly. Transferral of energo capital (from100% to just 25%) to RAO EES.
1993Wholesale market FOREM starts its operation.
One-tier tariff is replaced by two-tier tariff for electricity and capacity
1994Regulatory body Federal Energy Commission created. Regional EnergyCommissions emerge and then are formalised as part of the regionalauthorities (regional government)
July 1996 Legal framework of FOREM is formalised
April 1997President decree on reforming the natural monopolies (first attempt toreform the industry)
April 1998 Anatoly Chubais appointed head of RAO
RAO commissioned a study to the Hagler Baley Consultancy how toreform the monopoly. The US AID that supported the study criticised thefinal report saying it should explain how to reform the industry, not how toreform the monopoly.
April 2001 Russian State Council report, summary of the reform concepts (11 in total)
July 2001 Government Decree for the reform
March 2003Federal law on the electricity industry N 35-FZ (beforehand it was a moregeneral law on natural monopolies)
May 2003RAO EES announced its reform concept “5+5”, where first five is the
preparation of the reform in the years 1998-2003, second five is the reformimplementation in the years 2003-08.
2004-08
Unbundling of RAO EES, the following companies to be created:
• Generation companies: OGKs and TGKs, HydroOGK (laterRusHydro) and RosEnergoAtom;
• Transmission and distribution (natural monopolies): FSK andMRSK;
• Retail companies, including guaranteeing suppliers.
Independent energos are required to separate generation, distribution andretail supply (create independent legal entities, but the question of commonownership is not discussed); to transfer network lines to FSK and MRSK.
June 2004 Federal Tariff Service established as a new regulatory body in lieu of
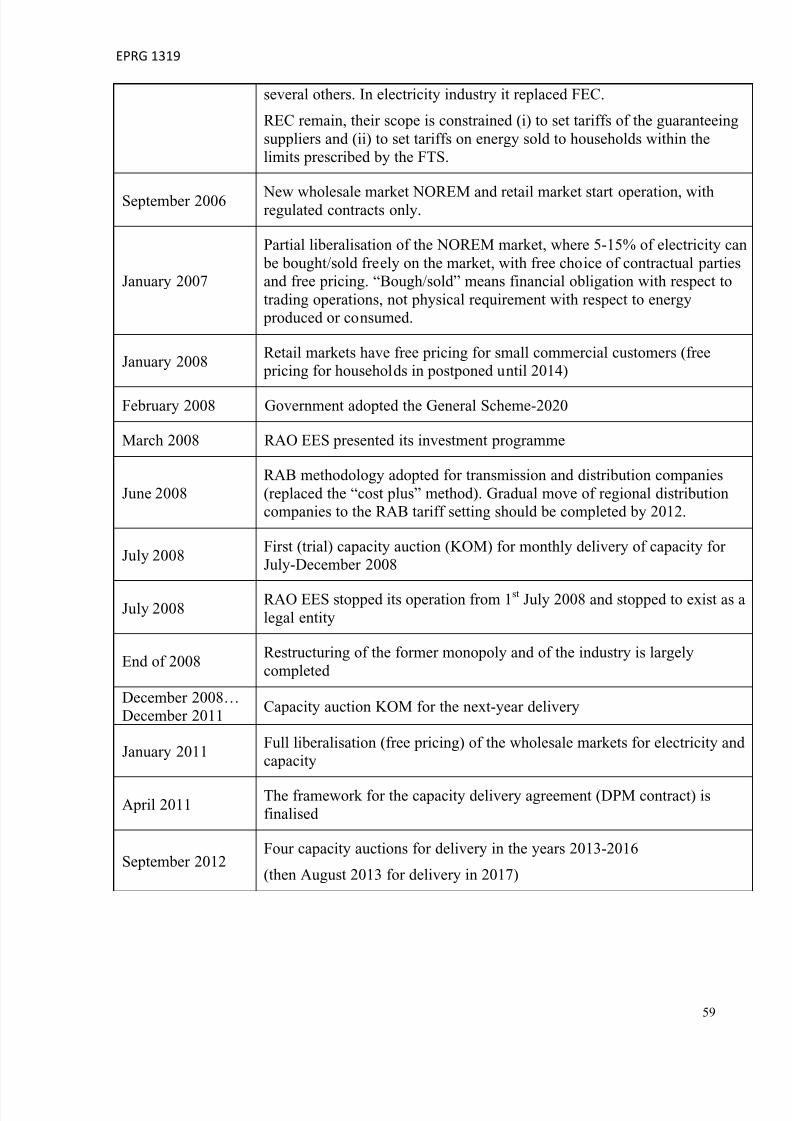
7/23/2019 Chernenko, Nadia. The Russian Electricity Supply Industry. From Reform to Reform_October 2013
http://slidepdf.com/reader/full/chernenko-nadia-the-russian-electricity-supply-industry-from-reform-to-reformoctober 62/66
EPRG 1319
59
several others. In electricity industry it replaced FEC.
REC remain, their scope is constrained (i) to set tariffs of the guaranteeingsuppliers and (ii) to set tariffs on energy sold to households within thelimits prescribed by the FTS.
September 2006 New wholesale market NOREM and retail market start operation, withregulated contracts only.
January 2007
Partial liberalisation of the NOREM market, where 5-15% of electricity can be bought/sold freely on the market, with free choice of contractual partiesand free pricing. “Bough/sold” means financial obligation with respect totrading operations, not physical requirement with respect to energy
produced or consumed.
January 2008Retail markets have free pricing for small commercial customers (free
pricing for households in postponed until 2014)
February 2008 Government adopted the General Scheme-2020
March 2008 RAO EES presented its investment programme
June 2008RAB methodology adopted for transmission and distribution companies(replaced the “cost plus” method). Gradual move of regional distributioncompanies to the RAB tariff setting should be completed by 2012.
July 2008First (trial) capacity auction (KOM) for monthly delivery of capacity forJuly-December 2008
July 2008RAO EES stopped its operation from 1st July 2008 and stopped to exist as alegal entity
End of 2008Restructuring of the former monopoly and of the industry is largelycompleted
December 2008…December 2011
Capacity auction KOM for the next-year delivery
January 2011Full liberalisation (free pricing) of the wholesale markets for electricity andcapacity
April 2011The framework for the capacity delivery agreement (DPM contract) isfinalised
September 2012Four capacity auctions for delivery in the years 2013-2016
(then August 2013 for delivery in 2017)
7/23/2019 Chernenko, Nadia. The Russian Electricity Supply Industry. From Reform to Reform_October 2013
http://slidepdf.com/reader/full/chernenko-nadia-the-russian-electricity-supply-industry-from-reform-to-reformoctober 63/66
EPRG 1319
60
References
Agency for Forecasting the Energy Balance (2006). “Functioning and development of the
electricity industry in the Russian Federation” [in Russian],
Business World Agency (2010) “Rossiya: ProryvTarifa” (Russia: Tariff Breakthrough) [in
Russian]
Doeh, D. Wood, C., Popov, A., Fominykh, S. and Mouratova, N. (2008) “Reform of the
Russian electricity industry”” Law in Transition online, October 2008, pp. 1/6-6/6.
Federal Grid Company of Russia (2010) Annual report.
Gore, O., Viljainen, S., Makkonen, M. and Kuleshov,D. (2012). “Russian electricity market
reform: Deregulation or re-regulation?” Energy Policy, Vol. 41, p. 676–685.
Hogan, W. (2005) “On an “Energy Only” Electricity Market Design for Resource Adequacy”
Available at www.hks.harvard.edu/fs/whogan/Hogan_Energy_Only_092305.pdf , [accessed
on June 1, 2013]
International Energy Agency (1995). “Energy Policies of the Russian Federation”
International Energy Agency (1995). “Russian Energy Prices, Taxes and Costs”
International Energy Agency (2002). “Russia Energy Survey”
Joskow, P. (2006) “Introduction to Electricity Sector Liberalization: Lessons Learned
fromCross-Country Studies”, in Sioshansi, F. and Pfaffenberger, W., ed. (2006) “ Electricity
Market Reform: An International Perspective”
Kennedy, D. (2003) “Liberalisation of the Russian power sector”. Energy Policy, vol. 31, p.
745–758.
Kuzovkin, A.I. (2006) “The Energy Crisis and Energy Reform in Russia: Competition Instead
of Reliability” Studies on Russian Economic Development,Vol. 17, No. 2, pp. 169–181
Littlechild, S. (2006) “Foreword: The Market versus Regulation”, in Sioshansi, F. and
Pfaffenberger, W., ed. (2006) “ Electricity Market Reform: An International Perspective”
Littlechild, S. (2011) “Merchant and regulated transmission: theory, evidence and
policy”. Journal of Regulatory Economics, Vol. 42, pp. 308–335.
7/23/2019 Chernenko, Nadia. The Russian Electricity Supply Industry. From Reform to Reform_October 2013
http://slidepdf.com/reader/full/chernenko-nadia-the-russian-electricity-supply-industry-from-reform-to-reformoctober 64/66
EPRG 1319
61
Oksanen M., Karjalainen R., Viljainen S. and Kuleshov D. (2009)"Electricity markets in
Russia, the US, and Europe," EEM 2009. 6th International Conference on the European
Energy Markets.
Opitz, P. (2000). “The (pseudo-) liberalisation of Russia's power sector: the hidden rationalityof transformation”. Energy Journal, vol. 28, p.147-155.
Pollitt, M. (2009) “Electricity Liberalisation in the European Union: A Progress report”,
EPRG Working Paper 0929.
Pollitt, M. (2012) “The role of policy in energy transitions: Lessons from the energy
liberalisation era” Energy Policy, Vol. 50, pp. 128–137.
Ponomarev, D. (2012) “Main principles of the long-term capacity market and capacity
delivery agreement”. Available at http://www.fstrf.ru/press/meeting/33/45[in Russian;
accessed on July, 1st, 2012].
RAO EES company (1997). Annual report.
RAO EES company (1998). Annual report.
RAO EES company. Reform Strategy Concept. Available at http://www.rao-
ees.ru/en/reforming/conc/show.cgi?con2003.htm#2 [accessed on July, 1st, 2012].
Russian Federal Statistics Service. Electric generation capacity.
http://www.gks.ru/free_doc/new_site/business/prom/natura/natura4g.htm
Solanko, L. (2011) “How to Liberalize a Thousand TWh Market? – Restructuring the Russian
Power Sector”. Bank of Finland / Institute for Economies in Transition. Working Paper
1/2011
State Council of the Russian Federation, Working group on the electricity industry reform
(2001). “On the unified state concept of reforming the electricity industry”. Available at
http://www.libertarium.ru/l_energy_kr_02 [in Russian; accessed on July, 1st, 2012].
Tompson, W. (2004) “Russia’s Power Sector Reform: Creating Robust Competition or a
Potemkin Market?” RusEnergyLaw Journal (2005), issues no. 1 and 2.
US Department of Energy (2002) “National Transmission Grid Study”.
7/23/2019 Chernenko, Nadia. The Russian Electricity Supply Industry. From Reform to Reform_October 2013
http://slidepdf.com/reader/full/chernenko-nadia-the-russian-electricity-supply-industry-from-reform-to-reformoctober 65/66
EPRG 1319
62
World Bank (1999) “Non-Payment in the Electricity Sector in Eastern Europe and the Former Soviet
Union” World Bank Technical Paper WTP423, June 1999.
Yi-chong, Xu (2004) ”Electricity reform in China, India and Russia: the World Bank template
and the politics of power”. Cheltenham: Edward Elgar.
Legislation
Federal Energy Commission Decree No. 76 issued on 06.05.1997. “Temporary methodology
for defining the wholesale two-tier tariffs”.
Federal Energy Commission Resolution No. 123/1 issued on 24.11.1997 “On the tariffs on electric and
heat energy (capacity)”
Federal Law No. 41-FZ issued on 14.04.1995 “On the State Regulation of the Tariffs for
Electricity and Heat Energy”.
Federal Law No. 35-FZ issued on 26.03.2003 “On the Electricity Industry”
Federal Law No. 36-FZ issued on 26.03.2003 “On the Electricity Industry in the Transition
Period”
Government Decree No. 793 issued on 12.07.1996 “On the Federal Wholesale Market for
Electricity and Capacity”
Government Decree No. 215-r issued on 22.02.2008 “General Scheme for location of the
energy facilities up to the year 2020”.
Government Decree No. 1334-r issued on 11.08.2010 “The List of Generation Facilities
Covered by the Capacity Delivery Agreement (DPM)”.
Government Resolution No. 390 issued on 0.3.04.1997. “On the measure to improve theformation of the investment resources in the electricity industry and on the government
control of the use of the resources”
Government Resolution No. 332 issued on 30.06.2004 “On the Federal Tariff Service”.
Government Decree No. 643 issues on 24.10.2003 “On the Rules of the Federal Wholesale
Market for Electricity and Capacity in the Transition Period”
7/23/2019 Chernenko, Nadia. The Russian Electricity Supply Industry. From Reform to Reform_October 2013
http://slidepdf.com/reader/full/chernenko-nadia-the-russian-electricity-supply-industry-from-reform-to-reformoctober 66/66
EPRG 1319
Government Resolution N 269 issued on 21.04.2010 “On organising the auctions to form
long-term capacity reserves for electricity production
Government Resolution No. 1173 issued on 27.12.2010 “On the lease of the objects of the
national electricity grid to the territorial network companies”
Contract form D-15 of the NOREM “Standard form of the agency contract that ensure the
implementation of the investment program by the wholesale and Territorial Generation
Companies”.
Regulation No. 6.5 of the NOREM “Contracts for capacity supply of the nuclear power
stations and hydropower stations”
Regulation No. 7 of the NOREM “Competitive selection of the price bids for the day ahead”
Regulation No. 19.3 of the NOREM “Competitive selection of capacity”