Embed Size (px)
Citation preview
Chester High Conviction FundMarket Commentary
Top 3 Holdings Portfolio Breakdown Top 3 Portfolio Attribution Bottom 3 Portfolio AttributionAGL Energy Ltd Materials (ex Gold) 15.8% Sino Gas & Energy Lend LeaseCSL Limited Financials 11.4% AWE Limited Ctrip.comMacquarie Bank Energy 11.1% Syrah Resources AGL Energy
viewpoint, this appears to be more of a second half conundrum. The signal for tighter conditions should appear with the US 10 year bond yield finally backing up, as interest rates rise, while credit spreads should also widen as investors become more discerning. The style bias in this environment would appear to favour value over growth and long duration assets, which have been the biggest beneficiaries
of the low interest rate era.
The Portfolio
Whilst much of this quarterly is macro in nature, ultimately we focus most of our attention on cash flow generation, i.e. can the companies we invest in continue to provide either highly predictable cash flows, or is the market significantly discounting a company’s prospects for future cash flow growth. We believe that we can still find 25-40 companies across the ASX300 and a narrow Asian universe that can generate superior risk adjusted returns in all market conditions through superior diversification.
For the quarter, the Chester High Conviction Fund (CHCF) delivered a positive 11.4% return after fees, relative to the 7.7% rise in the ASX300 Accumulation Index.
The stocks that provided positive attribution this quarter were led by Sino Gas, a long held position that we believe is still significantly undervalued. AWE was subject to a takeover offer, while Syrah Resources is the world’s largest graphite deposit. Lend Lease underperformed during the quarter, but remains compelling value in our view. Ctrip.com is China’s largest online travel agent and has strong structural tailwinds. The weight in Asian stocks is currently 8%.
1 month % 3 months % 6 months % 1 years % p.a. 3 years % p.a. Inception % p.a.
CHESTER HCF (after MER) +1.64 +11.43 +20.58 na na +23.49
S&P/ASX 300 Accumulation Index +1.86 +7.74 +8.61 na na +6.07
Value added (after MER) -0.22 +3.69 +11.98 na na +17.43
“Vir prudens non contra ventum mingit” Latin proverb
The Quarter in Review
2017 ended with strong momentum both from an equities return perspective and the trajectory of economic growth, which augurs well for the first half of 2018. The ASX finally kept pace with Global Indices for the 4Q, while remaining a significant laggard over the past 1 year and 5 year time horizons. We do view the current economic strength globally as the best way for the ASX to outperform this year, most likely in the form of upgrades to the materials sector, but this will still be driven by Chinese demand.
The finalisation of the US tax package gives more certainty around corporate earnings in the US and paves the way for a concerted effort on infrastructure spending, which is also what we see driving the domestic economy in 2018. Historically, bull markets finish with a wave of M&A activity, which has just started to play out during the last 4 weeks of 2017 with a raft of corporate announcements. Business confidence combined with the tax reform progress looks to have awoken animal spirits. It feels like 2007 was the last time that sentiment was expressed.
Of course, we are very mindful of the assistance central banks have provided to asset markets over the past 9 years. It appears imminent that some of this support is removed as financial conditions look too easy for the growth momentum we are currently experiencing. US Interest rate hikes and the unwinding of QE programs in Europe and Japan may signal that asset prices have peaked, but from our
Note Inception date as the 27th of April, 2017. After fees calculations includes both management fees and accrued performance fees for the period.
The NAV as of the 31st of December 2017 was $1.2349. Note the spread between the buy and sell price is 30bpts.
Chester High Conviction Fund Sector Weights
Materials Energy Industrials
Financials Health Care Consumer Discretionary
Consumer Staples Telecommunication Services Information Technology
Utilities Real Estate Gold
Liquidity
Chester High Conviction FundMarket Commentary
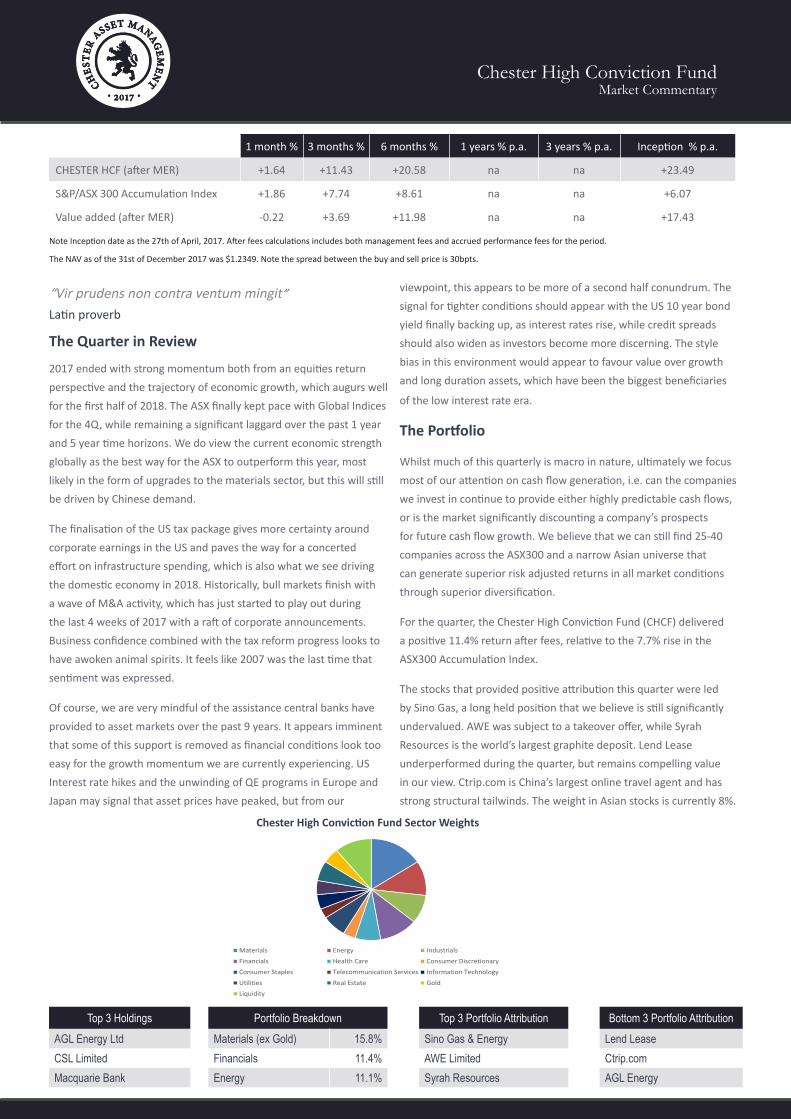
2013# 2014 2015 2016 2017^ Total Return Total Return % p.a.
SGH Australia Plus (after MER) +5.68 +19.38 +22.05 +10.73 +3.25 +76.05 +18.16
S&P/ASX 300 Accumulation Index +4.75 +5.30 +2.80 +11.79 +1.34 +28.53 +7.62
Value added (after MER) +0.93 +14.08 +19.25 -1.06 +1.91 +47.52 +10.54
# Inception date as the 8th of October, 2013. ^ First 2 months of 2017. After fees calculation includes both management fees and accrued performance fees.
Source, SGH Australia Plus unit price history, Bloomberg
2005 2006 2007 2008 2009 Total Return Total return % p.a.
HSBC Australian Country Funds (USD) +18.44 +31.25 +35.33 -47.17 +78.96 +98.83 +14.74
FTSE AUS+NZ (USD) +15.42 +30.18 +27.80 -50.76 +73.69 +64.23 +10.43
Value added (after MER) +3.02 +1.07 +7.53 +3.59 +5.27 +34.60 +4.31
Past Performance - SGH Australia Plus Fund October 2013 - February 2017
Past Performance - HSBC Australian Country Fund January 2005 - December 2009
We note this is a statement of fact of the performance achieved by the fund during the time which Rob Tucker was the sole Portfolio Manager making active decisions on the SGH Australia Plus portfolio. We note performance is the record of the firm not the individual however past performance has been constructed from publicly available unit price data. Past performance is not necessarily indicative of future performance and should not be relied upon in making investment decisions.
We note this is a statement of fact of the performance achieved by the fund during the time which Rob Tucker was the sole Portfolio Manager making active decisions on the HSBC Austra-lian portfolios. Past performance is not necessarily indicative of future performance and should not be relied upon in making investment decisions. The HSBC Australian Funds were run on a benchmark aware basis with a 3% tracking error constraint, hence are not directly comparable to the Chester High Conviction Fund.
Source: HSBC Asset Management (formerly known as Halbis Capital Management). Performance is a combination of various institutional mandates that has been presented in a GIPS compliant format.
800
1000
1200
1400
1600
1800
2000
2200
2400
Oct-1
3
Dec-1
3
Feb-1
4
Apr-1
4
Jun-14
Aug-1
4
Oct-1
4
Dec-1
4
Feb-1
5
Apr-1
5
Jun-15
Aug-1
5
Oct-1
5
Dec-1
5
Feb-1
6
Apr-1
6
Jun-16
Aug-1
6
Oct-1
6
Dec-1
6
Feb-1
7
Apr-1
7
Jun-17
Aug-1
7
Oct-1
7
Dec-1
7Combined SGH Australia Plus and Chester High Conviction Fund Track record
Same Strategy ASX300 Accum Index
SGH Australia Plus Track record -October 2013 to Feb 2017
118.1%
36.1%
Combined performance using the same strategy - SGH Australia Plus and the Chester High Conviction Fund
Note this graph is representative only of the combination of the same Portfolio Manager running the same strategy, and would only represent actual returns for unit holders that invested money at inception of SGH Australia Plus, withdrew those funds at the end of February 2017 and then invested all those initial funds again at inception of the Chester High Conviction Fund in April 2017. Note, this depicts returns after fees.
Chart 1
Chester High Conviction FundMarket Commentary
What we are thinking about...
1. The US 10 Year Bond Yield - Without trying to overplay the significance of the US 10 year bond yield, it really does impact global liquidity flows. Most asset allocation decisions taken at large global fund houses, will be driven by the CIO or investment teams trying to forecast the direction of the 10 year bond. It does appear to be at a critical juncture technically, after a 35 year bull market for bonds (staring in 1982). Will 2018 change this long term trend line (highlighted on page 5)? It has large ramifications for the way equity markets price stocks, particularly long duration assets (infrastructure, property, utilities etc).
2. Global PMI Data - While we were slow to warm up to the cyclical upswing we are currently experiencing, there can be no doubt now that global growth is accelerating into 2018. The most recent PMI readings including the US and China, have confirmed this strength, with the US 3 month reading as high as it has been since 2004. It appears the Fed is in no hurry to accelerate their pace of tightening, which seems to be strategic in letting animal spirits run for a period, as dealing with inflation and accelerating growth is, in theory, easier to deal with than the opposite.
3. M&A Activity - In keeping with the animal spirits mentioned above, we saw first hand the slew of corporate deals announced in December, with 5 takeover offers announced in 5 days. The peak of this was clearly the Unibail-Radamco offer to merge with Westfield Holdings, which to our way of thinking, was simply an interest rate arbitrage between European rates and US rates. Dutch (Unibail home country) 10 year bonds are trading at a yield of 0.53%, while US 10 year bonds are trading at 2.46%, or almost a 2% spread in the cost of funding. We think the Lowys have been very canny in their timing to exit shopping centres. We understand the next 6 months for investment bankers looks very busy.
4. Peak Credit Spreads? - A lot of information passes across us through various news outlets, e-mails, twitter, etc. There was one story that captured our attention more than others in the past quarter. Veolia (a French waste management company) managed to issue a EUR500m bond in November for a 3 year zero coupon issue at -0.026%. Let us say that again. A BBB rated industrial company was actually PAID to take money from investors for 3 years, who still subscribed to the bond issue knowing they will lose 2.6bp per year. This was on the 15th of November 2017. It seems highly unlikely to us that a deal like that ever occurs again.
5. Bitcoin vs Gold – Only because it is topical. We think bitcoin is impossible to value as it can not be used as a medium of exchange, therefore we will not own any ourselves. We are also unconvinced that someone with more technical expertise couldn’t hack our bitcoin wallet and steal our bitcoins. If we were genuinely concerned with a North Korean attack or an EMP (electromagnetic pulse) that knocked out the internet, we would have a strong
preference for real assets (art, jewellery, gold, diamonds etc) that could be exchanged for food or shelter. It worked in WW2. Storing alternative assets on the internet seems illogical to us. We also tend to think when the bitcoin (cyrptocurrency) bubble bursts, which it inevitably will, much of the alternative asset class money will flow back to gold.
6. Income Disparity - We have written on this previously, and it has been widely discussed, but it is a genuine concern for society that the income gap remains as wide as it has. With better job prospects and close to full employment, the protests and social unrest has quietened in recent months (unless you’re Harvey Weinstein), but the disparity between the have and have nots is still growing wider. We discuss this in more detail on page 13 and the longer term issues, particularly for the younger demographic.
7. ESG Issues - We have no problem reading some high quality research and filtering down to share with our readers. Macquarie (analyst Phineas Glover) has compiled a list of 10 critical ESG issues that all portfolio managers need to be across. These issues affect all companies so is a very timely reminder of some of the issue we need to be mindful of when speaking to management. The complete list is outlined on page 10, but includes cybercrime, automation and labour disputes, succession planning, modern slavery and water scarcity.
8. Watchlist Stocks - We spend most of our waking hours searching for the highest conviction ideas we can find, but through a combination of thematic (megatrend) screening, quant screening, an extensive visitation program and our own library of fundamental analysis, we compile a watchlist of stocks that for various reasons (most often valuation concerns) are not currently in the portfolio. We try to limit the watchlist to 50 stocks outside of the portfolio. We then assess on a regular basis whether these stocks are more likely to generate stronger returns than stocks currently in the portfolio, and as such they are effectively competing for capital against the stocks we currently hold. We list 10 stocks on the watchlist on page 10.
9. Portfolio Lifecycle - We illustrate on page 11 how we think about building a diversified portfolio, not just across industry sectors, but across industry lifecycles. We often allocate a small amount of capital to development assets, while the bulk of the funds are allocated to stocks that we believe can grow above nominal GDP, or will provide predictable cash flows with strong positions in mature industries.
10. Valuations - where are we? Clearly this has been a protracted bull market (without greater than a 20% correction), so we look at different ways to assess the value or otherwise across the market. A lot of this is iterative, meaning much of our thinking about equity market valuations is driven by our view on where interest rates will trend. Which takes us back to point 1.
Chester High Conviction FundMarket Commentary
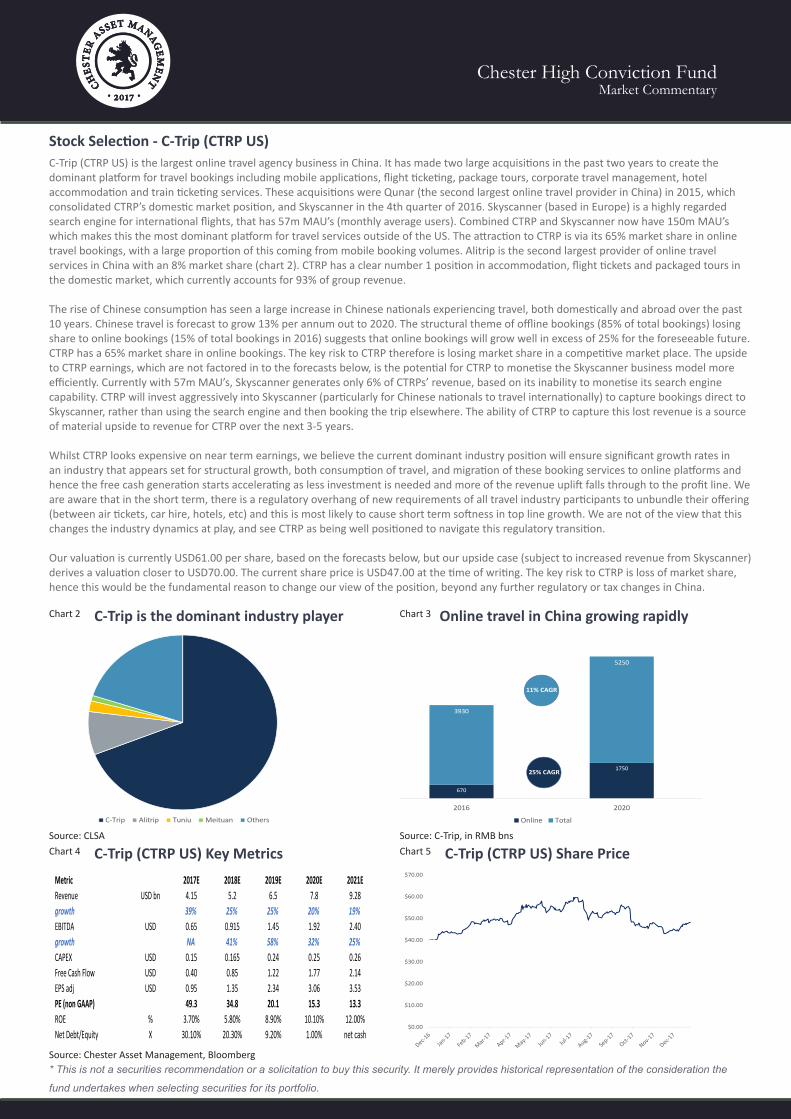
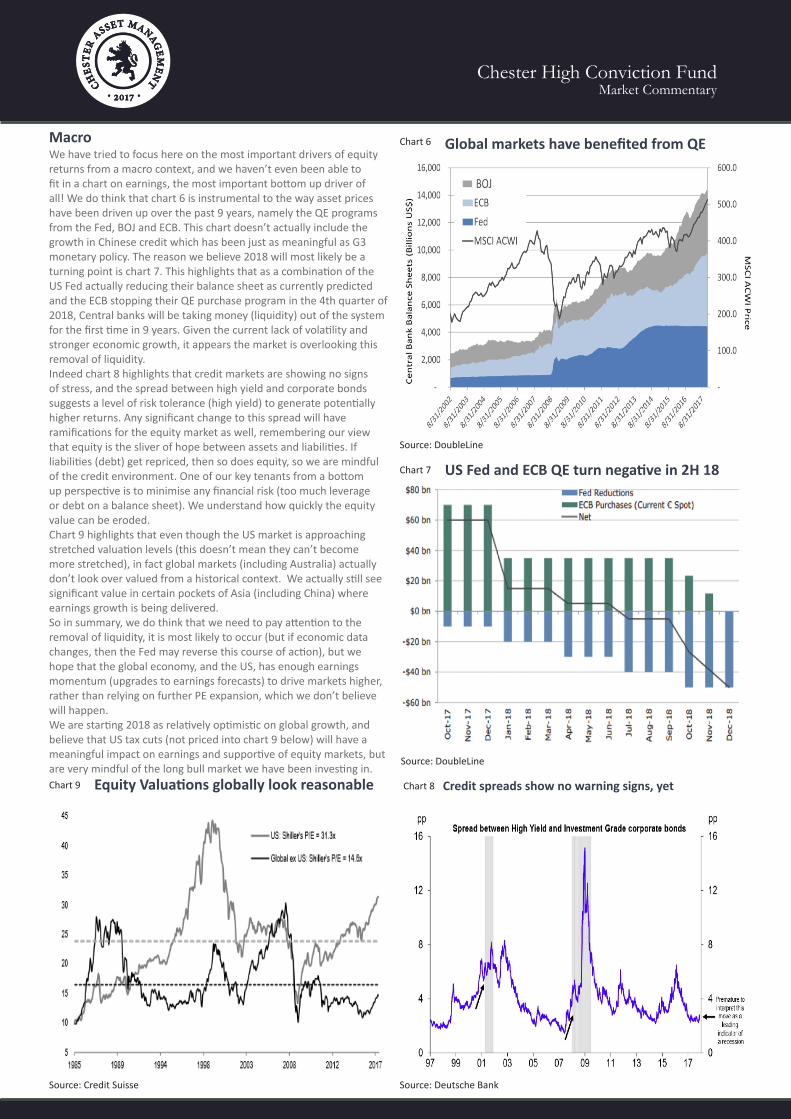
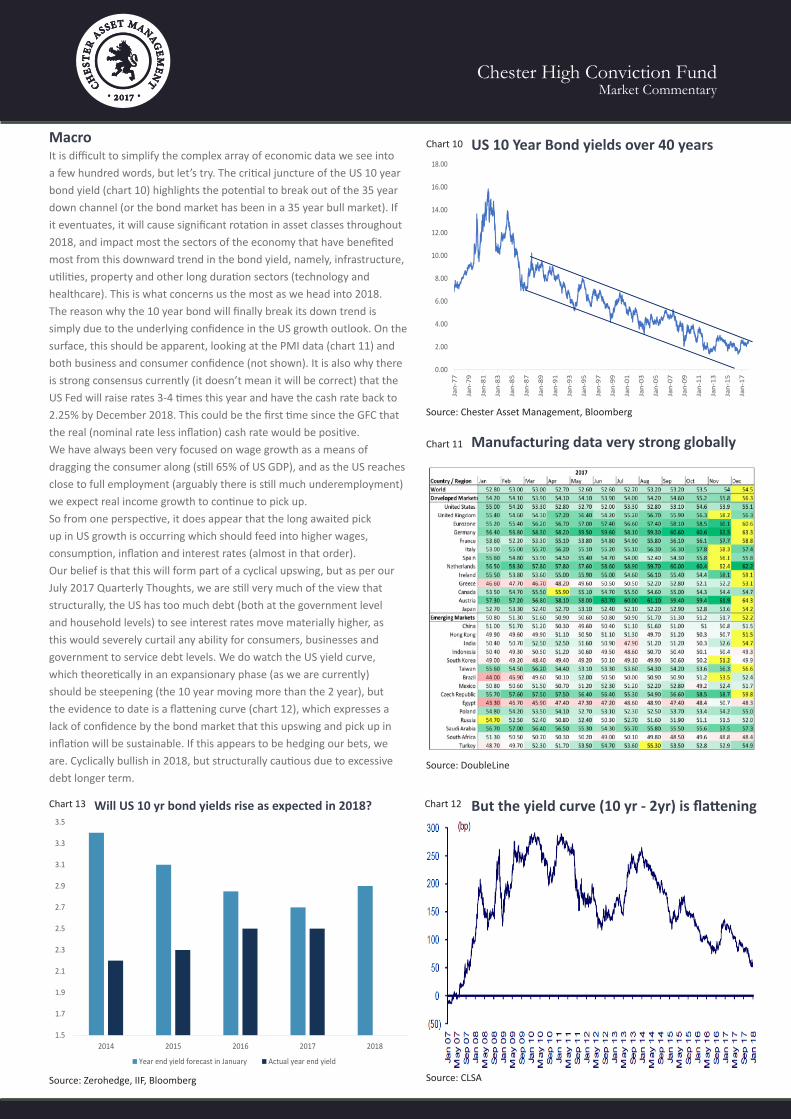
Stock Selection - C-Trip (CTRP US)C-Trip (CTRP US) is the largest online travel agency business in China. It has made two large acquisitions in the past two years to create the dominant platform for travel bookings including mobile applications, flight ticketing, package tours, corporate travel management, hotel accommodation and train ticketing services. These acquisitions were Qunar (the second largest online travel provider in China) in 2015, which consolidated CTRP’s domestic market position, and Skyscanner in the 4th quarter of 2016. Skyscanner (based in Europe) is a highly regarded search engine for international flights, that has 57m MAU’s (monthly average users). Combined CTRP and Skyscanner now have 150m MAU’s which makes this the most dominant platform for travel services outside of the US. The attraction to CTRP is via its 65% market share in online travel bookings, with a large proportion of this coming from mobile booking volumes. Alitrip is the second largest provider of online travel services in China with an 8% market share (chart 2). CTRP has a clear number 1 position in accommodation, flight tickets and packaged tours in the domestic market, which currently accounts for 93% of group revenue. The rise of Chinese consumption has seen a large increase in Chinese nationals experiencing travel, both domestically and abroad over the past 10 years. Chinese travel is forecast to grow 13% per annum out to 2020. The structural theme of offline bookings (85% of total bookings) losing share to online bookings (15% of total bookings in 2016) suggests that online bookings will grow well in excess of 25% for the foreseeable future. CTRP has a 65% market share in online bookings. The key risk to CTRP therefore is losing market share in a competitive market place. The upside to CTRP earnings, which are not factored in to the forecasts below, is the potential for CTRP to monetise the Skyscanner business model more efficiently. Currently with 57m MAU’s, Skyscanner generates only 6% of CTRPs’ revenue, based on its inability to monetise its search engine capability. CTRP will invest aggressively into Skyscanner (particularly for Chinese nationals to travel internationally) to capture bookings direct to Skyscanner, rather than using the search engine and then booking the trip elsewhere. The ability of CTRP to capture this lost revenue is a source of material upside to revenue for CTRP over the next 3-5 years.
Whilst CTRP looks expensive on near term earnings, we believe the current dominant industry position will ensure significant growth rates in an industry that appears set for structural growth, both consumption of travel, and migration of these booking services to online platforms and hence the free cash generation starts accelerating as less investment is needed and more of the revenue uplift falls through to the profit line. We are aware that in the short term, there is a regulatory overhang of new requirements of all travel industry participants to unbundle their offering (between air tickets, car hire, hotels, etc) and this is most likely to cause short term softness in top line growth. We are not of the view that this changes the industry dynamics at play, and see CTRP as being well positioned to navigate this regulatory transition.
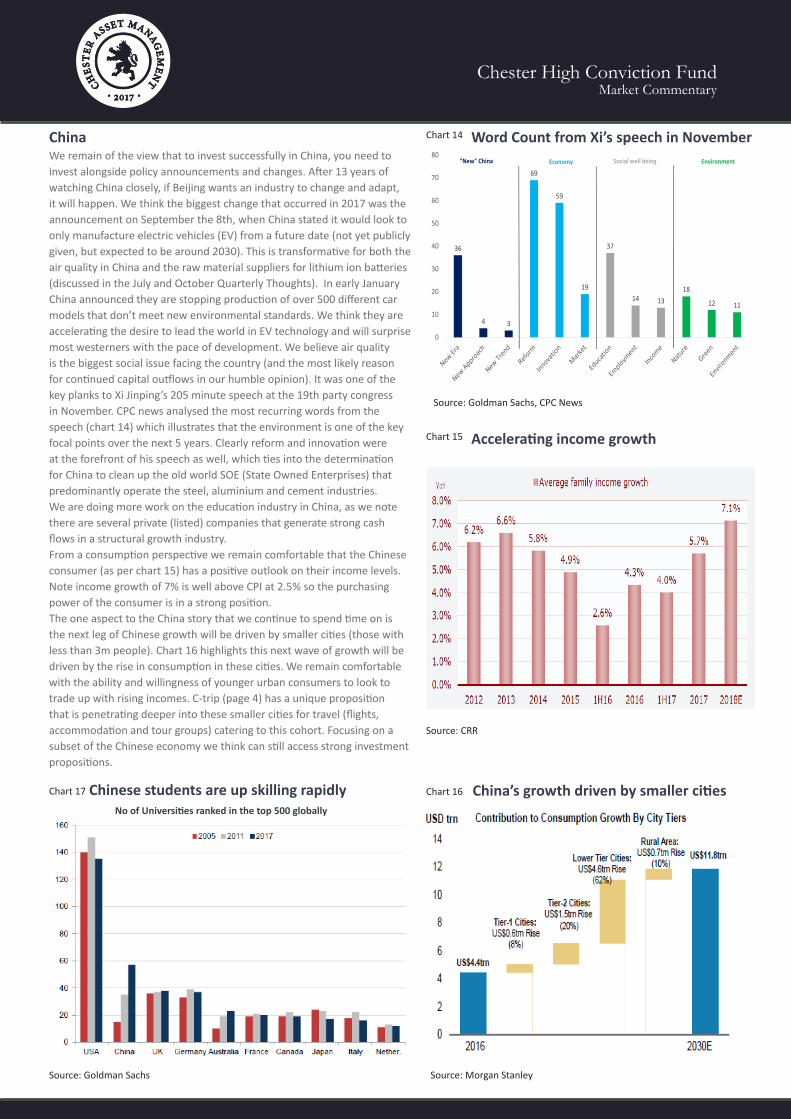
Our valuation is currently USD61.00 per share, based on the forecasts below, but our upside case (subject to increased revenue from Skyscanner) derives a valuation closer to USD70.00. The current share price is USD47.00 at the time of writing. The key risk to CTRP is loss of market share, hence this would be the fundamental reason to change our view of the position, beyond any further regulatory or tax changes in China.
C-Trip (CTRP US) Key Metrics
* This is not a securities recommendation or a solicitation to buy this security. It merely provides historical representation of the consideration the
fund undertakes when selecting securities for its portfolio.
C-Trip (CTRP US) Share Price
C-Trip is the dominant industry player Online travel in China growing rapidly
Source: CLSA Source: C-Trip, in RMB bns
Source: Chester Asset Management, Bloomberg
670
1750
3930
5250
2016 2020
Online Total
11% CAGR
25% CAGR
C-Trip Alitrip Tuniu Meituan Others
Metric 2017E 2018E 2019E 2020E 2021ERevenue USD bn 4.15 5.2 6.5 7.8 9.28growth 39% 25% 25% 20% 19%EBITDA USD 0.65 0.915 1.45 1.92 2.40growth NA 41% 58% 32% 25%CAPEX USD 0.15 0.165 0.24 0.25 0.26Free Cash Flow USD 0.40 0.85 1.22 1.77 2.14EPS adj USD 0.95 1.35 2.34 3.06 3.53PE (non GAAP) 49.3 34.8 20.1 15.3 13.3ROE % 3.70% 5.80% 8.90% 10.10% 12.00%Net Debt/Equity X 30.10% 20.30% 9.20% 1.00% net cash
$0.00
$10.00
$20.00
$30.00
$40.00
$50.00
$60.00
$70.00
Chart 2 Chart 3
Chart 4 Chart 5
Chester High Conviction FundMarket Commentary
MacroWe have tried to focus here on the most important drivers of equity returns from a macro context, and we haven’t even been able to fit in a chart on earnings, the most important bottom up driver of all! We do think that chart 6 is instrumental to the way asset prices have been driven up over the past 9 years, namely the QE programs from the Fed, BOJ and ECB. This chart doesn’t actually include the growth in Chinese credit which has been just as meaningful as G3 monetary policy. The reason we believe 2018 will most likely be a turning point is chart 7. This highlights that as a combination of the US Fed actually reducing their balance sheet as currently predicted and the ECB stopping their QE purchase program in the 4th quarter of 2018, Central banks will be taking money (liquidity) out of the system for the first time in 9 years. Given the current lack of volatility and stronger economic growth, it appears the market is overlooking this removal of liquidity.Indeed chart 8 highlights that credit markets are showing no signs of stress, and the spread between high yield and corporate bonds suggests a level of risk tolerance (high yield) to generate potentially higher returns. Any significant change to this spread will have ramifications for the equity market as well, remembering our view that equity is the sliver of hope between assets and liabilities. If liabilities (debt) get repriced, then so does equity, so we are mindful of the credit environment. One of our key tenants from a bottom up perspective is to minimise any financial risk (too much leverage or debt on a balance sheet). We understand how quickly the equity value can be eroded.Chart 9 highlights that even though the US market is approaching stretched valuation levels (this doesn’t mean they can’t become more stretched), in fact global markets (including Australia) actually don’t look over valued from a historical context. We actually still see significant value in certain pockets of Asia (including China) where earnings growth is being delivered.So in summary, we do think that we need to pay attention to the removal of liquidity, it is most likely to occur (but if economic data changes, then the Fed may reverse this course of action), but we hope that the global economy, and the US, has enough earnings momentum (upgrades to earnings forecasts) to drive markets higher, rather than relying on further PE expansion, which we don’t believe will happen.We are starting 2018 as relatively optimistic on global growth, and believe that US tax cuts (not priced into chart 9 below) will have a meaningful impact on earnings and supportive of equity markets, but are very mindful of the long bull market we have been investing in.
Source: Deutsche Bank
Chart 8 Credit spreads show no warning signs, yet
Chart 7 US Fed and ECB QE turn negative in 2H 18
Chart 6 Global markets have benefited from QE
Source: DoubleLine
Source: DoubleLine
Source: Credit Suisse
Equity Valuations globally look reasonableChart 9
Chester High Conviction FundMarket Commentary
Macro It is difficult to simplify the complex array of economic data we see into a few hundred words, but let’s try. The critical juncture of the US 10 year bond yield (chart 10) highlights the potential to break out of the 35 year down channel (or the bond market has been in a 35 year bull market). If it eventuates, it will cause significant rotation in asset classes throughout 2018, and impact most the sectors of the economy that have benefited most from this downward trend in the bond yield, namely, infrastructure, utilities, property and other long duration sectors (technology and healthcare). This is what concerns us the most as we head into 2018.The reason why the 10 year bond will finally break its down trend is simply due to the underlying confidence in the US growth outlook. On the surface, this should be apparent, looking at the PMI data (chart 11) and both business and consumer confidence (not shown). It is also why there is strong consensus currently (it doesn’t mean it will be correct) that the US Fed will raise rates 3-4 times this year and have the cash rate back to 2.25% by December 2018. This could be the first time since the GFC that the real (nominal rate less inflation) cash rate would be positive. We have always been very focused on wage growth as a means of dragging the consumer along (still 65% of US GDP), and as the US reaches close to full employment (arguably there is still much underemployment) we expect real income growth to continue to pick up. So from one perspective, it does appear that the long awaited pick up in US growth is occurring which should feed into higher wages, consumption, inflation and interest rates (almost in that order).Our belief is that this will form part of a cyclical upswing, but as per our July 2017 Quarterly Thoughts, we are still very much of the view that structurally, the US has too much debt (both at the government level and household levels) to see interest rates move materially higher, as this would severely curtail any ability for consumers, businesses and government to service debt levels. We do watch the US yield curve, which theoretically in an expansionary phase (as we are currently) should be steepening (the 10 year moving more than the 2 year), but the evidence to date is a flattening curve (chart 12), which expresses a lack of confidence by the bond market that this upswing and pick up in inflation will be sustainable. If this appears to be hedging our bets, we are. Cyclically bullish in 2018, but structurally cautious due to excessive debt longer term.
Source: Chester Asset Management, Bloomberg
Chart 10
Source: DoubleLine
Chart 11
Source: CLSA
Chart 12 But the yield curve (10 yr - 2yr) is flattening
Manufacturing data very strong globally
US 10 Year Bond yields over 40 years
Will US 10 yr bond yields rise as expected in 2018?Chart 13
0.00
2.00
4.00
6.00
8.00
10.00
12.00
14.00
16.00
18.00
Jan-77
Jan-79
Jan-81
Jan-83
Jan-85
Jan-87
Jan-89
Jan-91
Jan-93
Jan-95
Jan-97
Jan-99
Jan-01
Jan-03
Jan-05
Jan-07
Jan-09
Jan-11
Jan-13
Jan-15
Jan-17
Source: Zerohedge, IIF, Bloomberg
1.5
1.7
1.9
2.1
2.3
2.5
2.7
2.9
3.1
3.3
3.5
2014 2015 2016 2017 2018
Year end yield forecast in January Actual year end yield
Chester High Conviction FundMarket Commentary
ChinaWe remain of the view that to invest successfully in China, you need to invest alongside policy announcements and changes. After 13 years of watching China closely, if Beijing wants an industry to change and adapt, it will happen. We think the biggest change that occurred in 2017 was the announcement on September the 8th, when China stated it would look to only manufacture electric vehicles (EV) from a future date (not yet publicly given, but expected to be around 2030). This is transformative for both the air quality in China and the raw material suppliers for lithium ion batteries (discussed in the July and October Quarterly Thoughts). In early January China announced they are stopping production of over 500 different car models that don’t meet new environmental standards. We think they are accelerating the desire to lead the world in EV technology and will surprise most westerners with the pace of development. We believe air quality is the biggest social issue facing the country (and the most likely reason for continued capital outflows in our humble opinion). It was one of the key planks to Xi Jinping’s 205 minute speech at the 19th party congress in November. CPC news analysed the most recurring words from the speech (chart 14) which illustrates that the environment is one of the key focal points over the next 5 years. Clearly reform and innovation were at the forefront of his speech as well, which ties into the determination for China to clean up the old world SOE (State Owned Enterprises) that predominantly operate the steel, aluminium and cement industries.We are doing more work on the education industry in China, as we note there are several private (listed) companies that generate strong cash flows in a structural growth industry.From a consumption perspective we remain comfortable that the Chinese consumer (as per chart 15) has a positive outlook on their income levels. Note income growth of 7% is well above CPI at 2.5% so the purchasing power of the consumer is in a strong position.The one aspect to the China story that we continue to spend time on is the next leg of Chinese growth will be driven by smaller cities (those with less than 3m people). Chart 16 highlights this next wave of growth will be driven by the rise in consumption in these cities. We remain comfortable with the ability and willingness of younger urban consumers to look to trade up with rising incomes. C-trip (page 4) has a unique proposition that is penetrating deeper into these smaller cities for travel (flights, accommodation and tour groups) catering to this cohort. Focusing on a subset of the Chinese economy we think can still access strong investment propositions.
Source: Goldman Sachs, CPC News
Chart 14
Source: CRR
Chart 15
Source: Morgan Stanley
Chart 16 China’s growth driven by smaller cities
Accelerating income growth
Word Count from Xi’s speech in November
36
4 3
69
59
19
37
14 1318
12 11
0
10
20
30
40
50
60
70
80"New" China Economy Social well being Environment
Chinese students are up skilling rapidlyChart 17
Source: Goldman Sachs
No of Universities ranked in the top 500 globally
Chester High Conviction FundMarket Commentary
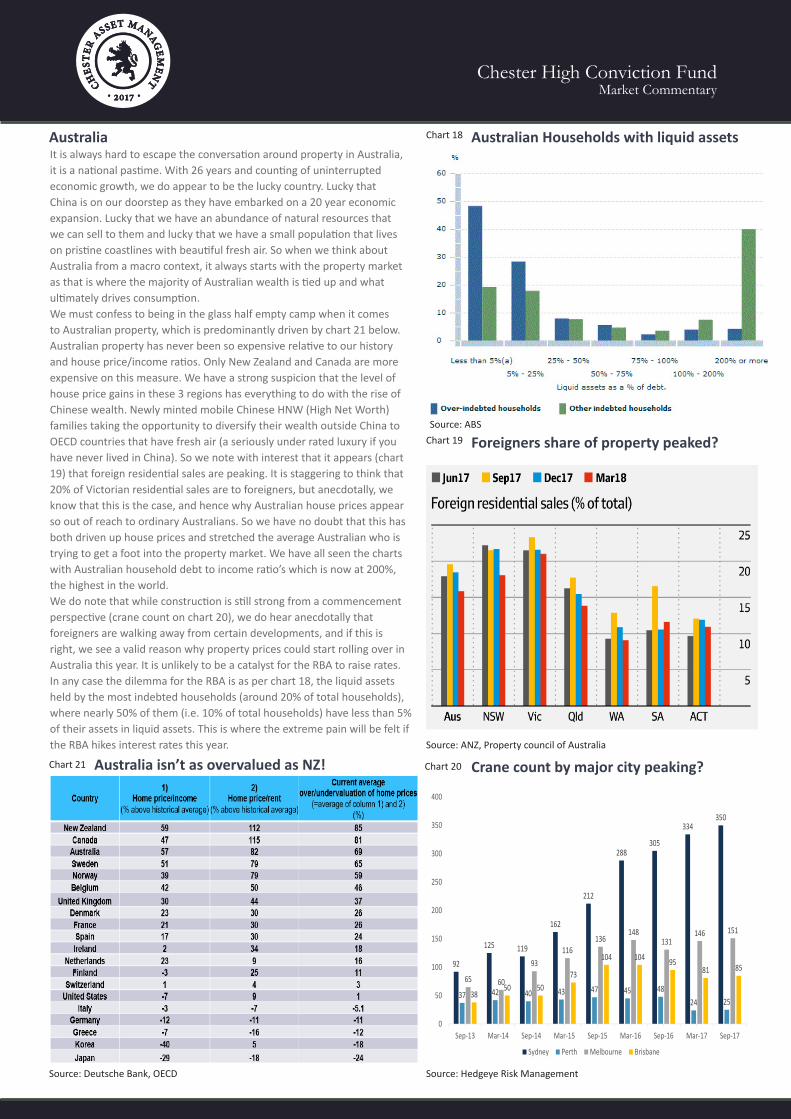
AustraliaIt is always hard to escape the conversation around property in Australia, it is a national pastime. With 26 years and counting of uninterrupted economic growth, we do appear to be the lucky country. Lucky that China is on our doorstep as they have embarked on a 20 year economic expansion. Lucky that we have an abundance of natural resources that we can sell to them and lucky that we have a small population that lives on pristine coastlines with beautiful fresh air. So when we think about Australia from a macro context, it always starts with the property market as that is where the majority of Australian wealth is tied up and what ultimately drives consumption. We must confess to being in the glass half empty camp when it comes to Australian property, which is predominantly driven by chart 21 below. Australian property has never been so expensive relative to our history and house price/income ratios. Only New Zealand and Canada are more expensive on this measure. We have a strong suspicion that the level of house price gains in these 3 regions has everything to do with the rise of Chinese wealth. Newly minted mobile Chinese HNW (High Net Worth) families taking the opportunity to diversify their wealth outside China to OECD countries that have fresh air (a seriously under rated luxury if you have never lived in China). So we note with interest that it appears (chart 19) that foreign residential sales are peaking. It is staggering to think that 20% of Victorian residential sales are to foreigners, but anecdotally, we know that this is the case, and hence why Australian house prices appear so out of reach to ordinary Australians. So we have no doubt that this has both driven up house prices and stretched the average Australian who is trying to get a foot into the property market. We have all seen the charts with Australian household debt to income ratio’s which is now at 200%, the highest in the world.We do note that while construction is still strong from a commencement perspective (crane count on chart 20), we do hear anecdotally that foreigners are walking away from certain developments, and if this is right, we see a valid reason why property prices could start rolling over in Australia this year. It is unlikely to be a catalyst for the RBA to raise rates. In any case the dilemma for the RBA is as per chart 18, the liquid assets held by the most indebted households (around 20% of total households), where nearly 50% of them (i.e. 10% of total households) have less than 5% of their assets in liquid assets. This is where the extreme pain will be felt if the RBA hikes interest rates this year.
Source: ABS
Chart 18
Source: ANZ, Property council of Australia
Chart 19
Source: Hedgeye Risk Management
Chart 20 Crane count by major city peaking?
Foreigners share of property peaked?
Australian Households with liquid assets
Australia isn’t as overvalued as NZ!Chart 21
92
125 119
162
212
288305
334350
37 42 40 43 47 45 4824 25
65 60
93116
136148
131146 151
3850 50
73
104 104 9581 85
0
50
100
150
200
250
300
350
400
Sep-13 Mar-14 Sep-14 Mar-15 Sep-15 Mar-16 Sep-16 Mar-17 Sep-17
Sydney Perth Melbourne Brisbane
Source: Deutsche Bank, OECD
Chester High Conviction FundMarket Commentary
Watchlist Stocks
Source: Chester Asset Management, Bloomberg
Chart 22
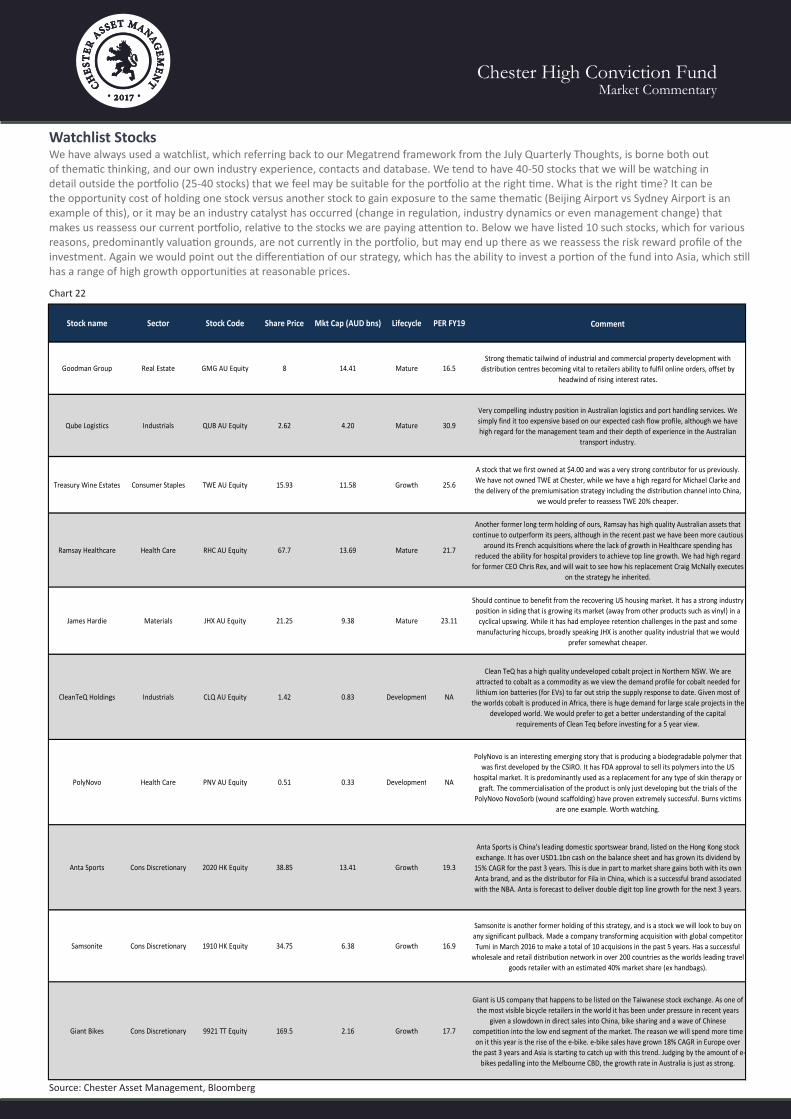
We have always used a watchlist, which referring back to our Megatrend framework from the July Quarterly Thoughts, is borne both out of thematic thinking, and our own industry experience, contacts and database. We tend to have 40-50 stocks that we will be watching in detail outside the portfolio (25-40 stocks) that we feel may be suitable for the portfolio at the right time. What is the right time? It can be the opportunity cost of holding one stock versus another stock to gain exposure to the same thematic (Beijing Airport vs Sydney Airport is an example of this), or it may be an industry catalyst has occurred (change in regulation, industry dynamics or even management change) that makes us reassess our current portfolio, relative to the stocks we are paying attention to. Below we have listed 10 such stocks, which for various reasons, predominantly valuation grounds, are not currently in the portfolio, but may end up there as we reassess the risk reward profile of the investment. Again we would point out the differentiation of our strategy, which has the ability to invest a portion of the fund into Asia, which still has a range of high growth opportunities at reasonable prices.
GICS_SECTOR_NAME LAST_PRICE CUR_MKT_CAP
Stock name Sector Stock Code Share Price Mkt Cap (AUD bns) Lifecycle PER FY19 Comment
Goodman Group Real Estate GMG AU Equity 8 14.41 Mature 16.5Strong thematic tailwind of industrial and commercial property development with
distribution centres becoming vital to retailers ability to fulfil online orders, offset by headwind of rising interest rates.
Qube Logistics Industrials QUB AU Equity 2.62 4.20 Mature 30.9
Very compelling industry position in Australian logistics and port handling services. We simply find it too expensive based on our expected cash flow profile, although we have high regard for the management team and their depth of experience in the Australian
transport industry.
Treasury Wine Estates Consumer Staples TWE AU Equity 15.93 11.58 Growth 25.6
A stock that we first owned at $4.00 and was a very strong contributor for us previously. We have not owned TWE at Chester, while we have a high regard for Michael Clarke and the delivery of the premiumisation strategy including the distribution channel into China,
we would prefer to reassess TWE 20% cheaper.
Ramsay Healthcare Health Care RHC AU Equity 67.7 13.69 Mature 21.7
Another former long term holding of ours, Ramsay has high quality Australian assets that continue to outperform its peers, although in the recent past we have been more cautious
around its French acquisitions where the lack of growth in Healthcare spending has reduced the ability for hospital providers to achieve top line growth. We had high regard
for former CEO Chris Rex, and will wait to see how his replacement Craig McNally executes on the strategy he inherited.
James Hardie Materials JHX AU Equity 21.25 9.38 Mature 23.11
Should continue to benefit from the recovering US housing market. It has a strong industry position in siding that is growing its market (away from other products such as vinyl) in a cyclical upswing. While it has had employee retention challenges in the past and some
manufacturing hiccups, broadly speaking JHX is another quality industrial that we would prefer somewhat cheaper.
CleanTeQ Holdings Industrials CLQ AU Equity 1.42 0.83 Development NA
Clean TeQ has a high quality undeveloped cobalt project in Northern NSW. We are attracted to cobalt as a commodity as we view the demand profile for cobalt needed for lithium ion batteries (for EVs) to far out strip the supply response to date. Given most of
the worlds cobalt is produced in Africa, there is huge demand for large scale projects in the developed world. We would prefer to get a better understanding of the capital
requirements of Clean Teq before investing for a 5 year view.
PolyNovo Health Care PNV AU Equity 0.51 0.33 Development NA
PolyNovo is an interesting emerging story that is producing a biodegradable polymer that was first developed by the CSIRO. It has FDA approval to sell its polymers into the US
hospital market. It is predominantly used as a replacement for any type of skin therapy or graft. The commercialisation of the product is only just developing but the trials of the
PolyNovo NovoSorb (wound scaffolding) have proven extremely successful. Burns victims are one example. Worth watching.
Anta Sports Cons Discretionary 2020 HK Equity 38.85 13.41 Growth 19.3
Anta Sports is China's leading domestic sportswear brand, listed on the Hong Kong stock exchange. It has over USD1.1bn cash on the balance sheet and has grown its dividend by 15% CAGR for the past 3 years. This is due in part to market share gains both with its own Anta brand, and as the distributor for Fila in China, which is a successful brand associated with the NBA. Anta is forecast to deliver double digit top line growth for the next 3 years.
Samsonite Cons Discretionary 1910 HK Equity 34.75 6.38 Growth 16.9
Samsonite is another former holding of this strategy, and is a stock we will look to buy on any significant pullback. Made a company transforming acquisition with global competitor Tumi in March 2016 to make a total of 10 acquisions in the past 5 years. Has a successful
wholesale and retail distribution network in over 200 countries as the worlds leading travel goods retailer with an estimated 40% market share (ex handbags).
Giant Bikes Cons Discretionary 9921 TT Equity 169.5 2.16 Growth 17.7
Giant is US company that happens to be listed on the Taiwanese stock exchange. As one of the most visible bicycle retailers in the world it has been under pressure in recent years
given a slowdown in direct sales into China, bike sharing and a wave of Chinese competition into the low end segment of the market. The reason we will spend more time on it this year is the rise of the e-bike. e-bike sales have grown 18% CAGR in Europe over
the past 3 years and Asia is starting to catch up with this trend. Judging by the amount of e-bikes pedalling into the Melbourne CBD, the growth rate in Australia is just as strong.
Chester High Conviction FundMarket Commentary
Portfolio Construction
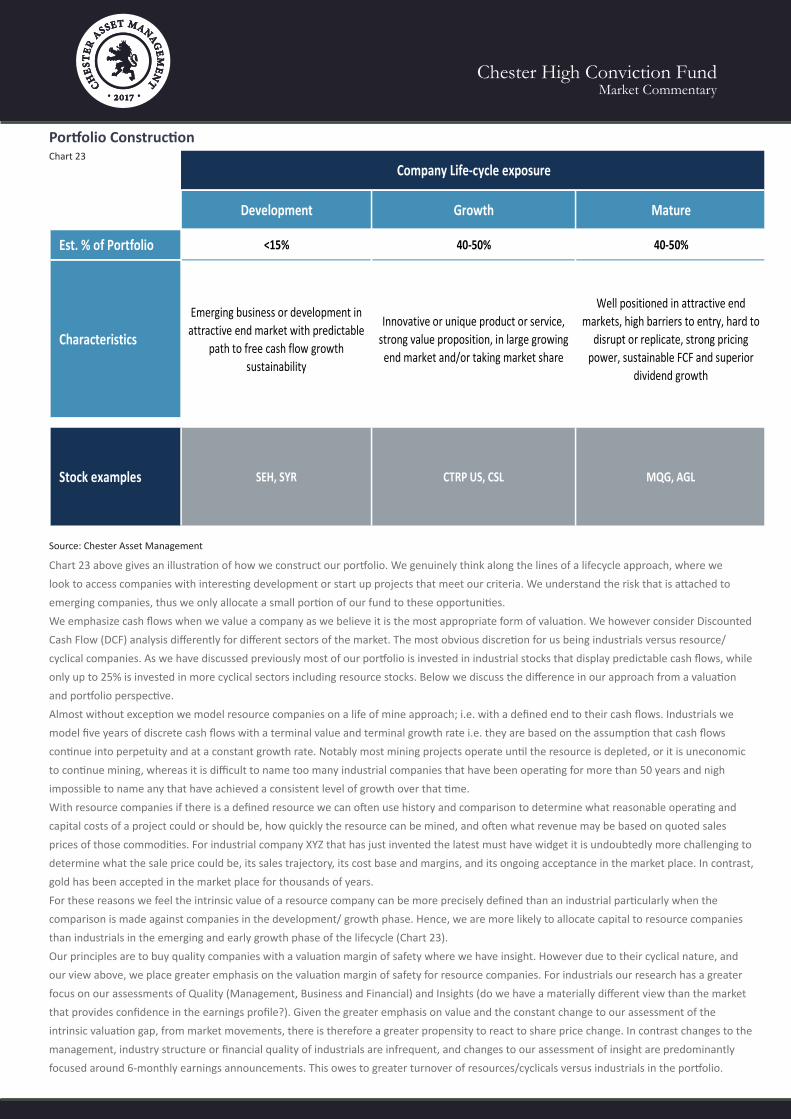
Chart 23 above gives an illustration of how we construct our portfolio. We genuinely think along the lines of a lifecycle approach, where we look to access companies with interesting development or start up projects that meet our criteria. We understand the risk that is attached to emerging companies, thus we only allocate a small portion of our fund to these opportunities.We emphasize cash flows when we value a company as we believe it is the most appropriate form of valuation. We however consider Discounted Cash Flow (DCF) analysis differently for different sectors of the market. The most obvious discretion for us being industrials versus resource/cyclical companies. As we have discussed previously most of our portfolio is invested in industrial stocks that display predictable cash flows, while only up to 25% is invested in more cyclical sectors including resource stocks. Below we discuss the difference in our approach from a valuation and portfolio perspective.Almost without exception we model resource companies on a life of mine approach; i.e. with a defined end to their cash flows. Industrials we model five years of discrete cash flows with a terminal value and terminal growth rate i.e. they are based on the assumption that cash flows continue into perpetuity and at a constant growth rate. Notably most mining projects operate until the resource is depleted, or it is uneconomic to continue mining, whereas it is difficult to name too many industrial companies that have been operating for more than 50 years and nigh impossible to name any that have achieved a consistent level of growth over that time. With resource companies if there is a defined resource we can often use history and comparison to determine what reasonable operating and capital costs of a project could or should be, how quickly the resource can be mined, and often what revenue may be based on quoted sales prices of those commodities. For industrial company XYZ that has just invented the latest must have widget it is undoubtedly more challenging to determine what the sale price could be, its sales trajectory, its cost base and margins, and its ongoing acceptance in the market place. In contrast, gold has been accepted in the market place for thousands of years. For these reasons we feel the intrinsic value of a resource company can be more precisely defined than an industrial particularly when the comparison is made against companies in the development/ growth phase. Hence, we are more likely to allocate capital to resource companies than industrials in the emerging and early growth phase of the lifecycle (Chart 23). Our principles are to buy quality companies with a valuation margin of safety where we have insight. However due to their cyclical nature, and our view above, we place greater emphasis on the valuation margin of safety for resource companies. For industrials our research has a greater focus on our assessments of Quality (Management, Business and Financial) and Insights (do we have a materially different view than the market that provides confidence in the earnings profile?). Given the greater emphasis on value and the constant change to our assessment of the intrinsic valuation gap, from market movements, there is therefore a greater propensity to react to share price change. In contrast changes to the management, industry structure or financial quality of industrials are infrequent, and changes to our assessment of insight are predominantly focused around 6-monthly earnings announcements. This owes to greater turnover of resources/cyclicals versus industrials in the portfolio.
Source: Chester Asset Management
Development Growth Mature
Est. % of Portfolio <15% 40-50% 40-50%
Characteristics
Emerging business or development in attractive end market with predictable
path to free cash flow growth sustainability
Innovative or unique product or service, strong value proposition, in large growing end market and/or taking market share
Well positioned in attractive end markets, high barriers to entry, hard to
disrupt or replicate, strong pricing power, sustainable FCF and superior
dividend growth
Stock examples SEH, SYR CTRP US, CSL MQG, AGL
Company Life-cycle exposureChart 23
Chester High Conviction FundMarket Commentary
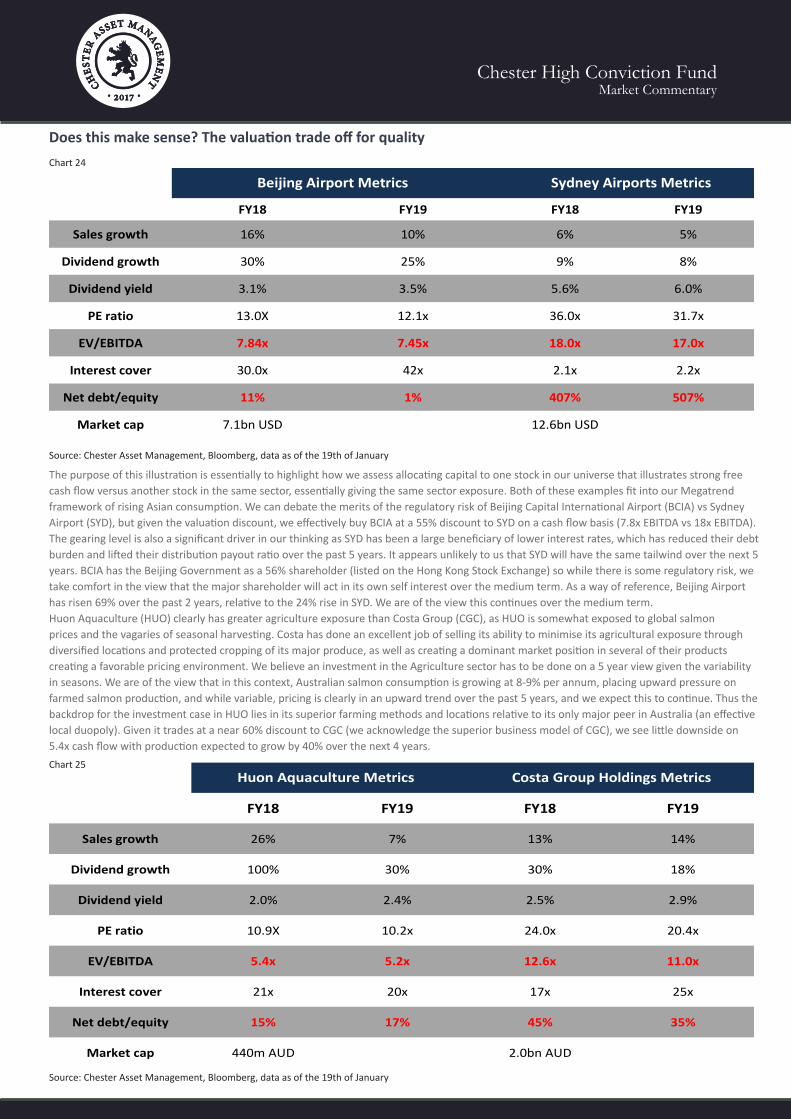
Does this make sense? The valuation trade off for quality
The purpose of this illustration is essentially to highlight how we assess allocating capital to one stock in our universe that illustrates strong free cash flow versus another stock in the same sector, essentially giving the same sector exposure. Both of these examples fit into our Megatrend framework of rising Asian consumption. We can debate the merits of the regulatory risk of Beijing Capital International Airport (BCIA) vs Sydney Airport (SYD), but given the valuation discount, we effectively buy BCIA at a 55% discount to SYD on a cash flow basis (7.8x EBITDA vs 18x EBITDA). The gearing level is also a significant driver in our thinking as SYD has been a large beneficiary of lower interest rates, which has reduced their debt burden and lifted their distribution payout ratio over the past 5 years. It appears unlikely to us that SYD will have the same tailwind over the next 5 years. BCIA has the Beijing Government as a 56% shareholder (listed on the Hong Kong Stock Exchange) so while there is some regulatory risk, we take comfort in the view that the major shareholder will act in its own self interest over the medium term. As a way of reference, Beijing Airport has risen 69% over the past 2 years, relative to the 24% rise in SYD. We are of the view this continues over the medium term.Huon Aquaculture (HUO) clearly has greater agriculture exposure than Costa Group (CGC), as HUO is somewhat exposed to global salmon prices and the vagaries of seasonal harvesting. Costa has done an excellent job of selling its ability to minimise its agricultural exposure through diversified locations and protected cropping of its major produce, as well as creating a dominant market position in several of their products creating a favorable pricing environment. We believe an investment in the Agriculture sector has to be done on a 5 year view given the variability in seasons. We are of the view that in this context, Australian salmon consumption is growing at 8-9% per annum, placing upward pressure on farmed salmon production, and while variable, pricing is clearly in an upward trend over the past 5 years, and we expect this to continue. Thus the backdrop for the investment case in HUO lies in its superior farming methods and locations relative to its only major peer in Australia (an effective local duopoly). Given it trades at a near 60% discount to CGC (we acknowledge the superior business model of CGC), we see little downside on 5.4x cash flow with production expected to grow by 40% over the next 4 years.
Source: Chester Asset Management, Bloomberg, data as of the 19th of January
Chart 24
FY18 FY19 FY18 FY19
Sales growth 26% 7% 13% 14%
Dividend growth 100% 30% 30% 18%
Dividend yield 2.0% 2.4% 2.5% 2.9%
PE ratio 10.9X 10.2x 24.0x 20.4x
EV/EBITDA 5.4x 5.2x 12.6x 11.0x
Interest cover 21x 20x 17x 25x
Net debt/equity 15% 17% 45% 35%
Market cap 440m AUD 2.0bn AUD
Huon Aquaculture Metrics Costa Group Holdings Metrics
Source: Chester Asset Management, Bloomberg, data as of the 19th of January
Chart 25
FY18 FY19 FY18 FY19
Sales growth 16% 10% 6% 5%
Dividend growth 30% 25% 9% 8%
Dividend yield 3.1% 3.5% 5.6% 6.0%
PE ratio 13.0X 12.1x 36.0x 31.7x
EV/EBITDA 7.84x 7.45x 18.0x 17.0x
Interest cover 30.0x 42x 2.1x 2.2x
Net debt/equity 11% 1% 407% 507%
Market cap 7.1bn USD 12.6bn USD
Sydney Airports MetricsBeijing Airport Metrics
Chester High Conviction FundMarket Commentary
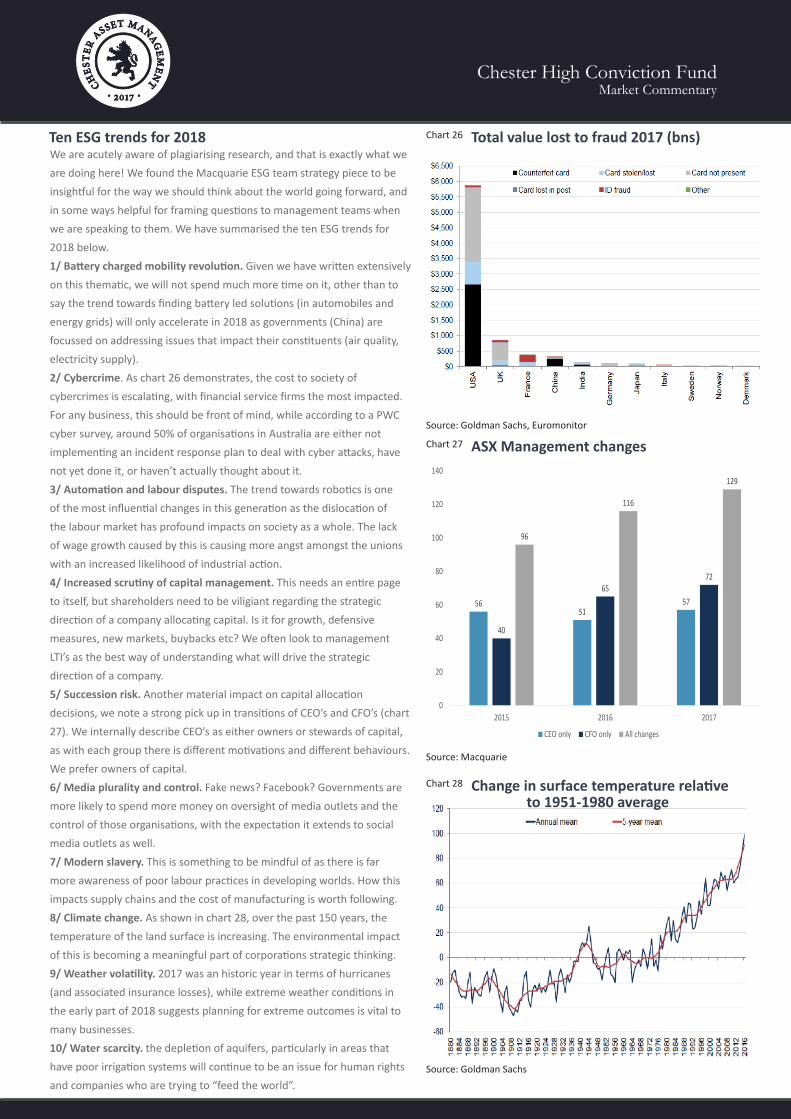
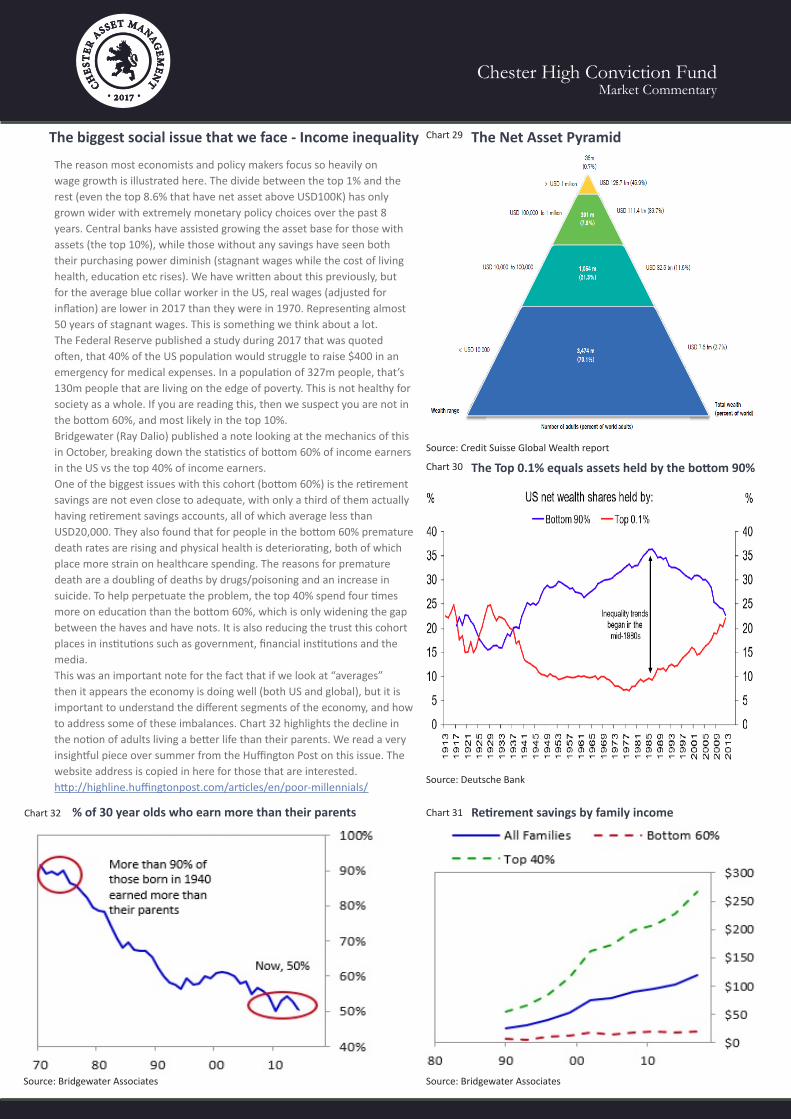
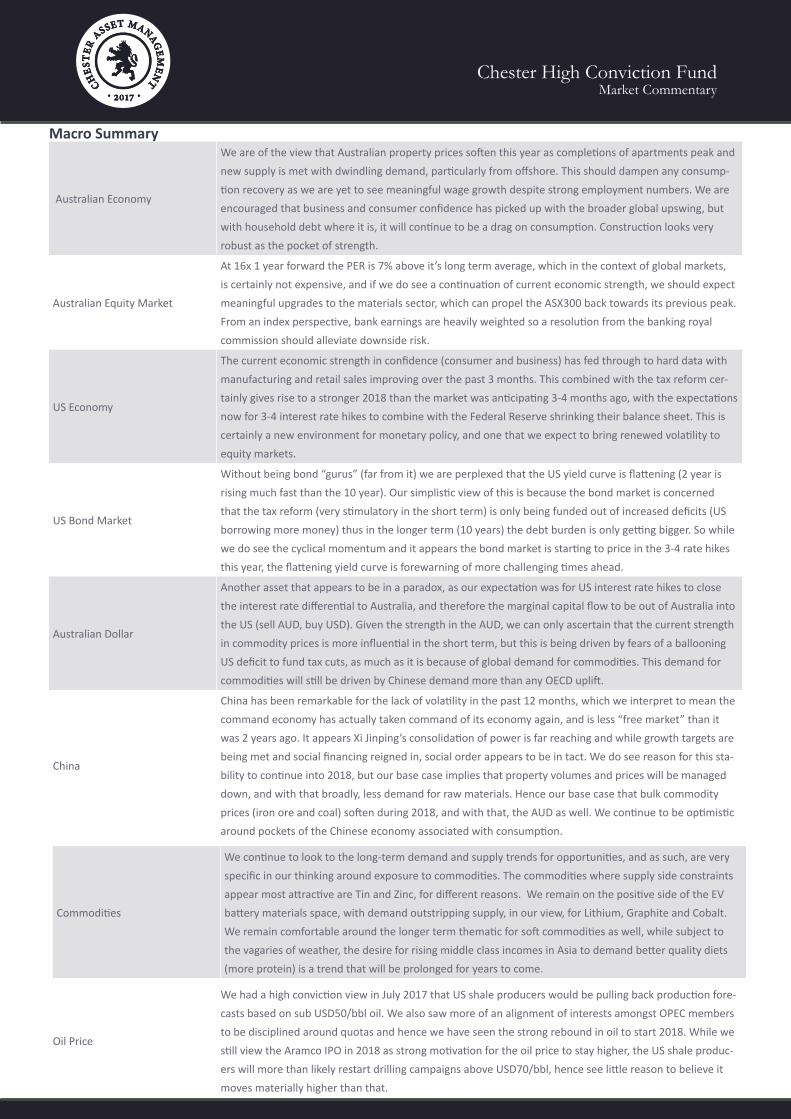
Ten ESG trends for 2018We are acutely aware of plagiarising research, and that is exactly what we are doing here! We found the Macquarie ESG team strategy piece to be insightful for the way we should think about the world going forward, and in some ways helpful for framing questions to management teams when we are speaking to them. We have summarised the ten ESG trends for 2018 below. 1/ Battery charged mobility revolution. Given we have written extensively on this thematic, we will not spend much more time on it, other than to say the trend towards finding battery led solutions (in automobiles and energy grids) will only accelerate in 2018 as governments (China) are focussed on addressing issues that impact their constituents (air quality, electricity supply).2/ Cybercrime. As chart 26 demonstrates, the cost to society of cybercrimes is escalating, with financial service firms the most impacted. For any business, this should be front of mind, while according to a PWC cyber survey, around 50% of organisations in Australia are either not implementing an incident response plan to deal with cyber attacks, have not yet done it, or haven’t actually thought about it. 3/ Automation and labour disputes. The trend towards robotics is one of the most influential changes in this generation as the dislocation of the labour market has profound impacts on society as a whole. The lack of wage growth caused by this is causing more angst amongst the unions with an increased likelihood of industrial action.4/ Increased scrutiny of capital management. This needs an entire page to itself, but shareholders need to be viligiant regarding the strategic direction of a company allocating capital. Is it for growth, defensive measures, new markets, buybacks etc? We often look to management LTI’s as the best way of understanding what will drive the strategic direction of a company.5/ Succession risk. Another material impact on capital allocation decisions, we note a strong pick up in transitions of CEO’s and CFO’s (chart 27). We internally describe CEO’s as either owners or stewards of capital, as with each group there is different motivations and different behaviours. We prefer owners of capital.6/ Media plurality and control. Fake news? Facebook? Governments are more likely to spend more money on oversight of media outlets and the control of those organisations, with the expectation it extends to social media outlets as well.7/ Modern slavery. This is something to be mindful of as there is far more awareness of poor labour practices in developing worlds. How this impacts supply chains and the cost of manufacturing is worth following.8/ Climate change. As shown in chart 28, over the past 150 years, the temperature of the land surface is increasing. The environmental impact of this is becoming a meaningful part of corporations strategic thinking. 9/ Weather volatility. 2017 was an historic year in terms of hurricanes (and associated insurance losses), while extreme weather conditions in the early part of 2018 suggests planning for extreme outcomes is vital to many businesses.10/ Water scarcity. the depletion of aquifers, particularly in areas that have poor irrigation systems will continue to be an issue for human rights and companies who are trying to “feed the world”.
Source: Goldman Sachs, Euromonitor
Chart 26
Source: Macquarie
Chart 27
Source: Goldman Sachs
Chart 28 Change in surface temperature relative
ASX Management changes
Total value lost to fraud 2017 (bns)
to 1951-1980 average
40
6572
5651
57
96
116
129
0
20
40
60
80
100
120
140
2015 2016 2017
CEO only CFO only All changes
Chester High Conviction FundMarket Commentary
The biggest social issue that we face - Income inequality
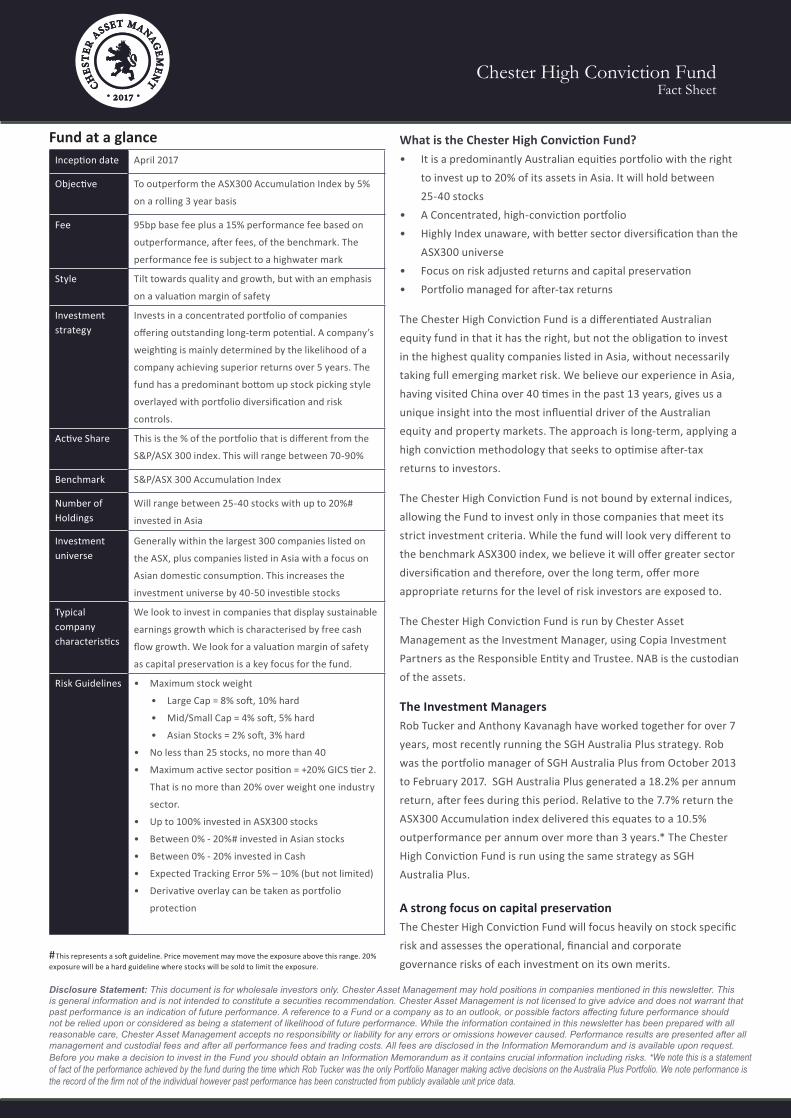
The reason most economists and policy makers focus so heavily on wage growth is illustrated here. The divide between the top 1% and the rest (even the top 8.6% that have net asset above USD100K) has only grown wider with extremely monetary policy choices over the past 8 years. Central banks have assisted growing the asset base for those with assets (the top 10%), while those without any savings have seen both their purchasing power diminish (stagnant wages while the cost of living health, education etc rises). We have written about this previously, but for the average blue collar worker in the US, real wages (adjusted for inflation) are lower in 2017 than they were in 1970. Representing almost 50 years of stagnant wages. This is something we think about a lot.The Federal Reserve published a study during 2017 that was quoted often, that 40% of the US population would struggle to raise $400 in an emergency for medical expenses. In a population of 327m people, that’s 130m people that are living on the edge of poverty. This is not healthy for society as a whole. If you are reading this, then we suspect you are not in the bottom 60%, and most likely in the top 10%.Bridgewater (Ray Dalio) published a note looking at the mechanics of this in October, breaking down the statistics of bottom 60% of income earners in the US vs the top 40% of income earners.One of the biggest issues with this cohort (bottom 60%) is the retirement savings are not even close to adequate, with only a third of them actually having retirement savings accounts, all of which average less than USD20,000. They also found that for people in the bottom 60% premature death rates are rising and physical health is deteriorating, both of which place more strain on healthcare spending. The reasons for premature death are a doubling of deaths by drugs/poisoning and an increase in suicide. To help perpetuate the problem, the top 40% spend four times more on education than the bottom 60%, which is only widening the gap between the haves and have nots. It is also reducing the trust this cohort places in institutions such as government, financial institutions and the media. This was an important note for the fact that if we look at “averages” then it appears the economy is doing well (both US and global), but it is important to understand the different segments of the economy, and how to address some of these imbalances. Chart 32 highlights the decline in the notion of adults living a better life than their parents. We read a very insightful piece over summer from the Huffington Post on this issue. The website address is copied in here for those that are interested. http://highline.huffingtonpost.com/articles/en/poor-millennials/
Chart 29
Source: Credit Suisse Global Wealth report
Source: Deutsche Bank
The Net Asset Pyramid
Chart 30 The Top 0.1% equals assets held by the bottom 90%
Chart 31
Source: Bridgewater Associates
Retirement savings by family income % of 30 year olds who earn more than their parentsChart 32
Source: Bridgewater Associates
Chester High Conviction FundMarket Commentary
Macro Summary
Australian Economy
We are of the view that Australian property prices soften this year as completions of apartments peak and new supply is met with dwindling demand, particularly from offshore. This should dampen any consump-tion recovery as we are yet to see meaningful wage growth despite strong employment numbers. We are encouraged that business and consumer confidence has picked up with the broader global upswing, but with household debt where it is, it will continue to be a drag on consumption. Construction looks very robust as the pocket of strength.
Australian Equity Market
At 16x 1 year forward the PER is 7% above it’s long term average, which in the context of global markets, is certainly not expensive, and if we do see a continuation of current economic strength, we should expect meaningful upgrades to the materials sector, which can propel the ASX300 back towards its previous peak. From an index perspective, bank earnings are heavily weighted so a resolution from the banking royal commission should alleviate downside risk.
US Economy
The current economic strength in confidence (consumer and business) has fed through to hard data with manufacturing and retail sales improving over the past 3 months. This combined with the tax reform cer-tainly gives rise to a stronger 2018 than the market was anticipating 3-4 months ago, with the expectations now for 3-4 interest rate hikes to combine with the Federal Reserve shrinking their balance sheet. This is certainly a new environment for monetary policy, and one that we expect to bring renewed volatility to equity markets.
US Bond Market
Without being bond “gurus” (far from it) we are perplexed that the US yield curve is flattening (2 year is rising much fast than the 10 year). Our simplistic view of this is because the bond market is concerned that the tax reform (very stimulatory in the short term) is only being funded out of increased deficits (US borrowing more money) thus in the longer term (10 years) the debt burden is only getting bigger. So while we do see the cyclical momentum and it appears the bond market is starting to price in the 3-4 rate hikes this year, the flattening yield curve is forewarning of more challenging times ahead.
Australian Dollar
Another asset that appears to be in a paradox, as our expectation was for US interest rate hikes to close the interest rate differential to Australia, and therefore the marginal capital flow to be out of Australia into the US (sell AUD, buy USD). Given the strength in the AUD, we can only ascertain that the current strength in commodity prices is more influential in the short term, but this is being driven by fears of a ballooning US deficit to fund tax cuts, as much as it is because of global demand for commodities. This demand for commodities will still be driven by Chinese demand more than any OECD uplift.
China
China has been remarkable for the lack of volatility in the past 12 months, which we interpret to mean the command economy has actually taken command of its economy again, and is less “free market” than it was 2 years ago. It appears Xi Jinping’s consolidation of power is far reaching and while growth targets are being met and social financing reigned in, social order appears to be in tact. We do see reason for this sta-bility to continue into 2018, but our base case implies that property volumes and prices will be managed down, and with that broadly, less demand for raw materials. Hence our base case that bulk commodity prices (iron ore and coal) soften during 2018, and with that, the AUD as well. We continue to be optimistic around pockets of the Chinese economy associated with consumption.
Commodities
We continue to look to the long-term demand and supply trends for opportunities, and as such, are very specific in our thinking around exposure to commodities. The commodities where supply side constraints appear most attractive are Tin and Zinc, for different reasons. We remain on the positive side of the EV battery materials space, with demand outstripping supply, in our view, for Lithium, Graphite and Cobalt. We remain comfortable around the longer term thematic for soft commodities as well, while subject to the vagaries of weather, the desire for rising middle class incomes in Asia to demand better quality diets (more protein) is a trend that will be prolonged for years to come.
Oil Price
We had a high conviction view in July 2017 that US shale producers would be pulling back production fore-casts based on sub USD50/bbl oil. We also saw more of an alignment of interests amongst OPEC members to be disciplined around quotas and hence we have seen the strong rebound in oil to start 2018. While we still view the Aramco IPO in 2018 as strong motivation for the oil price to stay higher, the US shale produc-ers will more than likely restart drilling campaigns above USD70/bbl, hence see little reason to believe it moves materially higher than that.
Chester High Conviction FundFact Sheet
What is the Chester High Conviction Fund?• It is a predominantly Australian equities portfolio with the right
to invest up to 20% of its assets in Asia. It will hold between 25-40 stocks
• A Concentrated, high-conviction portfolio• Highly Index unaware, with better sector diversification than the
ASX300 universe• Focus on risk adjusted returns and capital preservation• Portfolio managed for after-tax returns
The Chester High Conviction Fund is a differentiated Australian equity fund in that it has the right, but not the obligation to invest in the highest quality companies listed in Asia, without necessarily taking full emerging market risk. We believe our experience in Asia, having visited China over 40 times in the past 13 years, gives us a unique insight into the most influential driver of the Australian equity and property markets. The approach is long-term, applying a high conviction methodology that seeks to optimise after-tax returns to investors.
The Chester High Conviction Fund is not bound by external indices, allowing the Fund to invest only in those companies that meet its strict investment criteria. While the fund will look very different to the benchmark ASX300 index, we believe it will offer greater sector diversification and therefore, over the long term, offer more appropriate returns for the level of risk investors are exposed to.
The Chester High Conviction Fund is run by Chester Asset Management as the Investment Manager, using Copia Investment Partners as the Responsible Entity and Trustee. NAB is the custodian of the assets.
The Investment ManagersRob Tucker and Anthony Kavanagh have worked together for over 7 years, most recently running the SGH Australia Plus strategy. Rob was the portfolio manager of SGH Australia Plus from October 2013 to February 2017. SGH Australia Plus generated a 18.2% per annum return, after fees during this period. Relative to the 7.7% return the ASX300 Accumulation index delivered this equates to a 10.5% outperformance per annum over more than 3 years.* The Chester High Conviction Fund is run using the same strategy as SGH Australia Plus.
A strong focus on capital preservation The Chester High Conviction Fund will focus heavily on stock specific risk and assesses the operational, financial and corporate governance risks of each investment on its own merits.
Fund at a glanceInception date April 2017
Objective To outperform the ASX300 Accumulation Index by 5%
on a rolling 3 year basis
Fee 95bp base fee plus a 15% performance fee based on
outperformance, after fees, of the benchmark. The
performance fee is subject to a highwater mark
Style Tilt towards quality and growth, but with an emphasis
on a valuation margin of safety
Investment strategy
Invests in a concentrated portfolio of companies
offering outstanding long-term potential. A company’s
weighting is mainly determined by the likelihood of a
company achieving superior returns over 5 years. The
fund has a predominant bottom up stock picking style
overlayed with portfolio diversification and risk
controls.
Active Share This is the % of the portfolio that is different from the
S&P/ASX 300 index. This will range between 70-90%
Benchmark S&P/ASX 300 Accumulation Index
Number of Holdings
Will range between 25-40 stocks with up to 20%#
invested in Asia
Investment universe
Generally within the largest 300 companies listed on
the ASX, plus companies listed in Asia with a focus on
Asian domestic consumption. This increases the
investment universe by 40-50 investible stocks
Typical company characteristics
We look to invest in companies that display sustainable
earnings growth which is characterised by free cash
flow growth. We look for a valuation margin of safety
as capital preservation is a key focus for the fund.
Risk Guidelines • Maximum stock weight
• Large Cap = 8% soft, 10% hard
• Mid/Small Cap = 4% soft, 5% hard
• Asian Stocks = 2% soft, 3% hard
• No less than 25 stocks, no more than 40
• Maximum active sector position = +20% GICS tier 2.
That is no more than 20% over weight one industry
sector.
• Up to 100% invested in ASX300 stocks
• Between 0% - 20%# invested in Asian stocks
• Between 0% - 20% invested in Cash
• Expected Tracking Error 5% – 10% (but not limited)
• Derivative overlay can be taken as portfolio
protection
#This represents a soft guideline. Price movement may move the exposure above this range. 20% exposure will be a hard guideline where stocks will be sold to limit the exposure.
Disclosure Statement: This document is for wholesale investors only. Chester Asset Management may hold positions in companies mentioned in this newsletter. This is general information and is not intended to constitute a securities recommendation. Chester Asset Management is not licensed to give advice and does not warrant that past performance is an indication of future performance. A reference to a Fund or a company as to an outlook, or possible factors affecting future performance should not be relied upon or considered as being a statement of likelihood of future performance. While the information contained in this newsletter has been prepared with all reasonable care, Chester Asset Management accepts no responsibility or liability for any errors or omissions however caused. Performance results are presented after all management and custodial fees and after all performance fees and trading costs. All fees are disclosed in the Information Memorandum and is available upon request. Before you make a decision to invest in the Fund you should obtain an Information Memorandum as it contains crucial information including risks. *We note this is a statement of fact of the performance achieved by the fund during the time which Rob Tucker was the only Portfolio Manager making active decisions on the Australia Plus Portfolio. We note performance is the record of the firm not of the individual however past performance has been constructed from publicly available unit price data.
Chester High Conviction FundFact Sheet
About the Fund Managers
Why include the Asian stocks?1. We want access to the best quality companies in Asia, at the
right price. It is the choice, but not the obligation to invest in emerging companies with strong local franchises.
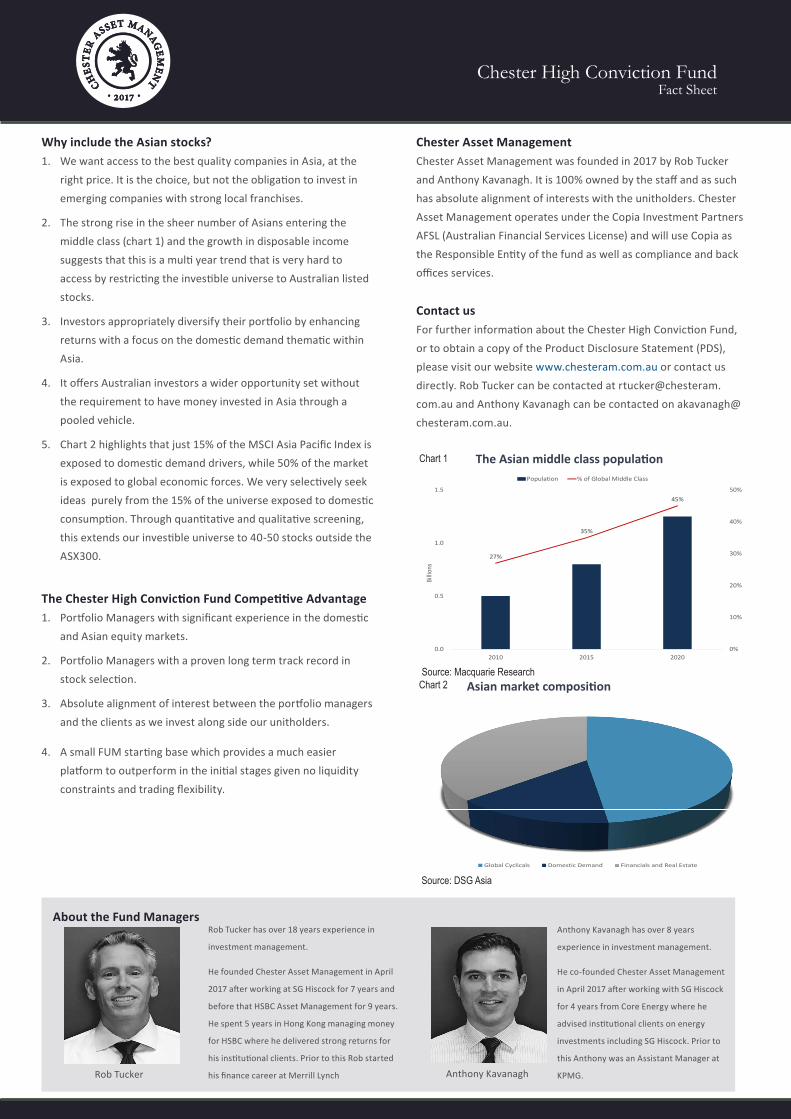
2. The strong rise in the sheer number of Asians entering the middle class (chart 1) and the growth in disposable income suggests that this is a multi year trend that is very hard to access by restricting the investible universe to Australian listed stocks.
3. Investors appropriately diversify their portfolio by enhancing returns with a focus on the domestic demand thematic within Asia.
4. It offers Australian investors a wider opportunity set without the requirement to have money invested in Asia through a pooled vehicle.
5. Chart 2 highlights that just 15% of the MSCI Asia Pacific Index is exposed to domestic demand drivers, while 50% of the market is exposed to global economic forces. We very selectively seek ideas purely from the 15% of the universe exposed to domestic consumption. Through quantitative and qualitative screening, this extends our investible universe to 40-50 stocks outside the ASX300.
The Chester High Conviction Fund Competitive Advantage1. Portfolio Managers with significant experience in the domestic
and Asian equity markets.
2. Portfolio Managers with a proven long term track record in stock selection.
3. Absolute alignment of interest between the portfolio managers and the clients as we invest along side our unitholders.
4. A small FUM starting base which provides a much easier platform to outperform in the initial stages given no liquidity constraints and trading flexibility.
Chester Asset ManagementChester Asset Management was founded in 2017 by Rob Tucker and Anthony Kavanagh. It is 100% owned by the staff and as such has absolute alignment of interests with the unitholders. Chester Asset Management operates under the Copia Investment Partners AFSL (Australian Financial Services License) and will use Copia as the Responsible Entity of the fund as well as compliance and back offices services.
Contact usFor further information about the Chester High Conviction Fund, or to obtain a copy of the Product Disclosure Statement (PDS), please visit our website www.chesteram.com.au or contact us directly. Rob Tucker can be contacted at [email protected] and Anthony Kavanagh can be contacted on [email protected].
Chart 1
Source: Macquarie ResearchChart 2
Source: DSG Asia
Rob Tucker has over 18 years experience in
investment management.
He founded Chester Asset Management in April
2017 after working at SG Hiscock for 7 years and
before that HSBC Asset Management for 9 years.
He spent 5 years in Hong Kong managing money
for HSBC where he delivered strong returns for
his institutional clients. Prior to this Rob started
his finance career at Merrill Lynch Rob Tucker Anthony Kavanagh
Anthony Kavanagh has over 8 years
experience in investment management.
He co-founded Chester Asset Management
in April 2017 after working with SG Hiscock
for 4 years from Core Energy where he
advised institutional clients on energy
investments including SG Hiscock. Prior to
this Anthony was an Assistant Manager at
KPMG.
27%
35%
45%
0%
10%
20%
30%
40%
50%
0.0
0.5
1.0
1.5
2010 2015 2020
Billi
ons
Population % of Global Middle Class
The Asian middle class population
Global Cyclicals Domestic Demand Financials and Real Estate
Asian market composition