Embed Size (px)
Citation preview

Child Care: Social Infrastructure for Economic Development
Mildred E. Warner, Ph.D., Cornell University
Community Supports for Working Parents Community Development Institute
Ithaca, NYJuly 14, 2015
[email protected]://www.mildredwarner.org
Funding provided by the USDA National
Institute for Food and
Agriculture

2
The Economic Importance of Early Care and Education
Children - Human development
Parents – Labor mobilization, career ladders
Regions– Critical social infrastructure for economic development

Public Investment: Elders vs. Children
3

4
US Investment Not Competitive
Public Expenditure• Enrollment in publicly funded ECE
» Ages 1-2: U.S. 6%, Europe: 3-74%» Ages 3-5: U.S. 53%, Europe: 66-99%
• Expenditure: US < 0.5% of GDP on ECE, Europe 2-6% of GDP
Work Place Policy• Full time work: U.S. 40 hrs/week, Europe 35-39 hrs/week • Required vacation: U.S. 0 days, Europe 20-25 days/year.• Maternity leave: U.S. 0 weeks, Europe: 12 – 42 weeks
This undermines our global economic competitiveness
Sources: Kimmerman 2001, Gornick and Myers 2003

5
Why Do We Under-invest in Early Education and Care?
» Private Frame - Early care and education is the private responsibility of parents - Failures are moral, not structural.
» Welfare Frame focuses on poor children only – Head Start, subsidies.
» Education Frame – Public responsibility for education begins at age 5
» Economic Development Frame focuses on businesses and physical infrastructure• Child Care as Social Infrastructure. Stimulus.
Competitiveness

6
Employers Recognize the Challenge and Benefits
• Comprehensive child care and early education » Promotes labor mobilization of parents as workers» Improves their productivity
• 30% report child care breakdowns, on average 5-9 days missed/yr
» Reduces turnover• Turnover costs 75-150% of annual wage. Costs business billions
» Enhances choice and career ladders, especially for women.• Earnings differential is a Mommy Gap more than a gender gap - it
is largest between women who have children and those who don’t.
Sources: APA 2004, Carillo 2004, Shellenback 2004, Gornick and Meyers 2003

7
Child Care Has Become an Economic Development Priority
• More than 90 state and local teams have conducted economic impact reports» See child care as an economic sector» Recognize size (employees, establishments,
children)» Think about child care markets (supply,
demand, price)» Regional impact (multipliers, parents served)
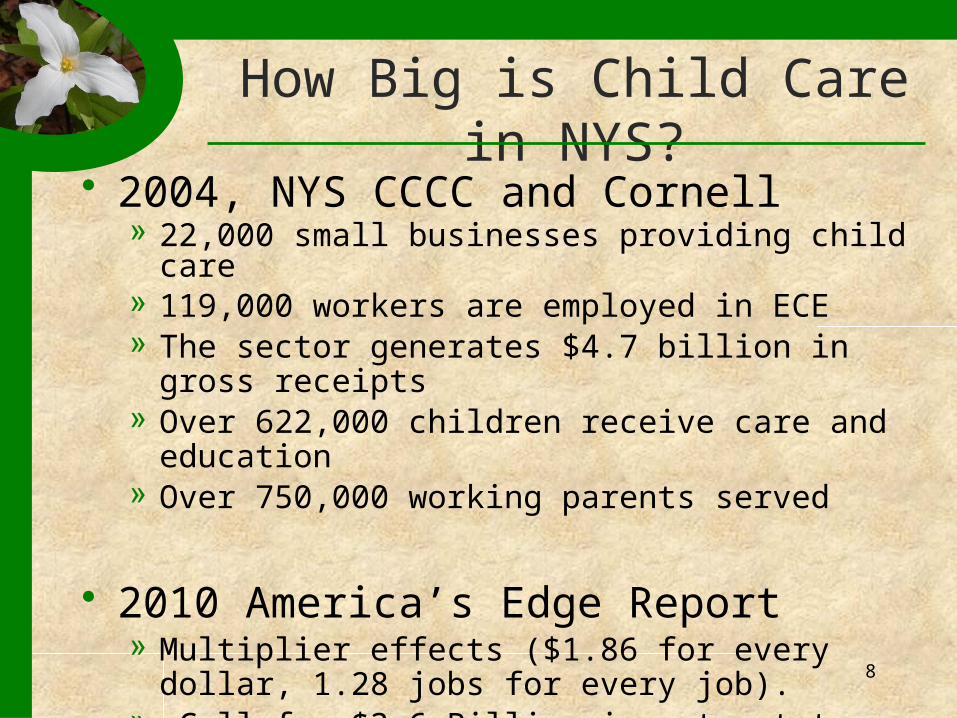
How Big is Child Care in NYS?• 2004, NYS CCCC and Cornell
» 22,000 small businesses providing child care» 119,000 workers are employed in ECE» The sector generates $4.7 billion in gross receipts» Over 622,000 children receive care and education» Over 750,000 working parents served
• 2010 America’s Edge Report» Multiplier effects ($1.86 for every dollar, 1.28 jobs for
every job).» Call for $3.6 Billion investment to serve 480,000 more
children and generate 80,000 jobs8

Comparing ECE to Other Sectors in NY
• Employment similar to hotels and lodging, private elementary and secondary schools, larger than dairy sector
• Multipliers similar to other public infrastructure sectors: transit, education, universities, hospitals
• 80% of economic developers see lack of affordable quality child care as a barrier to economic development (NYS survey 2006).9

What’s wrong with the child care market?
• Parents lack effective demand – need subsidies
• Low profitability yields insufficient supply of affordable, quality care
• Hard to differentiate quality for providers and parents
• Fragile businesses – few economies of scale• Recession reduced formal supply
10

What can be done?
Communities – Economic development and planning tools: business assistance – shared services, employer/community partnerships, coordinated planning, public entrepreneurship
Employers – Flexible Spending Accounts, On site Child Care, Parental Leave, Flexible Work Arrangements, Direct Taxation
State and National Government – Subsidies, Tax Credits, Quality Rating Systems with Tiered Reimbursement, Preschool, Workplace Policy11

12
The ECE Sector in New York:Prices, Wages and Subsidies
• Average price of care $9,500 – $13,600/yr » Costs are too high for parents, but too low for quality» Median Family Income
• Married with children - $87,000 16% income for center infant care • Single with children - $26,000 53% income for center infant care
» This forces parents out of the formal child care market.
• Average wage in child care $24,000» Wages are too low to promote professionalization of the sector
• Subsidies – patchwork across counties in the state.» Income eligibility - Some counties (Oneida) as low as 100% of poverty» Parent Co-Pay - Some counties as high as 35% of costs (Schenectady)
NACCRA, 2011 data.

13
Economic Development Strategies
• Providers: • Need collective management strategies to create economies
of scale (in purchasing, fee collection, staffing)• Need Facility and Operating Finance
• Workers: » Need career ladders and improved employment conditions
• Parents:» Need subsidies and better information on quality (QRIS)
• Communities:» Include ECE in land use, transportation and economic
development planning» Include in new industrial and housing development

SubsidiesDemand Side Focus
US restricts subsidies to the poor, reimburses at lower rates, and gets a more limited market response than Australia or the Netherlands
Recommendation - Don’t limit to the poor- Use tiered reimbursement to promote quality- Involve employers in advertising and
supporting the program14

100 200 300 400 500 600 700 800 900 1000 11000.00%
20.00%
40.00%
60.00%
80.00%
100.00%
NEUS AU
Child Care Subsidies: US, AUSTRAILIA,. NETHERLANDS
AU US NE
Income as % of poverty
Ch
ild
ca
re c
os
ts p
aid
by
go
ve
rnm
en
t
Warner and Gradus,
2011

Involve Employers
• Netherlands has employers pay (0.34% of payroll) as a tax to support their share of the subsidy program
• Employers can be advocates for increased public support for subsidies
• Human Resource Managers can advertize program benefits to eligible workers
16

EMPLOYERSFlexible Spending Accounts
• Most commonly offered employer support – easy to administer, inexpensive for employers
• Low take up among parents due to restrictive program design (once a year sign up, reimbursement basis, use it or lose it, limited to $5000)
• Recommendation – Raise limit to cover cost of care, Allow more flexible enrollment17
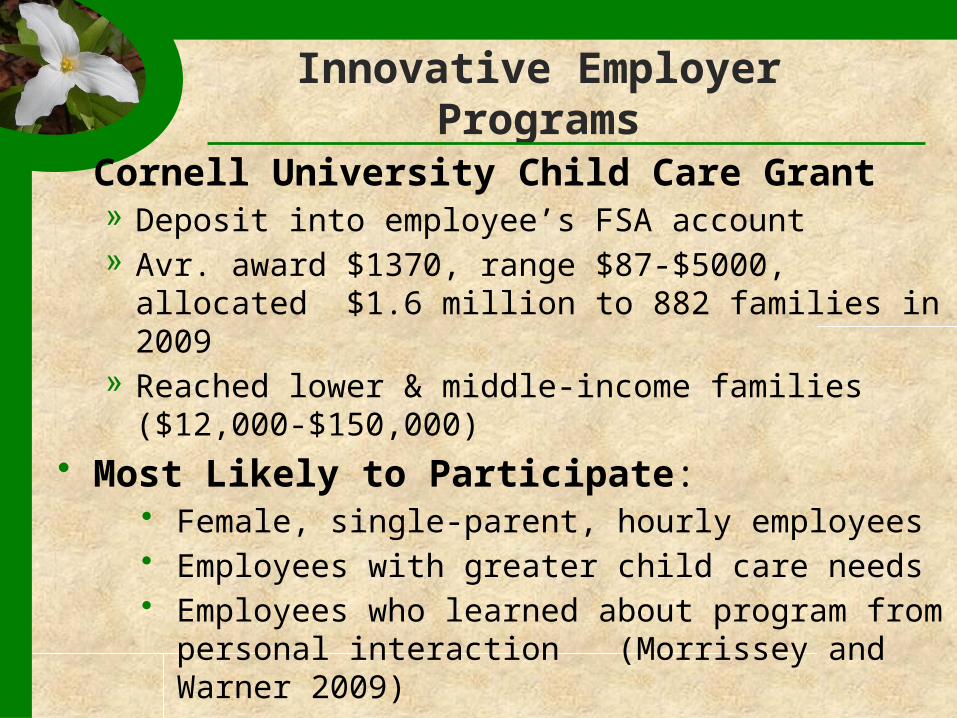
Innovative Employer Programs
• Cornell University Child Care Grant » Deposit into employee’s FSA account» Avr. award $1370, range $87-$5000, allocated $1.6 million to
882 families in 2009» Reached lower & middle-income families ($12,000-$150,000)
• Most Likely to Participate: • Female, single-parent, hourly employees• Employees with greater child care needs• Employees who learned about program from personal
interaction (Morrissey and Warner 2009)
• Least Likely to Participate – • Those with infants - Due to federal design restrictions

Other PoliciesTax Credits
Increase the level, make refundable, link to quality.
Preschool
Fund all children – not just those in NYC!
Integrate with child care. Use preschool as a stable supply side subsidy to improve quality of child care
Worker Subsidies
Expand worker tax and education credits to promote quality
Providers
Subsidies to improve quality. Reduce barriers to joining the licensed system (NYS has 15,000 licensed providers but an additional 35,000 providers report to IRS) 19

20
A Comprehensive Solution• Institutional Support for ECE Programs to ensure
quality.• Financial Aid for Families to ensure access to quality
ECE.• Work Place Policies (e.g. paid parental leave, flexible
work schedules with full benefits) to ensure parents can pursue careers and have time to nurture their children.
• Publicly Funded Infrastructure to ensure ECE professional development, program monitoring, consumer education, data collection and employer education.
Source: Stoney, Mitchell and Warner 2006. “Smarter Reform: Moving Beyond
Single Program Solutions to an Early Care and Education System”