Embed Size (px)
Citation preview

Child Nutrition and Poverty in Bangladesh
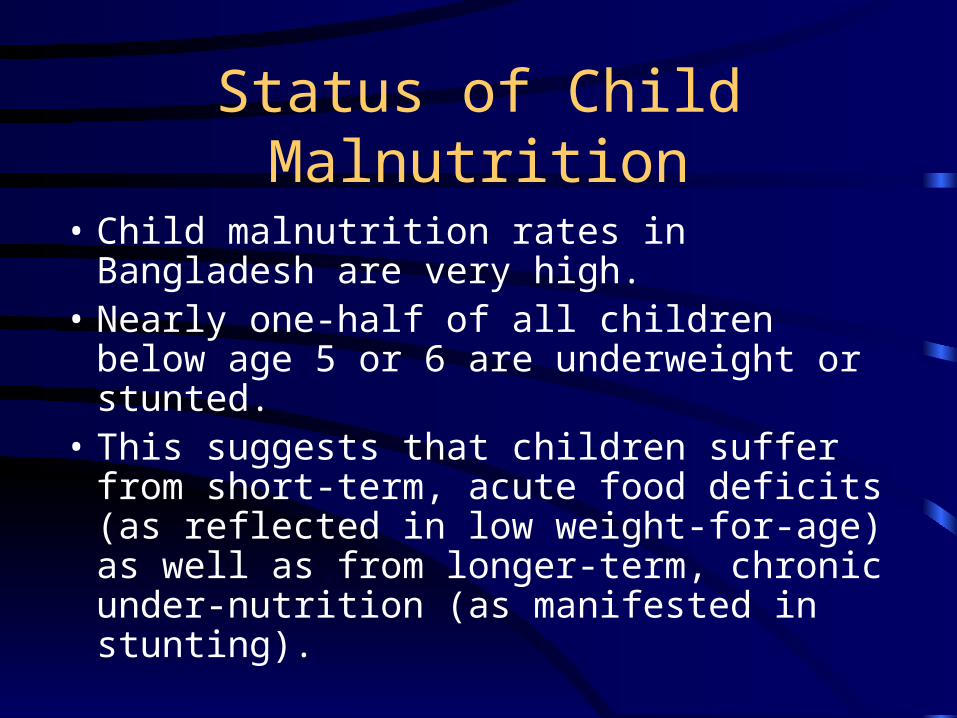
Status of Child Malnutrition
• Child malnutrition rates in Bangladesh are very high.
• Nearly one-half of all children below age 5 or 6 are underweight or stunted.
• This suggests that children suffer from short-term, acute food deficits (as reflected in low weight-for-age) as well as from longer-term, chronic under-nutrition (as manifested in stunting).

Figure 1: Child malnutrition rates, 1999-2000(% of children in relevant age group)
49 51
12
19
13
1
4548
10
1813
10
10
20
30
40
50
60
Heightfor age
Weightfor age
Weightfor
height
Heightfor age
Weightfor age
Weightfor
height
Heightfor age
Weightfor age
Weightfor
height
Heightfor age
Weightfor age
Weightfor
height
Moderate or severe Severe Moderate or severe Severe
BBS Child Nutrition Survey 2000 (ages 6-71 months) Demographic and Health Survey 1999-2000 (ages 0-59months)
International Comparisons
• Child nutrition is high in Bangladesh even in relation to its low per capita income.
• Following chart suggests that the %age of underweight children in Bangladesh is about 16 percentage points higher than would be expected at its level of per capita GDP.

Figure 2: Relationship between % of underweight children aged 0-5 years and per capita GDP across 16 Asian countries, 1995-2000
0
10
20
30
40
50
60
1,000 2,000 3,000 4,000 5,000 6,000 7,000 8,000
GDP per capita, 1999 (PPP$)
Bangladesh

South Asia Comparisons
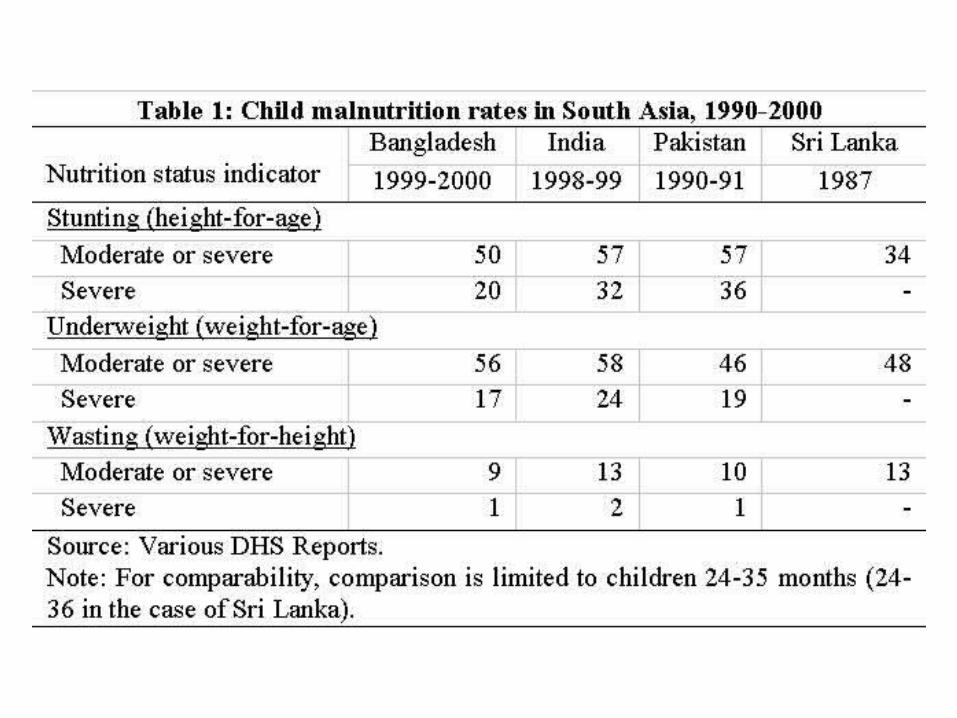
• However, Bangladesh’s child malnutrition rates do not appear to be overly large in comparison to those of other South Asian countries.
• Indeed, underweight rates among children aged 24-35 months are lower in Bangladesh than in India, while stunting and wasting rates are lower in Bangladesh than in Pakistan and India.
• Child malnutrition is thus more of a “South Asian problem” than a uniquely Bangladeshi problem.

Changes over Time
• Bangladesh has made impressive gains in reducing its child malnutrition rates during the last 15 years.
• The decline in malnutrition has been especially steep since the early 1990s.
• Both rural and urban areas experienced equivalent rates of decline.
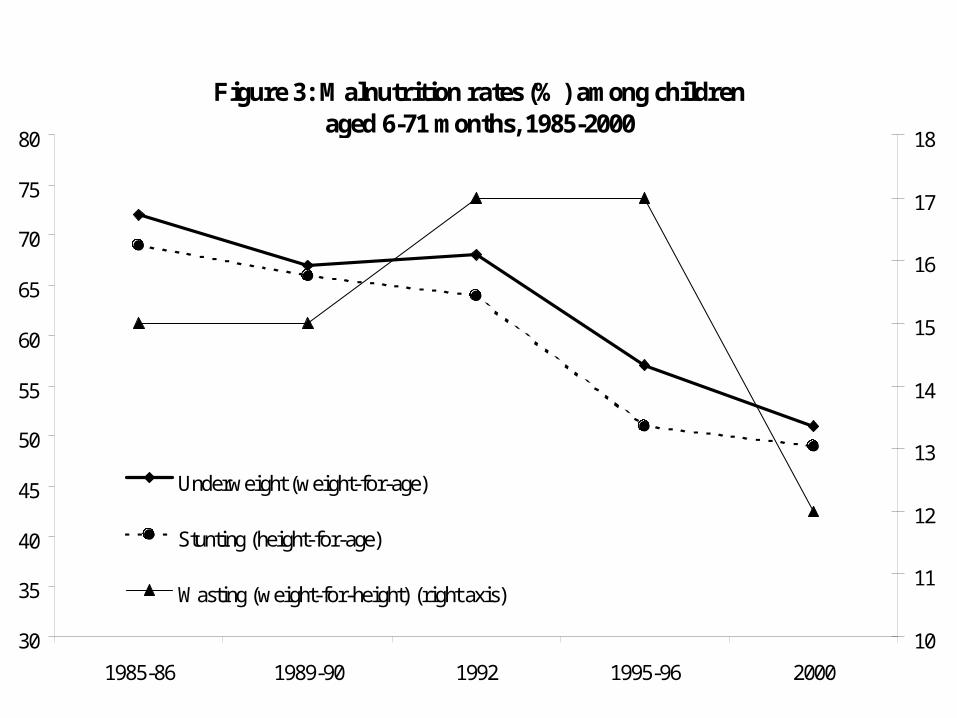
Figure 3: Malnutrition rates (%) among childrenaged 6-71 months, 1985-2000
30
35
40
45
50
55
60
65
70
75
80
1985-86 1989-90 1992 1995-96 2000
10
11
12
13
14
15
16
17
18
Underweight (weight-for-age)
Stunting (height-for-age)
Wasting (weight-for-height) (right axis)

Malnutrition & Gender• Gender differences in malnutrition are most
pronounced at young ages. Girls aged 6-11 months are significantly more likely than similarly-aged boys to be both underweight and stunted (Table 4).
• Beyond age 1, there is virtually no gender difference in malnutrition.
• Lack of gender disparity at older ages may have to do with selection bias owing to differential survival rates of boys and girls.

Gender, Birth Order & Malnutrition
• The gender gap in severe malnutrition declines with birth order.
• First-born females are 75 percent more likely to be severely malnourished relative to first-born males, reflecting the strong cultural preference in Bangladesh for having a first-born son.
Malnutrition and Living Standards
• Child malnutrition strongly related to living standards. The poor have the highest rates of child malnutrition.
• At the same time, the fact that about a third of the top consumption quintile – a group that is likely to have good access to food – is malnourished suggests that cultural and social factors have an important role to play in determining child malnutrition in Bangladesh.
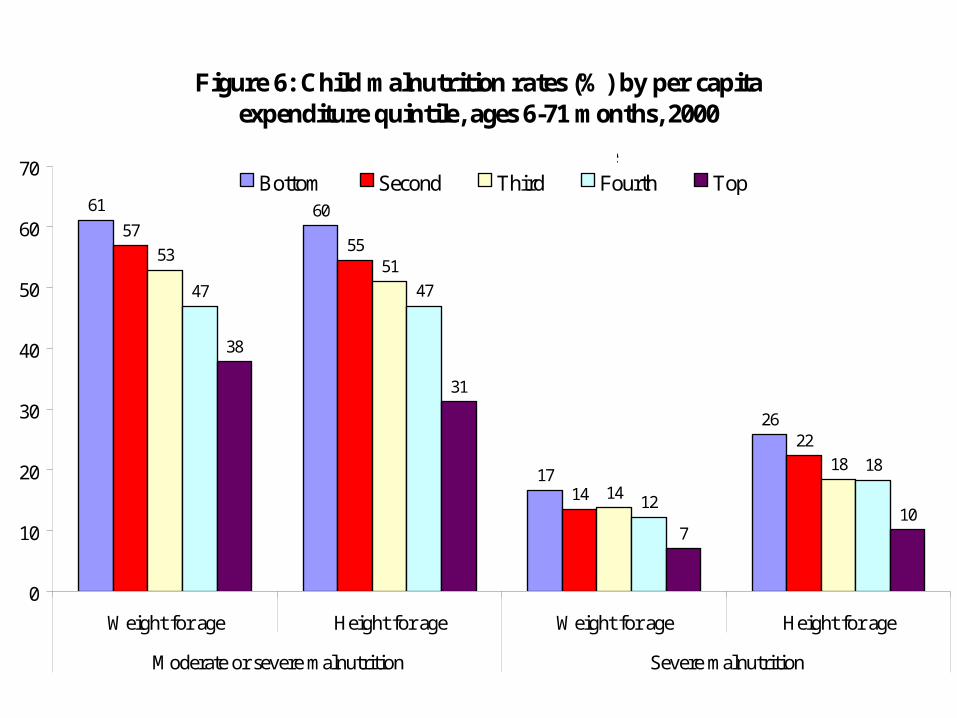
Figure 6: Child malnutrition rates (%) by per capita expenditure quintile, ages 6-71 months, 2000
61 60
17
26
5755
14
22
5351
14
18
47 47
12
18
38
31
710
0
10
20
30
40
50
60
70
Weight for age Height for age Weight for age Height for age
Moderate or severe malnutrition Severe malnutrition
Bottom Second Third Fourth TopPer capita expenditure quintile
Feeding Practices
• Two feeding practices that greatly increase the risk of malnutrition in an infant are:
– Provision of foods other than colostrum or breast milk as a first food to a new-born infant, and
– Early termination of exclusive breast-feeding and introduction of supplementary feeding.
• The poor are more likely than the better-off to engage in these high-risk feeding practices.
Infections, Illness & Malnutrition
• Another important proximate cause of malnutri-tion is illness and infection.
• Infections reduce the ability of the body to absorb critical nutrients from food.
• Data show that children who experienced a diarr-heal episode are significantly more likely to experience malnutrition and severe malnutrition than children who did not suffer from diarrhea.
• Of course, the causality also goes the other way– malnutrition increases the risk of infection.

Other Correlates of Malnutrition• Other observed correlates of child
malnutrition are:– Household size– Demographic dependency burden– Mother’s age and schooling– Availability of safe drinking water and toilet
facilities– Proximity to thana health center or private
health clinic (but only for the poorest quintile)

Other Correlates (Cont’d)
• Village electrification is associated with lower rates of malnutrition.
• Natural disasters, especially floods and cyclones, are observed to have lasting effects on malnutrition.
• The price of coarse rice is also associated with higher rates of child malnutrition.

Public Transfer Programs & Child Malnutrition
• While public food transfer programs, such as Food-for-Work, VGF and VGD, have hardly any effect on reducing overall levels of child malnutrition, they have fairly large effects on reducing malnutrition rates among the poorest quintile of children.
• This suggests that these programs are well-targeted to the poor.

Rates of severe stunting, by availability or non-availability of public intervention in village of residence, 2000
21
31
19
31
19
29
20
31
19
23
1922
20
23
20
25
0
5
10
15
20
25
30
35
Entiresample
Poorestquintile
Entiresample
Poorestquintile
Entiresample
Poorestquintile
Entiresample
Poorestquintile
Food-for-Work Program Vulnerable Group FeedingProgram
Vulnerable GroupDevelopment Program
Grameen Bank or BRAC
Not available Available

Regional Concentration of Malnutrition
• Malnutrition is geographically concentrated in Bangladesh.
• The rural districts of Sylhet, Comilla, Faridpur, Tangail, Jamalpur, Noakhali and Chittagong account for nearly one-half of all severely stunted children in the country.
• The heavy concentration implies that geographical targeting of nutritional interventions can be highly effective in achieving the largest absolute re-duction in child malnutrition in the country.

Figure 14: Cumulative contribution (%) of different areas to the total number of severely stunted children in Bangladesh, 2000
18
34
46
56
10099989795928882
7566
10
20
30
40
50
60
70
80
90
100
R. S
ylhe
t, C
omill
a
R. F
arid
pur,
Tan
gail,
Jam
alpu
r
R. N
oakh
ali,
Chi
ttago
ng
R. B
ogra
, Ran
gpur
, Din
ajpu
r
R. B
aris
hal,
Pat
huak
ali
R. D
haka
R. R
ajsh
ahi,
Pab
na
R. K
huln
a, J
esso
re, K
usht
ia
SM
A D
haka
U. R
ajsh
ahi
SM
A C
hitta
gong
OU
Chi
ttago
ng
U. K
huln
a
OU
Dha
ka
Note: R=Rural, OU=Other Urban, SMA=Standard Metropolitan Area

Economic Growth and Malnutrition
• To achieve the MDG target, Bangladesh would need to reduce child underweight rates from their level of 52 percent in 2000 to about 33 percent by 2015.
• Given the relationship between underweight rates and income, per capita income would need to increase by 214 percent between 2000 and 2015 – or at an annual rate of 7.9 percent.

Growth and Malnutrition (cont’d)
• Given that the Bangladeshi economy has grown at an average rate of 1.8% per annum in the 1980s and 3.1% in the 1990s, a 7.9% growth rate is highly unlikely.
• This in turn means that other direct interventions will also be necessary in attaining the MDG of halving child malnutrition by 2015.

Pro-Poor Growth and Malnutrition
• At the same time, the results show much stronger effects of income on malnutrition among the poorest quintile than among the population as a whole.
• A 1,000-taka increase in per capita consumption expenditure is associated with a reduction of 0.9 percentage points in child underweight rates in the entire population but a reduction of 5 percentage points in underweight rates among the bottom consumption quintile.
Pro-Poor Growth (cont’d)
• This suggests that pro-poor economic growth will bring down malnutrition rates more rapidly than ‘neutral’ growth.
• Pro-poor growth will also reduce gender disparity in malnutrition, since gender disparity in severe malnutrition narrows with economic status.
Conclusions
• Importance of pro-poor growth to reduction in malnutrition
• Public transfer and relief programs that provide food to the poor in child need to be retained/expanded within a malnutrition reduction strategy.
• Geographical targeting of malnutrition interventions

• The finding that malnutrition rates are high even among the better-off suggest that there is a need for integrating nutrition education to mothers and care-givers within a malnutrition reduction strategy.
• Strong and lasting effects of natural disasters on child malnutrition. Thus, efforts to reduce the vulnerability of poor households to weather- and environment-induced shocks must also be part of a comprehensive malnutrition-reduction strategy.