Embed Size (px)
Citation preview

Childcare survey 2017Claire Harding, Beth Wheaton and Adam Butler

Family and Childcare TrustChildcare survey 2017 02
Acknowledgments
We would like to thank all the Family and Information Services who provided data for our survey for this and our previous reports and to the National Association of Family Information Service (NAFIS) for their ongoing support. We are also grateful to colleagues at the Family and Childcare Trust who supported the research: Ellen Broomé, Gordon Cameron, Justin Irwin, Megan Jarvie and Nhung Vu.
About the Family and Childcare TrustThe Family and Childcare Trust aims to make the UK a better place for families. We are a leading national family charity in the field of policy, research and advocacy on childcare and family issues, with over 40 years’ experience. Our on-the-ground work with parents and providers informs our research and campaigns. We focus on the early years and childcare because they are crucial to boosting children’s outcomes throughout life and supporting parents to work.
About this reportThis report is the sixteenth annual Childcare Survey. We also publish an annual survey on the cost and availability of holiday childcare. Previous reports are available from our website: www.familyandchildcaretrust.org.
This report is based on a survey of local authorities’ Family Information Services in England, Scotland and Wales. Local authorities are required to manage the childcare market in their local area, and this involves having an understanding of local costs and sufficiency. We received responses from 95 per cent of local authorities.
Registered charity number: 1077444 Registered company number: 3753345

Family and Childcare TrustChildcare survey 2017 03
Executive summary
For millions of parents in Britain, childcare accounts for a significant proportion of family expenditure. Parents make decisions about whether, where and for how many hours they work based on the cost and availability of childcare in their local area. Access to high quality childcare is also vital for children’s educational outcomes, particularly for the most disadvantaged groups.
2017 will see the introduction of tax-free childcare for some families across the UK, and the roll-out of an increased entitlement to 30 hours per week of free childcare for working parents of 3 and 4 year olds in England – with similar policies planned in future for Scotland and Wales. While these changes will be welcomed by a lot of parents, childcare costs continue to make it difficult for many families to work. There are also questions about the operation of the 30 hour entitlement, with many local authorities having significant concerns about availability and market stability.
Cost of childcare ► On average, the price of 25 hours of childcare per week for a child under 2 is £116 for
a nursery place, or £110 for a childminder. There are significant regional variations, with London and the South East the most expensive areas.
► Nursery prices for this age group are almost unchanged on 2016 – up 0.1 per cent. Childminder prices have risen by 1.9 per cent over the same period.
► Prices tend to be marginally lower for 2 year olds at £112 for a 25 hour nursery place per week.
► It is difficult to produce a reliable estimate of prices paid by parents of three and four year olds because the universal free early education entitlement is operated differently by different providers and measured by different local authorities.
► Parents of primary-school age children will pay an average of £53 a week for an after school club, or £67 for pick-up and afternoon care by a childminder.
Table 1: headline childcare costs in England, Scotland and Wales
25 hours of care in a nursery25 hours of care from a childminder
Care after-school for a child aged 5-11
For under 2s For 2 year olds For under 2s For 2+ year olds Child-minderAfter-school club
Scotland £111.37 £106.16 £105.25 £104.53 £62.22 £55.71Wales £101.42 £102.30 £101.03 £101.03 £55.43 £43.13England £117.43 £113.43 £110.68 £110.11 £68.12 £52.80Britain £116.25 £112.38 £109.84 £109.29 £67.11 £52.58
Family and Childcare TrustChildcare survey 2017 04
Sufficiency of childcare ► The majority of local authorities in England report that there is not enough care available
in their area for two year olds entitled to free childcare, for after-school care, for disabled children, or for children whose parents work non-typical hours such as shift workers.
► There are different legal duties around sufficiency in Scotland and Wales, but there are also sufficiency gaps in both nations.
Impact of the 30 hour entitlements in England ► From September 2017, some working parents in England will be entitled to 30 hours a week
free childcare for 3 and 4 year olds – double the current free entitlement.
► Only a third of local authorities believe that there will be enough childcare in their area for families who are eligible for the extended entitlement.
► 44 per cent are concerned that the funding of the free offer will lead to reduced financial sustainability of some settings.
Childcare, work and family finances ► All parents in the UK can receive help with childcare through the free early education
entitlements for some two year olds and all three and four year olds, and parents in employment can receive help through the benefits system and through tax-relief schemes. These systems can be complex for families to navigate and some elements vary between England, Scotland and Wales.
► Families working full-time paying average childcare costs can spend up to 45 per cent of their disposable income on childcare.
► In some circumstances, parents will not see any financial gain from moving into work once they have paid childcare costs, particularly if they have high childcare costs or a partner who is already working. Low and middle income parents of pre-school children claiming universal credit can be only £1.96 an hour better off once they have paid for childcare if they move into work at the minimum wage.
Areas for actionThe entrenched problems of the affordability, accessibility and sufficiency of childcare still persist. Urgent action is needed to make sure that every family is able to access the high quality childcare place that they need to boost children’s development and enable parents to work. This is particularly important for children who are more likely to fall behind in the early years, including children with special educational needs and disabilities and those who are living in poverty.
In order to address these problems in full, we need a childcare strategy that creates a simple and efficient system that encourages quality, promotes child development, supports working parents and delivers for employers and the economy.

Family and Childcare TrustChildcare survey 2017 05
An ambitious strategy will take time. In the shorter terms, there are actions that can be taken to improve provision. We call on Scottish, Welsh and UK governments to:
► Make the universal free early education place for three and four year olds a legal entitlement, bringing free early education in-line with a right to a school place.
► Commit to making sure that every parent will be better off working after childcare costs.
► Evaluate the roll out of new early years spending, including increases to early education entitlements and tax free childcare, measuring how effective they are at increasing parental employment and narrowing the achievement gap in the early years.
► Make sure that funding for early education is adequate to deliver high quality provision by gathering evidence on the costs of this across the UK and reviewing funding levels every year.
► Improve access to early education and childcare for children with special educational needs and disabilities (SEND) by introducing an admissions code for private providers and, in England, providing statutory guidance to local authorities on use of Inclusion Funds.
► Improve information for parents about local childcare provision, including up-to-date prices and availability

Family and Childcare TrustChildcare survey 2017 06
Section 1: Childcare costs
This section describes the typical prices paid by UK parents for childcare for young children and children at school, and discusses how they have changed in the last year.
1A. Costs for part-time care for under-threesOn average, parents working part-time and requiring 25 hours care a week will pay around £116 per week for a child under two in nursery, and £110 for a childminder. Costs in Scotland are marginally lower than in England, and slightly lower again in Wales. Within England, Inner and Outer London and the South East are the most expensive for both nurseries and childminders. It is notable that childminder prices are much closer to nursery prices in London, Yorkshire and Wales than they are in the rest of the UK.
Table 2: regional costs, weighted, for under 2s – nursery and childminder
Nursery for under 2s for 25 hours
Childminder for under 2s for 25 hours
Inner London £154.08 £156.67 Outer London £142.24 £137.38 South East £136.35 £119.86 South West £113.29 £103.92 East Midlands £108.74 £96.98 East of England £105.58 £116.45 North East £104.98 £96.93 Yorkshire and Humber £101.50 £100.02 North West £101.00 £86.98 West Midlands £100.95 £93.44 Scotland £111.37 £105.25 Wales £101.42 £101.03 England £117.43 £110.68 Britain £116.25 £109.84
When children turn two, nursery places tend to become marginally cheaper due to different requirements for staff to child ratios for this slightly older group. The pattern is a little different in Wales, with modest rises in average costs for two year olds. This is because there are some, slightly more expensive, nurseries which are only available from this age. Parents continuing to use the same provider would therefore be unlikely to see a rise.
Childminder costs barely change when children turn two, presumably because childminders have much less ability to make savings by taking children of different ages – and indeed, activity costs may be higher for older children.

Family and Childcare TrustChildcare survey 2017 07
Table 3: regional costs, weighted, for twos – nursery and childminder
Nursery for 2 year olds for 25 hours
Childminder for 2 year olds and over for 25 hours
Inner London £141.05 £151.68 Outer London £138.85 £136.14 South East £125.95 £124.11 South West £110.89 £104.73 East of England £109.71 £107.02 East Midlands £105.16 £96.82 North East £104.25 £97.51 West Midlands £100.46 £93.47 North West £98.02 £89.09 Yorkshire and Humber £95.35 £99.01 Scotland £106.16 £104.53 Wales £102.30 £101.03 England £113.43 £110.11 Britain £112.38 £109.29
These figures do not take into account the free offers of between 10 and 15 hours early education per week for 2 year olds in the UK, which are available to some children based on family need or area deprivation. These are different for England, Scotland and Wales and are described in more detail below.
1B. Cost changes for part time care for under-threes2017 has seen negligible year-on-year changes to the cost of a part-time nursery place in Britain overall, and a modest rise in childminder costs. Prices are flat in England for nurseries and slightly up for childminders. Scotland and Wales both see falls in one type of childcare and rises for another.
For an explanation of how year-on-year change was calculated for this report, please see the methodology section.
Table 4: regional cost changes for under-twos – from 2016
Change to cost of 25h/week nursery for a child under 2
Change to cost of 25h/week childminder for a child under 2
Scotland 4.5% -0.7%Wales -5.0% 3.2%England 0.0% 2.1%Britain 0.1% 1.9%
Underlying this data are price moves in both directions for different local authorities, some of significant magnitude. This appears to reflect considerable volatility in the childcare market as the sector responds to changing minimum wage and pension auto-enrolment legislation, along with upcoming policy changes related to the free entitlement.

Family and Childcare TrustChildcare survey 2017 08
It is likely that the pattern will continue to be complex as these policies come into effect in coming years, but it will be difficult to predict the likely direction of change. The section on local authorities’ expectations about the introduction of the 30 hour entitlement gives more detail on the expected impact of this policy in England. Family and Childcare Trust are concerned that this volatility will make it increasingly difficult for families to make plans based on the cost and availability of childcare in their local area, potentially making it even harder for parents of young children to return to or stay in work.
1C. Costs for full-time care for children under threeFull day childcare services – up to ten hours per day for five days per week – are generally used by single parents who work full-time, or by dual full-time worker couples. Parents using 50 hours care per week will generally pay slightly less than twice the amount for 25 hours care per week, but these costs are still very high.
Table 5: regional costs, weighted, for under-two and twos – nursery and childminder
Nurseries ChildmindersUnder 2s for 50 hours
2 year olds for 50 hours
Under 2s for 50 hours
2+ year olds for 50 hours
Inner London £290.73 £273.79 £290.18 £273.23 Outer London £264.96 £240.82 £261.49 £260.37 South East £257.85 £240.92 £234.00 £235.94 South West £236.50 £223.18 £200.29 £202.68 East of England £203.72 £181.81 £232.47 £213.73 East Midlands £203.20 £200.55 £188.75 £188.42 Yorkshire and Humber £202.73 £190.33 £199.97 £198.02 West Midlands £198.33 £196.85 £184.63 £185.94 North East £193.12 £191.43 £175.74 £176.93 North West £189.14 £183.27 £164.89 £170.81 Scotland £209.87 £199.16 £210.64 £209.24 Wales £188.80 £190.55 £193.84 £193.84 England £225.13 £212.43 £214.02 £212.02 Britain £222.36 £210.45 £212.86 £210.99
Family and Childcare TrustChildcare survey 2017 09
1D. Free entitlements and prices of care for three and four year oldsEngland, Scotland and Wales all have universal free entitlements to early education and childcare for three and four year olds. In England, this is currently 15 hours per week during school term times, due to rise to 30 hours per week for working parents later this year. Scotland offers 600 hours a year, which is equivalent to 12.5 hours per week over 48 weeks. Wales offer 10 hours a week for 38 hours a year, with more in some local authorities. These offers are explained in more detail below.
We asked local authorities to tell us how much parents would pay for childcare after these free offers were taken into account, but many were unable to give us simple answers which could be used to generate averages.
Some parents in England and almost all parents in Scotland and Wales who are using the free entitlement use a sessional nursery which only offers 15 hours (or national equivalent) care a week, so any hours outside this would need to be from a different provider, possibly a childminder using a pick-up and drop-off system.
In many cases, providers will simply charge for additional hours, so 25 hours would require ten hours of paid care in England once the free entitlement was used, but in some cases providers end up charging more for these ‘extra’ hours in order to recoup losses on funded places, and in some cases parents are required to pay more during the holidays outside entitlement hours.
We have therefore decided not to publish data for this group, as averages are not a sufficiently reliable guide to prices paid by parents. The upcoming expansion of free hours of care for three and four year olds in England, Scotland and Wales mean that year-on-year comparisons will continue to be complex in coming years. We will explore the best ways to deliver meaningful data in next year’s and subsequent surveys.
1E. Local variations in childcare prices for under-twosThere are considerable variations in prices for childcare both within and between local areas: the majority of providers are private businesses who are able to set their own prices to parents according to local market conditions, although they receive a fixed rate for funded hours paid for by the local authority. Statutory requirements around staff ratios and the minimum wage mean there is an effective ‘floor’ on prices, but there is no regulatory ‘ceiling’ – it is therefore unsurprising that the highest prices found in a local area are generally further from the average than the lowest prices.
We asked local authorities to tell us about the cheapest and most expensive prices they were aware of for under-twos in their local area. Providers are under no statutory obligation to share their prices with local authorities, and providers in the ‘luxury nursery’ sector may decide not to share prices. It is therefore likely that the maximum figures here represent lower-end estimates.

10Family and Childcare TrustChildcare survey 2017
Table 6: nursery prices for under 2s for 25 hours a week, regional max and min as % of average, weighted
Max MinEast of England 227% 69%South East 171% 71%Inner London 159% 61%East Midlands 145% 58%North West 144% 70%Outer London 142% 64%Yorkshire and Humber 140% 74%West Midlands 140% 72%South West 134% 71%North East 124% 72%Scotland 124% 75%Wales 126% 80%England 156% 68%Britain 152% 69%
The highest price variations are found in the East of England and the South East, with Inner London slightly below – this is likely to reflect the high average prices in London more than low ‘top end’ prices. The highest price in the South East of England was £350 per week, and the lowest price (in a different, but nearby, local authority) was £69. In London, the highest price recorded was £480 a week. Ranges are notably narrower, at both the top and bottom end of the market, in Scotland and Wales.
This high level of price variation highlights the complexity of the market, and therefore the need for parents to be able to access high quality information about the childcare that is available locally. Parents who are unable to find information of the range of local provision are more likely to be limited in their choices on price and services.
11Family and Childcare TrustChildcare survey 2017
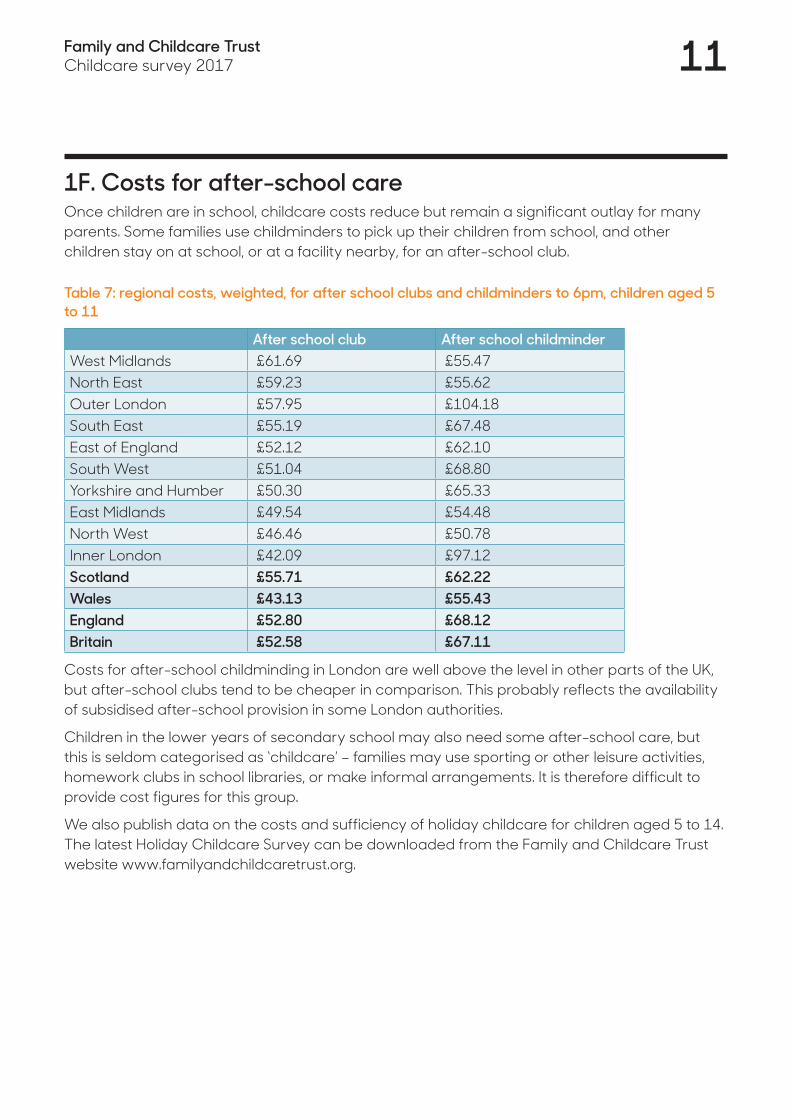
1F. Costs for after-school careOnce children are in school, childcare costs reduce but remain a significant outlay for many parents. Some families use childminders to pick up their children from school, and other children stay on at school, or at a facility nearby, for an after-school club.
Table 7: regional costs, weighted, for after school clubs and childminders to 6pm, children aged 5 to 11
After school club After school childminderWest Midlands £61.69 £55.47 North East £59.23 £55.62 Outer London £57.95 £104.18 South East £55.19 £67.48 East of England £52.12 £62.10 South West £51.04 £68.80 Yorkshire and Humber £50.30 £65.33 East Midlands £49.54 £54.48 North West £46.46 £50.78 Inner London £42.09 £97.12 Scotland £55.71 £62.22 Wales £43.13 £55.43 England £52.80 £68.12 Britain £52.58 £67.11
Costs for after-school childminding in London are well above the level in other parts of the UK, but after-school clubs tend to be cheaper in comparison. This probably reflects the availability of subsidised after-school provision in some London authorities.
Children in the lower years of secondary school may also need some after-school care, but this is seldom categorised as ‘childcare’ – families may use sporting or other leisure activities, homework clubs in school libraries, or make informal arrangements. It is therefore difficult to provide cost figures for this group.
We also publish data on the costs and sufficiency of holiday childcare for children aged 5 to 14. The latest Holiday Childcare Survey can be downloaded from the Family and Childcare Trust website www.familyandchildcaretrust.org.

12Family and Childcare TrustChildcare survey 2017
Section 2: Childcare sufficiency
Childcare sufficiency describes whether or not there is enough childcare to meet demand in a local area. This section examines national and regional childcare sufficiency for different groups, and assesses how this has changed since last year.
2A. Sufficiency duties for local authorities Local authorities are required to manage the market for childcare in their local area, which means they need to know whether enough childcare is available for key groups. The precise nature of these duties varies between the nations of Britain:
In England, statutory guidance requires that audits of childcare sufficiency should be carried out annually and make: “specific reference to how [local authorities] are ensuring that there is sufficient childcare available to meet the needs of: disabled children; children from families in receipt of Working Tax Credit or Universal Credit; children with parents who work irregular hours; children aged two, three and four taking up early education places; school age children; and children needing holiday care” (Department for Education, 2014).
In Scotland, local authorities have a statutory duty to consult with parents on the delivery of early education and childcare, and to publish a plan based on the results of their consultation.
Welsh local authorities are required to produce a sufficiency assessment and action plan in 2017 and every five years thereafter, and report to the Welsh government annually through a progress update.
Because these duties are slightly different in different parts of the UK, we have presented sufficiency data separately for the three nations. This data is based on local authorities’ assessments at the time of the survey, which may differ from their published Childcare Sufficiency Assessments if the local situation has changed since this was last published.
2B. Sufficiency in EnglandThe majority of English local authorities report having sufficient childcare for three and four year olds entitled to the universal free childcare offer, with slightly lower sufficiency for the two year old targeted entitlement. Very few authorities report limited sufficiency for under-twos, but a significant minority do not hold information for this age group. Only 18 per cent of authorities report having enough childcare for disabled children.
Only one in three authorities report full availability of afterschool childcare for 5 to 11 year olds, and this falls to 1 in 8 for 12 to 14 year olds. Almost half of local authorities do not hold data which allows them to tell whether they have enough childcare for this older group. There are also significant data gaps for disabled children and parents working atypical hours.

13Family and Childcare TrustChildcare survey 2017
Table 8: sufficiency in England – by local authorities
Yes: all Yes: Some No Data not collected/ Cannot tell
Under 2s 54% 31% 2% 14%2 year olds entitled to the free offer 47% 45% 3% 5%3 and 4 year olds entitled to the free offer 64% 29% 1% 6%After school for age 5-11 33% 42% 6% 20%After school for age 12-14 12% 32% 8% 48%Disabled children 18% 43% 10% 28%Parents in full time work 52% 34% 1% 12%Parents working atypical hours 13% 41% 13% 32%Rural families 26% 50% 2% 22%
Data on rural families for this and subsequent tables includes only local authorities which have rural areas.
Since 2016, there have been modest increases in the number of local authorities reporting sufficiency in most areas, and a larger increase in the proportion reporting sufficiency for the two year old offer and for primary-school age children.
Table 9: changes to sufficiency in England by local authority since 2016
2017 2016Under 2s 54% 49%2 year olds entitled to the free offer 47% 30%3 and 4 year olds entitled to the free offer 64% 56%After school for age 5-11 33% 9%After school for age 12-14 12% 7%Disabled children 18% 15%Parents in full time work 52% 46%Parents working atypical hours 13% 7%
There are also stark differences in sufficiency between English regions – three quarters of local authorities in the East of England have enough childcare for under-twos, compared to just one quarter in Outer London. Variation for parents who work atypical hours is particularly high – this is available in 36 per cent of authorities in the North East, but none in the East of England, Inner London, the South East or the West Midlands.

14Family and Childcare TrustChildcare survey 2017
Table 10: sufficient childcare ‘in all areas’ in England, by number of children, regional
Under 2s
2 year olds entitled to the free offer
3 and 4 year olds entitled to the free offer
After school for age 5-11
After school for age 12-14
Disabled children
Parents in full time work
Parents working atypical hours
East of England
55% 45% 45% 18% 9% 18% 45% 0%
East Midlands
78% 33% 67% 33% 11% 44% 56% 22%
North East 58% 58% 83% 58% 27% 27% 75% 36%North West 68% 70% 78% 61% 17% 30% 70% 22%Inner London
36% 36% 64% 40% 10% 9% 45% 0%
Outer London
26% 37% 53% 21% 5% 5% 44% 11%
South East 32% 32% 42% 11% 5% 5% 42% 0%South West 67% 60% 60% 40% 20% 27% 60% 13%West Midlands
62% 46% 69% 8% 0% 8% 23% 0%
Yorkshire & Humber
71% 43% 79% 29% 14% 14% 57% 21%
2C. Sufficiency in ScotlandDue to different requirements for data collection in Scotland, data coverage outside of the free offers is generally less good than in England or Wales. This does not apply to the free childcare offers: data coverage here is similar to the other nations. Sufficiency for the free offers is notably higher than in England and Wales, at nearly two thirds for two year olds and over four fifths for three and four year olds.
Table 11: sufficiency for Scotland, by local authority
Yes: all Yes: Some No Data not collected/ Cannot tell
Under 2s 21% 36% 4% 39%2 year olds entitled to the free offer 64% 29% 0% 7%
3 and 4 year olds entitled to the free offer 82% 11% 0% 7%
After school for age 5-11 18% 46% 4% 32%After school for age 12-14 4% 14% 18% 64%Disabled children 18% 36% 7% 39%Parents in full time work 25% 43% 4% 28%Parents working atypical hours 11% 19% 30% 40%Rural families 15% 30% 15% 39%

15Family and Childcare TrustChildcare survey 2017
We also asked local authorities in Scotland whether they had fulfilled their duty to consult on the delivery of early education and childcare, and if so whether a plan based on this consultation was available. 14% of respondents did not tell us when they had last consulted. Of those who gave a date, local authorities told us that they had last consulted an average of nine months prior to our survey in November 2016, meaning that the average date was February 2016. Only 20% had a plan available based on their most recent consultation.
Table 12: status of childcare plans in Scotland, by local authority
Yes 21%No 14%A plan is being prepared 57%Don’t know 7%
We have not presented comparative data on sufficiency for Scotland because the addition of the ‘data not collected’ option in this year’s survey – which enables Scottish authorities to more accurately reflect how they have carried out their statutory duties – was not included in last year’s survey. This means that comparisons would be subject to considerable uncertainty.
2D. Sufficiency in WalesAt the time of our survey, Welsh local authorities were working on their statutory Childcare Sufficiency Assessment for 2017, the first in a new five-yearly cycle mandated by the Welsh government. Some authorities were able to include the data they were using for this in our survey, but in other areas it was not yet ready. The ‘not collected/cannot tell’ rate may therefore be higher for Wales than it would be after this assessment is completed.
In general, sufficiency for the free offers is broadly similar to England, and somewhat lower than in Scotland. Sufficiency for disabled children, and for parents working atypical hours, is notably lower than in England.
Table 13: sufficiency in Wales, by local authority
Yes: all Yes: Some No Data not collected/ Cannot tell
Under 2s 29% 59% 0% 12%Children entitled to the Flying Start scheme 44% 39% 6% 11%3 and 4 year olds entitled to the free offer 50% 44% 0% 6%After school for age 5-11 12% 65% 12% 12%After school for age 12-14 0% 33% 33% 33%Disabled children 0% 38% 50% 13%Parents in full time work 17% 67% 0% 17%Parents working atypical hours 0% 39% 39% 22%Rural families 8% 53% 23% 16%

16Family and Childcare TrustChildcare survey 2017
Comparing sufficiency in Wales gives a mixed picture, with increases for three and four year olds and primary-school aged after school care, and reductions for under-twos and parents in full-time work.
Table 14: changes to sufficiency in Wales by local authority since 2016
2017 2016Under 2s 29% 41%2 year olds entitled to the free offer 44% 45%3 and 4 year olds entitled to the free offer 50% 41%After school for age 5-11 12% 9%After school for age 12-14 0% 5%Disabled children 0% 9%Parents in full time work 17% 41%Parents working atypical hours 0% 0%
As noted above, these results should be treated with some caution as Welsh authorities’ sufficiency assessments for 2017 were ongoing at the time of the survey.
2E. Implications of sufficiency gapsThese gaps in sufficiency affect some of the most vulnerable families in the country. It is often difficult for parents of disabled children to find suitable childcare, and when it is available prices can be high and availability very limited – this can make it challenging or even impossible for parents to work at all. While some parents who work atypical hours do so based on a positive choice, some people take on shift-work or zero-hours contracts do so because they have few other options. People in this situation are likely to be on low pay. With the number of people in non-standard employment likely to increase, Family and Childcare Trust is concerned about the persistent gaps in care available for this group.
There have been some improvements in sufficiency since 2016, but these increases appear to be due to expansions of private sector provision for families with fairly standard childcare needs: weekday daytimes for young children and after school for older children. It is unlikely that continuing private sector expansion will be able to support families with disabled children or those working atypical hours without market intervention.

17Family and Childcare TrustChildcare survey 2017
Section 3: The impact of the 30 hour entitlement in English local authoritiesThis section describes the results of a survey of local authorities in England about the impact they expect from the introduction of 30 hours a week of free childcare for children of working parents.
The introduction of 30 hours free childcare a week for working parents of three and four year olds in England represents one of the most significant recent changes to childcare. It is as yet unclear exactly how much new demand will be generated – it is likely that a lot of the funded places will be used by families who would otherwise have paid for this amount of childcare. Nonetheless, the policy will lead to significant changes to how – and how much – providers are paid, as 30 hour places will be funded directly by the local authority based on set funding formulae. Parents will continue to pay the provider directly for any hours above the entitlement.
We asked local authority Family Information Services about the expected impact of the 30 hour offer in their area. Their surveys were returned in late November and December 2016, about nine months before the policy was due to come into force. As these questions relate to expected outcomes rather than information held, we could not include them in our Freedom of Information requests. Response rates for these questions are therefore lower than for the main survey, representing about three quarters of English local authorities.
The ‘don’t know’ rate for these questions was fairly high, ranging from 25 per cent to 63 per cent. However, there was relatively little consistency in which questions got this response: only 13 per cent of local authorities returned ‘don’t know’ answers for all nine questions. This mixed pattern suggests that ‘don’t know’ responses are likely to reflect gaps in knowledge rather than a reluctance to speculate.
Chart 1: Availability of the 30 hour offer
13% 54%
25%5%
4%
33%
70%
56% 40%
Enough childcare available for 3-4 year olds using the 30h offer
Some settings not offering the 30h entitlement
More families on 30h offer able to work in ways that meet their needs
No Don’t knowYes

18Family and Childcare TrustChildcare survey 2017
There was a lack of certainty about the availability of the 30 hour offer for eligible families. Only a third of local authorities expect there to be enough childcare available for three and four year olds, with just over half not yet knowing whether or not there would be enough. A clear majority of local authorities expect some settings not to offer the 30 hour entitlement – presumably because it would not make financial sense for them to do so. Until the policy has been introduced in full, it is difficult to predict how many settings this will apply to: it is likely that the pattern will vary in different parts of the country based on the comparative price paid for funded and non-funded places, and settings’ ability to attract parents without offering the free entitlement. Despite this uncertainty, the majority of respondents believe that the 30 hour entitlement will enable more families to access childcare which meets their needs.
Chart 2: Availability of other childcare
32% 48%
85%28%
41% 48%
Reduced availability for families on the 15h offer
Less flexible hours available for parents on 15h offer
Not enough childcare for 3-4 year olds entitled to the 15h offer
41%
20%
17%
11%
7% 52%Not enough childcare for 2 year olds
entitled to the 15h offer
No Don’t knowYes
For families not entitled to the 30 hour offer because they do not meet the work requirement, but who remain entitled to the universal 15 hour offer, the local picture looks mixed – a fifth of local authorities are predicting reduced availability for this group, a sixth are predicting less flexibility on how the 15 hours are accessed, and about 1 in 10 expect there not to be enough places available for them overall. There are high levels of uncertainty around all of these questions. Local authorities are slightly more confident about the impact on funded two year old places, which are available to the 40 per cent most deprived families, with only a small minority predicting lower availability for this group.

19Family and Childcare TrustChildcare survey 2017
Chart 3: Prices of childcare
14%23% 63%
56%7%37%
Increased costs for 2 year olds and under
Increased costs for 3-4 year olds outside free hours
No Don’t knowYes
Funding for the thirty hour entitlement is intended to cover the full cost of delivering care. However, some providers have reported that they will lose revenue from providing fully funded places, and will attempt to recoup this by charging higher fees outside the free hours (providers’ views are described in more detail in the 2017 Family and Childcare Trust report No Shortcuts: quality and the free childcare extension). A significant group of local authorities expect prices outside the free entitlement to go up. About a quarter of local authorities expect prices to rise for two year olds and under – potentially a more significant concern for parents, as they will not be able to balance any increase against higher availability of free hours.
Chart 4: Changes within settings
66% 32%
39%4%
9%
2%
57%
44% 47%
Reductions in quality of early education
Improved collaboration between settings
Reduced financial sustainability of some settings
No Don’t knowYes

20Family and Childcare TrustChildcare survey 2017
Although a clear majority of local authorities do not expect the 30 hour offer to result in reductions in childcare quality, it is highly concerning that a third expect reductions in the quality of early education. Only high quality early education boosts children’s outcomes and helps to narrow the achievement gap between deprived children and their peers. Expectations of quality reduction could be driven by concerns about financing the provision. 44 per cent of authorities expect reduced financial viability of some settings and only 9 per cent are confident that this will not happen. If settings begin to shut down, there are clear risks to childcare sufficiency in 2017 and beyond. However, more positively, local authorities expect to see higher levels of collaboration between settings – it is hard to say at this stage what this is likely to mean in practice, but any changes which make it easier for parents to combine two types of care, for example a sessional nursery and a childminder, are likely to be welcomed by families.
These responses raise significant questions about the impact of the rollout of the 30 hour offer. They show high levels of uncertainty and varying expectations between local authorities, highlighting the need for the rollout to be closely monitored and evaluated, and action to be taken if there are negative consequences on quality, affordability and availability of childcare, particularly for the more vulnerable families.

21Family and Childcare TrustChildcare survey 2017
Section 4: Childcare costs, parental employment and family financesThis section describes the ways that the UK, Welsh and Scottish governments support families with the cost of childcare. It then discusses the impact of childcare on household budgets, particularly when a parent is returning to work after time off to have children.
4A. Financial support with childcare costsChildcare in the UK is largely demand-side funded: rather than government funding providers directly, parents pay for the majority of formal childcare, with support from government in the form of tax incentives and benefits. Some pre-school children are also entitled to free childcare. This means that calculating the impact of paying for childcare on family budgets is complicated: both for policy-makers and for families deciding whether it is financially worthwhile for a parent to return to work.
In all cases, support with childcare costs is only available where parents use registered childcare providers. This means they cannot be used for informal childcare, such as babysitters or help from grandparents.
In summary, the main types of financial support available to parents across the UK are:
► Tax relief schemes:
– Tax-free childcare and childcare vouchers are broadly similar schemes – the key difference is that tax-free childcare is available to all parents including the self-employed through HMRC, whereas voucher schemes are managed by employers, meaning they are available to fewer people. Voucher schemes are being phased out as tax-free childcare is launched, but parents already using the schemes will be able to choose whether to continue with them or use tax-free childcare. They will not be able to use both.
– Tax-free childcare covers 20 per cent of childcare costs up to a maximum of £2,000 per child per year, or £4,000 for disabled children, for parents who are not receiving universal credit and where no parent earns more than £100,000 per year. The scheme has a phased roll-out during 2017.
– Childcare vouchers are employer-managed schemes meeting up to £55 of childcare costs per parent per week.
► Benefits system:
– Universal Credit is being phased in to replace Working Tax Credit, but full transition for existing claimants will not be completed until the early 2020s.
– Universal Credit funds 85 per cent of childcare costs up to a maximum of £175/week for one child or £300/week for two or more children.
– The childcare element of Working Tax Credit funds up to 70 per cent of childcare costs up to the same thresholds as for Universal Credit with additional funding for households on housing or council tax benefits.

22Family and Childcare TrustChildcare survey 2017
► Support for student parents: the Childcare Grant supports undergraduate parents in England and Wales, and the Childcare Fund has a similar function in Scotland. The Care to Learn scheme supports further education students under 20. Parents over 20 in further education have access to the Discretionary Learner Support Fund (England), Discretionary Fund (Scotland), and Financial Contingency Fund (Wales) – these are administered through colleges.
4B. Free childcare offersEngland, Scotland and Wales all have free childcare offers for some pre-school children, but both eligibility and extent of support varies in the different nations. Eligibility generally starts at the beginning of the school term after the relevant birthday.
Entitlements for two year olds Entitlements for three and four year oldsEngland 15 hours a week for 38 weeks a year
for two year olds from families claiming various benefits (including in-work benefits), or who are disabled, or who are looked after by the local authority. This equates to about 40 per cent of all two year olds.
15 hours a week for 38 weeks a year for all three and four year olds. (38 weeks a year is approximately the length of school term times).
Scotland 600 hours a year for two year olds from families claiming certain benefits, or who are looked after by the local authority. Eligibility criteria are narrower than for English families.
600 hours a year for all three and four year olds – this equates to 12.5 hours a week over 48 weeks.
Wales 12.5 hours a week for 39 weeks a year for two and three year olds living in Flying Start areas. These are geographic areas which are more deprived. There are no additional criteria for families living within these areas.
10 hours a week for 38 weeks a year for all three and four year olds (in practice some local authorities offer more than this). Three year olds living in Flying Start areas are entitled to the same level of support as two year olds.
In England, working parents of three and four year olds will be entitled to 30 hours per week of free childcare for 38 weeks per year from September 2017. This represents a doubling of the current entitlement and will be available to families where both parents (or one parent in lone parent households) earn at least the equivalent of 16 hours per week at the national minimum wage but below £100,000. Parents who do not meet these employment thresholds will continue to be entitled to 15 hours per week. The scheme has been piloted, in whole or in part, in some areas of England during 2016/17.
In Scotland, by 2020 all 3 and 4 year olds will be entitled to 1140 hours of early education a year, equivalent to 24 hours per week over 48 weeks. There will be no work requirements for parents to claim this entitlement.

23Family and Childcare TrustChildcare survey 2017
In Wales, working parents of 3 and 4 year olds will be able to get 30 hours a week of free early education and childcare for 48 weeks of the year. No date has yet been set for this policy to be implemented.
4C. The impact of childcare costs on family budgetsChildcare costs can have a significant impact on household budgets from babyhood up to secondary school age. However, the most difficult period for families is from the end of maternity pay or pay for shared parental leave up to age two or three. Statutory maternity/shared parental leave pay ends after nine months – although statutory leave continues up to a year, the last three months are not paid. When families have two or more children, particularly if they are close in age, paying for childcare is even more of a challenge.
Universal Credit and Working Tax Credit provide some support with childcare costs for parents in work on lower incomes, covering some childcare costs up to a maximum cap. All parents are eligible to access Tax Free Childcare (rolled out during 2017) and some also have access to Childcare Vouchers, which offer a similar type of tax relief. Lower income families will normally be better off claiming Universal Credit or Working Tax Credit rather than a tax relief scheme.
The interaction between these two systems means that the proportion of a household’s income that is spent on childcare varies considerably according to the amount they are earning. The chart below shows the proportion of disposable income spent on childcare for a family with a child under one and a child of primary school age, where both parents or the single parent are working full-time. The chart assumes that the family is using a full-time childminder for the youngest child and after-school care for the older child.
Chart 5: Percentage of disposable income spent on childcare by families in full-time work with two children (after housing costs)
13200
16800
20400
24000
27600
31200
34800
38400
42000
45600
49200
52800
56400
60000
63600
67200
70800
74400
78000
0%
5%
Family gross annual income
10%
15%
20%
25%
30%Couple (London)
Couple
Single parent
35%
40%
45%
50%
Note: Universal Credit rates for 2016/17 are used (but a 63p taper is applied). Both parents are working full-time and are aged over 25, and neither is earning more than £50,000. Housing costs are based on the rates paid by Local Housing Allowance. One child is under two, and one is at primary school, and both are using a childminder during term time. During the holidays, the older child attends a holiday club.
24Family and Childcare TrustChildcare survey 2017
The percentage of discretionary income spent on childcare peaks at 37 per cent for a couple earning around £60,000, and at 45 per cent for a single parent earning around £56,000. In London, the maximum proportion spent is very slightly lower, but the peak occurs at a higher income level.
Assessing the proportion of income is different to measuring the amount families have to spend after childcare costs: families on the lowest incomes will always have the least amount of money left to spend after these costs are met, even when a high proportion of these costs are met through the benefits system.
Where a parent has taken time off work to have a child or children, they will often need to make a calculation about whether it is financially worthwhile for them to return to employment – this applies to both single parents and parents in couples where their partner is already in work. In many cases, this calculation will be complex – as well as the number and age of their children, the local cost of childcare, the amount they would earn and the level of support (if any) for childcare costs they would receive, parents need to take into account the time and money spent travelling between work and their childcare provider. They also need to determine whether childcare is available in their local area to meet their needs – almost half of local authorities report a shortage of childcare places for under-twos, and where there are places there may be a waiting list.
Low income families will generally have a net income gain when a lone parent or a second earner moves into work or increases their hours, even after childcare costs have been paid. However, these gains are very low, equating to £1.96 per hour worked if a parent in a couple with a working partner moves into full-time work, or £2.58 for a single parent (based on the assumptions set out above).
Some families may not even see this modest gain from moving into work while paying childcare costs. These include:
► Couple parents with one high earner and one low earner who are unlikely to be eligible for support through Working Tax Credits or Universal Credit, so childcare costs could be close to or higher than the low earner’s salary.
► Couple parents with two low earners who are likely to be eligible for Universal Credit or Working Tax Credits, but when the second earner moves into work, their entitlement to Universal Credit will be tapered off by 63p for every £1 earned, from which they will pay some childcare costs.
► Families with high childcare costs, including larger families and families with several children under three. While all families with high childcare costs can find that these are close to or even exceed a lone parent’s or a second earner’s salary, the impact can be particularly acute for low income households. This is because Universal Credit or Working Tax Credits have caps on the amount of costs that they will support, which may be much lower than the actual costs faced by the family.
► Families with disabled children: costs are often higher for this group and sufficiency is lower. Where childcare for young children is available, it is often in maintained settings with restricted opening hours. This can place serious restrictions on the type of work that parents are able to take on, reducing their earning potential.

25Family and Childcare TrustChildcare survey 2017
Methodology
Note on terminology: we use childcare to refer to all forms of care not provided by parents or main carers and outside of compulsory schooling. Early education is one type of childcare and refers to children below school age. We believe that all activities in a child’s life have a role in their education and development, but use the term childcare throughout for simplicity.
This report is based on surveys sent to all local authority Family Information Services in England, Scotland and Wales by the Family and Childcare Trust. It builds on similar reports carried out annually since 2001.
We sent surveys to Family Information Services in November 2016. Respondents were able to fill it in as a form or online. Following the mid-December survey deadline, we sent Freedom of Information requests to local authorities which had not responded. The questions about the 30 hour offer were not included in the Freedom of Information request.
Authorities who responded without the need for a Freedom of Information request were promised that individual responses would not be published, with only regional/national averages provided in the report. This is consistent with previous surveys, and we do it to encourage honest and accurate data reporting. When Freedom of information requests are used, some local authorities automatically publish their own responses, so we cannot make the same promise. However, we do not report these Freedom of Information individual responses in this report, and nor do we say which responses were acquired through Freedom of Information requests and which through surveys.
Percentages in all tables may not add up to 100 per cent due to rounding.
SurveyAverage, maximum and minimum childcare costs are provided by local authorities rather than being calculated by the Family and Childcare Trust from information directly from providers. Similarly, assessments of sufficiency are provided by local authorities rather than being based on data collected by the Family and Childcare Trust research team.
Where possible, we have kept questions consistent with previous versions of the survey to allow for tracking over time. However, we have made some changes to reflect the changing policy environment and in response to feedback from both survey respondents and organisations who use the data. We used slightly different surveys for local authorities in England, Scotland and Wales to reflect the different policy environments in the three nations.
Key changes for the 2017 survey were:
► The addition of a question on Duty to Consult for Scottish local authorities – to more accurately reflect the nature of local authority work in this area.

26Family and Childcare TrustChildcare survey 2017
► Changes to the sufficiency question options to add ‘data not collected’ and ‘cannot tell from our data’ options instead of ‘don’t know/not applicable’ – to give more granularity in response options, particularly for Scotland where legal duties are different.
► Splitting the question on nursery prices for two-four year olds into separate questions for two year olds and three-four year olds – in response to feedback from local authorities that prices were often different for these groups.
► The addition of a one-off set of questions for English local authorities about the anticipated impact of the 30 hour entitlement. We intend to follow these up in 2018 to find out how far these were reflected by actual experience.
Family and Childcare Trust will continue to keep the survey under review as childcare policy changes in 2017/18 and beyond. In particular, we will work with local authorities to establish the most effective way to track prices paid by parents of three and four year olds once free entitlements are taken into account.
Response ratesWe received responses from 95 per cent of local authorities across England, Scotland and Wales. The lowest response rate for any region was 85 per cent (eleven out of thirteen authorities) in Inner London. Some local authorities did not give data for all questions, or gave data in a format that we could not use. The effective response rate for the price questions was therefore between 86 per cent and 88 per cent, with the exception of the question about after-school childminders, for which it was 70 per cent. The response rate for the questions on 30 hour sufficiency, which were only asked of English local authorities, was 74 per cent. This is because these questions were not subject to Freedom of Information requests.
While the response rate for this survey was high compared to similar surveys, we are concerned about the declining quality of information that some local authorities are able to provide. This year, around ten per cent of returned surveys either included no price information, or gave information which was not usable (for example, simply referring to a provider directory). We believe that this is linked to increased budgetary pressures on Family Information Services.
WeightingsIn line with the 2016 survey, we have weighted cost data within regions and nations. This ensures that results from small local authorities which have relatively little childcare do not unduly influence overall results. Data on pre-school childcare is weighted against the 0-4 population based on ONS mid-year population estimates. Within local authorities, we have weighted cost data for PVI and maintained setting providers against the number of providers in that area. This is based on an assumption that the types of settings will have the same number of children on average. Childminder cost data is presented separately and not as part of the local weighted average for non-domestic settings. This is because of difficulties accurately estimating the number of children using childminders as opposed to non-domestic settings on a local level.

27Family and Childcare TrustChildcare survey 2017
Tracking change over timeWe use the cost of 25 hours a week of childcare for under 2s as our index for comparison, as this group are not eligible for any free childcare offers, making it easier to compare year-on-year.
When comparing prices over time, we have only included local authorities where we have data for both 2016 and 2017. This is to avoid results being skewed by different local authorities having missing data year-on-year. Changes are weighted against the 2017 population as described above. This approach produces different results to comparing regional weighted prices from the 2016 survey to regional weighted prices in the 2017 survey – we believe it gives a more accurate reflection of the changes experienced by families.
Data we do not collectWe do not collect data on the costs and availability of nannies and au pairs. This is because this data is not held by local authorities, and because they are used by a very small proportion of the population. Necessarily, the survey also excludes all types of informal childcare (e.g. grandparents, friends, babysitters). Information on families’ use of formal and informal childcare can be found in the Department for Education’s biannual report series Childcare and Early Years Survey of Parents – the latest edition is for 2014-15. We exclude Northern Ireland because the childcare funding system is very different, making it hard to draw direct comparisons.