Embed Size (px)
Citation preview

Childcare Survey 2019Lester Coleman and Joshua Cottell
Coram Family and ChildcareChildcare Survey 2019 02
Contents
Executive Summary . . . . . . . . . . . . . . . . . . . . . . . . . . . . . . . . . . . . . . . . . . . . . . . . . . . . . . . . . . . . . . . . . . . . . . . . . . . . . . . . . . . . . . . . . . . . . . . . . . . . . . . . . . . . . 4
Introduction . . . . . . . . . . . . . . . . . . . . . . . . . . . . . . . . . . . . . . . . . . . . . . . . . . . . . . . . . . . . . . . . . . . . . . . . . . . . . . . . . . . . . . . . . . . . . . . . . . . . . . . . . . . . . . . . . . . . . . . 6
Glossary 1 – Terms used in this report . . . . . . . . . . . . . . . . . . . . . . . . . . . . . . . . . . . . . . . . . . . . . . . . . . . . . . . . . . . . . . . . . . . . . . . . . . . . . . . . . 8
Glossary 2 – Childcare payment terms . . . . . . . . . . . . . . . . . . . . . . . . . . . . . . . . . . . . . . . . . . . . . . . . . . . . . . . . . . . . . . . . . . . . . . . . . . . . . . . . 9
Section 1 – Prices for childcare . . . . . . . . . . . . . . . . . . . . . . . . . . . . . . . . . . . . . . . . . . . . . . . . . . . . . . . . . . . . . . . . . . . . . . . . . . . . . . . . . . . . . . . . . . . . . 10
A: Prices for part time (25 hours a week) childcare for children under three . . . . . . . . . . . . . . . . . . . . . . . . . . . . . . . 10
B. Prices of full time (50 hours a week) childcare for children under three . . . . . . . . . . . . . . . . . . . . . . . . . . . . . . . . . 11
C. Childcare prices for children aged three and four . . . . . . . . . . . . . . . . . . . . . . . . . . . . . . . . . . . . . . . . . . . . . . . . . . . . . . . . . . . . . 12
D. Variations in the price of childcare for young children . . . . . . . . . . . . . . . . . . . . . . . . . . . . . . . . . . . . . . . . . . . . . . . . . . . . . . . . 13
E. Prices of school age childcare . . . . . . . . . . . . . . . . . . . . . . . . . . . . . . . . . . . . . . . . . . . . . . . . . . . . . . . . . . . . . . . . . . . . . . . . . . . . . . . . . . . . . 14
F: Price changes in childcare since 2018 . . . . . . . . . . . . . . . . . . . . . . . . . . . . . . . . . . . . . . . . . . . . . . . . . . . . . . . . . . . . . . . . . . . . . . . . . . 16
Section 2 – Childcare sufficiency – is there enough childcare? . . . . . . . . . . . . . . . . . . . . . . . . . . . . . . . . . . . . . . . . . . . . . . . . . . . . . . 17
A. Childcare sufficiency – legal duties . . . . . . . . . . . . . . . . . . . . . . . . . . . . . . . . . . . . . . . . . . . . . . . . . . . . . . . . . . . . . . . . . . . . . . . . . . . . . . . 17
B. Childcare sufficiency in England . . . . . . . . . . . . . . . . . . . . . . . . . . . . . . . . . . . . . . . . . . . . . . . . . . . . . . . . . . . . . . . . . . . . . . . . . . . . . . . . . . 17
C. Childcare sufficiency in Scotland . . . . . . . . . . . . . . . . . . . . . . . . . . . . . . . . . . . . . . . . . . . . . . . . . . . . . . . . . . . . . . . . . . . . . . . . . . . . . . . . . . 20
D. Childcare sufficiency in Wales . . . . . . . . . . . . . . . . . . . . . . . . . . . . . . . . . . . . . . . . . . . . . . . . . . . . . . . . . . . . . . . . . . . . . . . . . . . . . . . . . . . . . 22
Section 3 – 30 hours extended entitlement . . . . . . . . . . . . . . . . . . . . . . . . . . . . . . . . . . . . . . . . . . . . . . . . . . . . . . . . . . . . . . . . . . . . . . . . . . . . . . 24
A. Provision of the 30 hours extended entitlement . . . . . . . . . . . . . . . . . . . . . . . . . . . . . . . . . . . . . . . . . . . . . . . . . . . . . . . . . . . . . . . . 24
B. Local authorities’ views about the 30 hours extended entitlement . . . . . . . . . . . . . . . . . . . . . . . . . . . . . . . . . . . . . . . . . 25
Conclusion . . . . . . . . . . . . . . . . . . . . . . . . . . . . . . . . . . . . . . . . . . . . . . . . . . . . . . . . . . . . . . . . . . . . . . . . . . . . . . . . . . . . . . . . . . . . . . . . . . . . . . . . . . . . . . . . . . . . . . 29
References . . . . . . . . . . . . . . . . . . . . . . . . . . . . . . . . . . . . . . . . . . . . . . . . . . . . . . . . . . . . . . . . . . . . . . . . . . . . . . . . . . . . . . . . . . . . . . . . . . . . . . . . . . . . . . . . . . . . . . 30
Appendix – Methodology . . . . . . . . . . . . . . . . . . . . . . . . . . . . . . . . . . . . . . . . . . . . . . . . . . . . . . . . . . . . . . . . . . . . . . . . . . . . . . . . . . . . . . . . . . . . . . . . . . . . . 31

Coram Family and ChildcareChildcare Survey 2019 03
Acknowledgements
We would like to thank the local authorities who shared their data with us, and the National Association of Family Information Services (NAFIS) for their help with designing questions. Thanks also to our colleagues at Coram Family and Childcare, particularly Celeste Pergolizzi, Claire Harding and Megan Jarvie. Thanks are also due to Paul Abrahams at Ginger Design for design.
About this report This report is the nineteenth annual Childcare Survey. It is based on surveys from local authorities in England, Scotland and Wales, which were returned to Coram Family and Childcare between November 2018 and January 2019. We also produce the Holiday Childcare Survey, which is published annually before the school summer holidays. Previous reports are available from our website: www.familyandchildcaretrust.org.
Note on terminology: we use childcare to refer to all forms of care which are paid for by families or the government, not provided by parents or main carers and outside of compulsory schooling. Early education is one type of childcare and refers to children below school age. We believe that all activities in a child’s life have a role in their education and development, but use the term childcare throughout for simplicity.
About Coram Family and Childcare Coram Family and Childcare works to make the UK a better place for families by bringing together what we learn from our on the ground parent-led programmes and our research to campaign for solutions that parents want and need. We focus on childcare and early years to make a difference to families’ lives now and in the long term. Before August 2018, we were known as the Family and Childcare Trust.

Coram Family and ChildcareChildcare Survey 2019 04
Executive Summary
The Childcare Survey 2019 shows a mixed picture for families in Britain. Despite some improvements in the sufficiency of childcare, persistent gaps remain. And despite additional government investment in childcare which help some families, others are facing eye wateringly high prices. Some parents are still worse off in work once they have paid for childcare, particularly in larger families or families with young children. The time from the end of parental leave to a child turning three and becoming eligible for funded childcare is a particular pressure point, as prices are highest and there is the least government support. There are seven different ways that families can get support with their childcare costs, each with different eligibility criteria. While the support that is available is welcomed by many parents, the complexity of the system leaves parents at risk of missing out on the support they are entitled to.
Childcare enables parents to work, keeping valuable skills in the workforce, and helps children do better at school, which can narrow the gap between disadvantaged children and their peers. Action is needed to make sure that every family is able to access high quality childcare that boosts children’s development and enables parents to work.
Price of childcare ► Childcare prices for children under three have risen slightly above inflation this year.
Price Increase since 201825 hours a week nursery for child under two £127 3%25 hours a week nursery for child age two £124 4%
► Working parents of three and four year olds in England can now get 30 hours of funded childcare a week with the extended entitlement. If they need 20 extra hours to take this up to 50 hours a week, the average price will be £96, 2 per cent higher than in 2018.
► In Scotland, where the extension of funded childcare for three and four year olds has not yet rolled out, 50 hours of childcare for three and four year olds is £148 per week, also 2 per cent higher than in 2018.
► The average price for families using an after school club for five days is £59 per week.
Whether there is enough childcare ► Only around half of local authorities in England (57 per cent) and Wales (43 per cent) have enough childcare for parents working full time.
► Fewer than one in four local authorities have enough childcare available for children needing after school care, parents working outside normal office hours, or disabled children.
► A significant majority of local authorities have enough childcare for three and four year olds eligible for the universal entitlements, but sufficiency for the targeted two year old offer is slightly lower.
► While there are still significant gaps in the availability of childcare, in England there have been improvements and more local authorities report that they had enough childcare than last year.

Coram Family and ChildcareChildcare Survey 2019 05
The 30 hours extended entitlement in England ► Sixty-two per cent of English local authorities have enough childcare for children using the 30 hours extended entitlement, which is higher than in 2018.
► The majority of local authorities have not seen any impact on the availability of early years childcare, including the entitlements, as a result of the introduction of 30 hours. Generally, local authorities were more likely to be positive than negative about future impacts.
► However, there were some areas for concern: a quarter of local authorities thought that 30 hours had caused prices to rise for three and four year olds outside of the entitlements and a third thought it had a negative impact on the financial sustainability of childcare settings.
RecommendationsGovernment should develop a childcare strategy and reform all current spend on childcare to create a simple and efficient system that makes sure all parents are better off working, encourages quality improvement and promotes child development.
An ambitious strategy and reform will take time. In the shorter term, there are actions that can be taken to improve provision. We call on Scottish, Welsh and UK governments to:
► Make sure every parent is better off working after paying for childcare. This includes increasing the maximum amount of childcare costs paid for under Universal Credit and moving to upfront payments for childcare to make it possible for parents to move into work.
► Make sure there is enough childcare available for all families, prioritising the families currently most likely to miss out, including disabled children, parents working outside the typical 9 to 5 and older children. This should include start up grants for childcare providers.
► Regularly review the funding rate for early years entitlements to make sure that they meet the cost of delivering high quality childcare.
► Help parents to improve their skills and employability by extending the 30 hours entitlement for three and four year olds to families where parents are in training.
► Improve access to early education for disadvantaged children by doubling the early years pupil premium.
► Monitor what effect new funding (Tax Free Childcare and 30 hours) is having on childcare prices and whether it is helping parents into work and narrowing the achievement gap. This should consider how current spend could be reallocated to better meet the needs of disadvantaged and low income children, including current underspend of the Tax Free Childcare budget.
Coram Family and ChildcareChildcare Survey 2019 06
Introduction
This report is the nineteenth annual Childcare Survey. It is based on surveys from local authorities in England, Scotland and Wales, that were returned to Coram Family and Childcare between November 2018 and January 2019. A total of 193 local authorities returned data generating a response rate of 94 per cent. The methodology section at the end of the report provides further information on how we conducted the survey and analysed findings.
The report consists of three main sections: 1) the prices of childcare, 2) the availability of childcare, and 3) English local authorities’ views about the 30 hours extended entitlement. Information on the price and availability of childcare is broken down by nation and region, by the age of child and the type of childcare.
Childcare is vitally important for many families in Britain: it supports parents to go out to work and high quality childcare helps to boost children’s outcomes, particularly in the early years where it can narrow the achievement gap that opens up before children even start school.
Over seven million children in England alone use formal childcare (Department for Education, 2018). Many more use informal childcare, most commonly children being looked after by their grandparents. For pre-school children, nurseries are the most commonly used form of formal childcare followed by childminders. Once a child starts school, they may use breakfast, after school or holiday clubs in their school or at another private, voluntary or local authority setting or a childminder. This report does not include information on nannies and au pairs because they have different requirements around registration and are not commonly used. Our Childcare Surveys track whether there is formal childcare available for the families who need it, and whether it is affordable for them.
Government investment in childcare has risen over the past 20 years to help support parents to work and to boost children’s outcomes through early education. The government now spends £6 billion per year on childcare and the glossary below provides more information on the different forms of support that are available for parents, including Tax Free Childcare and extensions to funded childcare for three and four year olds which have been recently introduced. Tax Free Childcare was introduced in April 2017 and helps parents to pay for childcare. It cannot be used at the same time as Universal Credit, which is only available for low and middle income families and normally provides more generous support than Tax Free Childcare, meaning that Tax Free Childcare mostly benefits higher income families. To date, uptake of Tax Free Childcare has been lower than expected.
In September 2018 in England, funded childcare was extended for three and four year olds with working parents to 30 hours per week during term time. A similar scheme, but for 48 weeks per year, is currently being piloted in Wales in some areas and is gradually being rolled out across the nation. In Scotland, funded childcare will be extended to 1140 hours per year (30 hours per week for 38 weeks per year) for all children, not just those with working parents. This will be rolled out by 2020.
For eligible families, this new investment can help make childcare more affordable. However, some childcare providers have raised concerns about the roll out of 30 hours, particularly around whether the government funding covers their delivery costs. The new policies have also added to the complexity of the childcare system, with seven different ways that families can access support for childcare, all with different eligibility requirements.
Coram Family and ChildcareChildcare Survey 2019 07
Our Childcare Survey looks at the price of childcare before any support to help pay for childcare is taken into account as this allows us to track price changes over time and recognises that different families will also be eligible for different levels of support depending on their circumstances. However, for three and four year olds, we ask about the price of childcare assuming that they are using the childcare entitlement.
The following glossaries define phrases used throughout the report and the financial support that is available to parents1. These are essential reading for those less familiar with either the childcare system or the multiple forms of support available. These tables further outline what is included or excluded in the report such as childcare referring to care paid for families or the government rather than informal support from relatives or friends.
For further information including more detailed inclusion and exclusion criteria for childcare support, see Coram Family and Childcare: www.familyandchildcaretrust.org/childcare-guides.
Finally, in addition to this childcare survey, Coram Family and Childcare also produce the Holiday Childcare Survey, which is published annually before the school summer holidays. Previous reports are available from our website: www.familyandchildcaretrust.org/holiday-childcare-survey-2018.
1 We will use ‘parents’ to include parents and carers of children.

Coram Family and ChildcareChildcare Survey 2019 08
Glossary 1 – Terms used in this report
► Childcare – the care, education and supervision of a child or multiple children by someone who is not their parent or carer, usually including pre-school and school-aged children. In this report, childcare includes government funded early education but not compulsory schooling, nor support from relatives or friends.
► Early Years – from a child’s birth to school age.
► Nursery – childcare provided in a group setting, with several early years professionals looking after a group of children. For children under five years of age and can include pre-school, day nurseries, and school nurseries.
► Private, voluntary and independent nurseries – nurseries not run by local authorities or schools. They may be run by private companies, independent schools or voluntary organisations such as charities.
► Maintained nurseries – stand-alone local authority nurseries that provide early education and childcare to children under five years, normally during school hours in term time.
► Nursery classes in schools – provide early education and childcare to children usually aged between two or three and four years. They are usually closed in school holidays.
► Wrap-around childcare – childcare to help working parents, where children are looked after before and after school. This includes breakfast or after school clubs and childminders.
► Childminder – a registered child carer who works with children for more than two hours a day in their own home.
► Registered childcare – childcare providers that are registered for quality assessment by the childcare regulator. In England this is Ofsted, in Wales, it is the Care Inspectorate Wales (CIW) and in Scotland, the Care Inspectorate. To receive government funding for childcare, providers must be registered.
► 25 hours – considered as ‘part time’ childcare to cover a typical part time working week, including time to travel to and from work.
► 50 hours – considered as ‘full time’ childcare to cover a typical full time working week, including time to travel to and from work.
► Weighted average – this provides a more realistic average to account for differences in the population of children and number of childcare providers in the local authority areas.

Coram Family and ChildcareChildcare Survey 2019 09
Glossary 2 – Childcare payment terms2 Childcare support
Age of child
Nation Applicability
Funded childcare for 2 year olds
2 year olds England 15 hours a week for 38 weeks a year for parents in receipt of benefits (including in-work benefits) or children who are disabled or looked after.
Scotland 600 hours a year for parents in receipt of benefits (including in-work benefits) or children who are looked after. Eligibility criteria narrower than for English families.
Wales 12.5 hours a week for 39 weeks a year for 2 and 3 year olds in Flying Start areas (geographic areas which are deprived).
Universal funded childcare for 3 and 4 year olds
3 to 4 year olds
England 15 hours a week for 38 weeks a year for all 3 and 4 year olds.
Scotland 600 hours a year for all 3 and 4 year olds (12.5 hours a week for 48 weeks). By 2020, all 3 and 4 year olds will be entitled to 1140 hours a year. At the moment this is being piloted in some local areas.
Wales 10 hours a week for all 3 and 4 year olds. Increased to 12.5 hours for 3 year olds in Flying Start areas.
Funded childcare for 3 and 4 year olds with working parents3
3 to 4 year olds
England 3 and 4 year olds with working parents are entitled to an extra 15 hours a week funded childcare for 38 weeks of the year, meaning they get 30 hours a week in total.
Scotland No difference to universal funded childcare (above).
Wales 3 and 4 year olds with working parents will be entitled to 30 hours per week for 48 weeks a year. At the moment this is being piloted in some local areas.
Tax Free Childcare
Aged under 12 or under 17 if child has a disability
All nations Covers 20% of childcare costs up to a maximum of £2,000 per child per year or £4,000 for disabled children. Tax Free Childcare replaces the childcare vouchers scheme which has closed for new applications.
Parents and their partner (if they have one) must earn at least the equivalent of 16 hours a week at the national minimum wage or national living wage.
Can be received alongside the 30 hours extended entitlement, but not Working Tax Credit or Universal Credit.
Universal Credit
Any age with Ofsted registered providers
All nations Pays up to 85% of childcare costs up to £175 per week for one child and £300 for two or more children. This is set to replace Tax Credits and other benefits.
Universal Credit can be claimed alongside funded childcare, but not with Working Tax Credit or Tax Free Childcare. Parents must have an income below a certain level – this varies depending on a families’ circumstances.
2 In addition to the childcare support in this table, there is support for parents in education which can be viewed here: www.childcarechoices.gov.uk3 Parents and their partner (if they have one) must both earn at least the equivalent of 16 hours a week at the national minimum wage or national living wage. Claimant must not earn more than £100,000 per year.

10Coram Family and ChildcareChildcare Survey 2019
Section 1 – Prices for childcare
This section describes the typical prices charged by childcare providers and discusses how they have changed in the last year. Most parents receive some support through Tax Free Childcare or the benefits system to help them pay these costs (see the childcare support glossary in the introduction).
A: Prices for part time (25 hours a week) childcare for children under three This year, the average price of 25 hours of childcare a week for a child under two in a nursery is £127 across Great Britain, or £6,600 a year. The average price of 25 hours of childcare a week for a child under two by a childminder is £113 across Great Britain, or £5,900 a year. There are substantial variations between regions outlined below. Inner London has the highest costs for 25 hours a week childcare for children under three.
The price of a part time childcare place for a child aged under three is about twice as much as the average household spends on food each week (£60.60; ONS, 2019).
Table 1 - Price of 25 hours a week childcare for children under three at nurseries and childminders
Nursery ChildminderUnder two Two Under two Two and over
Great Britain £127.12 £124.04 £113.31 £112.02England £128.98 £125.77 £114.37 £112.92Scotland £111.08 £107.86 £104.54 £103.46Wales £117.36 £116.19 £105.70 £105.70East Midlands £113.48 £113.22 £95.48 £95.94East of England £127.78 £126.37 £114.22 £113.88London, inner £174.54 £163.01 £159.46 £156.91London, outer £151.08 £143.44 £143.69 £138.83North East £124.81 £118.00 £102.14 £102.11North West £108.03 £103.57 £92.70 £93.37South East £137.04 £135.50 £120.40 £117.62South West £126.51 £125.00 £115.01 £114.33West Midlands £125.87 £123.37 £106.46 £106.11Yorkshire and Humberside £107.61 £109.96 £98.66 £97.75
Great Britain:Overall, nursery costs are slightly higher than childminder costs (for 25 hours a week for under twos and two-year olds).
► Nursery costs for under twos are slightly more costly than for children aged two years. This is because the staffing ratios tend to be higher for younger children hence the staffing costs are higher.

11Coram Family and ChildcareChildcare Survey 2019
► Although the nursery costs for two year olds are slightly less than those under two, childminder costs for under and over twos are relatively similar. This may reflect childminders having less scope to change staff load compared to nurseries meaning they are more likely to charge the same or similar prices for under twos and two year olds.
English regional differences: ► Within the English regions, the price for 25 hours of nursery childcare for under twos is 62 per cent higher in Inner London (£174.54) than in Yorkshire and Humberside (£107.61).
► For 25 hours of nursery childcare for children aged two, the highest prices are seen in Inner London at £163.01 and are 57 per cent higher than the North West (£103.57).
B. Prices of full time (50 hours a week) childcare for children under three Prices for full time care (50 hours a week) tend to be slightly less than twice the price of 25 hours a week, as providers pass economies of scale on to parents. The average price of 50 hours of care a week for a child under two in nursery is £242 across Great Britain, or £12,600 a year. With a childminder it is £221 per week across Great Britain, or £11,500 a year. There are again substantial variations between regions outlined below with Inner London having the highest costs for 50 hours a week care.
The price of a full time childcare place for a child under three is nearly four times as much as the average household spends on food (ONS, 2019).
Table 2 - Price of 50 hours a week childcare for children under three at nurseries and childminders
Nursery ChildminderUnder two Two Under two Two and over
Great Britain £242.35 £236.85 £220.95 £218.79England £245.95 £240.06 £222.99 £220.57Scotland £213.25 £208.53 £208.51 £206.28Wales £222.34 £221.16 £202.09 £202.09East Midlands £208.73 £209.15 £188.51 £189.43East of England £240.82 £236.88 £225.56 £225.87London, inner £329.54 £313.24 £302.99 £299.05London, outer £278.24 £273.35 £280.78 £270.41North East £230.25 £217.47 £203.72 £203.66North West £207.10 £196.68 £182.32 £184.13South East £255.41 £255.47 £238.45 £233.70South West £251.35 £240.70 £219.67 £218.59West Midlands £251.81 £244.30 £210.28 £209.50Yorkshire and Humberside £213.66 £210.79 £195.83 £194.92
Great Britain: ► As with part time care, nursery costs are again slightly higher than childminder costs (for 50 hours a week for under twos and two year olds).
► Nursery and childminder costs for under twos are slightly more costly than for children aged two years.

12Coram Family and ChildcareChildcare Survey 2019
English regional differences: ► Within the English regions, the price for nursery places (for under twos) are 59 per cent higher in Inner London (£329.54) compared to the North West (£207.10).
► For nursery places for children aged two, the highest prices are again in Inner London at £313.24 and are 59 per cent higher than the North West (£196.68).
► Childminder prices are generally cheaper than nurseries for 50 hours a week, with the highest prices again seen in Inner London.
Low and middle income families will be able to receive support with childcare costs through Universal Credit or Tax Credits. However, for some families the cost of childcare will exceed the support that is available. In eight per cent of local authorities, the maximum limit per child under Universal Credit and Working Tax Credit of £175 per week does not cover even a part time place in childcare for a child under two. This rises to 94 per cent for a full time place. If a families’ childcare costs exceed these maximum limits, they will not receive any additional financial support for these childcare costs. This can mean that they are paying more in childcare costs than they are earning, and so are worse off financially for working more hours.
C. Childcare prices for children aged three and four When asking about childcare prices for three and four year olds, we took into account that all children of this age group in England, Scotland and Wales are entitled to some funded early education until they start school. Parents will therefore only need to pay for some of the hours of childcare that they need. For example, in England a parent needing childcare for 25 hours a week and entitled to a funded place for 15 hours a week would only pay for 10 hours.
In addition to the universal entitlements in all three nations, three and four year old children of working parents in England and parts of Wales get extra hours of funded early education, and there are plans to introduce similar schemes in Scotland and the rest of Wales. The 30 hours extended entitlement in England was introduced in September 2017 and its impact on the childcare market is continuing to develop. We have assumed that families do not have to pay for any additional costs (for example, for lunch or other consumables) although we are aware that some families will face additional costs. This is discussed fully in Section 3 (30 hours extended entitlement).
The situation in Wales is in complex transition: some areas are offering the 30 hours extended entitlement, some have legacy arrangements which offer extended hours, some are Flying Start areas which offer 12.5 hours, and the rest are offering the standard 10 hours – often there are different systems in place in the same local authority. As such, it is not possible to calculate a meaningful price for three and four year olds in Wales in this report. Likewise, it is difficult to compare prices in England and Scotland given the different number of hours parents have to pay to achieve 50 hours of childcare (20 hours in England as opposed to 35 hours in Scotland).
In England and Wales, some providers, particularly schools, have funded childcare available in term-time only and we have used this assumption in our calculations, so prices for parents will be higher in the holidays. In practice, many childcare providers use a ‘stretched’ offer to give the same amount of childcare hours over more weeks, for example, 22.8 hours a week for 50 weeks of the year rather than 30 hours a week for 38 weeks of the year. This means some parents will be paying for more hours than we asked about in the survey.

13Coram Family and ChildcareChildcare Survey 2019
Even with the funded early education available, in England the price of a full time childcare place for a child aged three or four is 60 per cent more than the average household spends on food (ONS, 2019).
Table 3 - Price of 25 and 50 hours a week childcare for three and four year olds
25 hours a week, including universal entitlement (paying for 10 hours)
50 hours a week, including extended entitlement in England (paying for 20 hours) and universal entitlement in Scotland (paying for 35 hours)
England £49.23 £95.84Scotland £44.39 £148.20East Midlands £42.18 £80.10East of England £47.53 £95.38London, inner £66.10 £124.06London, outer £58.76 £112.90North East £48.59 £100.53North West £41.85 £79.15South East £50.93 £99.33South West £47.71 £95.43West Midlands £49.86 £98.79Yorkshire and Humberside £42.92 £84.69
Parents are paying considerably less for childcare for three and four year olds than for younger children. There are two key drivers for this: families are receiving funded hours meaning that parents are paying for fewer hours and lower staff to child ratios meaning that childcare costs less to provide.
Within the English regions, the price of 25 hours a week (with the funded childcare) for three and four year olds is 58 per cent higher in Inner London (£66.10) compared to the North West (£41.85). Although the price difference for 50 hours a week across the regions is more financially, the proportional difference is similar for 25 hours a week: the costs are 57 per cent higher in Inner London (£124.06) compared to the North West (£79.15).
D. Variations in the price of childcare for young children This section outlines the highest and lowest prices of 25 hours childcare (for children under two years) relative to the local authority average price. These differences from the average price reflect the ability of private childcare businesses (outside of the funded entitlements) to set their fees in a competitive marketplace.

14Coram Family and ChildcareChildcare Survey 2019
Table 4 - Highest and lowest prices as a percentage above or below average prices, for 25 hours of care for a child under two
Highest price above average Lowest price below averageGreat Britain +47% -29%England +49% -29%Scotland +33% -37%Wales +33% -19%East Midlands +58% -33%East of England +46% -23%London, inner +45% -35%London, outer +34% -29%North East +28% -27%North West +63% -29%South East +60% -32%South West +44% -26%West Midlands +41% -27%Yorkshire and Humberside +47% -31%
Great Britain: ► Of these 25 hour childcare costs for under twos, the differences are more marked for the highest price relative to the lowest price. For Great Britain, the highest price is around 50 per cent higher than the average (+47 per cent), whereas the lowest price around one-third below the average (-29 per cent). Rental costs, required space, minimum wage, and regulations regarding ratios between staff to children means that there is in effect a minimum possible cost for providing childcare. The higher prices are more significantly different from the average because they reflect that some parents are able and willing to pay considerably more than the average for childcare.
English regional differences: ► Within the English regions, the highest prices range from 63 per cent above the average in the North West to 28 per cent above average in the North East.
► The lowest prices show less variation, between 23 per cent lower than the average in the East of England and 35 per cent lower in Inner London.
E. Prices of school age childcare Table 5 shows the weekly price for an after school club and a childminder for five to 11 year olds. The findings are applicable to term-time care and exclude holiday clubs. For the latter, please see the annual Holiday Childcare survey at: https://www.familyandchildcaretrust.org/holiday-childcare-survey-2018.
This year, the average price of an after school club for a week is £57 across Great Britain, or nearly £2,200 a year during term time. The average price of a childminder to 6pm for a week is £66 across Great Britain, or nearly £2,500 a year during term time. There are also some distinct variations at the regional level.
A place in an after school club for 15 hours a week costs parents about as much as the average household spends on food each week (ONS, 2019). This is without the additional costs that parents will face if they are also paying for childcare before school, which is often necessary for parents working the typical 9-5.

15Coram Family and ChildcareChildcare Survey 2019
Table 5 - Weekly price of an after school club or childminder for children age 5-11
After school club Childminder to 6pmGreat Britain £57.36 £65.70England £58.17 £65.64Scotland £54.17 £68.44Wales £48.77 £63.14East Midlands £56.08 £55.91East of England £54.62 £67.66London, inner £57.75 £110.49London, outer £63.28 £81.63North East £57.85 £59.53North West £52.46 £57.39South East £62.42 £65.76South West £53.83 £67.63West Midlands £69.34 £64.29Yorkshire and Humberside £55.10 £58.55
Great Britain: ► For Great Britain as a whole, childminder costs for five to 11 year olds tend to be higher (£65.70 per week) compared to an after school club (£57.36).
English regional differences: ► The most costly region for 15 hours of after school clubs is the South East (£72.19) which is 44 per cent higher than the least costly region of North West (£52.46). The price difference is notably more for childminders, with Inner London (£110.49) being 98 per cent higher than the least costly region of the East Midlands (£55.91). The next costly region for childminders, Outer London, is 46 per cent higher than the East Midlands.
► The differences between the after school clubs and childminder costs are particularly notable for Inner London, where a childminder is nearly twice the price of an after school club (91 per cent higher for childminder costs).
Some London local authorities have a historic pattern of running some after school clubs in-house and charging low prices to parents. This brings down average prices in these otherwise high-cost areas so they are close to the national average, especially for Inner and Outer London. Childminders are less likely to be subsidised, hence the more substantial regional differences noted above.
As well as using formal after school clubs, parents may also use activity clubs as de facto childcare. Prices for this are not captured in our survey. Because clubs providing a specific activity such as football or dance for children over eight do not have to be registered and regulated as childcare by Ofsted, they are not officially counted as childcare, and so parents will not usually be able to pay for them using Tax Free Childcare or childcare support through the benefits system. Additionally, they usually do not offer enough hours of care per week, or for enough weeks per year, to provide reliable childcare for working parents.
16Coram Family and ChildcareChildcare Survey 2019
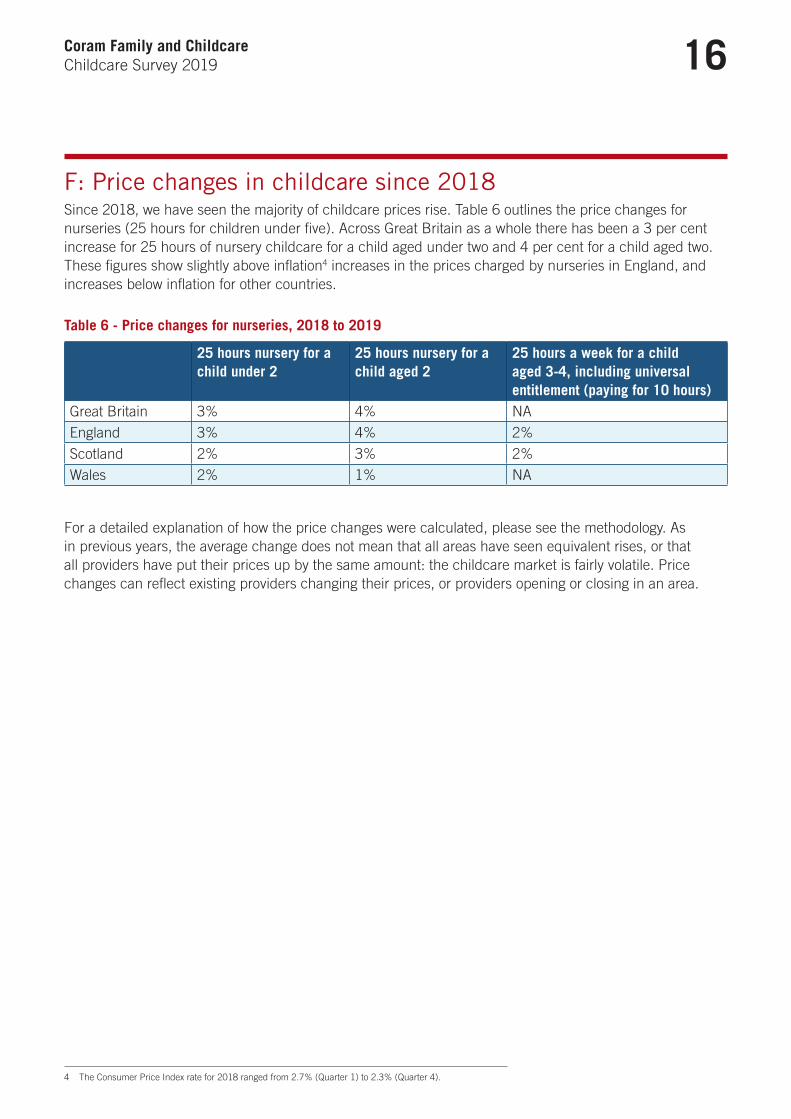
F: Price changes in childcare since 2018 Since 2018, we have seen the majority of childcare prices rise. Table 6 outlines the price changes for nurseries (25 hours for children under five). Across Great Britain as a whole there has been a 3 per cent increase for 25 hours of nursery childcare for a child aged under two and 4 per cent for a child aged two. These figures show slightly above inflation4 increases in the prices charged by nurseries in England, and increases below inflation for other countries.
Table 6 - Price changes for nurseries, 2018 to 2019
25 hours nursery for a child under 2
25 hours nursery for a child aged 2
25 hours a week for a child aged 3-4, including universal entitlement (paying for 10 hours)
Great Britain 3% 4% NAEngland 3% 4% 2%Scotland 2% 3% 2%Wales 2% 1% NA
For a detailed explanation of how the price changes were calculated, please see the methodology. As in previous years, the average change does not mean that all areas have seen equivalent rises, or that all providers have put their prices up by the same amount: the childcare market is fairly volatile. Price changes can reflect existing providers changing their prices, or providers opening or closing in an area.
4 The Consumer Price Index rate for 2018 ranged from 2.7% (Quarter 1) to 2.3% (Quarter 4).

17Coram Family and ChildcareChildcare Survey 2019
Section 2 – Childcare sufficiency – is there enough childcare? This section outlines the legal duties on local authorities around monitoring the local childcare market and then presents data about whether there is enough childcare across Great Britain.
A. Childcare sufficiency – legal duties Local authorities are required to manage the market for childcare in their local area, which means they need to know whether enough childcare is available for key groups. The precise rules vary between the nations of Great Britain:
► In England, local authorities have to audit childcare sufficiency annually, including considering the funded early education entitlements, childcare for school age children, disabled children, and different types of families.
► In Scotland, local authorities have a statutory duty to consult with parents on the delivery of early learning and childcare in Scotland, and to publish a plan based on the results of their consultation.
► Welsh local authorities were required to produce a sufficiency assessment and action plan in 2017 and every five years thereafter, and report to the Welsh government annually through a progress update.
Because these duties vary in different parts of the UK, we have presented sufficiency data separately for the three nations. These data are based on local authorities’ assessments at the time of the survey, which may differ from their published Childcare Sufficiency Assessments if the local situation has changed since this was last published.
B. Childcare sufficiency in England Local authorities were asked to report whether they had sufficient childcare in terms of ‘Yes: all areas’, ‘Yes: in some areas’, ‘No’ or ‘Data not held or cannot tell’. Overall, the provision of childcare in all areas was far from universal and varied according to the type of childcare required.

18Coram Family and ChildcareChildcare Survey 2019
Table 7 - Childcare sufficiency in England (% local authorities)
Yes: in all areas
Yes: in some areas
No Data not held or cannot tell
Children under two 61% 33% 1% 5%Two year old entitlement 63% 37% 0% 1%Three and four year old 15 hours entitlement 74% 25% 0% 1%Three and four year old 30 hours entitlement 62% 35% 1% 2%5 to 11 year olds after school 32% 48% 1% 19%12 to 14 year olds after school 15% 33% 7% 46%Parents working full time 57% 35% 1% 7%Parents working atypical hours 22% 49% 11% 18%Disabled children 23% 47% 10% 21%Families living in rural areas5 27% 50% 4% 20%
► The availability of childcare varies substantially between different groups of children: while three-quarters of local areas have enough childcare for the 15 hours entitlement for three and four year olds, only 15 per cent have enough childcare for 12 to 14 year olds after school.
► Most local areas are able to say whether there is enough childcare in their local area, with the exception of after school childcare for 12 to 14 year olds where there are significant data gaps - 46 per cent report ’Data not held or cannot tell’.
► Some of those facing more need, such as parents working atypical hours and disabled children have the least provision: 22 per cent and 23 per cent of local authorities report enough childcare in all areas respectively. Also, 27 per cent report enough childcare in all areas for families living in rural areas.
► Generally, there is more childcare availability for younger children. For example, 61 per cent of local authorities report enough childcare in all areas for children under two compared to 32 per cent for five to 11 year olds and 15 per cent for 12 to 14 year olds.
The extended entitlement for 30 hours of childcare has only been available since 2017. Although sufficiency for the 30 hours entitlement is still less than the 15 hours entitlement, it has increased since the 2018 report (45 per cent in all areas to 62 per cent in all areas).
Since 2018, sufficiency has increased in all categories apart from the provision for 12 to 14 year olds, as shown in Table 8.
5 In this and subsequent tables, the rural families question only applies to local authorities which have rural areas.

19Coram Family and ChildcareChildcare Survey 2019
Table 8 - Childcare sufficiency defined as ‘Yes: in all areas’ in England, for 2018 and 2019 (% local authorities)
2018 2019Children under two 50% 61%Two year old entitlement 49% 63%Three and four year old 15 hours entitlement 67% 74%Three and four year old 30 hours entitlement 45% 62%5 to 11 year olds after school 26% 32%12 to 14 year olds after school 15% 15%Parents working full time 50% 57%Parents working atypical hours 14% 22%Disabled children 22% 23%
► Apart from the provision for 12 to 14 year olds and disabled children (which showed a modest one percentage point increase), the other forms of provision increased by at least six percentage points since 2018.
► The most notable increases in provision are seen for the three and four year old 30 hours entitlement (17 percentage point increase between 2018 to 2019), followed by the two year old entitlement (14 percentage point increase).
There have been concerns that the roll out of the 30 hours entitlement will reduce sufficiency for other children, although the local authority data suggests otherwise. The small dip in sufficiency for under twos seen in 2018 has now been reversed, having increased from 50 per cent to 61 per cent over the past year.
Across early years’ provision and other age groups, there are some notable English regional variations in the provision of childcare in ‘all areas’. These are shown in Tables 9 and 10.
Table 9 - Childcare sufficiency defined as ‘Yes: in all areas’ in English regions, for early years (% local authorities)
Under two Two year old entitlement
Three and four year old 15h entitlement
Three and four year old 30h entitlement
East Midlands 50% 50% 50% 50%East of England 40% 40% 60% 40%London, inner 55% 73% 91% 64%London, outer 59% 53% 53% 53%North East 91% 91% 100% 82%North West 71% 81% 90% 86%South East 44% 44% 56% 44%South West 43% 54% 64% 43%West Midlands 75% 75% 83% 92%Yorkshire and Humberside 73% 60% 87% 60%

20Coram Family and ChildcareChildcare Survey 2019
► Overall, the South East and the East of England report the least ‘all area’ provision, with the North East reporting the highest levels of provision for early years childcare.
► The greatest regional variation (a 52 percentage point difference) is seen for the three and four year old 30 hours extended entitlement between the East of England (40 per cent) and the West Midlands (92 per cent).
Table 10 - Childcare sufficiency defined as ‘Yes: in all areas’ in English regions, for other groups (% local authorities)
5 to 11 after school
12 to 14 after school
Disabled children
Parents working full time
Parents working atypical hours
East Midlands 25% 25% 25% 38% 25%East of England 30% 20% 20% 50% 30%London, inner 36% 18% 30% 64% 9%London, outer 24% 12% 18% 41% 13%North East 55% 18% 27% 82% 18%North West 43% 19% 30% 76% 38%South East 17% 11% 18% 50% 22%South West 29% 14% 23% 36% 21%West Midlands 27% 0% 17% 58% 17%Yorkshire and Humberside 33% 13% 20% 67% 20%
► With the exception of provision for parents working full time, the South East, Outer London and the West Midlands report the least ‘all area’ provision. The North East and North West report the highest levels of provision.
► The greatest regional variation is seen for parents working full time (a 46 percentage point difference) between the North East and the South West.
► The smallest regional variation in provision is seen for disabled children, where all regions have low sufficiency. Both Inner London and the North West report 30 per cent provision compared to 17 per cent in the West Midlands (a 13 percentage point difference).
C. Childcare sufficiency in Scotland Because statutory requirements in Scotland are different, authorities tend to have less knowledge than their English counterparts about childcare outside of the funded entitlements. Outside of the funded childcare, between 35 per cent and 74 per cent report ‘Data not held or cannot tell’.

21Coram Family and ChildcareChildcare Survey 2019
Table 11 - Childcare sufficiency in Scotland (% local authorities)
Yes: in all areas
Yes: in some areas
No Data not held or cannot tell
Children under two 23% 29% 6% 42%Two year old 600 hours entitlement 55% 39% 0% 6%Three and four year old 600 hours entitlement 74% 19% 0% 6%5 to 11 year olds after school 10% 35% 10% 45%12 to 14 year olds after school 3% 16% 6% 74%Parents working full time 16% 32% 3% 48%Parents working atypical hours 6% 19% 10% 65%Disabled children 23% 16% 10% 52%Families living in rural areas 26% 30% 9% 35%
► Three quarters of local authorities report enough childcare for the three and four year old entitlement in all areas, compared to three per cent for the provision for 12 to 14 year olds after school.
► The younger age groups generally have greater sufficiency compared to the older children. For example, between 23 and 74 per cent have enough childcare in all areas for under five year olds, compared to 3 and 10 per cent for children aged over five.
Sufficiency rates for the funded childcare in Scotland has shown some changes since 2018. However, because Scotland has relatively few local authorities (32, compared to 152 in England) changes in responses from a few authorities can make a noticeable difference to the overall figures.
Table 12 - Childcare sufficiency defined as ‘Yes, in all areas’ in Scotland, for 2018 and 2019 (% local authorities)
2018 2019Children under two 24% 23%Two year old 600 hours entitlement 62% 55%Three and four year old 600 hours entitlement 86% 74%5 to 11 year olds after school 10% 10%12 to 14 year olds after school 0% 3%Parents working full time 11% 16%Parents working atypical hours 0% 6%Disabled children 10% 23%Families living in rural areas 11% 26%

22Coram Family and ChildcareChildcare Survey 2019
There has been a notable decrease in sufficiency in all areas since 2018 for those in receipt of the funded entitlements. For example, the provision of the three and four year old entitlement decreased from 86 per cent in 2018 to 74 per cent in 2019. By contrast, sufficiency in all areas for disabled children has increased from 10 per cent in 2018 to 23 per cent in 2019.
D. Childcare sufficiency in Wales Welsh local authorities were required to produce a statutory five-yearly Childcare Sufficiency Assessment in 2017. Over the last two survey years, the proportion of local authorities answering saying that they do not know whether they have enough childcare has reduced: it is now broadly equivalent to England.
Sufficiency for the three and four year olds using the universal funded entitlement is broadly similar to England, but lower than in Scotland. Sufficiency for the Flying Start entitlement is higher than for the two year old scheme in England, and about the same as in Scotland – but the schemes are not strictly equivalent because Flying Start entitlement is based on area, whereas the English and Scottish offers are based on individual family circumstances (for more details on the differences between the funded offers, see the glossary table).
Table 13 - Childcare sufficiency in Wales (% local authorities)
Yes: in all areas
Yes: in some areas
No Data not held or cannot tell
Children under two 23% 64% 5% 9%Flying Start areas 59% 36% 0% 5%Three and four year old universal entitlement 57% 38% 0% 5%Three and four year old 30 hours entitlement 33% 53% 0% 13%5 to 11 year olds after school 24% 57% 14% 5%12 to 14 year olds after school 5% 19% 29% 48%Parents working full time 43% 43% 10% 5%Parents working atypical hours 10% 48% 38% 5%Disabled children 10% 43% 33% 14%Families living in rural areas 12% 59% 24% 6%
► The Flying Start areas show the highest levels of sufficiency with 59 per cent of local authorities responding as ‘Yes: in all areas’, compared to five per cent of provision for 12 to 14 year olds.
► There are also significant shortages for disabled children and parents working atypical hours with just 10 per cent of local authorities reporting enough childcare in all areas.
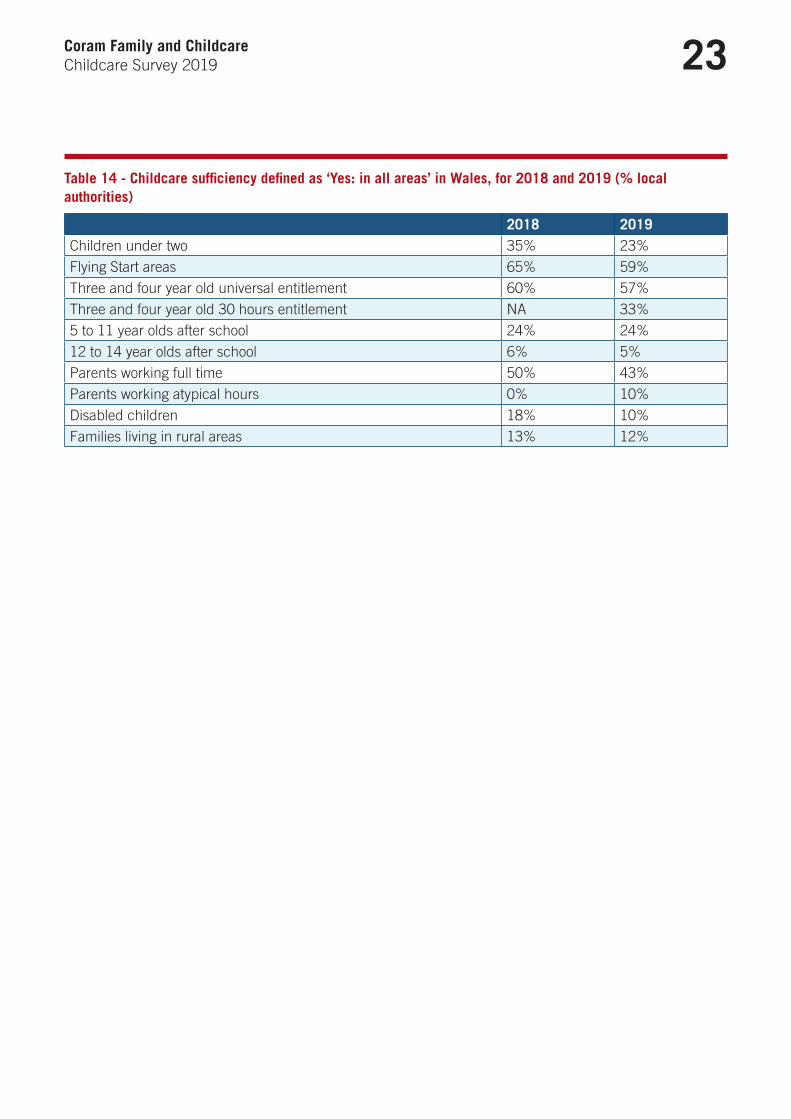
Reported sufficiency in Wales has reduced or stayed at the same level with the exception of increased sufficiency for parents working atypical hours. For example, sufficiency in all areas for Flying Start reduced from 65 per cent of local authorities in 2018 to 59 per cent in 2019. The largest reduction was seen for children under two, which decreased from 35 per cent in 2018 to 23 per cent in 2019. There is no data available on sufficiency for the 30 hours entitlement for 2018 as the policy was still at pilot stage then.
23Coram Family and ChildcareChildcare Survey 2019
Table 14 - Childcare sufficiency defined as ‘Yes: in all areas’ in Wales, for 2018 and 2019 (% local authorities)
2018 2019Children under two 35% 23%Flying Start areas 65% 59%Three and four year old universal entitlement 60% 57%Three and four year old 30 hours entitlement NA 33%5 to 11 year olds after school 24% 24%12 to 14 year olds after school 6% 5%Parents working full time 50% 43%Parents working atypical hours 0% 10%Disabled children 18% 10%Families living in rural areas 13% 12%
24Coram Family and ChildcareChildcare Survey 2019
Section 3 – 30 hours extended entitlement2017 saw the introduction of two key new childcare initiatives: the 30 hours extended entitlement for working parents of three and four year olds in England, and Tax Free Childcare across the UK (see Glossary 2 and Introduction). The cumulative effect of these two policies is that government will pay a higher proportion of families’ childcare costs, particularly in the early years. While the schemes were introduced at the same time, making it hard to separate out the difference each of them have made, uptake of the 30 hours extended entitlement has been much higher meaning it is likely to have had a more significant impact: in the autumn term 2018 there were around 240,000 three and four year olds taking up 30 hours compared to just under 75,000 children with an active Tax Free Childcare account.
Both policies are still in the early stages and so we are yet to see their full impacts, particularly any effects they might have on parental employment. Many childcare providers are likely to still be adjusting their business models as demand for 30 hours becomes clearer and they balance charges made to parents for additional services or hours of childcare with government funding for the funded entitlements. The level of funding that childcare providers receive for the funded entitlements is crucial for making these calculations. Funding rates for funded entitlements for three and four year olds were reviewed in 2015 and the new Early Years National Funding Formula was introduced in 2017. Despite rises to the minimum wage, introduction of pension auto-enrolment and general inflation, these funding rates have not increased since then and it is unclear when they will next be reviewed. If childcare providers find that these funding rates do not cover their costs for delivering childcare, they are likely to either have to reduce costs, with potentially detrimental impacts on the quality of the childcare they are providing, or recoup losses through charges to parents for additional services or hours of childcare – both of which will have a detrimental impact on parents and children.
Providers are not obliged to offer the 30 hours extended entitlement, although there may be commercial pressure on them to do so as parents are likely to consider cost when choosing childcare providers. We asked local authorities what proportion of providers in their area offered the 30 hours extended for at least some children and about the impact it was having on childcare locally. (In some cases, providers may offer the 30 hours entitlement but have a limited number of places for it.) This data was collected as part of our main survey, which was in the field between November 2018 and January 2019.
A. Provision of the 30 hours extended entitlement Most local authorities were able to tell us about the proportion of providers offering the 30 hours extended entitlement. We have weighted their responses to reflect the number of different types of provider in their area, according to Ofsted registrations.6 These are shown in Table 15, which have a number of notable variations in provision.
6 Note that weightings in this section are different to other weightings in our survey, which are based on child population. PVI providers and nurseries are taken from the Early Years Register, and nursery classes and maintained nursery schools from the Schools Register, which was filtered to exclude schools which do not have any early years provision.

25Coram Family and ChildcareChildcare Survey 2019
Table 15 - Proportion of providers offering the 30 hours extended entitlement, England
2018 2019Maintained nurseries 81% 97%School nursery classes 57% 62%PVI nurseries 82% 86%Childminders 53% 60%
► Almost all maintained nurseries and nearly nine out of 10 PVI nurseries offer the 30 hours extended entitlement.
► Six out of 10 childminders offer the 30 hours extended entitlement. This lower proportion could be explained by the smaller number of children looked after by childminders meaning that the 30 hours offer is not as relevant to them as they are only looking after school children or children under three. PACEY have also raised concerns that regulations for the 30 hours offer make it harder for childminders to offer (Kalitowski, 2018).
► Just over six out of 10 school nursery classes offer the 30 hours extended entitlement. School leaders have raised concerns about funding levels for 30 hours (NAHT, 2018)
► Overall, 62 per cent of local authorities in England had sufficient childcare for the 30 hours extended entitlement when they reported between November 2018 and January 2019 – lower than the 74 per cent who have sufficient childcare for children (aged 3 to 4) on the 15 hour entitlement (see Table 7 in Section 2).
B. Local authorities’ views about the 30 hours extended entitlement We asked English local authorities about their experience of the 30 hours extended entitlement and the difference it is making. As shown in Chart 1, most are either unsure about the impact of the offer on prices or report no impact. Where there is evidence of an impact on prices (discounting the ‘Don’t knows’ and ‘No impact’), the results tend to show more of a negative rather than positive impact (indicative of a price rise). Local authorities are more likely to report a price rise for three to four year olds outside of funded entitlements (26 per cent) compared to prices for two year olds and under (14 per cent).
Chart 1 - Local authority views on current impact of the 30 hours extended entitlement on childcare prices
Prices for 3 and 4 year olds outsidethe funded entitlements 39%26%29%7%
Prices for 2 year olds and under 38%14%46%1%
Positive impact No impact Negative impact Don’t know

26Coram Family and ChildcareChildcare Survey 2019
In general, local authorities have not seen much impact from the funded entitlement on childcare availability, with between 46 per cent and 61 per cent reporting no impact (Chart 2). However, nearly one in five local authorities are concerned that there are fewer places available for two year olds entitled to 15 hours. Local authorities are most likely to be unsure about the impact of 30 hours on availability of childcare for children with SEND – this will need to continue to be monitored carefully.
Chart 2 - Local authority views on current impact of the 30 hours extended entitlement on childcare availability
0% 20% 40% 60% 80% 100%
Availability for 2s entitled to 15 hours
Availability for children with SEND
Availability for 3-4s entitled to 15 hours
Availability for 2s and under outside
Positive impact No impact Negative impact Don’t know
15%20%61%4%
41%6% 6%46%
21%6%64%9%
31%5%62%2%
Local authorities are less optimistic (more of a negative rather than positive impact) about the financial sustainability of childcare providers following the introduction of the 30 hours extended entitlement (Chart 3). Thirty-six per cent of local authorities view this as having a negative impact on the financial sustainability of childcare providers compared to six per cent viewing this as having a positive impact.
Chart 3 - Local authority views on the current impact of the 30 hours extended entitlement on the financial sustainability of settings
Financial sustainability of childcare providers 42%36%16%6%
Positive impact No impact Negative impact Don’t know
Local authorities were also asked to consider how the 30 hours extended entitlement may make a difference in their local area, in the future (Chart 4). Overall, these results are the most positive views reported by the local authorities. In terms of the attainment gap between disadvantaged children and their peers, 30 per cent view this as having a positive impact although 17 per cent also see this as a negative impact. In terms of the quality of early education and childcare, 28 per cent report a positive impact and only five per cent see this as having a negative impact.

27Coram Family and ChildcareChildcare Survey 2019
Chart 4 - Local authority views on future impact of the 30 hours extended entitlement
Attainment gap between disadvantagedchildren and their peers 39%30% 17%13%
Quality of early education and childcare 27%5%41%28%
Positive impact No impact Negative impact Don’t know
Government guidance on the 30 hours extended entitlement states that it must be offered for free but parents may be charged for extras (such as lunch) as long as they have the option to say no to these. There has been significant discussion about what extras providers can charge for and whether these are truly optional, and there have been some reports of charges for lunch which appear higher than the cost of food and staff time for preparation. We asked local authorities about the proportion of childcare providers who are making additional charges, excluding for optional additional hours. Local authorities were considerably less likely to provide data for this question meaning that we must treat these findings with caution. Of those that did answer, around two thirds of childcare providers were making additional charges across different types of providers.
Table 16 – Proportion of providers offering 30 hours extended entitlement who are making additional charges, excluding charging for optional additional hours, England
% making additional charges
% of settings for whom we have data
Maintained nurseries (incl. nursery classes in schools) 64% 16%PVI (private, voluntary and independent) nurseries 69% 23%Childminders 64% 21%
Some providers are also requiring that the 30 hours extended entitlement must be taken as the same number of hours every day, or only on certain days of the week. This may mean that parents who do not use childcare for full days every weekday cannot use their entitlement in full. These factors may increase the actual cost of childcare for families using the 30 hours extended entitlement, and they are not captured in our survey.
We asked local authorities to share any comments on the 30 hours offer and any examples of childcare providers making additional charges to parents who use it. Some local authorities shared positive experiences, such as one in London where several schools are waiving charges for additional hours for children who are not entitled to the 30 hours offer because they feel that these are the children who most need places. Or the local authority in the North West where providers have begun working in greater collaboration with one another to offer parents to ‘stretch’ the 30 hours offer over two or more settings.
28Coram Family and ChildcareChildcare Survey 2019
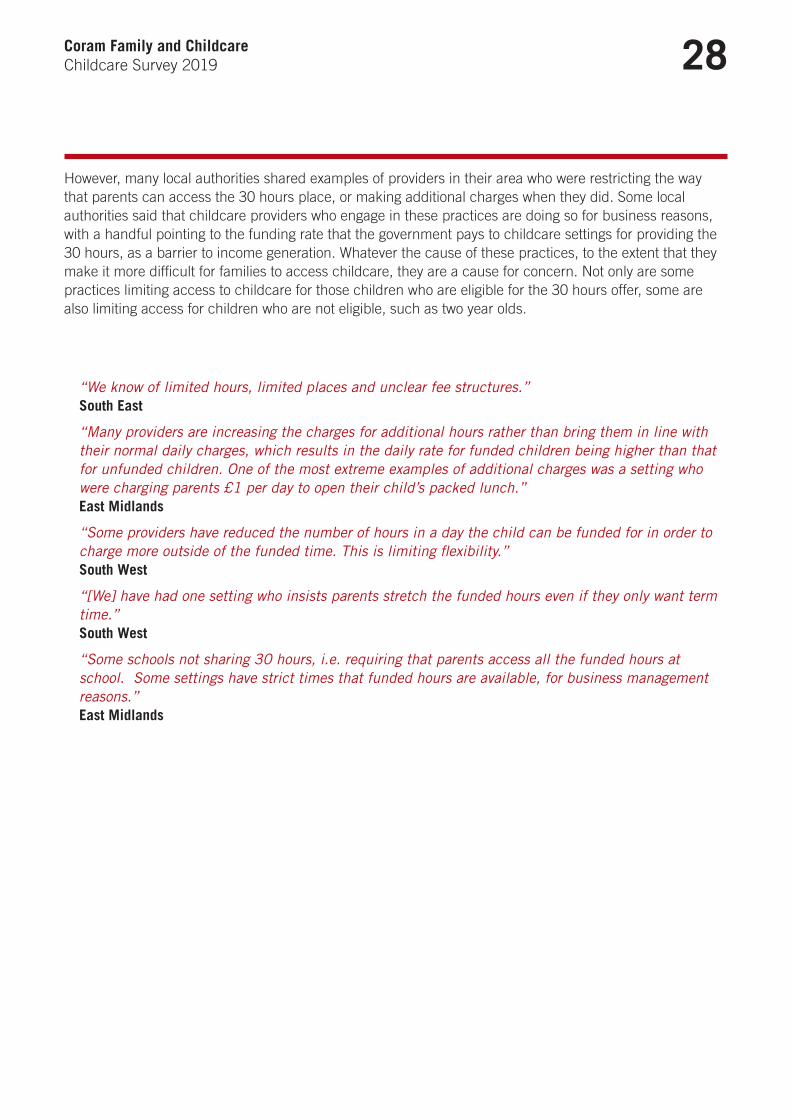
However, many local authorities shared examples of providers in their area who were restricting the way that parents can access the 30 hours place, or making additional charges when they did. Some local authorities said that childcare providers who engage in these practices are doing so for business reasons, with a handful pointing to the funding rate that the government pays to childcare settings for providing the 30 hours, as a barrier to income generation. Whatever the cause of these practices, to the extent that they make it more difficult for families to access childcare, they are a cause for concern. Not only are some practices limiting access to childcare for those children who are eligible for the 30 hours offer, some are also limiting access for children who are not eligible, such as two year olds.
“We know of limited hours, limited places and unclear fee structures.” South East
“Many providers are increasing the charges for additional hours rather than bring them in line with their normal daily charges, which results in the daily rate for funded children being higher than that for unfunded children. One of the most extreme examples of additional charges was a setting who were charging parents £1 per day to open their child’s packed lunch.” East Midlands
“Some providers have reduced the number of hours in a day the child can be funded for in order to charge more outside of the funded time. This is limiting flexibility.” South West
“[We] have had one setting who insists parents stretch the funded hours even if they only want term time.” South West
“Some schools not sharing 30 hours, i.e. requiring that parents access all the funded hours at school. Some settings have strict times that funded hours are available, for business management reasons.” East Midlands

29Coram Family and ChildcareChildcare Survey 2019
Conclusion
While additional government investment in childcare is welcomed by the families that are benefitting from it, these savings could be short-lived as we once again see above inflation price rises. The complexity of the childcare system also means many parents are missing out on the support they are entitled to and view childcare costs as an insurmountable barrier to work. While there have been some improvements in the sufficiency of childcare, we have once again found the same persistent shortages in parts of the childcare market, including children with SEND, parents working atypical hours and older children. Until childcare becomes easier to find and afford, children will continue to miss out on the benefits of high quality early education and parents will continue to be frozen out of work.
Childcare enables parents to work, keeping valuable skills in the workforce, and helps children do better at school, which can narrow the gap between disadvantaged children and their peers. Action is needed to make sure that every family is able to access high quality childcare that boosts children’s development and enables parents to work.
Government should develop a childcare strategy and reform all current spend on childcare to create a simple and efficient system that makes sure all parents are better off working, encourages quality improvement and promotes child development.
An ambitious strategy and reform will take time. In the shorter term, there are actions that can be taken to improve provision. We call on Scottish, Welsh and UK governments to:
► Make sure every parent is better off working after paying for childcare. This includes increasing the maximum amount of childcare costs paid for under Universal Credit and moving to upfront payments for childcare to make it possible for parents to move into work.
► Make sure there is enough childcare available for all families, prioritising the families currently most likely to miss out, including disabled children, parents working outside the typical 9 to 5 and older children. This should include start up grants for childcare providers.
► Regularly review the funding rate for early years entitlements to make sure that they meet the cost of delivering high quality childcare.
► Help parents to improve their skills and employability by extending the 30 hours entitlement for three and four year olds to families where parents are in training.
► Improve access to early education for disadvantaged children by doubling the early years pupil premium.
► Monitor what effect new funding (Tax Free Childcare and 30 hours) is having on childcare prices and whether it is helping parents into work and narrowing the achievement gap. This should consider how current spend could be reallocated to better meet the needs of disadvantaged and low income children, including current underspend of the Tax Free Childcare budget.

30Coram Family and ChildcareChildcare Survey 2019
References
Department for Education (2018). Childcare and Early Years Survey of Parents in England, 2018. DfE: London.
Kalitowski, S., (2018), 30 hours: one year on (Bromley: PACEY)
NAHT (2018) 30 Hours – Policy in Practice. [Online] Available at: www.naht.org.uk/news-and-opinion/news/leadership-news/30-hours-free-childcare-offer-risks-impacting-quality-of-early-years-education/
Office for National Statistics (2019) Dataset: Components of household expenditure: Table A1. [Online] Available at: www.ons.gov.uk/peoplepopulationandcommunity/personalandhouseholdfinances/expenditure/datasets/componentsofhouseholdexpenditureuktablea1

31Coram Family and ChildcareChildcare Survey 2019
APPENDIX – Methodology
Note on tables: Percentages in all tables may not add up to 100 per cent due to rounding.
TimescalesThis report is based on surveys sent to all Family Information Services at local authorities in November 2018. Respondents were able to fill in a form or reply online. After a month, we sent Freedom of Information requests to those local authorities which had not responded. The questions about the impact of the 30 hours entitlement in England were not included in the Freedom of Information requests. The deadline for Freedom of Information requests was in late January.
Authorities who responded without the need for a Freedom of Information request were promised that individual responses would not be published, with only regional/national averages provided in the report. This is consistent with previous surveys, and we do it to encourage honest and accurate data reporting. When Freedom of Information requests are used, some local authorities automatically publish their own responses, so we cannot make the same promise. However, we do not report these Freedom of Information individual responses in this report, and nor do we say which responses were acquired through Freedom of Information requests and which through surveys.
Data sourcesAverage, maximum and minimum childcare prices are provided by local authorities rather than being calculated by Coram Family and Childcare from information directly from providers. Similarly, assessments of sufficiency are provided by local authorities rather than being based on data collected by the Coram Family and Childcare research team.
Where possible, we have kept questions consistent with previous versions of the survey to allow for tracking over time. However, we have made some changes to reflect the changing policy environment and in response to feedback from both survey respondents and organisations who use the data. We used slightly different surveys for local authorities in England, Scotland and Wales to reflect the different policy environments in the three nations.
Response ratesWe received responses from 94 per cent of local authorities. The lowest response rate for any region was 85 per cent. Some local authorities did not give data for all questions, or gave data in a format that we could not use. The effective response rate for the price questions was therefore between 75 per cent and 82 per cent of all local authorities, with the exception of the question about after-school childminders, for which it was 64 per cent. The response rate for the questions on 30 hours impact, which were only asked of English local authorities, was 65 per cent. The question about providers offering 30 hours making additional charges, also only asked of English local authorities, had a response rate of 39 per cent. This is in part because these questions were not subject to Freedom of Information requests.
32Coram Family and ChildcareChildcare Survey 2019
WeightingIn line with recent surveys, we have weighted cost data within regions and nations. This ensures that results from small local authorities which have relatively little childcare do not unduly influence overall results. Data on pre-school childcare is weighted against the 0-4 population based on ONS mid-year population estimates, and data for school-age childcare is weighted against the 5-11 population. Within local authorities, we have weighted cost data for PVI and maintained setting providers against the number of providers in that area. This is based on an assumption that the types of settings will have the same number of children on average. Childminder cost data is presented separately and not as part of the local weighted average for non-domestic settings. This is because of difficulties accurately estimating the number of children using childminders as opposed to non-domestic settings on a local level, and the unique role childminders play in the market. We used a slightly different method for weighting the responses on availability of the 30 hours extended entitlement – this is described in Section 2.
Tracking change over timeOur comparison does not include any use of childcare subsidies through Tax Free Childcare or the benefits system.
When comparing prices over time, we have only included local authorities where we have data for both 2018 and 2019. This is to avoid results being skewed by different local authorities having missing data year-on-year. Where we saw unusually large increases or decreases, we checked with local authorities if there had been errors in the data they gave us or our interpretation of it.
Changes are weighted against this year’s population data as described above. This approach produces slightly different results to comparing regional weighted prices from the 2018 survey to regional weighted prices in the 2019 survey – we believe it gives a more accurate reflection of the changes experienced by families.
Data we do not collectWe do not collect data on the costs and availability of nannies and au pairs. This is because this data is not held by local authorities, and because they are used by a very small proportion of the population. Necessarily, the survey also excludes all types of informal childcare (e.g. grandparents, friends, babysitters). Information on families’ use of formal and informal childcare can be found in the Department for Education’s report series Childcare and Early Years Survey of Parents – the latest edition is for 2018. We exclude Northern Ireland because the childcare funding system is very different, making it hard to draw direct comparisons.