Embed Size (px)
Citation preview
1 | P a g e
CHILD
IMMUNIZATION
IN INDIA ……
towards a healthy future!
2 | P a g e
TABLE OF CONTENTS
TOPIC PAGE NO. 1. ACKNOWLEDGEMENT
2. ABSTRACT
3. INTRODUCTION
4. ANALYSIS
5. RESULTS
6. POLICY PRESCRIPTIONS
7. CONCLUSION
8. BIBLIOGRAPHY
9. APPENDIX
3 | P a g e
LIST OF TABLES
• Table 1 is showing correlation between Infant mortality rate(IMR) ,under five mortality rate( U5MR) and full vaccination coverage.
• Table 2 is showing trends of differential rankings of all states of India in NFHS. • Table 3 is showing the regression results when U5MR is regressed on full
immunization coverage, proper sanitation facility, incidence of malnutrition and availability of safe drinking water.
• Table 4 is showing regression results when full immunization is regressed on per capita spending by state government on health,per capita state GDP and female illiteracy rate.
LIST OF FIGURES • Figure 1 is showing the trend of U5MR of India and its states in three rounds of NFHS • Figure 2 is showing the trend of full immunization coverage of India and its states in
three rounds of NFHS. • Figure 3 is showing the ranks of India and its states in three rounds of NFHS according to
differential ranking methodology. • Figure 4 is showing ratio of full vaccination to none vaccination of all states in three
rounds of NFHS. • Figure 5,6,7,8,9,10,11 are showing ratio of male& female, urban &rural, illiterate &HS
and above, birth order 1& above 6,SC &ST, hindu &muslim, hindu & Christian respectively in different vaccination coverage in 3 rounds of NFHS.
4 | P a g e
ACKNOWLEDGEMENT
Our project on “CHILD IMMUNIZATION IN INDIA- towards a healthy future” is the realization of the untiring effort of many people and we are highly indebted to all of them. At this moment we mention the name of our project advisor Prof. Arijita Dutta (Department of Economics, Calcutta University) for her encouragement, support and important suggestions during the project.We specially thank Prof. Mousumi Dutta (Department of Economics, Presidency University) and Prof. Arpita Dhar (Department of Economics, Jadavpur University) for their expertise that helped us immensely. We are very grateful to Prof. Mahalaya Chatterjee (Head of the Department, Department of Economics, University of Calcutta) and all other faculty and staff for their support and help. Moreover, we would like to extend our gratitude to the University of Calcutta for giving us the opportunity to present this project. Doing this project was an enjoyable and learning experience for us.
5 | P a g e
ABSTRACT
In context of India we see that the determining variables for the likelihood of each child being immunized are maternal literacy status, caste/religion, household assets, income and poverty, female empowerment, region and parental occupation. Children belonging to non-poor households, literate mothers fare much better than those belonging to poor households and illiterate mothers. The reasons are “fear of an adverse reaction” non-availability of vaccines and poor organization, availability and price of food, in particular milk. In summary the issue of ‘children’s neglect’ in India is multi faceted. There are the wide differences in levels and distribution of childhood immunization between and within Indian states. At the national level, we find major improvements in outreach in urban and rural areas with a clear drop in the percentage of children that received no immunization, but full immunization rates are almost stagnant. Differential policy efforts between states are therefore likely to have played an important role in promoting immunization. In India, a large number of children who have contact with services providers are missed out of subsequent services of BCG, DPT, Polio and Measles vaccine. The extent of complete vaccination is the lowest in Nagaland (13 %) and highest in Tamil Nadu (91 %.).Uttarakhand has not reached the goal of universal immunization coverage despite a focused and intense immunization programme since 1985. The main constraints are lack of attention to routine immunization.
The socio-economic and demographic factors reveal that boys are more likely to be immunized than girl children. Children of higher order births and rural areas are less likely to be vaccinated. The likelihood of vaccination increases with mothers’ education level. Among the religious group Christian children are most likely to be immunized followed by Hindus and then Muslims. Children from household with electricity are more likely to be immunized. Compared to general caste children, OBCs are least likely to be immunized followed by SCs and STs. The country’s goal to achieve a U5MR of less than 100 per 1000 live-births and reducing the IMR to less than 60 per 1000 live-births by the year 2000 could not be achieved despite improved interventions and an increase in the overall resources. Fertility rate and socioeconomic conditions also vary greatly from state to state in India. States with a large decline of under-five mortality also experienced a large decline in the total fertility rate (average decline of 1.1 children per woman), and an increase in coverage of childhood immunizations (average of 9.5 per cent increase) and vice versa. Thus, the state level variations in the decline of under-five mortality during the six-year period between 1992-93 and 1998-99 can be explained mostly by variations in the decline of fertility and increases in immunizations against childhood diseases.
6 | P a g e
INTRODUCTION
Immunization is a preventive health care service which is the birth right of every child. The word “immune” is a Greek word, which means to be protected. Strong immunization system is important because it protects children from various diseases and disabilities. It is also the most cost effective health instrument for the public and it is also the birth right of every child to get a better future.
Early Origin
During the latter half of the 19th century, when institutions for vaccine development and production were taking root in the Western world, the British rulers in India, concerned by the large number of their personnel dying from tropical diseases, promoted research on these diseases and established various institutes. But due to factors like the pressures of routine production and service functions, financial constraints, lack of institutional mechanisms to foster and link up research and technology development, and the absence of interdisciplinary approach India’s vaccine development efforts were under threat.
India’s current stands on Vaccination Immunization is a key intervention to support the Millennium Development Goals of Child Mortality (MDG4) by protecting children from life threatening conditions and enhancing the child’s survival beyond infancy. The immunization programme forms a cornerstone of the strategy to reach MDG4 through the Reproductive and Child Health (RCH) programme of the Government of India. Begun in 1978, immunization was universalized in 1985 through the Universal Immunization Programme (UIP). The UIP has envisaged achieving and sustaining universal immunization coverage among infants with three doses of DPT and OPV and one dose each of measles vaccine and BCG, and with two primary doses or one booster dose of TT among pregnant women. Intensified polio eradication activities began in 1995 under the Polio Eradication Programme. A National Technical Advisory Group on Immunization was set up in 2001 and a UIP Review conducted in 2004; based on its findings and recommendations, India has prepared a country Multi-Year Plan for Immunization (cMYP 2005-10). Immunization continues to be implemented as an important element of the RCH programme under the overarching managerial framework of the National Rural Health Mission (NRHM). Although health care is a state subject under the Indian Constitution, the central government scheme provides full support to the UIP in order to ensure effective, equitable and safe immunization. Studies indicate that 90% of the immunization doses are delivered by public sector facilities.
7 | P a g e
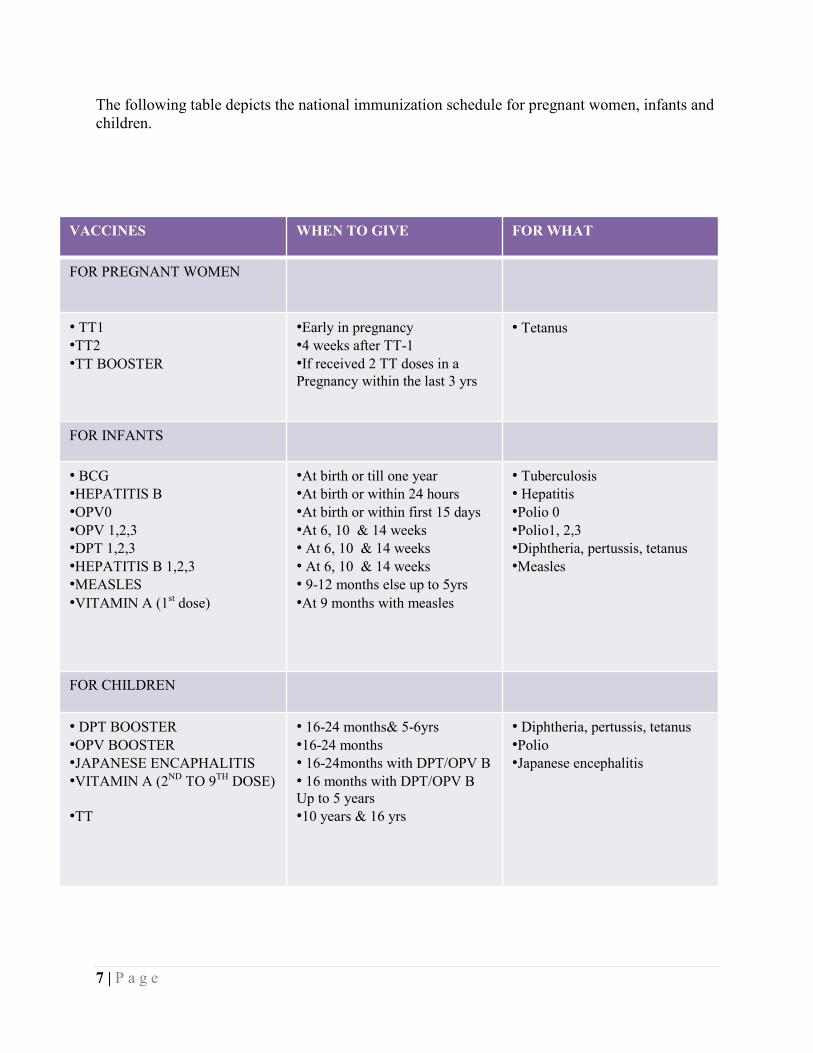
The following table depicts the national immunization schedule for pregnant women, infants and children.
VACCINES WHEN TO GIVE FOR WHAT
FOR PREGNANT WOMEN
• TT1 •TT2 •TT BOOSTER
•Early in pregnancy •4 weeks after TT-1 •If received 2 TT doses in a Pregnancy within the last 3 yrs
• Tetanus
FOR INFANTS
• BCG •HEPATITIS B •OPV0 •OPV 1,2,3 •DPT 1,2,3 •HEPATITIS B 1,2,3 •MEASLES •VITAMIN A (1st dose)
•At birth or till one year •At birth or within 24 hours •At birth or within first 15 days •At 6, 10 & 14 weeks • At 6, 10 & 14 weeks • At 6, 10 & 14 weeks • 9-12 months else up to 5yrs •At 9 months with measles
• Tuberculosis • Hepatitis •Polio 0 •Polio1, 2,3 •Diphtheria, pertussis, tetanus •Measles
FOR CHILDREN
• DPT BOOSTER •OPV BOOSTER •JAPANESE ENCAPHALITIS •VITAMIN A (2ND TO 9TH DOSE) •TT
• 16-24 months& 5-6yrs •16-24 months • 16-24months with DPT/OPV B • 16 months with DPT/OPV B Up to 5 years •10 years & 16 yrs
• Diphtheria, pertussis, tetanus •Polio •Japanese encephalitis
8 | P a g e
ANALYSIS
OBJECTIVES , DATA AND METHODOLOGY OF STUDY
The study has been classified into six research questions. The first four are descriptive data analysis while the last two are regression analysis. Research Question 1:
To see whether Infant Mortality Rate (IMR) or Under Five Mortality Rate (U5MR) better explains full vaccination in all Indian states. Methodology: Correlation Analysis. Data Source: Analyzed from National Family Health Survey (NFHS) 1, 2 and 3. Research Question 2: To rank the states according to the difference between full vaccination coverage and U5MR in percentage points. Methodology: Difference Ranking Index. Data Source: Analyzed from National Family Health Survey (NFHS) 1, 2 and 3. Research Question 3: Analyze and compare all the Indian states according to a ratio of full vaccination to none vaccination coverage. Methodology: Graphical Analysis (Line Diagram). Data Source: Analyzed from National Family Health Survey (NFHS) 1, 2 and 3.
9 | P a g e
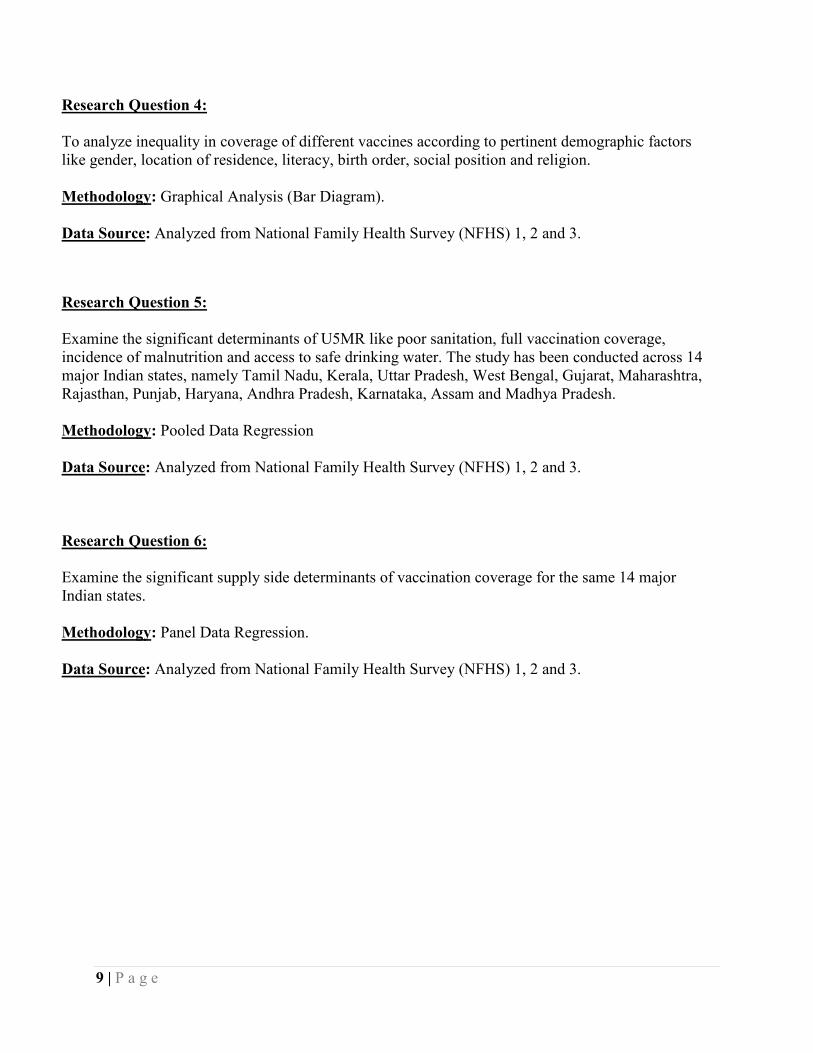
Research Question 4: To analyze inequality in coverage of different vaccines according to pertinent demographic factors like gender, location of residence, literacy, birth order, social position and religion. Methodology: Graphical Analysis (Bar Diagram). Data Source: Analyzed from National Family Health Survey (NFHS) 1, 2 and 3.
Research Question 5: Examine the significant determinants of U5MR like poor sanitation, full vaccination coverage, incidence of malnutrition and access to safe drinking water. The study has been conducted across 14 major Indian states, namely Tamil Nadu, Kerala, Uttar Pradesh, West Bengal, Gujarat, Maharashtra, Rajasthan, Punjab, Haryana, Andhra Pradesh, Karnataka, Assam and Madhya Pradesh. Methodology: Pooled Data Regression Data Source: Analyzed from National Family Health Survey (NFHS) 1, 2 and 3. Research Question 6: Examine the significant supply side determinants of vaccination coverage for the same 14 major Indian states. Methodology: Panel Data Regression. Data Source: Analyzed from National Family Health Survey (NFHS) 1, 2 and 3.
10 | P a g e
RESULTS
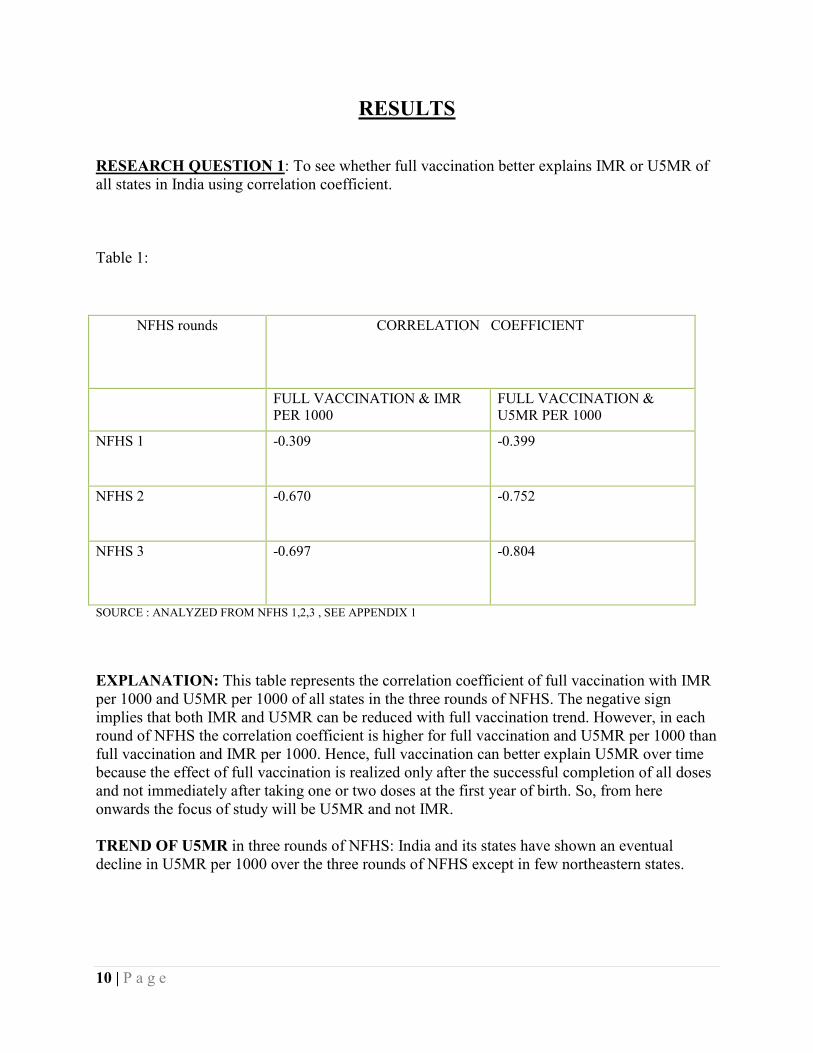
RESEARCH QUESTION 1: To see whether full vaccination better explains IMR or U5MR of all states in India using correlation coefficient. Table 1:
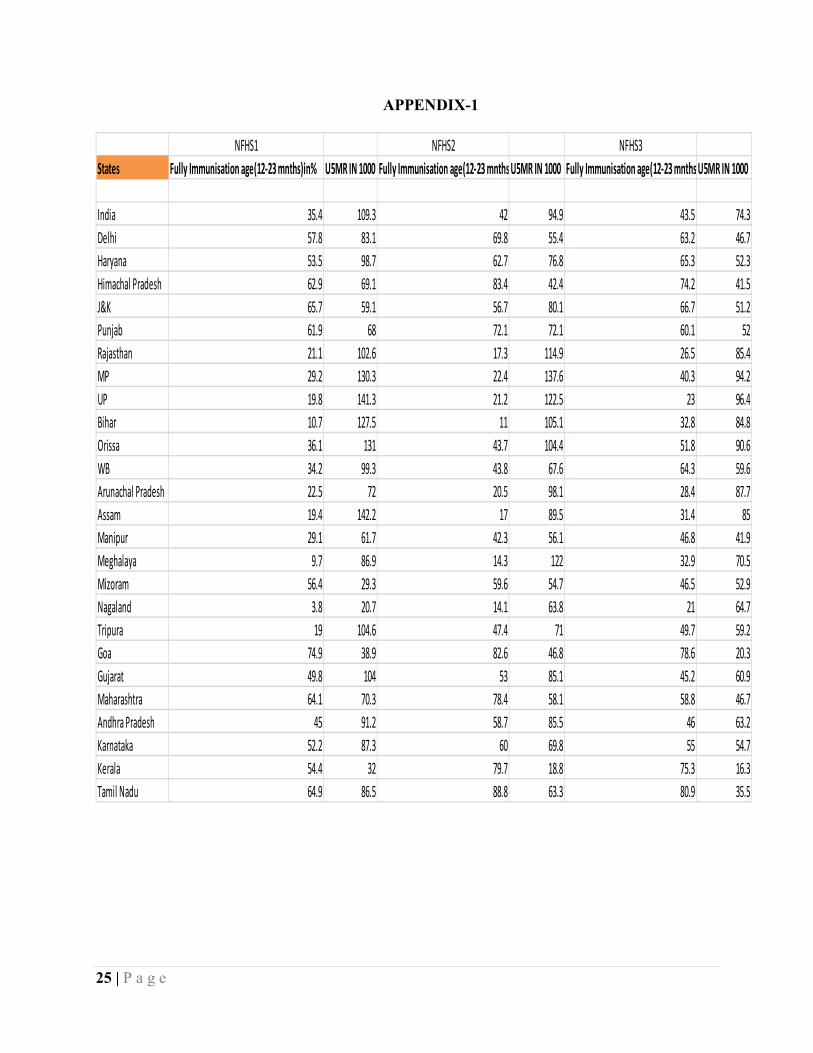
SOURCE : ANALYZED FROM NFHS 1,2,3 , SEE APPENDIX 1 EXPLANATION: This table represents the correlation coefficient of full vaccination with IMR per 1000 and U5MR per 1000 of all states in the three rounds of NFHS. The negative sign implies that both IMR and U5MR can be reduced with full vaccination trend. However, in each round of NFHS the correlation coefficient is higher for full vaccination and U5MR per 1000 than full vaccination and IMR per 1000. Hence, full vaccination can better explain U5MR over time because the effect of full vaccination is realized only after the successful completion of all doses and not immediately after taking one or two doses at the first year of birth. So, from here onwards the focus of study will be U5MR and not IMR. TREND OF U5MR in three rounds of NFHS: India and its states have shown an eventual decline in U5MR per 1000 over the three rounds of NFHS except in few northeastern states.
NFHS rounds CORRELATION COEFFICIENT
FULL VACCINATION & IMR PER 1000
FULL VACCINATION & U5MR PER 1000
NFHS 1 -0.309 -0.399
NFHS 2 -0.670 -0.752
NFHS 3 -0.697 -0.804
11 | P a g e
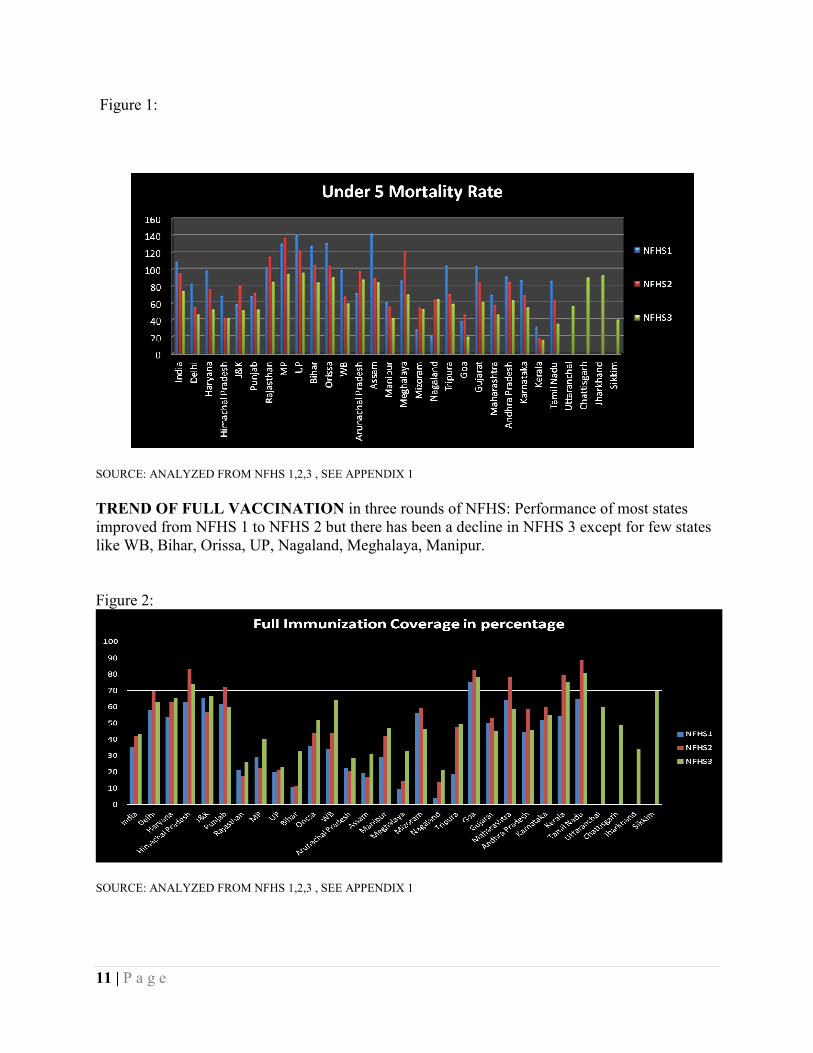
Figure 1:
SOURCE: ANALYZED FROM NFHS 1,2,3 , SEE APPENDIX 1 TREND OF FULL VACCINATION in three rounds of NFHS: Performance of most states improved from NFHS 1 to NFHS 2 but there has been a decline in NFHS 3 except for few states like WB, Bihar, Orissa, UP, Nagaland, Meghalaya, Manipur. Figure 2:
SOURCE: ANALYZED FROM NFHS 1,2,3 , SEE APPENDIX 1
12 | P a g e
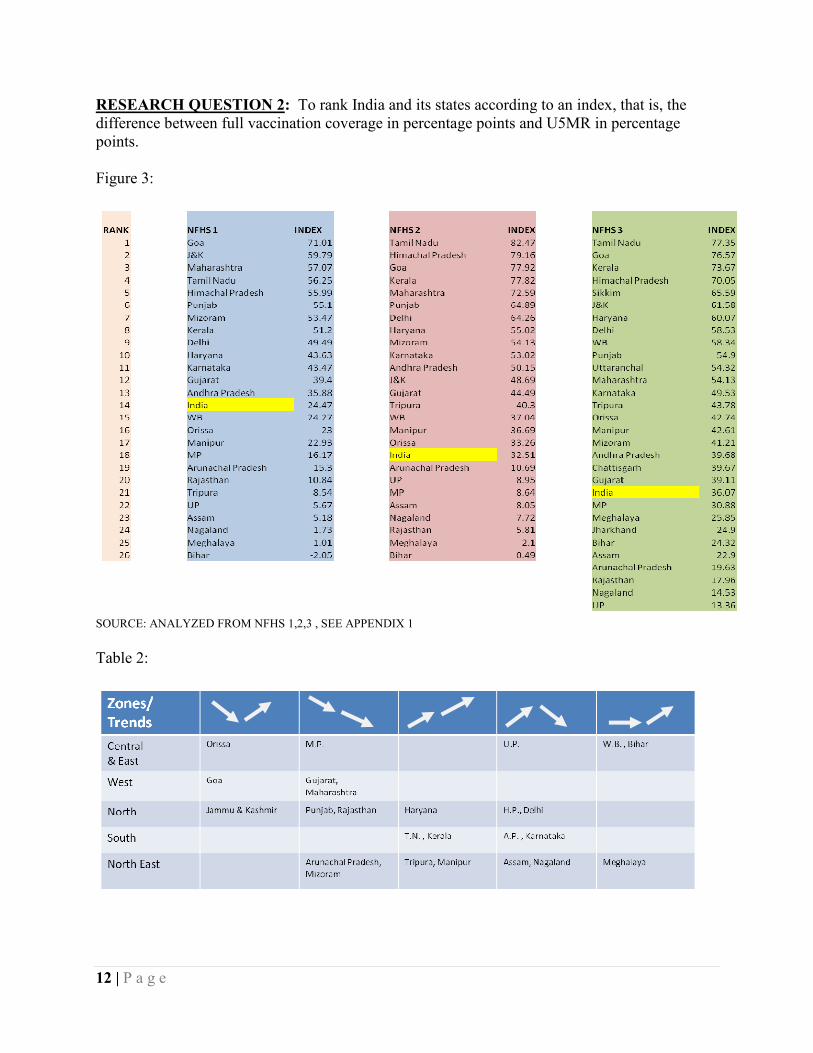
RESEARCH QUESTION 2: To rank India and its states according to an index, that is, the difference between full vaccination coverage in percentage points and U5MR in percentage points. Figure 3:
SOURCE: ANALYZED FROM NFHS 1,2,3 , SEE APPENDIX 1 Table 2:
13 | P a g e
EXPLANATION: Higher the rank poor is the performance. In Figure 3, we see, India kept attaining higher rank in each NFHS rounds. India was at 14th rank at NFHS 1, which went down to 18th in NFHS 2, and finally in NFHS 3 the rank is 21st. The reason behind poor performance is that states like MP, UP, Assam, Bihar consist of one-third of total population of the country and these states at the same time have a very low coverage in full vaccination, hence, pulling down the national average. From Table 2, we see, the concentration of most states in downward trend (3rd and 5th column), which further explains the poor performance of India. In Figure 3, Bihar is the only state that shows a negative value of Index in NFHS 1 and positioned the last rank. The reason being under five mortality rates higher than full vaccination coverage. However in third round of NFHS, Bihar improved its performance in vaccination coverage marginally after Jharkhand was separated as another state from Bihar. West Bengal is a state that improved its performance in vaccination coverage tremendously in third round of NFHS especially in the coverage of measles (82.2%) and BCG (96.2%). Also there was a set up of West Bengal State Immunization Support Cell with assistance from UNICEF. Gujarat is one of the developed states having very high state GDP. However, it falls in the declining trend region as it has mostly focused on industrial infrastructure than health care. Tamil Nadu and Goa have measles coverage greater than 90% as these states have high media coverage. States like Nagaland, Up, Rajasthan, Assam, Arunachal Pradesh have less than one-third children vaccinated leading to high U5MR.
14 | P a g e
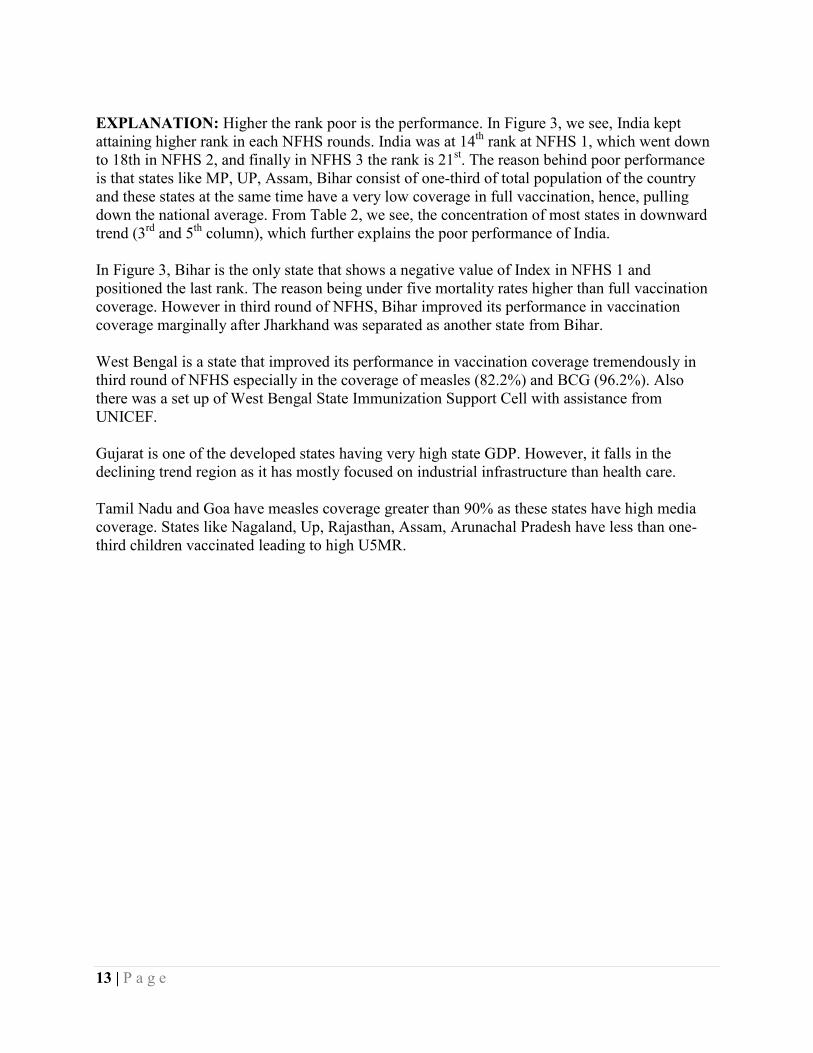
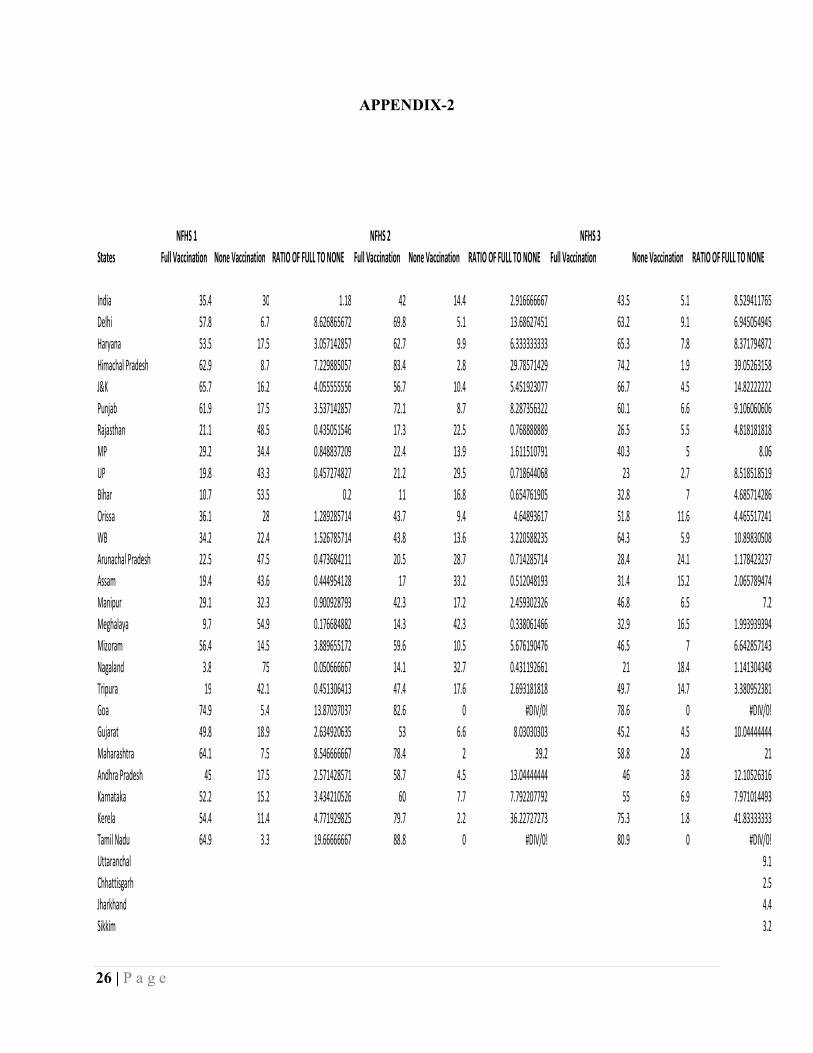
RESEARCH QUESTION 3: Graphically analyze the ratio of full vaccination to none vaccination in all states in three rounds of NFHS. Figure 4:
SOURCE: ANALYZED FROM NFHS 1,2,3 , SEE APPENDIX 2 EXPLANTION: It has been seen that there has been a remarkable improvement in performance from NHFS 1 to NFHS 2 but only a marginal improvement in NFHS 3.The reason being Limited coverage of full vaccination between NFHS 2 and NFHS 3 and non-continuity of children from getting third dos of DPT and measles. For Goa and Tamil Nadu, no bar has been plotted for NFHS 2 and NFHS 3 because both the state reached zero none vaccination, hence ratio couldn’t be found. These states represent the best performance in full vaccination coverage. In north block, all states except Rajasthan has performed well. Himachal Pradesh is the best performing state in this block having BCG coverage, initial dose of DPT and Polio greater than 90% and in some cases achieving universal immunization. In Central & East block, there is remarkable improvement in NFHS 3 than in NFHS 2 as the states in this block saw a higher rate of fall in none vaccination than the same rate of increase in full vaccination leading to a high ratio. The northeastern block is the poorly performing block compared to other blocks of the country. The reason being geographically isolated, accessibility is less. The West and South are the best performing blocks except for Maharashtra, which has shown a decline in performance in third round of NFHS because it experienced a tremendous increase in
NORTH CENTRAL & EAST
NORTH EAST
WEST SOUTH
15 | P a g e
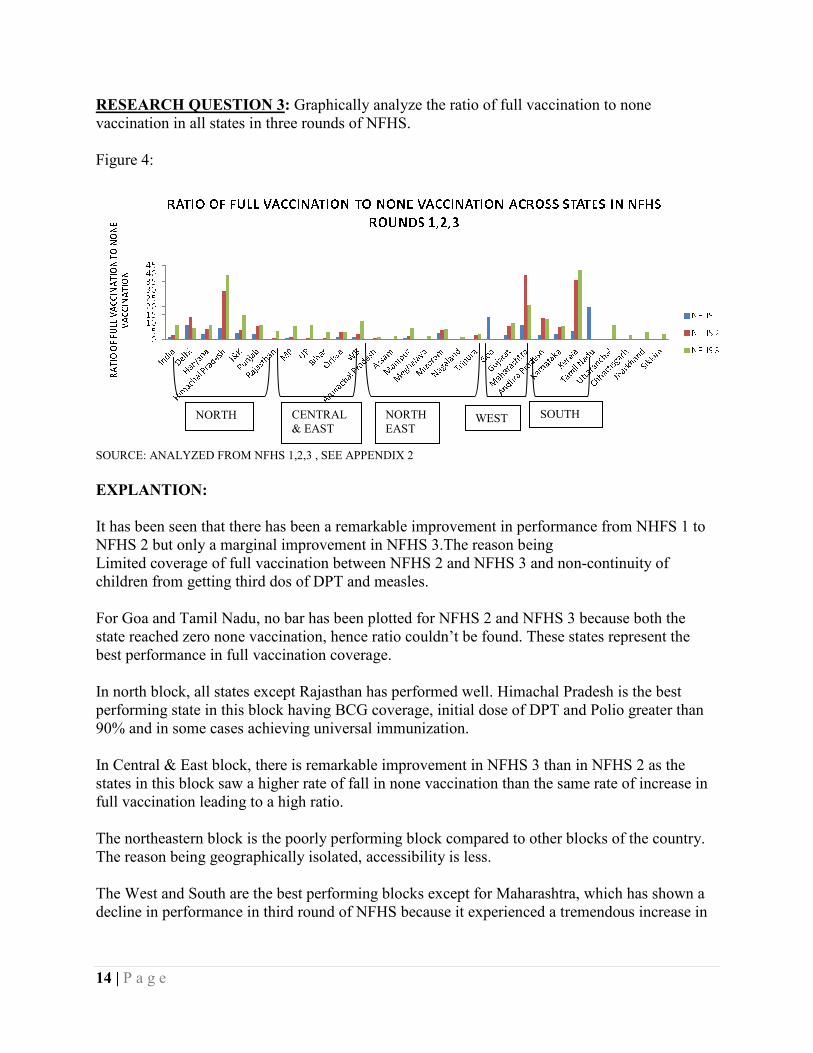
migrants from other states, which is further increasing slum areas where health care accessibility is almost nil. RESEARCH QUESTION 4: To analyze the inequality in vaccination coverage taking the ratio of vaccination coverage f male-female, urban-rural, illiterate and HS above, birth order1-6+, SC-ST, Hindu-Muslim and Hindu-Christian. Value closer to 1 in the following diagrams represents an equal situation while any deviation from it represents an unequal situation. Figure 5 and 6: SOURCE: ANALYZED FROM NFHS 1,2,3 , SEE APPENDIX 3 EXPLANATION: In the male-female graph, a male biased picture is seen towards receiving vaccination. However, there is a slight drop in inequality from NFHS 1 to NFHS 2 but again there is a rise in NFHS 3.The main reason behind this is that discrimination against girl child increased during this phase. In case of non-vaccination, the analysis is same but inequality rose significantly at NFHS 3. In urban-rural picture, there has been a gradual decline in inequality from NFHS1 to NFHS 2 to NFHS 3.The main reasons behind this are better accessibility specially with the help of NGOs, electrification of rural areas and increase in awareness.
16 | P a g e
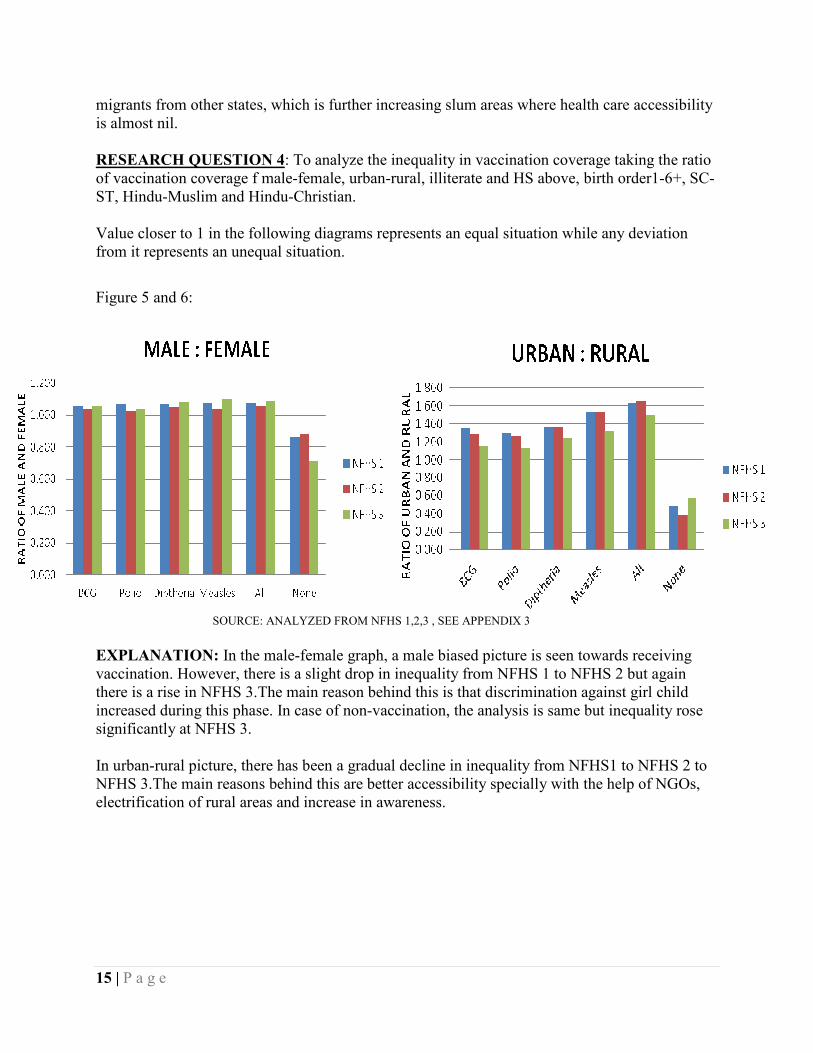
Figure 7, 8 and 9: SOURCE: ANALYZED FROM NFHS 1,2,3 , SEE APPENDIX 3 EXPLANATION: In the illiteracy and HS above diagram, literacy especially mothers awareness, women empowerment and female education seems to play a huge role in vaccination coverage of children and hence a ratio significantly less than 1 is seen from BCG to all. In the non-vaccination case, a much more profound and better situation is seen mainly because of initiatives taken by government in educational programmes like Sarva Shiksha Abhiyan. In the birth order1: 6+ diagram a general trend of not getting immunized for higher birth order has been seen. However from NFHS 1 to NFHS 2, there has been dip in inequality because here
17 | P a g e
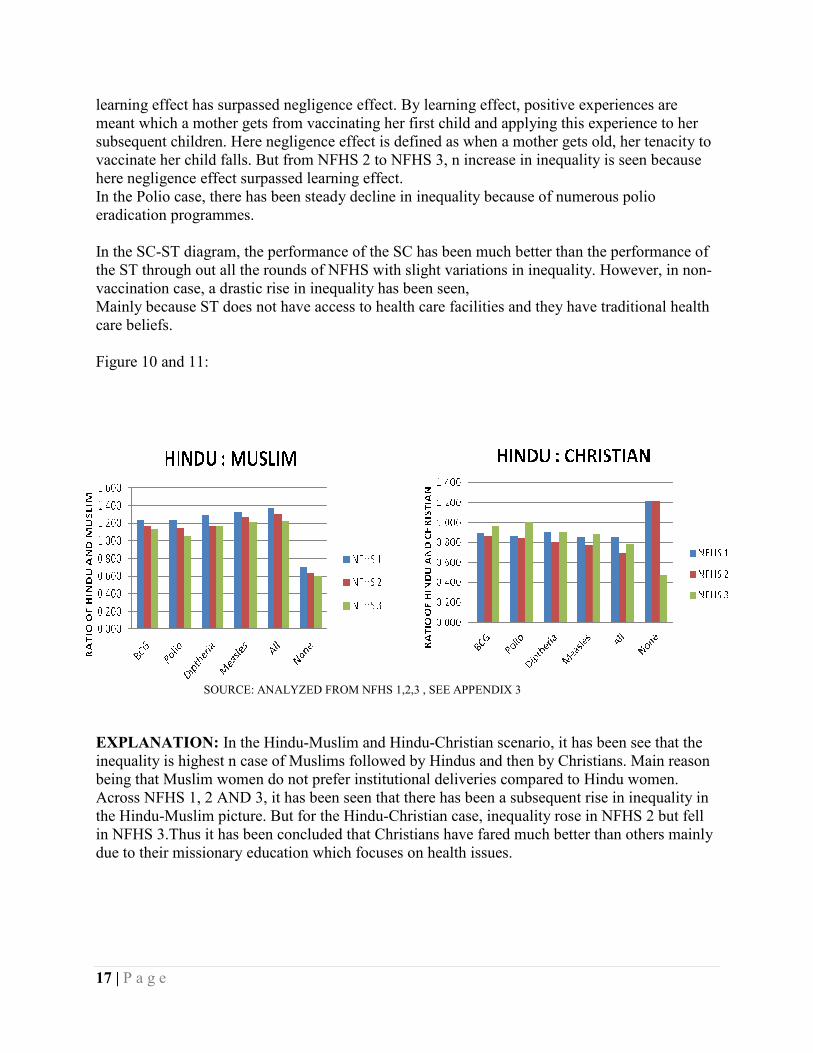
learning effect has surpassed negligence effect. By learning effect, positive experiences are meant which a mother gets from vaccinating her first child and applying this experience to her subsequent children. Here negligence effect is defined as when a mother gets old, her tenacity to vaccinate her child falls. But from NFHS 2 to NFHS 3, n increase in inequality is seen because here negligence effect surpassed learning effect. In the Polio case, there has been steady decline in inequality because of numerous polio eradication programmes. In the SC-ST diagram, the performance of the SC has been much better than the performance of the ST through out all the rounds of NFHS with slight variations in inequality. However, in non-vaccination case, a drastic rise in inequality has been seen, Mainly because ST does not have access to health care facilities and they have traditional health care beliefs. Figure 10 and 11: SOURCE: ANALYZED FROM NFHS 1,2,3 , SEE APPENDIX 3 EXPLANATION: In the Hindu-Muslim and Hindu-Christian scenario, it has been see that the inequality is highest n case of Muslims followed by Hindus and then by Christians. Main reason being that Muslim women do not prefer institutional deliveries compared to Hindu women. Across NFHS 1, 2 AND 3, it has been seen that there has been a subsequent rise in inequality in the Hindu-Muslim picture. But for the Hindu-Christian case, inequality rose in NFHS 2 but fell in NFHS 3.Thus it has been concluded that Christians have fared much better than others mainly due to their missionary education which focuses on health issues.
18 | P a g e
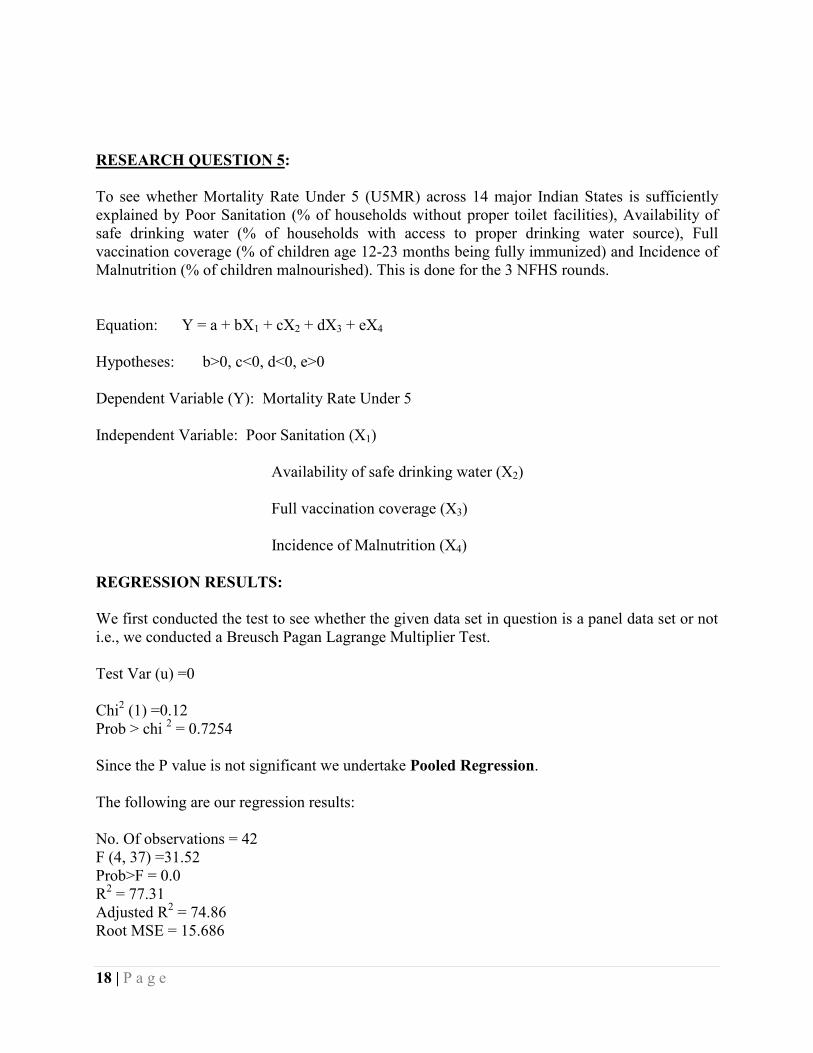
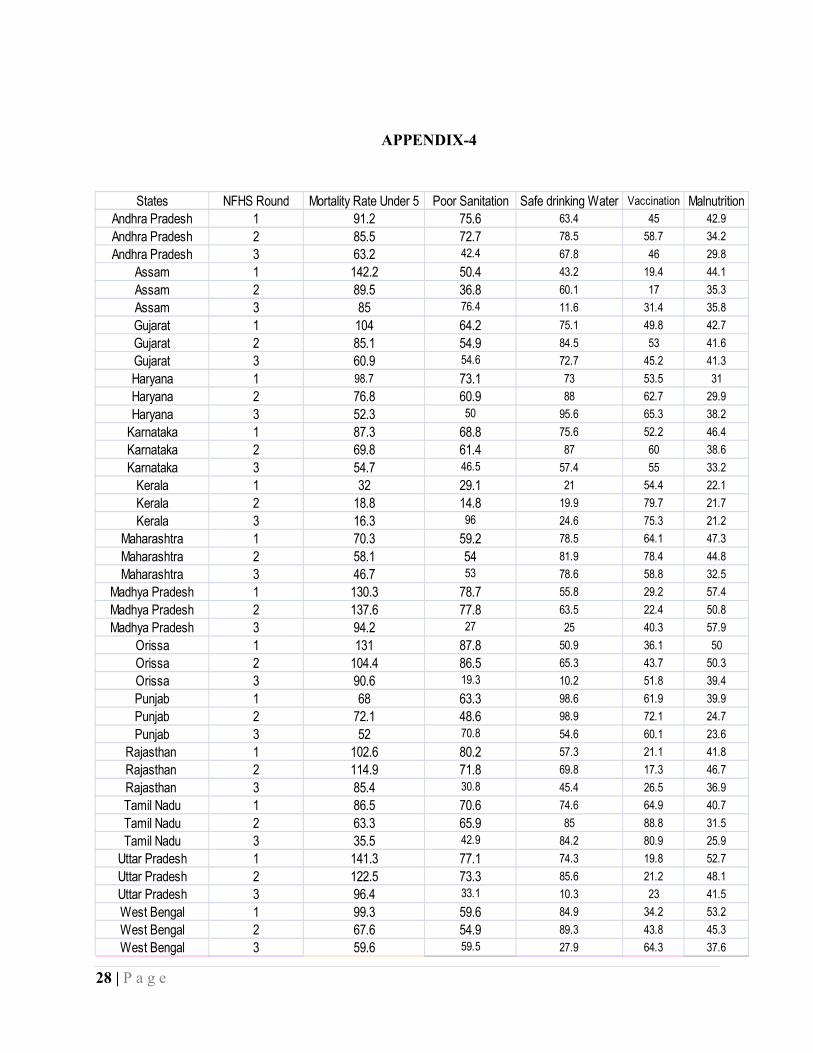
RESEARCH QUESTION 5: To see whether Mortality Rate Under 5 (U5MR) across 14 major Indian States is sufficiently explained by Poor Sanitation (% of households without proper toilet facilities), Availability of safe drinking water (% of households with access to proper drinking water source), Full vaccination coverage (% of children age 12-23 months being fully immunized) and Incidence of Malnutrition (% of children malnourished). This is done for the 3 NFHS rounds. Equation: Y = a + bX1 + cX2 + dX3 + eX4
Hypotheses: b>0, c<0, d<0, e>0 Dependent Variable (Y): Mortality Rate Under 5 Independent Variable: Poor Sanitation (X1) Availability of safe drinking water (X2) Full vaccination coverage (X3) Incidence of Malnutrition (X4) REGRESSION RESULTS: We first conducted the test to see whether the given data set in question is a panel data set or not i.e., we conducted a Breusch Pagan Lagrange Multiplier Test. Test Var (u) =0 Chi2 (1) =0.12 Prob > chi 2 = 0.7254 Since the P value is not significant we undertake Pooled Regression. The following are our regression results: No. Of observations = 42 F (4, 37) =31.52 Prob>F = 0.0 R2 = 77.31 Adjusted R2 = 74.86 Root MSE = 15.686
19 | P a g e
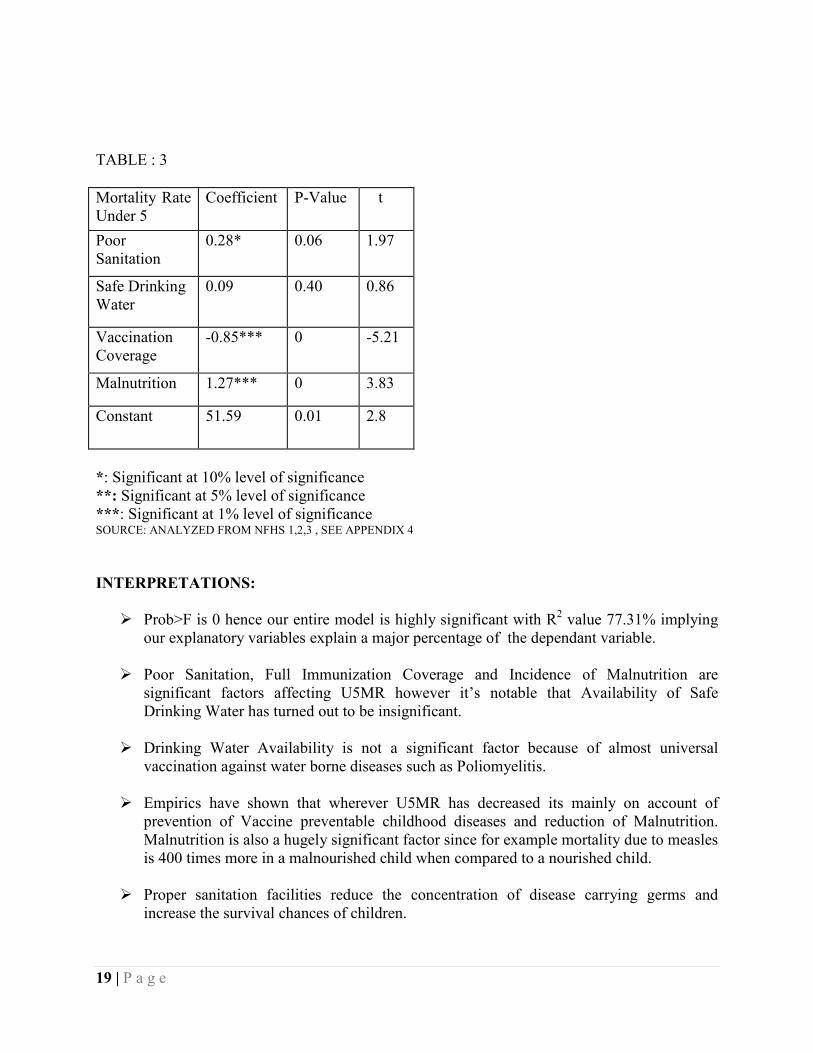
TABLE : 3 Mortality Rate Under 5
Coefficient P-Value t
Poor Sanitation
0.28* 0.06 1.97
Safe Drinking Water
0.09 0.40 0.86
Vaccination Coverage
-0.85*** 0 -5.21
Malnutrition 1.27*** 0 3.83
Constant 51.59 0.01 2.8
*: Significant at 10% level of significance **: Significant at 5% level of significance ***: Significant at 1% level of significance SOURCE: ANALYZED FROM NFHS 1,2,3 , SEE APPENDIX 4 INTERPRETATIONS:
Ø Prob>F is 0 hence our entire model is highly significant with R2 value 77.31% implying our explanatory variables explain a major percentage of the dependant variable.
Ø Poor Sanitation, Full Immunization Coverage and Incidence of Malnutrition are
significant factors affecting U5MR however it’s notable that Availability of Safe Drinking Water has turned out to be insignificant.
Ø Drinking Water Availability is not a significant factor because of almost universal
vaccination against water borne diseases such as Poliomyelitis.
Ø Empirics have shown that wherever U5MR has decreased its mainly on account of prevention of Vaccine preventable childhood diseases and reduction of Malnutrition. Malnutrition is also a hugely significant factor since for example mortality due to measles is 400 times more in a malnourished child when compared to a nourished child.
Ø Proper sanitation facilities reduce the concentration of disease carrying germs and
increase the survival chances of children.
20 | P a g e
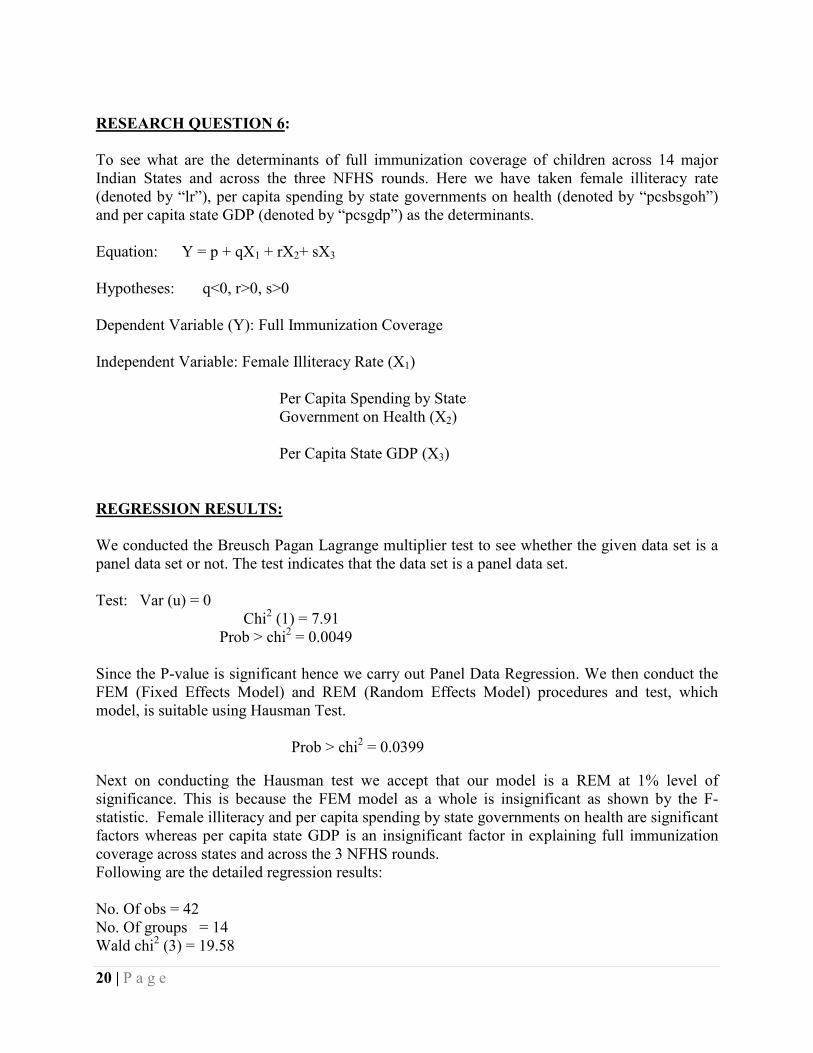
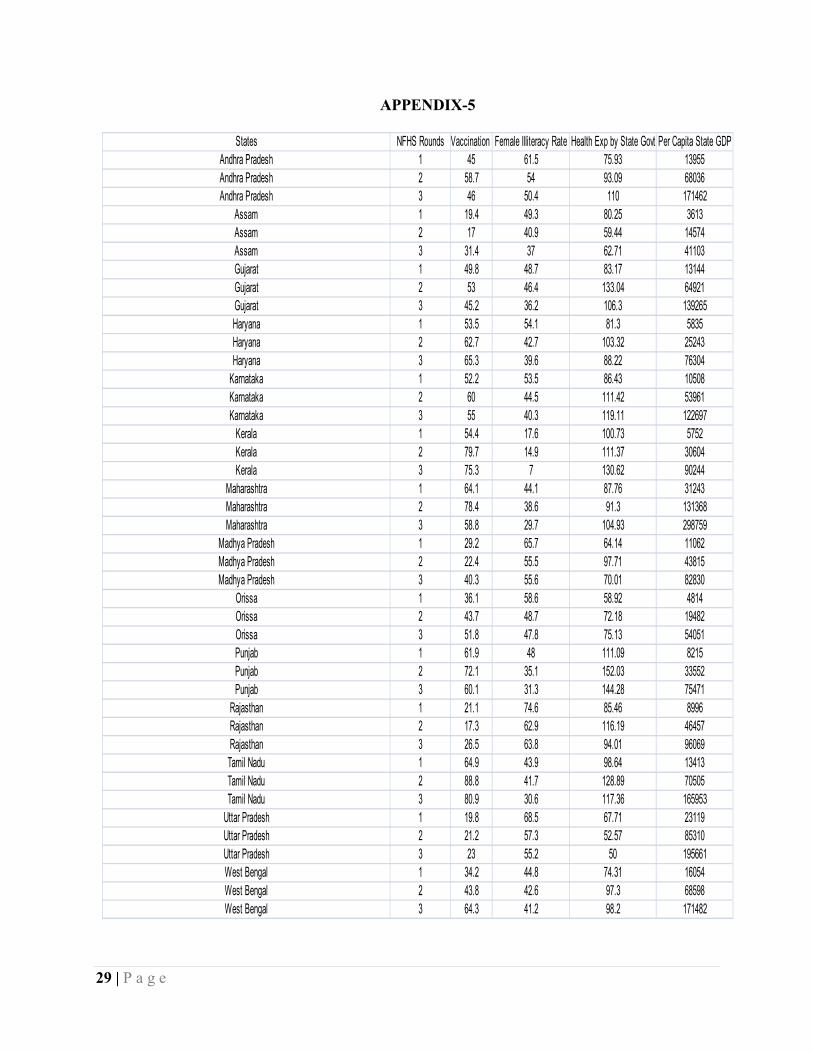
RESEARCH QUESTION 6: To see what are the determinants of full immunization coverage of children across 14 major Indian States and across the three NFHS rounds. Here we have taken female illiteracy rate (denoted by “lr”), per capita spending by state governments on health (denoted by “pcsbsgoh”) and per capita state GDP (denoted by “pcsgdp”) as the determinants. Equation: Y = p + qX1 + rX2+ sX3
Hypotheses: q<0, r>0, s>0 Dependent Variable (Y): Full Immunization Coverage Independent Variable: Female Illiteracy Rate (X1) Per Capita Spending by State Government on Health (X2) Per Capita State GDP (X3) REGRESSION RESULTS: We conducted the Breusch Pagan Lagrange multiplier test to see whether the given data set is a panel data set or not. The test indicates that the data set is a panel data set. Test: Var (u) = 0 Chi2 (1) = 7.91 Prob > chi2 = 0.0049 Since the P-value is significant hence we carry out Panel Data Regression. We then conduct the FEM (Fixed Effects Model) and REM (Random Effects Model) procedures and test, which model, is suitable using Hausman Test. Prob > chi2 = 0.0399
Next on conducting the Hausman test we accept that our model is a REM at 1% level of significance. This is because the FEM model as a whole is insignificant as shown by the F-statistic. Female illiteracy and per capita spending by state governments on health are significant factors whereas per capita state GDP is an insignificant factor in explaining full immunization coverage across states and across the 3 NFHS rounds. Following are the detailed regression results: No. Of obs = 42 No. Of groups = 14 Wald chi2 (3) = 19.58
21 | P a g e
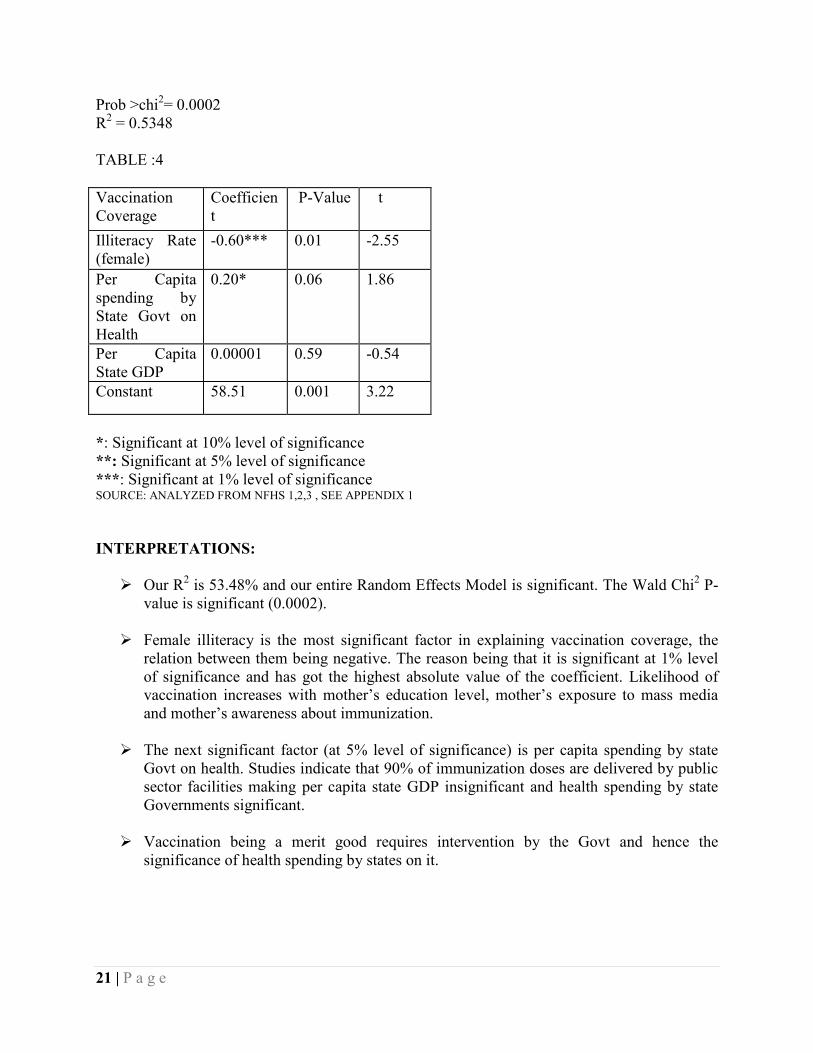
Prob >chi2= 0.0002 R2 = 0.5348 TABLE :4 Vaccination Coverage
Coefficient
P-Value t
Illiteracy Rate (female)
-0.60*** 0.01 -2.55
Per Capita spending by State Govt on Health
0.20* 0.06 1.86
Per Capita State GDP
0.00001 0.59 -0.54
Constant 58.51 0.001 3.22
*: Significant at 10% level of significance **: Significant at 5% level of significance ***: Significant at 1% level of significance SOURCE: ANALYZED FROM NFHS 1,2,3 , SEE APPENDIX 1 INTERPRETATIONS:
Ø Our R2 is 53.48% and our entire Random Effects Model is significant. The Wald Chi2 P-value is significant (0.0002).
Ø Female illiteracy is the most significant factor in explaining vaccination coverage, the
relation between them being negative. The reason being that it is significant at 1% level of significance and has got the highest absolute value of the coefficient. Likelihood of vaccination increases with mother’s education level, mother’s exposure to mass media and mother’s awareness about immunization.
Ø The next significant factor (at 5% level of significance) is per capita spending by state
Govt on health. Studies indicate that 90% of immunization doses are delivered by public sector facilities making per capita state GDP insignificant and health spending by state Governments significant.
Ø Vaccination being a merit good requires intervention by the Govt and hence the
significance of health spending by states on it.
22 | P a g e
POLICY PRESCRIPTIONS • Policies and programmes in other sectors such as education, welfare, industry, labour,
information, environment, etc. have to be informed and influenced by public health considerations.
• To stimulate immunization coverage, policy makers should also try to improve mothers’
education, media exposure, mothers’ awareness, mothers’ empowerment, electrification and to promote a small family norm.
• It is also necessary to target girl children, children from backward castes and Muslim
religious community.
• The provision of basic survival needs should be complementary with universal immunization.
• Preventive health care, therefore, requires immunization as well as good sanitation,
proper nutrition and shelter as the common minimum social needs. • As UIP is a massive, expensive and very complicated programme, the Government
should focus on a long-term vision of providing basic survival needs universally instead of only filling up the children’s intestines with the ‘myopic’ ‘techno-centric’ doses of vaccines. Preventive health care, therefore, requires immunization as well as good sanitation, proper nutrition and shelter as the common minimum social needs.
• There is a need to strategize by state and area. States with high U5MRs and slow decline
need to strengthen the health systems, prioritize essential elements of child health and nutrition services (high impact interventions) and develop and expand community participation for the prevention and treatment of childhood illnesses (care seeking, compliance and preventive practices at the household level).
• It is also suggested that for India to pick up and continue its earlier successful record in
child survival, a multiprong approach would be an important option. A multisectoral approach would include female education and nutrition, increasing the use of health services during pregnancy and delivery, eliminating the gender gap in child health services and improving nutrition throughout the lifecycle.
23 | P a g e
CONCLUSION Children are considered fully immunized if they receive one BCG injection to protect against tuberculosis, three doses each of DPT (diphtheria, pertussis, tetanus) and polio vaccines and one measles vaccine. Immunization coverage has improved substantially since NFHS-1, when only 36 per cent of children were fully vaccinated and 30 per cent had not been vaccinated at all. There is very little change, however, in full immunization coverage between NFHS-2 (42 per cent) and NFHS- 3 (44 per cent). Coverage of individual vaccines has increased considerably and is much higher than would appear from information on full coverage alone. Coverage for BCG, DPT, and polio (except Polio 0) vaccinations is much higher than the coverage of all required vaccinations combined. BCG, the first dose of DPT, and all three doses of polio vaccine have each been received by at least 76 per cent of children. Fifty-five per cent of children have received three doses of DPT. The relatively low percentages of children vaccinated with the third dose of DPT and with the measles vaccine are mainly responsible for the low proportion of children fully vaccinated. Progress in vaccination coverage varies markedly among the states. In 11 states, there has been a substantial deterioration in full immunization coverage in the last seven years, due to a decline in vaccination coverage for both DPT and polio. With regards to immunization coverage there is no doubt that India and its comprising states have come a long way. However, our main concern is the huge inequality prevailing amongst the states in terms of prime socio-economic and health indicators. Special focus must be given to the lagging states of Central & East as well as efforts should be undertaken to incorporate the isolated Northeastern regions for India’s inclusive health success story.
24 | P a g e
BIBLIOGRAPHY
Ø Boorah,Vani K.,(2009),” Gender Bias Among Children in India in their Diet and
Immunization Against Disease”, MPRA Paper No. 19590, Munich Personal RePEc Archive.
Ø Sharma, Suresh,(2007),”Immunization Coverage In India”, Institute of Economic
Growth, University Enclave, Delhi, Working Paper Series No. E/283/2007.
Ø Patra,Nilanjan,” When will they ever learn? The Great Indian Experience of Universal Immunization Programme”, JEL Classification: C25, I18, J13.
Ø Sharma, Suresh,(2008),”Child Mortality And Health In India”,Population Research Institute, Institute of Economic Growth, University Enclave, Delhi, Working Paper Series No. E/292/2008.
Ø Gaudin, Sylvestre and Yazbeck , Abdo S. ,(2006), “ Immunization in India---An Equity Adjusted Assessment, Health, Nutrition and Population-HNP discussion paper.
25 | P a g e
APPENDIX-1
NFHS1 NFHS2 NFHS3States Fully Immunisation age(12-23 mnths)in% U5MR IN 1000 Fully Immunisation age(12-23 mnths)in%U5MR IN 1000 Fully Immunisation age(12-23 mnths)in%U5MR IN 1000
India 35.4 109.3 42 94.9 43.5 74.3Delhi 57.8 83.1 69.8 55.4 63.2 46.7Haryana 53.5 98.7 62.7 76.8 65.3 52.3Himachal Pradesh 62.9 69.1 83.4 42.4 74.2 41.5J&K 65.7 59.1 56.7 80.1 66.7 51.2Punjab 61.9 68 72.1 72.1 60.1 52Rajasthan 21.1 102.6 17.3 114.9 26.5 85.4MP 29.2 130.3 22.4 137.6 40.3 94.2UP 19.8 141.3 21.2 122.5 23 96.4Bihar 10.7 127.5 11 105.1 32.8 84.8Orissa 36.1 131 43.7 104.4 51.8 90.6WB 34.2 99.3 43.8 67.6 64.3 59.6Arunachal Pradesh 22.5 72 20.5 98.1 28.4 87.7Assam 19.4 142.2 17 89.5 31.4 85Manipur 29.1 61.7 42.3 56.1 46.8 41.9Meghalaya 9.7 86.9 14.3 122 32.9 70.5Mizoram 56.4 29.3 59.6 54.7 46.5 52.9Nagaland 3.8 20.7 14.1 63.8 21 64.7Tripura 19 104.6 47.4 71 49.7 59.2Goa 74.9 38.9 82.6 46.8 78.6 20.3Gujarat 49.8 104 53 85.1 45.2 60.9Maharashtra 64.1 70.3 78.4 58.1 58.8 46.7Andhra Pradesh 45 91.2 58.7 85.5 46 63.2Karnataka 52.2 87.3 60 69.8 55 54.7Kerala 54.4 32 79.7 18.8 75.3 16.3Tamil Nadu 64.9 86.5 88.8 63.3 80.9 35.5
26 | P a g e
APPENDIX-2
NFHS 1 NFHS 2 NFHS 3
States Full Vaccination None Vaccination RATIO OF FULL TO NONE Full Vaccination None Vaccination RATIO OF FULL TO NONE Full Vaccination None Vaccination RATIO OF FULL TO NONE
India 35.4 30 1.18 42 14.4 2.916666667 43.5 5.1 8.529411765Delhi 57.8 6.7 8.626865672 69.8 5.1 13.68627451 63.2 9.1 6.945054945Haryana 53.5 17.5 3.057142857 62.7 9.9 6.333333333 65.3 7.8 8.371794872Himachal Pradesh 62.9 8.7 7.229885057 83.4 2.8 29.78571429 74.2 1.9 39.05263158J&K 65.7 16.2 4.055555556 56.7 10.4 5.451923077 66.7 4.5 14.82222222Punjab 61.9 17.5 3.537142857 72.1 8.7 8.287356322 60.1 6.6 9.106060606Rajasthan 21.1 48.5 0.435051546 17.3 22.5 0.768888889 26.5 5.5 4.818181818MP 29.2 34.4 0.848837209 22.4 13.9 1.611510791 40.3 5 8.06UP 19.8 43.3 0.457274827 21.2 29.5 0.718644068 23 2.7 8.518518519Bihar 10.7 53.5 0.2 11 16.8 0.654761905 32.8 7 4.685714286Orissa 36.1 28 1.289285714 43.7 9.4 4.64893617 51.8 11.6 4.465517241WB 34.2 22.4 1.526785714 43.8 13.6 3.220588235 64.3 5.9 10.89830508Arunachal Pradesh 22.5 47.5 0.473684211 20.5 28.7 0.714285714 28.4 24.1 1.178423237Assam 19.4 43.6 0.444954128 17 33.2 0.512048193 31.4 15.2 2.065789474Manipur 29.1 32.3 0.900928793 42.3 17.2 2.459302326 46.8 6.5 7.2Meghalaya 9.7 54.9 0.176684882 14.3 42.3 0.338061466 32.9 16.5 1.993939394Mizoram 56.4 14.5 3.889655172 59.6 10.5 5.676190476 46.5 7 6.642857143Nagaland 3.8 75 0.050666667 14.1 32.7 0.431192661 21 18.4 1.141304348Tripura 19 42.1 0.451306413 47.4 17.6 2.693181818 49.7 14.7 3.380952381Goa 74.9 5.4 13.87037037 82.6 0 #DIV/0! 78.6 0 #DIV/0!Gujarat 49.8 18.9 2.634920635 53 6.6 8.03030303 45.2 4.5 10.04444444Maharashtra 64.1 7.5 8.546666667 78.4 2 39.2 58.8 2.8 21Andhra Pradesh 45 17.5 2.571428571 58.7 4.5 13.04444444 46 3.8 12.10526316Karnataka 52.2 15.2 3.434210526 60 7.7 7.792207792 55 6.9 7.971014493Kerela 54.4 11.4 4.771929825 79.7 2.2 36.22727273 75.3 1.8 41.83333333Tamil Nadu 64.9 3.3 19.66666667 88.8 0 #DIV/0! 80.9 0 #DIV/0!Uttaranchal 9.1Chhattisgarh 2.5Jharkhand 4.4Sikkim 3.2

27 | P a g e
APPENDIX-3
India NHFS1 NHFS2 NHFS3BCG Polio Diptheria Measles All None BCG Polio Diptheria Measles All None BCG Polio Diptheria Measles All None
SexMale 64 48.02 61 43.7 36.7 27.8 72.8 60.1 65.36 51.6 43.1 13.5 80.2 78.3 68.3 61.4 45.3 4.3Female 60.3 45 57.1 40.6 34.1 32.3 70.3 58.75 62.26 49.8 40.9 15.3 75.8 75.8 63.3 55.8 41.5 6Male : Female 1.06136 1.067111 1.068301 1.076355 1.076246 0.860681 1.035562 1.022979 1.049791 1.036145 1.05379 0.882353 1.058047 1.032982 1.078989 1.100358 1.091566 0.716667Birth Order1 71.3 54.3 68.8 53.2 45.5 21.2 79.8 66.25 73.96 61.8 54 9.8 86.6 81.25 76.4 69.5 54.6 3.76+ 38.6 29.38 34.56 21.9 15.2 51.7 54.6 48.25 46.5 33.1 24.1 24.4 51.2 68.8 37.23 32.2 18.5 8.6BO 1 : BO 6+ 1.84715 1.848196 1.990741 2.429224 2.993421 0.410058 1.461538 1.373057 1.590538 1.867069 2.240664 0.401639 1.691406 1.180959 2.052109 2.158385 2.951351 0.430233ResidentialUrban 77.6 58.9 74.8 57.5 50.7 16.4 86.8 70.77 80.46 69.2 60.5 6.4 86.9 84.37 77.2 71.8 57.6 3.3Rural 57.6 45.35 54.4 37.7 30.9 34 67.1 56.13 59 45.3 36.6 16.7 75.1 74.57 62 54.2 38.6 5.7Urban :Rural 1.347222 1.298787 1.375 1.525199 1.640777 0.482353 1.293592 1.260823 1.363729 1.527594 1.653005 0.383234 1.157124 1.13142 1.245161 1.324723 1.492228 0.578947Mothers' EducationIlleterate 50.8 37.45 47.3 30.8 24 40.1 59.1 50.9 49.96 35.8 27.8 21.2 64.7 70.45 49.4 41 26.1 7.4HS and above 92.8 71.15 90.3 76.7 70 4.2 95.2 76.97 91.4 82.8 72.7 1.4 97.5 85.5 86.7 82.6 75.2 2Illiterate : HS & above 0.547414 0.526353 0.52381 0.401565 0.342857 9.547619 0.620798 0.661297 0.546608 0.432367 0.382393 15.14286 0.66359 0.823977 0.569781 0.496368 0.347074 3.7CasteSC 52.9 40.27 51.13 33.9 26.8 36.9 69.6 58.35 61.33 47.6 40.2 15.1 75.4 75.97 63.5 56.7 39.7 5.4ST 50.2 35.65 44.93 32.7 24.8 41.8 60 48.57 47.7 34.3 26.4 24.2 71.7 65.52 53.3 46.1 31.3 11.5SC : ST 1.053785 1.129593 1.137992 1.036697 1.080645 0.882775 1.16 1.201359 1.285744 1.387755 1.522727 0.623967 1.051604 1.159493 1.19137 1.229935 1.268371 0.469565ReligionHindu 63.3 46.48 60.4 42.9 36 28.6 72.5 60.15 64.46 51.5 42.4 13.3 79.6 77.65 67.26 60 44.4 4.4Muslim 51.2 37.6 46.83 32.3 26.3 41.1 62.3 52.55 54.96 40.4 32.7 21 69.7 74.1 57.66 49.6 36.3 7.3Christian 70.7 53.65 66.5 50 42.4 23.4 84 70.98 79.56 66.2 61.1 11 82.1 76.95 74.33 68 56.3 9.4Hindu : Muslim 1.236328 1.23617 1.289772 1.328173 1.368821 0.695864 1.163724 1.144624 1.172853 1.274752 1.296636 0.633333 1.142037 1.047908 1.166493 1.209677 1.22314 0.60274Hindu : Christian 0.895332 0.866356 0.908271 0.858 0.849057 1.222222 0.863095 0.847422 0.810206 0.777946 0.693944 1.209091 0.969549 1.009097 0.904884 0.882353 0.788632 0.468085
28 | P a g e
APPENDIX-4
States NFHS Round Mortality Rate Under 5 Poor Sanitation Safe drinking Water Vaccination MalnutritionAndhra Pradesh 1 91.2 75.6 63.4 45 42.9
Andhra Pradesh 2 85.5 72.7 78.5 58.7 34.2
Andhra Pradesh 3 63.2 42.4 67.8 46 29.8
Assam 1 142.2 50.4 43.2 19.4 44.1
Assam 2 89.5 36.8 60.1 17 35.3
Assam 3 85 76.4 11.6 31.4 35.8
Gujarat 1 104 64.2 75.1 49.8 42.7
Gujarat 2 85.1 54.9 84.5 53 41.6
Gujarat 3 60.9 54.6 72.7 45.2 41.3
Haryana 1 98.7 73.1 73 53.5 31
Haryana 2 76.8 60.9 88 62.7 29.9
Haryana 3 52.3 50 95.6 65.3 38.2
Karnataka 1 87.3 68.8 75.6 52.2 46.4
Karnataka 2 69.8 61.4 87 60 38.6
Karnataka 3 54.7 46.5 57.4 55 33.2
Kerala 1 32 29.1 21 54.4 22.1
Kerala 2 18.8 14.8 19.9 79.7 21.7
Kerala 3 16.3 96 24.6 75.3 21.2
Maharashtra 1 70.3 59.2 78.5 64.1 47.3
Maharashtra 2 58.1 54 81.9 78.4 44.8
Maharashtra 3 46.7 53 78.6 58.8 32.5
Madhya Pradesh 1 130.3 78.7 55.8 29.2 57.4
Madhya Pradesh 2 137.6 77.8 63.5 22.4 50.8
Madhya Pradesh 3 94.2 27 25 40.3 57.9
Orissa 1 131 87.8 50.9 36.1 50
Orissa 2 104.4 86.5 65.3 43.7 50.3
Orissa 3 90.6 19.3 10.2 51.8 39.4
Punjab 1 68 63.3 98.6 61.9 39.9
Punjab 2 72.1 48.6 98.9 72.1 24.7
Punjab 3 52 70.8 54.6 60.1 23.6
Rajasthan 1 102.6 80.2 57.3 21.1 41.8
Rajasthan 2 114.9 71.8 69.8 17.3 46.7
Rajasthan 3 85.4 30.8 45.4 26.5 36.9
Tamil Nadu 1 86.5 70.6 74.6 64.9 40.7
Tamil Nadu 2 63.3 65.9 85 88.8 31.5
Tamil Nadu 3 35.5 42.9 84.2 80.9 25.9
Uttar Pradesh 1 141.3 77.1 74.3 19.8 52.7
Uttar Pradesh 2 122.5 73.3 85.6 21.2 48.1
Uttar Pradesh 3 96.4 33.1 10.3 23 41.5
West Bengal 1 99.3 59.6 84.9 34.2 53.2
West Bengal 2 67.6 54.9 89.3 43.8 45.3
West Bengal 3 59.6 59.5 27.9 64.3 37.6
29 | P a g e
APPENDIX-5
States NFHS Rounds Vaccination Female Illiteracy Rate Health Exp by State Govt Per Capita State GDPAndhra Pradesh 1 45 61.5 75.93 13955Andhra Pradesh 2 58.7 54 93.09 68036Andhra Pradesh 3 46 50.4 110 171462
Assam 1 19.4 49.3 80.25 3613Assam 2 17 40.9 59.44 14574Assam 3 31.4 37 62.71 41103Gujarat 1 49.8 48.7 83.17 13144Gujarat 2 53 46.4 133.04 64921Gujarat 3 45.2 36.2 106.3 139265Haryana 1 53.5 54.1 81.3 5835Haryana 2 62.7 42.7 103.32 25243Haryana 3 65.3 39.6 88.22 76304Karnataka 1 52.2 53.5 86.43 10508Karnataka 2 60 44.5 111.42 53961Karnataka 3 55 40.3 119.11 122697Kerala 1 54.4 17.6 100.73 5752Kerala 2 79.7 14.9 111.37 30604Kerala 3 75.3 7 130.62 90244
Maharashtra 1 64.1 44.1 87.76 31243Maharashtra 2 78.4 38.6 91.3 131368Maharashtra 3 58.8 29.7 104.93 298759
Madhya Pradesh 1 29.2 65.7 64.14 11062Madhya Pradesh 2 22.4 55.5 97.71 43815Madhya Pradesh 3 40.3 55.6 70.01 82830
Orissa 1 36.1 58.6 58.92 4814Orissa 2 43.7 48.7 72.18 19482Orissa 3 51.8 47.8 75.13 54051Punjab 1 61.9 48 111.09 8215Punjab 2 72.1 35.1 152.03 33552Punjab 3 60.1 31.3 144.28 75471
Rajasthan 1 21.1 74.6 85.46 8996Rajasthan 2 17.3 62.9 116.19 46457Rajasthan 3 26.5 63.8 94.01 96069Tamil Nadu 1 64.9 43.9 98.64 13413Tamil Nadu 2 88.8 41.7 128.89 70505Tamil Nadu 3 80.9 30.6 117.36 165953Uttar Pradesh 1 19.8 68.5 67.71 23119Uttar Pradesh 2 21.2 57.3 52.57 85310Uttar Pradesh 3 23 55.2 50 195661West Bengal 1 34.2 44.8 74.31 16054West Bengal 2 43.8 42.6 97.3 68598West Bengal 3 64.3 41.2 98.2 171482

30 | P a g e


