Embed Size (px)
Citation preview
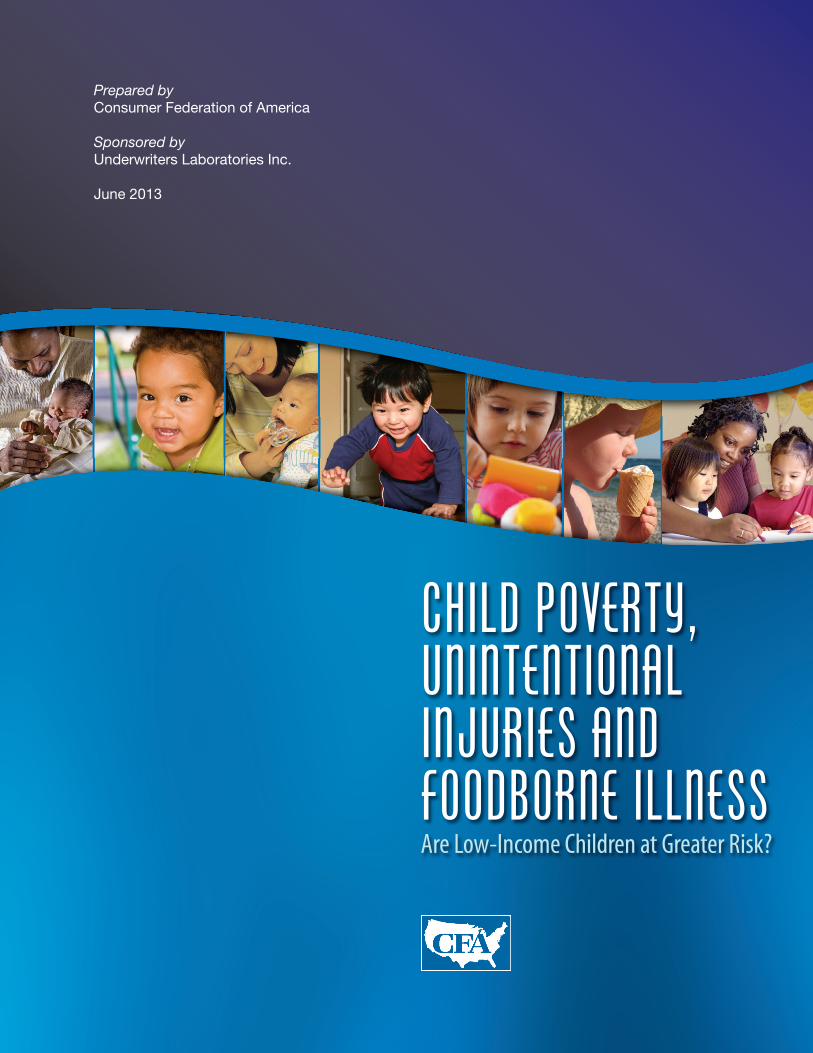
CHILD POVERTY,UNINTENTIONALINJURIES ANDFOODBORNE ILLNESSAre Low-Income Children at Greater Risk?
Prepared byConsumer Federation of America
Sponsored byUnderwriters Laboratories Inc.
June 2013
This report was prepared by the Consumer Federation of America (CFA). CFA is a non-profitassociation of nearly 300 consumer organizations that was founded in 1968 to advance the
consumer interest through research, advocacy, and education. Since then, it has taken leadershipon product safety and food safety issues by initiating and helping maintain coalitions and
organizations such as Advocates for Highway and Auto Safety and the Safe Food Coalition,preparing and distributing numerous publications includingThe Product Safety Book, andsuccessfully supporting numerous public policies to establish new consumer protections and
strengthen federal safety agencies.The opinions and conclusions contained in this report are solelythose of CFA. For more information, go to consumerfed.org.
The report was sponsored by UL (Underwriters Laboratories Inc.). UL is a premier globalindependent safety science company with more than 118 years of history. Employing more than10,000 professionals with customers in over 100 countries, UL has five distinct business units –
Product Safety, Environment, Life & Health, Knowledge Services, andVerification Services –to meet the expanding needs of our customers and to deliver on our public safety mission.For more information on UL’s family of companies and network of 95 laboratory, testing,
and certification facilities, go to UL.com.
Introduction
Unintentional injuries represent the leading cause of death for children between the ages of oneand fourteen.They are responsible for approximately 5,000 child deaths, about 5 million childemergency room visits, and millions of unreported injuries each year. Approximately half of allreported foodborne illnesses occur in children under fifteen years of age, with children under fiveyears of age at particular risk.1
A relatively high percentage of these children live in poverty. According to the ColumbiaUniversity’s National Center for Children in Poverty, of the 73 million children (ages 1-17) in thecountry, over two-fifths (44%) are from low-income families.2 Because these children are morelikely to experience unsafe environments such as deteriorated housing, unsafe playgrounds, lowernutritional status, and less parental supervision in one-parent homes, one would expect that theyare subjected to greater injury-related risks than are other children.
Thus, it is surprising that the issue of low-income children suffering unintentional injuries andfoodborne illness has received relatively little attention. In part because key databases on illness,injuries and related deaths do not contain information on household income or do not makeconnections between income and injuries, there are few recent studies on the subject.The great-est attention to the issue of unintentional injuries has been by emergency room physicians,pediatricians, and nurses, many of whom are associated with the Injury Free Coalition for KidsNetwork.3
While the federal agencies dealing with unintentional injuries and foodborne illness have notfocused on those issues as they apply to low-income children specifically, there has been focus onminority communities.4
1 U.S. government data systems and academic research often use varying age ranges when providing data on injuries andfoodborne illnesses for children, making direct comparisons difficult. For the purposes of this report and its recommendations,we are focusing on all low-income children, ages 1-17.
2 The National Center for Children in Poverty points to research which suggests that families require an income equal to twicethe federal poverty level to meet basic needs. Families below this level ($29,420 for a family of two, $44,700 for a family offour) are considered low-income.
3 The Injury Free Coalition for Kids is an injury prevention program comprised of hospital-based, community-oriented programs,whose efforts are anchored in research, education, and advocacy. Currently, the coalition includes 42 sites located in 40 cities,each housed in the trauma centers of their participating institutions. More information is available athttp://www.injuryfree.org/about.cfm.
4 For example, in August 2009, as directed by the Consumer Product Safety Improvement Act, the Government AccountabilityOffice published a report focusing on the U.S. Consumer Product Safety Commission and minority children. The report, titled,“Consumer Product Safety Commission: Better Data Collection and Assessment of Consumer Information Efforts Could HelpProtect Minority Children” (available on the web at http://www.gao.gov/new.items/d09731.pdf) concluded that CPSC shouldimprove its data collection system to more effectively include information about the race of the injured child and that CPSCshould implement systems to assess whether safety messages were effectively reaching targeted populations. CPSC hasresponded to these recommendations and has modified National Electronic Injury Surveillance System to better capture dataabout race and has created a minority outreach team to evaluate and improve the effectiveness of safety messaging in minor-ity communities.
In addition, the Department of Health and Human Services has created an “Action Plan to Reduce Racial and Ethnic HealthDisparities” (available at http://minorityhealth.hhs.gov/npa/files/Plans/HHS/HHS_Plan_complete.pdf). This effort is based uponwell-documented health disparities among racial and ethnic populations. Such differences are linked to “social, economic andenvironmental disadvantage.” While this effort is focused on health disparities and not unintentional injuries, it represents abroad governmental effort to reduce health impacts in particular populations that could be used as a model to address uninten-tional injuries and foodborne illness.
CHILD POVERTY, UNINTENTIONAL INJURIES AND FOODBORNE ILLNESS: ARE LOW-INCOME CHILDREN AT GREATER RISK? 1
Over two-fifths of the73 million childrenin the United Statesare from low-incomefamilies.

The purpose of this report is to show that existing data and research, however incomplete,strongly suggest that low-income children are at greater risk than other children from uninten-tional injuries and foodborne illness.These injuries are mainly incurred in the home, in the yard,on playgrounds, on streets, and in motor vehicles.The report will also explore reasons for thesehigher risks ranging from lack of information to hazardous environments. Finally, the report willdiscuss ways that federal safety-related databases can incorporate more information about socio-economic status to allow researchers and practitioners to learn more about the influence of re-lated factors.
The report, like existing data and research, is divided into two main sections – one on product-related unintentional injuries and the other on foodborne illness. Each section will discuss sourcesof information about injury or illness and related mortality, what these sources tell us about risksrelated to low-income children, what factors may help explain these risks, and what could bedone to improve information sources.
Unintentional Injuries
Sources of Information
Two valuable national sources of statistical data about product-related injuries are the ConsumerProduct Safety Commission’s (CPSC) National Electronic Injury Surveillance System (NEISS)and the Center for Disease Control and Prevention’s (CDC) Web-based Injury Statistics Queryand Reporting System (WISQARS). NEISS is administered by the CPSC and is based upon in-formation received from selected hospitals across the country and U.S. territories. NEISS data is aprobability sample based upon information collected at each participating emergency room aboutan injury or death associated with a consumer product. From the data collected through NEISS,national injury estimates are created.WISQARS is an online database compiled by CDC basedupon data received by numerous sources that includes NEISS data, fatal and nonfatal injury data,violent death data, and cost of injury data. CDC statistics, noted in Table 1, indicate the most fre-quent causes of unintentional injury deaths of those between the ages of one and fourteen in thelatest reported year. More than half of these deaths occurred in the “home environment.”Themechanisms of death included fire or burn, drowning, suffocation, choking, unintentional firearminjuries, falls and poisoning (Nagaraja et al., 2005).
The CDC’s National Center for Health Statistics publishes national estimates for a broad range ofhealth measures, including injury data, based on the National Health Interview Survey (NHIS).While this annual report includes information about socioeconomic status, the report does notprovide specific correlations between socioeconomic status of children and injuries.
2 CHILD POVERTY, UNINTENTIONAL INJURIES AND FOODBORNE ILLNESS: ARE LOW-INCOME CHILDREN AT GREATER RISK?
Existing data andresearch stronglysuggest that low-income children are atgreater risk than otherchildren fromunintentional injuriesand foodborne illness.
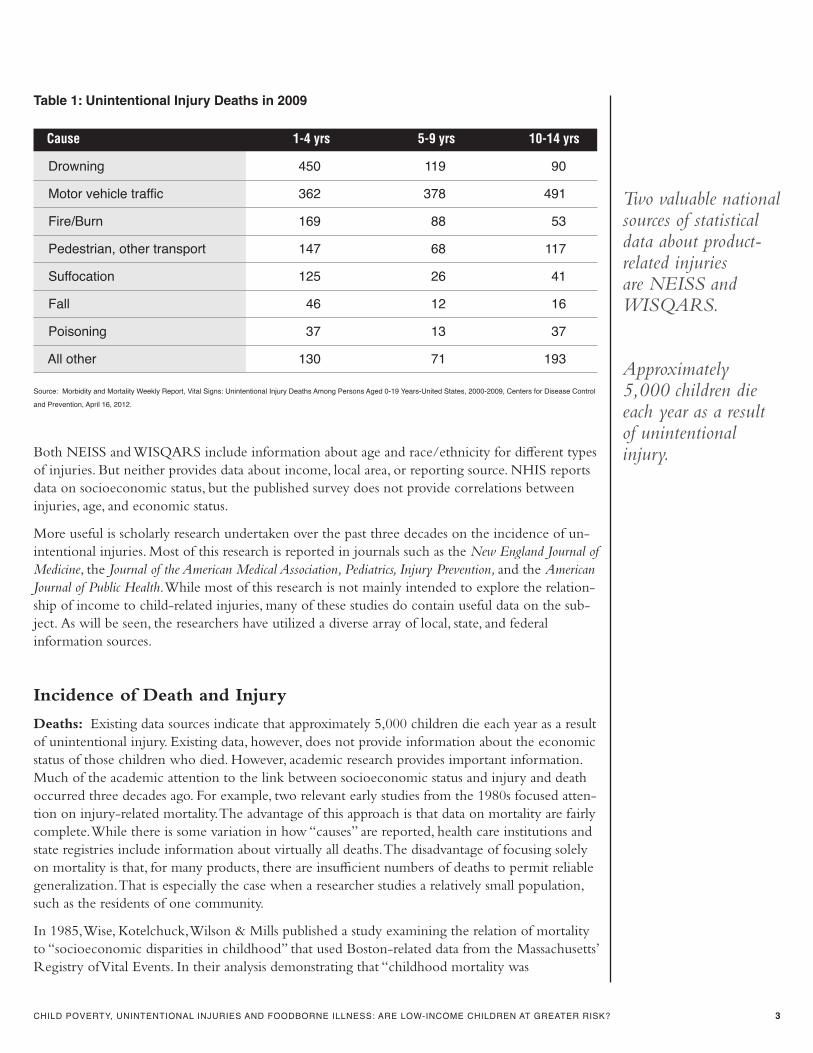
Source: Morbidity and Mortality Weekly Report, Vital Signs: Unintentional Injury Deaths Among Persons Aged 0-19 Years-United States, 2000-2009, Centers for Disease Control
and Prevention, April 16, 2012.
Both NEISS and WISQARS include information about age and race/ethnicity for different typesof injuries. But neither provides data about income, local area, or reporting source. NHIS reportsdata on socioeconomic status, but the published survey does not provide correlations betweeninjuries, age, and economic status.
More useful is scholarly research undertaken over the past three decades on the incidence of un-intentional injuries. Most of this research is reported in journals such as the New England Journal ofMedicine, the Journal of the American Medical Association, Pediatrics, Injury Prevention, and the AmericanJournal of Public Health.While most of this research is not mainly intended to explore the relation-ship of income to child-related injuries, many of these studies do contain useful data on the sub-ject. As will be seen, the researchers have utilized a diverse array of local, state, and federalinformation sources.
Incidence of Death and Injury
Deaths: Existing data sources indicate that approximately 5,000 children die each year as a resultof unintentional injury. Existing data, however, does not provide information about the economicstatus of those children who died. However, academic research provides important information.Much of the academic attention to the link between socioeconomic status and injury and deathoccurred three decades ago. For example, two relevant early studies from the 1980s focused atten-tion on injury-related mortality.The advantage of this approach is that data on mortality are fairlycomplete.While there is some variation in how “causes” are reported, health care institutions andstate registries include information about virtually all deaths.The disadvantage of focusing solelyon mortality is that, for many products, there are insufficient numbers of deaths to permit reliablegeneralization.That is especially the case when a researcher studies a relatively small population,such as the residents of one community.
In 1985,Wise, Kotelchuck,Wilson & Mills published a study examining the relation of mortalityto “socioeconomic disparities in childhood” that used Boston-related data from the Massachusetts’Registry ofVital Events. In their analysis demonstrating that “childhood mortality was
CHILD POVERTY, UNINTENTIONAL INJURIES AND FOODBORNE ILLNESS: ARE LOW-INCOME CHILDREN AT GREATER RISK? 3
Two valuable nationalsources of statisticaldata about product-related injuriesare NEISS andWISQARS.
Approximately5,000 children dieeach year as a resultof unintentionalinjury.
Table 1: Unintentional Injury Deaths in 2009
Cause 1-4 yrs 5-9 yrs 10-14 yrs
Drowning 450 119 90
Motor vehicle traffic 362 378 491
Fire/Burn 169 88 53
Pedestrian, other transport 147 68 117
Suffocation 125 26 41
Fall 46 12 16
Poisoning 37 13 37
All other 130 71 193
significantly higher among black children and low-income children,” the researchers specificallyfound that injuries resulting from fires and occupant-related motor vehicle crashes were stronglyrelated to lower incomes.
In the same year, Neresian, Petit, Shaper, Lemieux & Naor also published research on childhoodmortality and poverty based on data from a different state. In reviewing all child deaths reportedto the State of Maine from 1976 to 1980, the researchers learned that these deaths were experi-enced far more frequently by those children in families participating in social welfare programsthan by those children who were not. In large part, these economic differences reflected dispari-ties in injury-related deaths. Low-income children were well over twice as likely to experienceaccidental deaths as other children. In looking at specific causes, the study found that, comparinglow-income children to other children, the rates for motor vehicle-related deaths were more thantwo to one, the rates for fire-related deaths were more than five to one, and the rates for drown-ing-related deaths were four to one.
Injuries: Existing national data sources document that unintentional injuries cause about 5 millionchildren to be treated in emergency rooms each year and that there are many unreported injuries aswell. Existing data about unintentional injuries does not, for the most part, include data about theincome of the injured. However, academic research based upon smaller, more geographically focuseddata sources has found important connections between injury rates and income levels.
This research has more recently directed attention to all injuries, the large majority of which donot cause death.The great advantage of this broader focus is that the population studied is muchlarger. Many more children visit emergency rooms for treatment as die from injuries. However,the data on treatment can be less accurate than mortality statistics as indicators of incidencebecause of differences in access to emergency rooms and willingness to utilize this access (Scheidtet al., 1995).
In 1991, Santer and Stocking published the results of interviews with those receiving public assis-tance who were caregivers of young children enrolled in an inner-city pediatric clinic.These in-terviews revealed relatively low percentages of households with functional smoke alarms and fireextinguishers, with knowledge of ipecac, a remedy for poisoning, with adequately stored hazards,and with adequate child restraints in motor vehicles.The authors noted that “injuries…dispropor-tionately affect poor children” and “specific concerns include exposure to fires and burns, falls,hazardous travel conditions, dangerous chemicals, choking, and drowning.”
In 1994, Durkin, Davidson, Kuhn, O’Connor & Barlow published a study of the risk of severepediatric injury among children in a lower-income area in NewYork City. Using data collectedby the Northern Manhattan Injury Surveillance System, the researchers found that “among thesocioeconomic factors considered, low income was the single most important predictor of in-juries.” While this conclusion included intentional as well as unintentional injuries, the re-searchers found higher rates of motor vehicle injuries, pedestrian injuries, fall injuries, and burninjuries in “largely low-income tracts” than in “moderately low-income tracts.”
In 2000, Danseco, Miller & Spicer reported research on the incidence of unintentional childhoodinjuries from 1987 to 1994 based on National Health Interview Survey data. Examining 3,073injury episodes, the researchers learned that “children in families with incomes under $5,000 hadthe highest rate of nonfatal injury” while “those in the highest income bracket had the lowestrate.”
In the same year, Grossman published a review of data and literature on the epidemiology of childand adolescent injuries.This article reported the finding by Danseco et al. that “overall, uninten-
4 CHILD POVERTY, UNINTENTIONAL INJURIES AND FOODBORNE ILLNESS: ARE LOW-INCOME CHILDREN AT GREATER RISK?
Researchers foundthat “among thesocioeconomic factorsconsidered, lowincome was the singlemost importantpredictor of injuries.”

tional injury rates are highest among adolescents ages 15 to 19, males, children from impoverishedfamilies, and minorities.” It also indicated that “higher rates of crash death are associated with resi-dence in poor areas,” children in poor neighborhoods are at higher risk of pedestrian injury “pri-marily because of environmental risk factors, such as high traffic volume and lack of defined playareas,” and “the risk of drowning is twofold to fourfold higher among low-income families.”
In 2001, Pomerantz, Dowd, & Buncher published research on socioeconomic factors related tothe admission of children suffering injuries to the Children’s Hospital Medical Center in Cincin-nati. In comparing factors related to injury rates among census tracts, the researchers found that“the percentage of people living below poverty level, percentage of people with less than a highschool education, and percentage of unemployment were all significant risk factors for injury.”
In 2002, Bishai et al. reported research on “injury in preschool children in an urban Medicaidmanaged care organization” in Baltimore from 1997 to 1999. Its conclusion based on this andother research was that: “Because the children in this study qualified for Medicaid, the high ratesof injury may be related to poverty. Injuries disproportionately affect the poor and certain minor-ity populations . . . Children enrolled in this urban Medicaid program had nearly twice the rate ofinjury when compared to the national average.”
A 2005 article published by physicians and others affiliated with the Injury Free Coalition forKids found that “in low-income urban communities, injury rates…are higher than the nationalaverage” (Pressley et al., 2005).
Traffic Injuries: While most research on income and injuries has examined all causes of injuriessuffered by children, there are studies specifically on “social differences in traffic injury risks” thatwere summarized in a 2000 literature review by Laflamme & Diderichsen.The reviewers’ generalconclusion was that “for most types of traffic injury, mortality and morbidity are often higheramong children from lower social positions and in more deprived socioeconomic areas.” More fo-cused research in this area has also found that low-income child passengers are less likely to berestrained properly (Agran,Anderson, & Winn, 2004) and that “children who come from low-in-come families tend to live in dense, low-income, urban residential neighborhoods where they areat much higher risk of sustaining a pedestrian injury” (Committee on Injury,Violence, and PoisonPrevention, 2009). However, other research found that children in low-income households wereless likely to experience bicycle-related injuries (Scheidt et al., 1995) and occupant-related motorvehicle injuries (Wise et al., 1985), in part because these children were much less likely to ride onbikes and in cars.
Fire Safety: Research has also found significant income-related differences in fire deaths.Anearly study of house-fire deaths in Baltimore in the late 1970s compared the differences usingcensus tract median rentals. Grouping the tracts into quintiles, it found that the death rates in thetwo lowest-rent quintiles were more than three times the rates in the two highest-rent quintiles(Mierley & Baker, 1983). In addition, Grossman, in a 2000 study, found that “poverty is stronglyassociated with the risk of death in a house fire,” likely due to the condition of the home whichcould include faulty heating systems, cigarette smokers, trailer homes, and absence of smokealarms – conditions with a higher prevalence in low-income homes.
Further, an analysis of risk and protective factors for fires, burns, and carbon monoxide poisoningfound that risk factors were more likely to be present in low- and moderate-income homes thanin higher-income homes. Comparing households with incomes below and above $50,000 usingdata gathered from a national telephone survey, the researchers learned that fire extinguishers, fireescape plans, and carbon monoxide alarms were much less likely to exist in the lower-incomehomes (Runyan et al., 2005).
CHILD POVERTY, UNINTENTIONAL INJURIES AND FOODBORNE ILLNESS: ARE LOW-INCOME CHILDREN AT GREATER RISK? 5
“For most types oftraffic injury,mortality andmorbidity are oftenhigher amongchildren from lowersocial positions andin more deprivedsocioeconomic areas.”
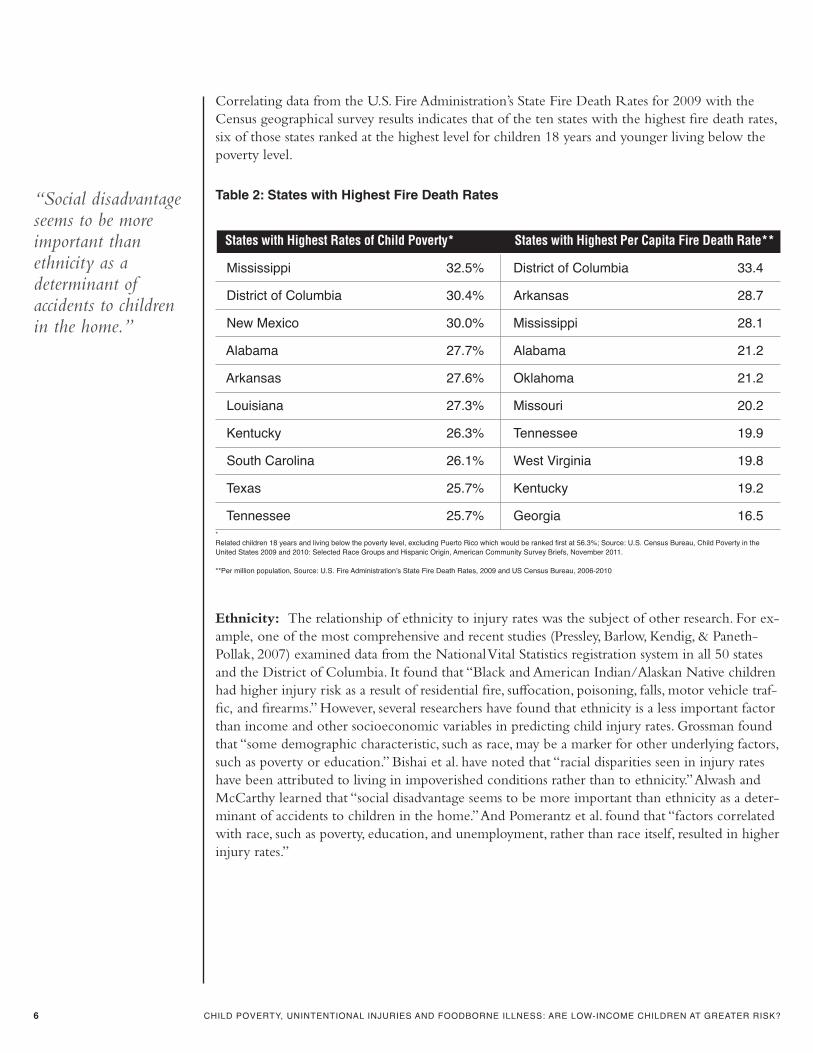
Correlating data from the U.S. Fire Administration’s State Fire Death Rates for 2009 with theCensus geographical survey results indicates that of the ten states with the highest fire death rates,six of those states ranked at the highest level for children 18 years and younger living below thepoverty level.
*Related children 18 years and living below the poverty level, excluding Puerto Rico which would be ranked first at 56.3%; Source: U.S. Census Bureau, Child Poverty in theUnited States 2009 and 2010: Selected Race Groups and Hispanic Origin, American Community Survey Briefs, November 2011.
**Per million population, Source: U.S. Fire Administration’s State Fire Death Rates, 2009 and US Census Bureau, 2006-2010
Ethnicity: The relationship of ethnicity to injury rates was the subject of other research. For ex-ample, one of the most comprehensive and recent studies (Pressley, Barlow, Kendig, & Paneth-Pollak, 2007) examined data from the NationalVital Statistics registration system in all 50 statesand the District of Columbia. It found that “Black and American Indian/Alaskan Native childrenhad higher injury risk as a result of residential fire, suffocation, poisoning, falls, motor vehicle traf-fic, and firearms.” However, several researchers have found that ethnicity is a less important factorthan income and other socioeconomic variables in predicting child injury rates. Grossman foundthat “some demographic characteristic, such as race, may be a marker for other underlying factors,such as poverty or education.” Bishai et al. have noted that “racial disparities seen in injury rateshave been attributed to living in impoverished conditions rather than to ethnicity.”Alwash andMcCarthy learned that “social disadvantage seems to be more important than ethnicity as a deter-minant of accidents to children in the home.”And Pomerantz et al. found that “factors correlatedwith race, such as poverty, education, and unemployment, rather than race itself, resulted in higherinjury rates.”
6 CHILD POVERTY, UNINTENTIONAL INJURIES AND FOODBORNE ILLNESS: ARE LOW-INCOME CHILDREN AT GREATER RISK?
Table 2: States with Highest Fire Death Rates
States with Highest Rates of Child Poverty* States with Highest Per Capita Fire Death Rate**
Mississippi 32.5% District of Columbia 33.4
District of Columbia 30.4% Arkansas 28.7
New Mexico 30.0% Mississippi 28.1
Alabama 27.7% Alabama 21.2
Arkansas 27.6% Oklahoma 21.2
Louisiana 27.3% Missouri 20.2
Kentucky 26.3% Tennessee 19.9
South Carolina 26.1% West Virginia 19.8
Texas 25.7% Kentucky 19.2
Tennessee 25.7% Georgia 16.5
“Social disadvantageseems to be moreimportant thanethnicity as adeterminant ofaccidents to childrenin the home.”

Factors Influencing Incidence
While most factors influencing the incidence of child injuries have not been carefully studied,there is some consensus among researchers that these factors are both environmental and human.One environmental factor relates to emergency and health services. Researchers have suggestedthat higher risks faced by low-income children could relate to the availability and/or quality offire department, mobile emergency medical services, and emergency room services. Inadequatelysupported health and safety related services could well compromise access by low-income families– in rural areas, no convenient services at all, and in inner city urban areas, delays in medicaltreatment.
The condition of neighborhoods may also help explain income differences in child safety risks.“If poor neighborhoods have fewer safe play areas, more children are likely to play in the streets,abandoned buildings, and other hazardous areas” (Durkin et al., 1994). In the streets, children riskinjury or even death from motor vehicles.And their playgrounds often have less safe equipmentand surfaces than those available to children in higher-income families. In 1999, Suecoff and col-leagues found that playgrounds in low-income neighborhoods in NewYork City had more main-tenance related hazards than playgrounds in higher-income areas.
A third type of environmental factor is conditions in the homes where low-income children re-side. These houses, and their appliances, tend to be older and less well-maintained, posing risksfrom hazards including fire, asphyxiation, falls, electrical shocks, and unsafe child products rangingfrom cribs to toys. It has already been noted that Grossman has found that children living in trail-ers face far higher fire risks than do those in other housing.
Other factors, though often influenced by the environment, are mainly human. Low-income par-ents are more likely to smoke than higher-income ones.That increases the risk not only of firesstarted by lit cigarettes but also burns caused by matches or lighters left around by smokers. Low-income parents also may be less able to afford child safety seats, smoke alarms, and other productsthat improve child safety.
Lack of knowledge also appears to play a role. In general, low-income parents may be less awareof the safety risks faced by their children and effective ways to mitigate these risks, for example,by keeping ipecac on hand to deal with poisoning, by installing and maintaining smoke alarms, byunderstanding the effective way to install a child safety seat, or being aware of recalls of unsafechild products. Research cited by Santer and Stocking supports the importance of parental aware-ness.
A final personal factor, noted by several researchers, relates to the relatively high percentage oflow-income children in single-parent families. Regardless of how conscientious these parents are,they face significant challenges ensuring that their children are safe in and outside the home sim-ply because, given the fact that the large majority work, they are less likely to be able to supervisetheir children than two parents who can better afford childcare. Given higher environmental riskstheir children face, and their own often severe time pressures, low-income single parents must fre-quently make a much greater personal effort to ensure the same level of child safety than theirhigher-income married counterparts.
CHILD POVERTY, UNINTENTIONAL INJURIES AND FOODBORNE ILLNESS: ARE LOW-INCOME CHILDREN AT GREATER RISK? 7
Durkin notedthat “if poorneighborhoods havefewer safe play areas,more children arelikely to play in thestreets, abandonedbuildings, and otherhazardous areas.”
Single-parent familiesface significantchallenges ensuringthat their children aresafe in and outsidethe home.
Data Gaps
The research cited above strongly suggests that low-income children suffer greater risk of unin-tentional injury in general and suffer greater risks of several types of injury in particular. But ittells us very little about the role of socioeconomic factors in other types of injury – such as suffo-cation, poisoning, and falls – and in specific risks of current concern – such as furniture and tele-vision tip overs, window blind strangulation, button cell battery ingestion, all-terrain vehicle(ATV) safety, and sports-related helmet use.
However, research and action on these and other topics is handicapped by the absence of exactdata on socioeconomic factors in the most important government databases – NEISS andWISQARS – and an absence of correlations between socioeconomic status, age and injury indatabases such as NHIS where socioeconomic data is collected. It would be beneficial to re-searchers, practitioners, and support efforts if the CPSC and the CDC would take leadership inexploring the feasibility of collecting information on these factors and publishing such correla-tions.
The Institute of Medicine found similar data gaps in its 2004 report,“Children’s Health, the Na-tion’s Wealth:Assessing and Improving Child Health.”The Committee on Evaluation of Chil-dren’s Health stressed the importance of measuring minority and socioeconomic status in surveysand health records and ensuring consistency across measurement systems.The Committee recom-mended that,“Government and private agencies and academic organizations that conduct health-related surveys or compile administrative data should geocode addresses in ways that facilitatelinkages to census-based and other neighborhood, community, city, and state data on environ-mental conditions” (National Research Council, 2004).The Committee further urged such datato be as accessible as possible, with adequate protections for confidentiality and security.
Most useful to identifying correlations between socioeconomic status, age, and injury would be torequire reporting agencies, such as hospitals, to include information on family income of childrensuffering injuries.Almost as useful would be information on the census tracts in which the chil-dren live.There is research on a wide array of topics that utilizes census tracts as proxies for in-come. Less valuable, but possibly still useful for researchers, would be for the databases to includethe sources of information.The geographic location of hospitals and other data sources would bea less reliable proxy for income than census tract residence of those injured, yet this informationwould permit researchers to focus on those hospitals providing medical services frequently tolow-income children.
8 CHILD POVERTY, UNINTENTIONAL INJURIES AND FOODBORNE ILLNESS: ARE LOW-INCOME CHILDREN AT GREATER RISK?
The CPSC and theCDC are in the bestposition to explorethe feasibility ofcollecting informationon income or censustract data.
Foodborne Illness
Sources of Information
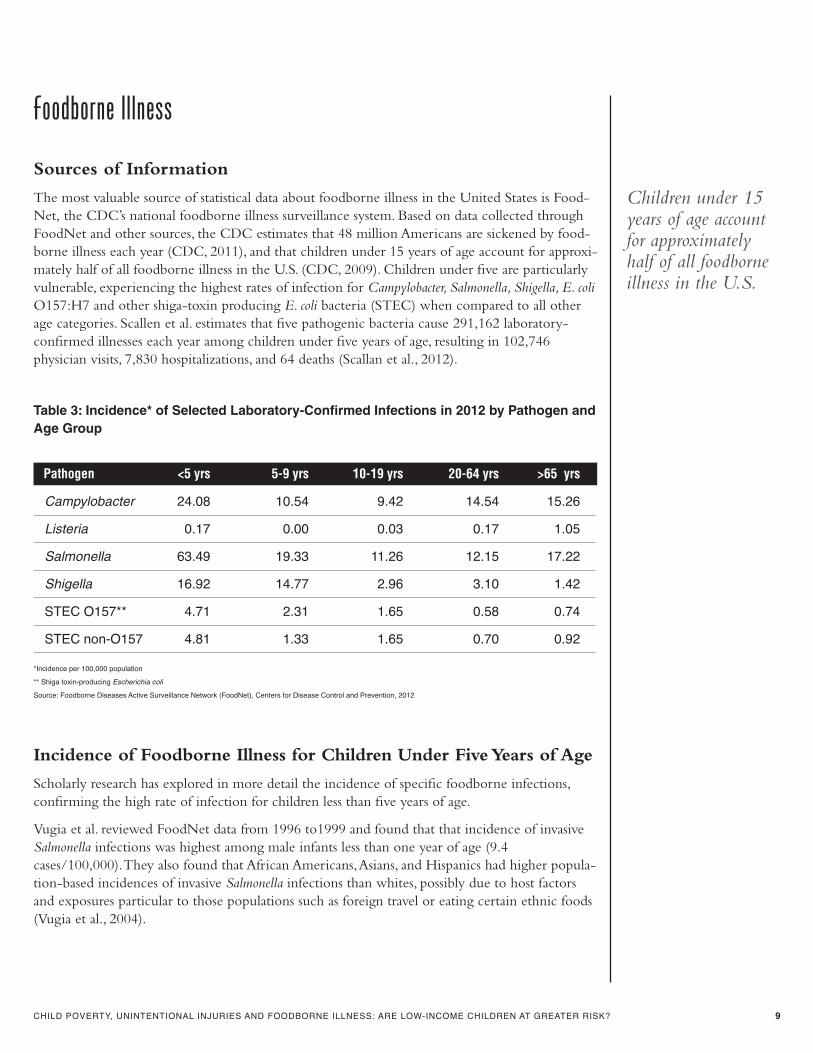
The most valuable source of statistical data about foodborne illness in the United States is Food-Net, the CDC’s national foodborne illness surveillance system. Based on data collected throughFoodNet and other sources, the CDC estimates that 48 million Americans are sickened by food-borne illness each year (CDC, 2011), and that children under 15 years of age account for approxi-mately half of all foodborne illness in the U.S. (CDC, 2009). Children under five are particularlyvulnerable, experiencing the highest rates of infection for Campylobacter, Salmonella, Shigella, E. coliO157:H7 and other shiga-toxin producing E. coli bacteria (STEC) when compared to all otherage categories. Scallen et al. estimates that five pathogenic bacteria cause 291,162 laboratory-confirmed illnesses each year among children under five years of age, resulting in 102,746physician visits, 7,830 hospitalizations, and 64 deaths (Scallan et al., 2012).
*Incidence per 100,000 population
** Shiga toxin-producing Escherichia coli
Source: Foodborne Diseases Active Surveillance Network (FoodNet), Centers for Disease Control and Prevention, 2012
Incidence of Foodborne Illness for Children Under FiveYears of Age
Scholarly research has explored in more detail the incidence of specific foodborne infections,confirming the high rate of infection for children less than five years of age.
Vugia et al. reviewed FoodNet data from 1996 to1999 and found that that incidence of invasiveSalmonella infections was highest among male infants less than one year of age (9.4cases/100,000).They also found that African Americans,Asians, and Hispanics had higher popula-tion-based incidences of invasive Salmonella infections than whites, possibly due to host factorsand exposures particular to those populations such as foreign travel or eating certain ethnic foods(Vugia et al., 2004).
CHILD POVERTY, UNINTENTIONAL INJURIES AND FOODBORNE ILLNESS: ARE LOW-INCOME CHILDREN AT GREATER RISK? 9
Table 3: Incidence* of Selected Laboratory-Confirmed Infections in 2012 by Pathogen andAge Group
Pathogen <5 yrs 5-9 yrs 10-19 yrs 20-64 yrs >65 yrs
Campylobacter 24.08 10.54 9.42 14.54 15.26
Listeria 0.17 0.00 0.03 0.17 1.05
Salmonella 63.49 19.33 11.26 12.15 17.22
Shigella 16.92 14.77 2.96 3.10 1.42
STEC O157** 4.71 2.31 1.65 0.58 0.74
STEC non-O157 4.81 1.33 1.65 0.70 0.92
Children under 15years of age accountfor approximatelyhalf of all foodborneillness in the U.S.
More recently, Chai et al. found that from 2004 to 2009, infections from Salmonella Enteritidiswere highest among children four years of age and younger (4.7-6.9 cases/100,000). Chai identi-fied an increase in incidence of 48 percent from 2004 to 2009 for children less than one year ofage and an increase of 44 percent for children one to four years of age (Chai et al., 2012).
Samuel et al. found similar results in their 2004 review of FoodNet data on Campylobacter infec-tions: the highest incidence of Campylobacter infections was in infants under one year of age (56.2cases/100,000 population) and children aged 1-4 years (41.2 cases/100,000).
In 2012, Ong et al. reported a marked decline in the incidence of Yersinia enterocolitica amongAfrican-American children under five years of age. Likely modes of transmission were related toproximity of young children to food preparation or food preparers handling contaminated porkproducts.The study noted an 83 percent reduction in incidence from 1996 to 2009 in Georgiaand suggested that targeted educational efforts in the state may have contributed to the decline.
In a separate study, Ong and colleagues reviewed the incidence of postdiarrheal hemolytic uremicsyndrome (HUS) from 2000 to 2007. HUS is the most common cause of acute kidney failureamong U.S. children and is most often a result of E. coli infection in young children. Ong foundthat 66 percent of HUS cases were in children younger than five years old (incidence rate of 1.9cases/100,000); of those 64 percent were in children younger than two years (Ong et al., 2012).
Researchers and medical professionals generally agree that children are more susceptible to food-borne illness for several reasons. Children’s immune systems are not yet fully developed so theirability to fight infection is reduced. Children have a lower body weight than adults which meansa smaller dose of a pathogen can sicken them.They have limited control over their diet and re-lated food safety risks. Finally, they have reduced stomach acid production which can sometimeskill harmful bacteria in adults (Center for Foodborne Illness Research & Prevention, 2009).
However, factors which might influence a greater susceptibility for low-income children are notwell studied.The limited research available documents some environmental and human factorsthat could indicate an increased risk for foodborne illness for low-income populations. Otherresearch highlights risk-taking behaviors of high-income populations and reporting biases whichcomplicate correlations between income and increased risk of foodborne illness.
Socioeconomic Aspects of Incidence of Foodborne Illness
Academic research has long highlighted a correlation between socioeconomic status and health(Feinstein, 1993). Several studies have found that at the individual, household, and communitylevels, economic deprivation increases the likelihood of bacterial, parasitic, and viral infections.Asmall number of studies in the U.S. and in other developed countries have found that people liv-ing in high-poverty areas experience higher rates of particular foodborne illnesses (Borgnolo etal., 1996; Bytzer et al., 2001). Low-income individuals also tend to have poorer access to medicalcare, lower nutritional status, and greater exposure to environmental threats which can impacttheir ability to fight foodborne infections (Klerman, 1991; Starfield, 1992).
Two additional studies demonstrate links between socioeconomic factors and foodborne illness.While these studies do not focus specifically on low-income children, they do point to a greaterlikelihood that children in low-income communities may be at greater risk for foodborne disease.
In 2009, Chang, Groseclose, Zaidi, & Braden conducted an ecological analysis of sociodemo-graphic factors associated with the incidence of illness from Salmonella, Shigella and E. coliO157:H7 and found a “complex relationship between community characteristics and the dynam-
10 CHILD POVERTY, UNINTENTIONAL INJURIES AND FOODBORNE ILLNESS: ARE LOW-INCOME CHILDREN AT GREATER RISK?
Chai found thatfrom 2004-2009,infections fromSalmonellaEnteritidis werehighest amongchildren four years ofage and younger.
Low-incomeindividuals tend tohave poorer access tomedical care, lowernutritional status,and greater exposureto environmentalthreats, which canimpact their abilityto fight foodborneinfections.
ics of disease transmission.” Particularly for salmonellosis and shigellosis, they found that “measuresof race, ethnicity, place of residence, age group, poverty, unemployment, and urbanization” werethe county-level characteristics most closely associated with incidence of these infections.The in-cidence of Salmonella infections was higher in communities with a higher percentage of childrenunder five years of age, and in communities with more African American and Hispanic residents.The incidence of shigellosis was higher in communities with more children under five years ofage, more residents living below the poverty level, and more Hispanic residents.
A 2010 study by Patrick, Zansky, Hurd, & Scallan surveyed parents of children younger than threeyears to identify risk factors for Salmonella and Campylobacter infections in infants.The study iden-tified children who rode in shopping carts as most likely to be exposed to infection; however theresearchers also identified income less than $55,000 and Hispanic ethnicity as being associatedwith exposure.
Factors Influencing Incidence
Much of the available research explicitly examining links between income and food safety has fo-cused on identifying barriers to assuring safe food for low-income consumers. Limited researchconducted on the microbial quality of food available to lower-income and minority populationsin retail stores has found reduced access to safe food, particularly fresh produce, dairy, and eggs.
A 2011 study by Signs, Darcey, Carney, Evans, & Quinlan found that egg samples from low-in-come census tracts had higher internal temperatures and were more often unrefrigerated thaneggs from high-income tracts.The same study found that milk samples from Hispanic and lower-income neighborhoods had a higher aerobic plate count (APC), an indicator of potential temper-ature abuse and shelf life, than milk in high-income areas. Ready-to-eat produce was more likelyto be found in high-income census tracts, but when available in low-income areas, it had highrates of fecal coliform contamination.
In 2010, Koro,Anandan, & Quinlan found higher microbial indicator counts on produce inlower-income neighborhoods in Philadelphia. Higher rates of APC and yeast and mold werefound on ready-to-eat greens and strawberries in addition to higher rates of yeast and mold oncucumbers, although no difference was found for microbial counts for broccoli, watermelon, or-ange juice or milk. Contamination rates for meat and poultry products studied were found to besimilar in both low- and high-income census tracts.
Numerous studies, mainly in the nutrition field, have identified a lack of access to grocery storesand supermarkets in low-income areas (McKinnon et al., 2009; Moore & Diez Roux, 2006). Fre-quently, the predominant source of food items in these neighborhoods is small corner marketswhich are often challenged in assuring adequate food safety for the items they sell. Poor infra-structure, lack of refrigeration facilities, language barriers, pest infestation, limited resources, andsmall or undertrained staff have been identified as barriers to adequate food safety regulationcompliance. Other barriers that have been identified include crime, employee turnover, a lack oftrust in the regulations or compliance officers, and a lack of understanding of food safety regula-tions (Pothukuchi, Mohamed, & Gebben, 2008;Yapp & Fairman, 2006; Koro et al., 2010).
Retail food establishments such as fast food and carry out restaurants in low-income areas mayalso face challenges in maintaining adequate food safety. One study of inspection scores for retailfood establishments in Detroit found that for each additional ten percent of individuals below thepoverty line, there was an increase of 0.6 critical violations (Pothukuchi et al., 2008).
In 2011, Darcey and Quinlan found mixed results in an analysis of critical health code violation
CHILD POVERTY, UNINTENTIONAL INJURIES AND FOODBORNE ILLNESS: ARE LOW-INCOME CHILDREN AT GREATER RISK? 11
Researchers foundthat “measures ofrace, ethnicity, placeof residence, agegroup, poverty,unemployment, andurbanization” werethe county-levelcharacteristics mostclosely associatedwith incidence ofSalmonella andShigella infections.
Egg samples fromstores in low- incomecensus tracts hadhigher internaltemperatures andwere more oftenunrefrigerated thaneggs from stores inhigh-income tracts.

rates of food service facilities in Philadelphia using Geographic Information Systems technology.Overall, food service facilities in high poverty areas had a greater number of facilities with at leastone critical health code violation and had more frequent inspections than facilities in lowerpoverty areas. However, facilities in lower poverty areas had a higher average number of criticalhealth code violations per inspection, possibly due to underlying factors affecting inspection fre-quency and subjectivity of health inspectors.
Another factor which may play a role in the risk of foodborne illness for low-income children isthe level of safe food handling behaviors practiced in the home. Parents or caregivers of youngchildren play a particularly important role as a parent’s knowledge and practice of safe food han-dling can impact the likelihood that his/her children will acquire a foodborne illness.
Kwon and colleagues conducted a survey of participants in the Special Supplemental Women, In-fants and Children (WIC) Program to assess food safety knowledge and food handling behaviorsof low-income populations.They found that the least commonly reported safe food handlingpractices among low-income participants included refrigerating perishable foods within twohours of cooking, using a food thermometer, thawing foods safely, and properly sanitizing cuttingboards (Kwon,Wilson, Bednar, & Kennon, 2008).These types of practices are not exclusive tolow-income consumers; the FDA reports variation in safe food handling practices for all con-sumers in its regular safe food handling survey (Lando & Carlton, 2011). Barriers to proper foodhandling practices include a general lack of knowledge, difficulty changing habits because theyare learned and practiced since childhood, lack of affordability, and difficulty changing foodpreparation routine (Trepka, Murunga, Cherry, Huffman & Dixon, 2006).
Complicating the limited research on the correlation between income and food safety are studieswhich indicate that groups with higher socioeconomic status are more likely to contract a food-borne pathogen or gastrointestinal illness. Researchers generally agree that such findings are mostlikely attributable to health-seeking behaviors of higher-income populations and greater access tohealth care services. Residents in low-income neighborhoods who are uninsured may be reluc-tant to seek medical attention which means that illnesses from low-income populations may beunder-represented in foodborne illness statistics.
Younus and colleagues, using Geographic Information Systems technology to map trends inSalmonella infections in relation to neighborhood income levels in Michigan, found that residentsof high education areas had higher rates of Salmonella infection.They suggested that residents inhigher education blocks may seek medical care for even mild to moderate symptoms of illnesswhich would increase the likelihood that their illness would be reported to the surveillancesystem (Younus et al., 2007).
Researchers also identify behavioral differences between high- and low-income groups. Higher-income consumers are more likely to consume higher-risk foods than their lower-income coun-terparts, particularly raw eggs, clams, oysters, fish and undercooked hamburger (Yang et al., 1998;Klontz,Timbo, Fein, & Levy, 1995; Roseman & Kurzynske, 2006). Raw or undercooked foods aremore closely associated with foodborne illness because of the lack of an adequate cooking stepwhich could kill pathogens that may be on or in the product. Fresh produce, which is often con-sumed raw and which has been linked to a number of foodborne illness outbreaks in recent years,is also consumed in greater levels by high-income populations than lower-income populations.
Higher-income consumers may not follow adequate food handling practices either. In a meta-analysis of studies of consumer food safety knowledge, Patil and colleagues found that high-in-come individuals reported greater consumption of raw foods, less knowledge of hygiene andpoorer cross-contamination practices (Patil, Cates & Morales, 2005).
12 CHILD POVERTY, UNINTENTIONAL INJURIES AND FOODBORNE ILLNESS: ARE LOW-INCOME CHILDREN AT GREATER RISK?
Residents inlow-incomeneighborhoods whoare uninsured may bereluctant to seekmedical attentionwhich means thatillnesses from low-income populationsmay beunderrepresented infoodborne illnessstatistics.
Higher-income consumers may adopt a more risk-taking approach to particular foods or havegreater confidence in government and industry assurances of food safety. Lower-income con-sumers may be more likely, because of resource constraints, to purchase more canned fruits andvegetables and canned meats. Since these products are cooked they tend to be lower risk than rawfood products, offering something of a protective effect from exposure to higher risk foods. How-ever, it is important to note that ongoing efforts to increase access to and consumption of freshfruits and vegetables among lower-income consumers for improved nutrition outcomes may alterthis dynamic.
Data Gaps
Younus and colleagues have noted that the lack of data on individual level socioeconomic factorsin most U.S. disease surveillance systems “reduces the usefulness of surveillance data for these pa-rameters,” such as household income, education or employment (Younus et al., 2007).The CDCcollects basic demographic information in its foodborne disease surveillance system such as gen-der, age, ethnicity, and FoodNet location, but does not collect information on income, hinderingthe ability to analyze the impact of foodborne illness on populations of differing income levels.
Hospitals, medical providers, and state and local reporting agencies should be encouraged to col-lect data on income when cases of foodborne illness are diagnosed and reported. If privacy issuesarise from collecting income information, zip code information, or other data verifying geo-graphical location might be useful. Linking reported data to census tracts or census block groupscould help researchers better understand the relationship between foodborne illness and socio-economic status.While Geographic Information Systems technology has been used to mapcommunity disease risk and incidence within particular communities, for example, its use hasbeen limited in research on foodborne illness and food safety (Darcey & Quinlan, 2011).
A more concerted effort to collect income data in foodborne illness surveillance systems couldbetter inform researchers, policymakers, and other stakeholders about the particular risks facinglow-income populations. Enhanced data about these populations could lead to more targeted, andhopefully more effective, approaches to reduce foodborne illness risk including policy changes,enforcement efforts and education campaigns.
Summary and ImplicationsResearch strongly suggests that, in general, children are at greater risk of product-related injury andfoodborne illness than adults, and children from low-income households are at greater risk thanother children.The most authoritative studies on the subject examine local or state sources of infor-mation about injury, illness, and related mortality.This research has found that low-income childrenare at greater risk not only from unintentional injuries generally but also from pedestrian, fire, burn,drowning, and fall injuries than are other children.The research also shows that low-income chil-dren may be more likely to be exposed to conditions associated with foodborne illness.
These potentially hazardous conditions are found in the home and in the community. Housingunits tend to be older and less well-maintained, creating hazards including fire, asphyxiation, falls,electrical shocks, and unsafe children’s products ranging from cribs to toys. Play areas are lessaccessible and less safe. In urban areas, these areas include streets with inadequate traffic controls.Accessible food stores tend to be older and smaller, with less reliable refrigeration, poorer pest
CHILD POVERTY, UNINTENTIONAL INJURIES AND FOODBORNE ILLNESS: ARE LOW-INCOME CHILDREN AT GREATER RISK? 13
Hospitals, medicalproviders, and stateand local reportingagencies should beencouraged to collectdata on income whencases of foodborneillness are diagnosedand reported.
Research stronglysuggests that, ingeneral, children areat greater risk ofproduct-relatedinjury and foodborneillness than adults,and children fromlow-incomehouseholds are atgreater risk thanother children.
control, and less well-trained employees. In addition, medical care, in both rural and urban areas,can be less accessible.
These and other conditions contribute to factors more directly related to the children and theirparents. Parents are less knowledgeable about childproofing a house from safety risks or preparingfood safely.They are more likely to smoke, increasing fire and burn risks.And they may be lesslikely to seek prompt medical attention for injuries and illnesses.
Data Gaps Need to be Addressed
A key finding from our review of the academic literature on unintentional injuries and food-borne illness is that significant data gaps exist.Academic researchers have documented increasedrisks of injury and foodborne illness to poorer children in a number of important studies, butbroader national data connecting these two factors is unavailable.These gaps exist because the keydatabases on illness, injuries and related deaths either do not contain information on income orfail to include necessary correlations between socioeconomic status, age, and injury.
National data collection efforts on unintentional injuries and foodborne illness could be ex-panded to include income or other data that could serve as a proxy for income so that the impor-tant connections between these factors can be better documented and understood. Federalagencies such as the CDC and the CPSC should work with reporting institutions, state and localagencies and other entities to explore the feasibility of collecting this type of information. Suchdata could prove useful for researchers and practitioners to better understand the risks and relatedfactors of injury and illness on low income populations in the U.S.The data could also point tonew ways to reduce the incidence of injury and illness.
Our review of the literature also suggests opportunities for stakeholders, including health careprofessionals, health and safety organizations, low-income and minority groups, childrens’ advo-cacy organizations, researchers, and regulators, to come together to systematically examine all po-tential sources of information regarding safety issues affecting low-income children. Prioritizingcollection of additional data, seeking new ways of analyzing existing data, identifying potential so-lutions for mitigating hazards, and strengthening relationships among interested organizationswould be the goal of such a convening.We hope that this report might spur creative collabora-tions and new engagements to raise awareness about the many safety impacts low-income chil-dren face and how best to prevent these impacts.
Traditional mechanisms for affecting change have included policy changes, home, environmentaland community interventions, product redesign, and educational outreach efforts. Income-specificdata would likely enhance the effectiveness of such efforts to prevent and reduce unintentionalinjuries and reduce illnesses caused by contaminated food.Activities could be better targetedbased on the particular mechanism of injury or illness; specifically crafted to the populationimpacted; and delivered more effectively to the discrete target audience.
14 CHILD POVERTY, UNINTENTIONAL INJURIES AND FOODBORNE ILLNESS: ARE LOW-INCOME CHILDREN AT GREATER RISK?
National datacollection efforts onunintentional injuriesand foodborne illnesscould be expanded toinclude income orother data that couldserve as a proxy forincome so that theimportant connectionsbetween these factorscan be betterdocumented andunderstood.
Access to income-specific data wouldlikely increase theeffectiveness ofpolicy changes,environmentalinterventions andeducational efforts toprevent and reduceunintentionalinjuries and reduceillnesses caused bycontaminated food.
References
Unintentional Injuries
Addy, S., & Wright,V.R. (2012). Basic Facts about Low-income Children, 2010: Children Under 18. NewYork: National Center for Children in Poverty, Columbia University.
Agran, P.F.,Anderson, C.L.,Winn, D.G. (2004).Violators of a Child Passenger Safety Law. Pediatrics, 114(1).
Alwash, R., & McCarthy, M. (1988).Accidents in the home among children under 5: ethnic differences or social disadvantage? British Medical Journal, 296, 1450-1453.
Bishai, D., McCauley, J.,Trifiletti, L.B., McDonald, E.M., Reeb, B.,Ashman, R., & Carlson Geilen, A. (2002).The Burden of Injury in Preschool Children in an Urban MedicaidManaged Care Organization. Ambulatory Pediatrics, 2, 279-283.
Committee on Injury,Violence, and Poison Prevention. (2009). Pedestrian Safety. Pediatrics, 124(2).
Danseco, E.R., Miller,T.R., & Spicer, R.S. (2000). Incidence and Costs of 1987-1994 Childhood Injuries: Demographic Breakdowns. Pediatrics, 105(2).
Durkin, M.S., Davidson, L.L., Kuhn, L., O’Connor, P., Barlow, B. (1994). Low-Income Neighborhoods and the Risk of Severe Pediatric Injury: A Small-Area Analysis inNorthern Manhattan. American Journal of Public Health, 84.
Grossman, D.C. (2000).The History of Injury Control and the Epidemiology of Child and Adolescent Injuries.The Future of Children: Unintentional Injuries in Childhood,10(1), 23-52.
Health Resources and Services Administration (2012). Poison Help Campaign General Population Survey.
Injury Free Coalition for Kids, www.injuryfree.org/about.cfm.
Laflamme, L., & Diderichsen, F. (2000). Social difference in traffic injury risks in childhood and youth—a literature review and a research review and a research agenda. InjuryPrevention, 200(6), 293-298.
Mierley M.C., & Baker, S.P. (1983). Fatal house fires in an urban population. Journal of the American Medical Association, 249 (11), 1466-1468.
Nagaraja, J., Menkedick, J., Phelan K. J.,Ashley, P., Zhang, X., & Lanphear, B.P. (2005). Deaths from Residential Injuries in US Children and Adolescents, 1985-1997. Pediatrics,116(2), 454- 461.
National Center for Health Statistics,“Summary Health Statistics for the U.S. Population: National Health Interview Survey, 2010, series 10, Number 251, December 2011, page 1.
National Research Council. Children’s Health, the Nation’sWealth:Assessing and Improving Child Health.Washington, DC:The National Academies Press, 2004.
NationalVital Statistics System, United States, http://www.cdc.gov/nchs/nvss.htm
Nersesian,W.S., Petit, M.R., Shaper, R., Lemieux, D., Naor, E. (1985). Childhood Death and Poverty:A Study of All Childhood Deaths in Maine, 1976 to 1980. Pediatrics, 75(1).
Pomerantz,W. J., Dowd, D., & Buncher, R.C. (2001). Relationship Between Socioeconomic Factors and Severe Childhood Injuries. Journal of Urban Health, 78(1), 141-151.
Pressley, J.C., Barlow, B., Durkin, M., Jacko, S.A., Roca Dominguez, D., & Jonson, L. (2005).A National Program for Injury Prevention in Children and Adolescents:The InjuryFree Coalition for Kids. Journal of Urban Heath: Bulletin of the NewYork Academy of Medicine, 82(3), 389- 402.
Pressley, J.C., Barlow, B., Kendig,T., & Paneth-Pollak, R. (2007).Twenty-YearTrends in Fatal Injuries toVeryYoung Children:The Persistence of Racial Disparities. Pediatrics, 119(4).
Runyan, C.W., Johnson, R.M.,Yang, J.,Waller,A.E., Perkis, D., Marshall, S.W., Coyne-Beasley,T., McGee, K.S. (2005). Risk and Protective Factors for Fires, Burns, and CarbonMonoxide Poisoning in U.S. Households. American Journal of Preventive Medicine, 28(1), 102-108.
Santer, L.J., Stocking, C.B. (1991). Safety Practices and Living Conditions of Low-Income Urban Families. Pediatrics, 88(6).
Scheidt, P.C., Harel,Y.,Trumble,A.C., Jones, D.H., Overpeck, M.D., & Bijur, P.E. (1995.) The Epidemiology of Nonfatal Injuries Among US Children andYouth. American Journalof Public Health, 85.
Suecoff, S.A.,Avner, J.R., Chou, K.J., & Crain, E.F. (1999).A Comparison of NewYork City Playground Hazards in High- and Low-Income Areas. Archives of Pediatrics &Adolescent Medicine; 153, 363-6.
Wise, P.H.,Kotelchuck,M.,Wilson,M. I.,& Mills,M. (1985).Racial and Socioeconomic Disparities in Childhood Mortality in Boston.New England Journal of Medicine 313(6), 360-366.
Foodborne Illness
Borgnolo, G., Barbone, F., Scornavacca, G., Franco, D.,Vinci,A., & Iuculano, F. (1996).A case-control study of salmonella gastrointestinal infection in Italian children. ActaPaediatrica, 85(7), 805-809.
Bytzer, P., Howell, S., Leemon, M.,Young, L., Jones, M., & Talley, N. (2001). Low socioeconomic class is a risk factor for upper and lower gastrointestinal symptoms:A population-based study in 15,000 Australian adults. Gut, 49, 66-73.
Centers for Disease Control and Prevention. (2009). Foodborne active disease surveillance network (FoodNet): 2009 surveillance report. Retrieved from://www.cdc.gov/foodnet/PDFs/FoodNetAR2009_FINAL.pdf
Centers for Disease Control and Prevention. (2011). CDC estimates of foodborne illness in the United States. Retrieved from http://www.cdc.gov/foodborneburden/2011-foodborne-estimates.html
Centers for Disease Control and Prevention. (2013).“Incidence and Trends of Infection with Pathogens
Transmitted Commonly Through Food — Foodborne Diseases Active Surveillance Network, 10 U.S. Sites, 1996–2012” Morbidity and MortalityWeekly Report 62(15);283-287,April 19, 2013.
CHILD POVERTY, UNINTENTIONAL INJURIES AND FOODBORNE ILLNESS: ARE LOW-INCOME CHILDREN AT GREATER RISK? 15
Center for Foodborne Illness Research & Prevention. (2010).The long-term health outcomes of selected foodborne pathogens. Retrieved fromhttp://www.makeourfoodsafe.org/tools/assets/files/CFI-Final-report.pdf
Chair, S.J.,White, P.L., Lathrop, S.L., Solghan, S.M., Medus, C., et al, (2012). Salmonella eterica Serotype Enteritidis: Increasing Incidence of Domestically Acquired Infections.Clinical Infectious Diseases, 54(S5), S488-97.
Chang, M., Groseclose, S.L., Zaidi,A.A., & Braden, C.R. (2009).An ecological analysis of sociodemographic factors associated with the incidence of salmonellosis, shigellosis andE. coli O157:H7 infections in US counties. Epidemiology & Infection, 137, 810-20.
Darcey,V.L., Quinlan, J.J. (2011). Use of Geographic Information Systems Technology to Track Critical Health CodeViolations in Retail Facilities Available to Populations ofDifferent Socioeconomic Status and Demographics. Journal of Food Protection, 74(9), 1524-1530.
Feinstein, J.S. (1993).The relationship between socioeconomic status and health:A review of the literature. The Milbank Quarterly, 71(2), 279-322.
Imhoff, B., Morse, D., Shiferaw, B., Hawkins, M.,Vugia, D., Lance-Parker, S. et al. (2004). Burden of self-reported acute diarrheal illness in FoodNet surveillance areas, 1998–1999.Clinical Infectious Diseases, 38(Suppl. 3), S219-26.
Klerman, L. (1991). Alive and well? A research and policy review of health programs for poor young children. NewYork: National Center for Children in Poverty, ColumbiaUniversity.
Klontz, K.C.,Timbo, B., Fein, S., & Levy,A. (1995). Prevalence of selected food consumption and preparation behaviors associated with increased risks of food-borne disease.Journal of Food Protection, 58, 927-30.
Koro,M.E.,Anandan, S.,& Quinlan, J.J. (2010).Microbial quality of food available to populations of differing socioeconomic status.American Journal of Preventative Medicine, 38(5), 478-81.
Kwon, J.,Wilson,A.N.S., Bednar, C., & Kennon, L. (2008). Food safety knowledge and behaviors of women, infant, and children (WIC) program participants in the United States.Journal of Food Protection, 71(8), 1651-8.
Lando,A., Carlton, E. (2011). 2010 Food Safety Survey: Key Findings and Topline Frequency Report. Food and Drug Administration website, accessed September 19, 2012.
Mead, P.S., Slutsker, L., Dietz,V., McCaig, L.F., Bresee, J.S., Shapiro, C. et al., (1999). Food-related illness and death in the United States. Emerging Infectious Diseases, 5(5), 607-25.
McKinnon, R.A., Reedy, J., Morrisette, M.A., Lytle, L.A., &Yaroch,A.L. (2009). Measures of the food environment:A compilation of the literature, 1990-2007. American Journal ofPreventative Medicine, 38, 478-81.
Moore, L.V., & Diez Roux,A.V. (2006).Associations of neighborhood characteristics with the location and type of food store. American Journal of Public Health, 96, 325-31.
Ong, K.L., Gould, L.H., Chen, D.L., et al. (2012). Changing Epidemiology ofYersinia enterocolitica Infections: Markedly Decreased Rates inYoung Black Children, FoodborneDisease Active Surveillance Network (FoodNet), 1996-2009. Clinical Infectious Diseases, 54(Suppl. 5), S385-390.
Ong, K.L.,Apostal, M., Comstock, N., Hurd, S.,Webb,T.H., et al, (2012). Strategies for Surveillance of Pediatric Hemolytic Uremic Syndrome: Foodborne Diseases ActiveSurveillance Network (FoodNet), 2000-2007. Clinical Infectious Diseases, 54(S5), S424-31.
Patil, S.R., Cates, S., Morales, R. (2005). Consumer food safety knowledge, practices, and demographic differences: findings from a meta-analysis. Journal of Food Protection Sep68(9), 1884-94.
Patrick, M.E., Zansky, B.E., Hurd, S.E., Scallan, E. (2010). Riding in Shopping Carts and Exposure to Raw Meat and Poultry Products: Prevalence of, and Factors Associated with,This Risk Factor for Salmonella and Campylobacter Infection in ChildrenYounger Than 3Years. Journal of Food Protection, 73(6), 1097-1100.
Pothukuchi, K., Mohamed, R., & Gebben, D.A. (2008). Explaining disparities in food safety compliance by food stores: Does community matter? Agriculture and HumanValues, 25,319-22.
Roseman, M., & Kurzynske, J. (2006). Food safety perceptions and behaviors of Kentucky consumers. Journal of Food Protection, 69, 1412-1421.
Samuel, M.C.,Vugia, D.J., Shallow, S., et al. (2004). Epidemiology of sporadic Campylobacter infection in the United States and declining trend in incidence, FoodNet 1996-1999.Clinical Infectious Diseases, 38(Suppl. 3), S165-74.
Scallan, E., Mahon, B.E., Hoekstra, R.M, Griffin, P.M. (2012). Estimates of Illnesses, Hospitalizations, and Deaths Caused by Major Bacterial Enteric Pathogens inYoung Childrenin the United States. Pediatric Infectious Disease Journal, Dec 17.
Scharff, R.L. (2012). Economic burden from health losses due to foodborne illness in the United States. Journal of Food Protection, 75(1), 123-131.
Signs, R.J., Darcey,V.L., Carney,T.A., Evans,A.A., & Quinlan, J.J. (2011). Retail food safety risks for populations of different races, ethnicities, and income levels. Journal of FoodProtection, 74(10), 1717-23.
Starfield, B. (1992). Effects of poverty on health status. Bulletin of the NewYork Academy of Medicine, 68(1), 17-24.
Trepka, M.J., Murunga,V., Cherry, S., Huffman, F.G., & Dixon, Z. (2006). Food safety beliefs and barriers to safe food handling among WIC program clients, Miami, Florida.Journal of Nutrition Education and Behavior, 38, 371-7.
Vugia, D.J., Samuel, M., Farley, M.M., et al. (2004). Invasive Salmonella Infections in the United States, FoodNet, 1996-1999: Incidence, Serotype Distribution, and Outcome.Clinical Infectious Diseases, 38(Suppl. 3), S149-56.
Yapp, C., & Fairman, R. (2006). Factors affecting food safety compliance within small- and medium-sized enterprises: Implications for regulatory and enforcement strategies. FoodControl, 17, 42-51.
Yang, S., Leff, M., McTague, D., et al. (1998). Multistate surveillance for food-handling, preparation, and consumption behaviors associated with foodborne diseases: 1995 and1996 BRFSS food-safety questions. MMWR CDC Surveill Summ, 47(4), 33-57.
Younus, M., Hartwick, E., Siddiqi,A.A.,Wilkins, M., Davies, H.D., Rahbar, M., Funk, J., & Saeed, M. (2007).The role of neighborhood level socioeconomic characteristics inSalmonella infections in Michigan (1997-2007):Assessment using geographic information systems. International Journal of Health Geographics, 6(56).
16 CHILD POVERTY, UNINTENTIONAL INJURIES AND FOODBORNE ILLNESS: ARE LOW-INCOME CHILDREN AT GREATER RISK?

CCoonnssuummeerr FFeeddeerraattiioonn ooff AAmmeerriiccaa1620 I Street, NW, Suite 200Washington, DC 20006www.consumerfed.org