Embed Size (px)
Citation preview

THIS REPORT CONTAINS ASSESSMENTS OF COMMODITY AND TRADE ISSUES MADE BY
USDA STAFF AND NOT NECESSARILY STATEMENTS OF OFFICIAL U.S. GOVERNMENT
POLICY
Date:
GAIN Report Number:
Approved By:
Prepared By:
Report Highlights:
China’s corn market is driven by a perfect storm of policy shifts, adverse weather conditions, and
logistical bottlenecks. Current corn prices are rallying to their highest levels since October 2016.
MY2017/18 corn production is forecast at 210.0 million tons, down 4 percent from MY2016/17. This
is the first full crop year since the removal of the temporary reserve program for corn and
implementation of “supply-side structural reforms” in 2016. China’s Ministry of Agriculture (MOA) is
promoting corn growers to switch to alternatives to corn for grain, such as soybeans, wheat, sweet corn,
silage corn, millet, and forage. Meanwhile, the Agricultural Development Bank of China will loan
MOA at least $450 billion (RMB 3.0 trillion) over the next three years to develop China’s agricultural
sector. China is aiming to achieve results by 2020.
Gene Kim
Bruce Zanin
2017 Processing Payments End, Dryness in Liaoning Persists
Grain and Feed Update
China - Peoples Republic of
CH17038
8/3/2017
Required Report - public distribution

Post:
Executive Summary:
China’s National Meteorological Center (CNMC) reports that drought conditions persist across central
and northern China, affecting up to 2.67 million hectares. Despite unseasonably warm and dry weather
during April and May, soil moisture and irrigation water was adequate. Summer crop development is
expected to return to normal as July monsoon rains move north from South West China. The major
exception is western Liaoning and Jilin provinces, where dry weather is impacting production yield
potential.
MY2017/18 wheat production is forecast at 130.0 million tons, unchanged from the USDA July
estimate. Wheat originating from Jiangsu and Anhui provinces is of quality far better than MY2016/17
supplies. Estimated test weights average between 75 kg per hectoliter and 79 kg per hectoliter. Despite
continued government support, common wheat production is sliding downward as government support
payments lag behind relative prices for other crops. MY2017/18 wheat imports are forecast at 3.0
million tons, unchanged from the USDA July forecast and 1.0 million tons lower than MY2016/17 on
expectations for sufficient quantity and quality of domestic supplies.
MY2017/18 corn production is forecast at 210.0 million tons, down 5.0 million tons from USDA July
forecast, and down 4 percent from MY2016/17 on policy as well as weather-driven, declines in
harvested area. Domestic spot prices bottomed at $222 per ton (RMB 1,527) in March 2017 but have
rallied to their highest levels in 10 months at $250 per ton ($1,697). Post forecasts local corn prices will
continue to rise in the short-run due to policy- and weather-driven expectations for a smaller
MY2017/18 crop. Forecast MY2017/18 corn imports are halved to 1.5 million tons from the July
USDA estimate on abundant local supplies and expectations that logistical challenges moving grain
from production to deficit markets will be resolved.
Forecast MY2017/18 corn consumption is at 238.0 million tons, unchanged from USDA’s July forecast
and up 6.0 million tons from MY2016/17 on higher feed and Food, Seed, and Industrial (FSI) use.
MY2017/18 feed and residual use is forecast higher at 166 million tons, unchanged from USDA’s July
estimate and up 4.0 million tons from MY2016/17, on competitively priced domestic supplies and
higher demand. MY2017/18 FSI consumption is forecast higher at 72.0 million tons, unchanged from
USDA July estimate and up 2.0 million tons from MY2016/17 on continued expansion of corn
processing for starch, ethanol, and other corn products.
Forecast MY2017/18 milled rice production is at 144.8 million tons, down 200,000 tons from USDA
July estimates. Despite steady rains in June and torrential monsoon rains in July, rainfall deficits remain
across South China. Forecast MY2017/18 consumption is at 143.0 million tons unchanged from the
USDA July estimates and 500,000 tons lower than MY2016/17 on stable consumption patterns and a
continued downward trend in per-capita consumption. Forecast MY2017/18 rice imports are at 5.0
million tons, unchanged from USDA July estimates and down 150,000 tons from MY2016/17
estimates. Forecast MY2017/18 rice exports are at 800,000 tons, unchanged from USDA July estimates
on policy-driven exports to Africa.
Beijing

Policy
13th
Five Year Plan Implementation Area Expands
The Ministry of Agriculture (MOA) announced that in 2017 national grain production support
payments will expand to cover an area of 6.7 million hectares – an area equivalent to 10 percent of the
State Council’s target to reserve 66.6 million hectares (100 million mu) of contiguous high-quality
arable land by 2020.
MOA’s commitment follows several years of expanded domestic support for agriculture. In 2015,
China’s central subsidy program included 10 provinces and 30 counties, receiving a total of $43.5
million (RMB 300 million). In 2016, the number of provinces expanded to 17 and included 121
counties, receiving $145 million (RMB 1.0 billion).
Minimum Support Programs for Rice and Wheat March On
In late March 2016, the government announced that it was ending the corn temporary reserve program.
MY2017/18 is the first full crop year since the removal of the temporary price reserve program for corn
and implementation of “supply side structural reforms.” To date, official statements about the
conclusion of the corn temporary reserve program and “supply side” reforms are positive.
In May 2017, State Administration of Grain began procurement of MY2017/18 wheat and rice at
minimum prices under its national reserve program. Policy experts report that wheat and rice will also
be subject to “supply side structural reforms” in the future.
Government Procurement Prices
2010 2011 2012 2013 2014 2015 2016 2017 Purchase
Period
Unmilled Rice
Early Indica 1,860 2,040 2,400 2,640 2,700 2,700 2,660 2,600 July-Sept
Japonica 2,100 2,560 2,800 3,000 3,100 3,103 3,100 3,000 Nov-Feb
Wheat
Common Wheat 1,800 1,900 2,040 2,240 2,360 2,381 2,360 2,360 May- Sept
Strong (High Protein) Wheat 1,720 1,960 2,040 2,240 2,360 2,360 2,360 2,360 May- Sept
Average Floor Price 1,760 1,960 2,040 2,240 2,360 2,360 2,360 2,360 May-Sept
Corn
Average Floor Price 1,800 1,980 2,120 2,240 2,250 2,250 N/A N/A Dec–April
Sources: NDRC and Newswires
In late March 2017, the Chinese government announced that the “target price-based direct subsidy” for
soybeans will be replaced by “market-oriented soybeans price plus a direct subsidy to soybean farmers”
in MY2017/18. This policy is similar the government’s support “temporary reserve” program for corn
from 2006 until 2015.

Wheat
Production
MY2017/18 wheat production is unchanged from the USDA July forecast at 130.0 million tons, but is
still 1.2 million tons higher than MY2016/17 on higher yield.
MY2017/18 forecast harvested area is unchanged from USDA’s July forecast at 24.2 million hectares.
Historically, wheat production has slid downward as government support payments lag behind relative
prices for other crops, such as early indica rice. However, in MY2017/18, “supply side structural
reforms” have pressured non-irrigated corn growers to switch to wheat.
Winter wheat accounts for approximately 95 percent of all wheat produced in China.
According to the Chinese National Grains and Oilseeds Information Center (CNGOIC), as of June 18,
approximately 95 percent of total winter wheat harvesting is complete. In MY2017/18, 94 percent of
China’s winter wheat will be harvested using agricultural machinery. Nationally, Chinese officials
report that MY2017/18 winter wheat was harvested one day later in June than MY2016/17.
MY2017/18 winter wheat crops have limited incidence of scab, sprout, and rust and avoided most pest
and disease pressure.
Consumption
Total wheat consumption in MY2017/18 is forecast at 114.0 million tons, down 2.0 million tons from
the USDA July forecast on lower feed use.
MY2017/18 feed use is forecast at 11.0 million tons, down 2.0 million tons from the July USDA
estimate. Wheat use for feed is no longer price competitive due to relatively smaller supplies of new
crop feed-quality wheat.
Forecast MY2017/18 wheat food, seed and industrial (FSI) consumption is unchanged from USDA’s
July forecast at 103 million tons, up 1.0 million tons from MY2016/17.
Early reports from Hubei, Hebei, Henan, and Hunan provinces indicate that MY2017/18 winter wheat
quality is better than MY2016/17. Wheat originating from Jiangsu and Anhui provinces is of far better
quality than MY2016/17 supplies. Estimated test weights average between 75 kg per hectoliter and 79
kg per hectoliter.
As MY2017/18 domestic supplies enter the market, government purchases have restricted available
supplies on the market. Since April and May, prices jumped $30 per ton to between $360 and $388 per
ton (RMB 2,450 to 2,640). High protein wheat supplies remain thin.
Wholesale Wheat Spot Prices in Major Markets
Province Common Wheat Strong Wheat
--RMB per ton-- --$ per ton-- --RMB per ton-- --$ per ton--
Hebei 2,400 $350 2,580 $377
Henan 2,360 $347
Hubei 2,200 $324
Shandong 2,360 $347 2,580 $377
Jiangsu 2,540 $372
Sources: Industry sources
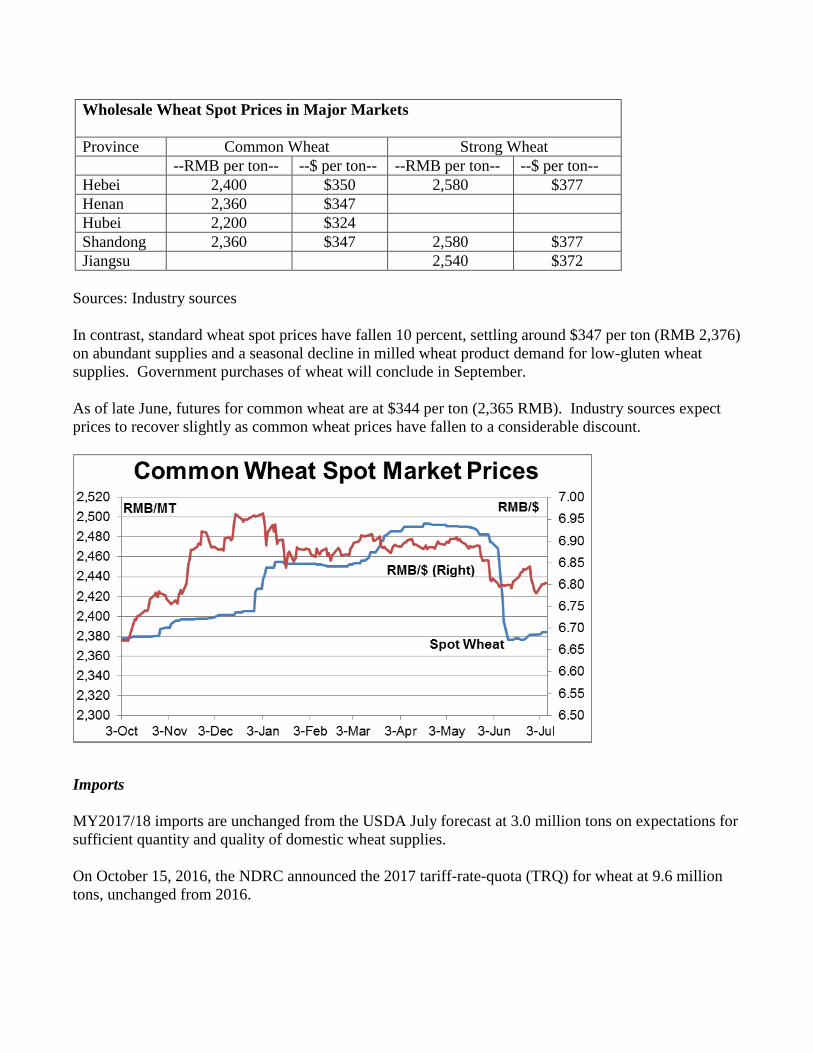
In contrast, standard wheat spot prices have fallen 10 percent, settling around $347 per ton (RMB 2,376)
on abundant supplies and a seasonal decline in milled wheat product demand for low-gluten wheat
supplies. Government purchases of wheat will conclude in September.
As of late June, futures for common wheat are at $344 per ton (2,365 RMB). Industry sources expect
prices to recover slightly as common wheat prices have fallen to a considerable discount.
Imports
MY2017/18 imports are unchanged from the USDA July forecast at 3.0 million tons on expectations for
sufficient quantity and quality of domestic wheat supplies.
On October 15, 2016, the NDRC announced the 2017 tariff-rate-quota (TRQ) for wheat at 9.6 million
tons, unchanged from 2016.

China’s 2017 Tariff Rate Quota Policies for Wheat
Commodity
TRQ
Volume
(MT)
Private
Allocation
State-Owned
Enterprise
Allocation
In-
Quota
Duty
Out-of-
Quota
Duty
Wheat 9,636,000 10% 90% 1% 65%
Source: National Development and Reform Commission (NDRC)
MY2017/18 out-of-quota imports are not expected to be significantly large due to the high quality of the
domestic crop. Buyers typically apply relatively lower in-quota tariffs for TRQ allocations on higher
value wheat varieties such as U.S. Hard Red Spring and Canadian Spring Wheat, and relatively higher
out-of-quota imports for lower value wheat varieties such as Soft White Wheat or Australian White
Wheat. Over the past three years, the private quota volume has been fully subscribed.
From November 2016 to March 2017, speculative buying of imported high-protein wheat was both
under the quota and out-of-quota. From January to March 2017, China imported as much as 50 percent
of total imports out-of-quota.
MY2016/17 wheat imports are estimated at 3.6 million tons, down 800,000 tons from USDA’s July
estimate on updated trade data.
Australia led all other exporters, shipping half of all wheat volumes to China, followed by the United
States, Canada, and Kazakhstan. The United States shipped about one-third of total deliveries,. U.S.
Hard Red Winter (HRW) wheat shipments account for about 15 percent of MY2016/17 imports. U.S.-
origin high protein wheat import landed quotes to Shanghai average $270 to $280 per ton (RMB 1,863
to 1,932).
South China is the leading importer of both high-protein, strong wheat and high-quality common wheat
varieties. Buyers in South China are much more receptive to higher priced quotes for high-quality
HRW at $585 to $730 per ton (RMB 4,000 to 5,000) than other regions in China.
According to China Customs, imports from October 2016 to May 2017 totaled 2.7 million tons.
On February 25, Kazakhstan shipped its first containerized shipments of wheat via freight rail to Xi’an
China. China Customs data indicate that Kazakhstan wheat shipments have reached at least 40,000 tons
per month since February 2017.
On April 9, 2017, China announced the first shipment of 500 tons of spring wheat via freight rail from
Krasnoyarsk, Russia to Manzhouli, Inner Mongolia. COFCO reports that it intends to import between
1.0 million and 2.0 million tons of wheat from Russia annually.
Exports
MY2017/18 wheat exports are unchanged from USDA’s July forecast at 800,000 tons, based on in-kind
food assistance from the Government of China to Africa and the Middle East.

Stocks
MY2017/18 wheat ending stocks are projected at 128.4 million tons, up slightly from USDA’s July
forecast due to higher production and declining consumption.
Although the State Administration of Grain expanded wheat procurement volumes in 2016/17, overall
stocks are forecast lower. Industry sources report that commercial stocks are low.
In Jiangsu and Hubei Provinces, the minimum purchase price of common wheat was announced in early
June according to the following price and quality specifications.
China’s State Administration of Grain
Standards Third-Class Wheat
Minimum Price $171 per ton (1,180 RMB)
Test Weight/Bulk Density 75 – 77 kg per hectoliter
Moisture 12.5%
Foreign Matter 1%
Damaged Kernels 8%
Government purchases of wheat will conclude in September. MY2018/19 minimum support prices will
be announced in October 2017.
MY2016/17 wheat stocks are estimated at 110.2 million tons, down 800,000 tons from USDA July
estimates on lower-than-expected imports.
On September 30, 2016, the State Administration of Grain reported that total procurement for
MY2016/17 reached 75.8 million tons, about 9.5 million tons higher than last year. In 2016/17, about
81 percent of State Administration of Grain wheat stocks originated from four of the most weather-
affected provinces: Jiangsu, Hubei, Henan, and Anhui.
Corn
Production
MY2017/18 corn production is forecast at 210.0 million tons, down 5.0 million tons from USDA’s July
forecast, as high temperatures negatively impact yield potential.
MY2017/18 corn harvested area is unchanged from USDA’s July estimate at 35.0 million hectares.
MY2017/18 area is forecast down 1.8 million hectares, or nearly 5 percent lower than MY2016/17, on
policy-driven declines in harvested area.
China’s corn growers typically plant starting on May 1. Lower planted area in Heilongjiang province
alone accounts for more than one-third of the decline in national harvested area. MOA promotes corn

growers to switch from planting corn for grain to soybeans (nearly half of the total change in area),
wheat, sweet corn, silage corn, millet, and forage.
Nearly all of the MY2017/18 estimated harvested area has been sown. Across most of North East
China, early crop development in parts of North East China was supported by irrigated land and existing
soil moisture.
MY2017/18 yields are forecast slightly lower as high temperatures and drought conditions in some
western parts of Liaoning and Jilin provinces prevented planting, forcing some corn producers to replant
or switch to alternative crops. In 2016, CNGOIC reported that Liaoning and Jilin accounted for nearly
20 percent of China’s corn crop.
MY2016/17 corn production is unchanged at 219.6 million tons from the USDA July estimate.
Consumption
Forecast MY2017/18 corn consumption is unchanged from USDA’s July forecast at 238.0 million tons.
The MOA, Rural Economic Research Center reported in February that China’s farmers have responded
to 2016 “supply side structural reforms” and the shift in price direction exceeded government
expectations. Post estimates that domestic spot prices bottomed at $222 per ton (RMB 1,527) in March
2017. As of the time of this writing, spot prices have rallied to their highest levels 10 months at $250
per ton (RMB 1,697). Post forecasts prices will continue rise in the short-run due to weather and
policy-driven expectations for a smaller MY2017/18 crop.
Since October 2016, futures quotes have steadily climbed 30 percent to $250 per ton (RMB 1,690) in
July 2017 and rallied to their highest levels in three months.
MY2017/18 will be the first full marketing year following the announcement of China’s “supply side
structural reforms.” As auction corn buyers take delivery of state supplies they face a similar logistics
environment as MY2016/17. Freight bottlenecks for truck, rail, and vessels are driving local prices
higher than domestic internal trade.
Current local market tightness is partly attributed to China’s State Administration of Grain requirements
that auction buyers arrange and execute their own transportation. Major state-owned enterprises
accounted for the majority of auction buyers at the start of the auction period. However, as the harvest
draws closer, small and medium-sized auction buyers are at a significant transportation disadvantage,
impacting logistics across North China. Industry sources report that high-quality corn supplies remain
tight in North China.

Sources: Industry Sources, Dalian Commodity Exchange, State Administration of Grain (SGA), Pacific
Exchange Rate Service
Delivered Corn Spot Prices in Grain Producing and Deficit Provinces
July 2016
Province Minimum Maximum Average
RMB per ton RMB per Ton USD per ton
North East China
Jilin 1,660 -- $244
Liaoning 1,710 1,750 $254
North China Plain
Shandong 1830 1840 $270
Hebei 1,780 1,800 $263
South China
Shandong 1,800 1,850 $253
Guangdong 1,830 1,850 $270
Source: Post calculations and Industry sources
MY2017/18 feed use is unchanged from USDA’s July forecast at 166.0 million tons, and 4.0 million
tons higher than MY2016/17 on competitively priced domestic supplies and higher demand.
Overall MY2017/18 hog production is expected to remain flat. However, production is moving from
more high population areas to Western and North East China, a grain surplus region, because of stricter
environmental enforcement. Industry sources report that improved genetics are boosting the number of
sows per litter. Hog prices are down, but swine farmers continue to realize strong margins in the near-
term.
Poultry prices are forecast to rise slightly, but broiler producers are still struggling due to tight margins
and losses related to avian influenza control measures.

MY2017/18 FSI consumption is unchanged from USDA July forecast at 72.0 million tons. However,
MY2017/18 FSI use is up 2.0 million tons from MY2016/17 based on larger corn processing volumes.
MY2017/18 corn use for ethanol is forecast at 23.0 million tons, climbing by one-quarter from
MY2016/17.
MY2016/17 feed use is unchanged estimated from USDA’s July forecast at 162.0 million tons on
plentiful and competitively priced domestic supplies.
MY2016/17 FSI consumption is unchanged from USDA July estimate at 70.0 million tons.
China is subsidizing corn processers to consume excess government stocks. The largest corn
processors in North East China are offered subsidies of $30 to $45 per ton (RMB 200 to 300) to produce
corn starch, ethanol, and other corn milling by-products, such as amino acids.
Corn Starch Processor Payments (November 2016 to June 2017)
Province Jilin Shandong Heilongjiang
Processor Payment $30 per ton $45 per ton
Net Benefit $55 per ton $25 per ton $151 per ton
Total Benefit $85 per ton $156 per ton
In recent weeks, many processors have slowed their pace of work to undergo maintenance.
Eligibility requirements for the processor subsidies include: annual processing capacity of 50,000 tons
or more and the ability to take delivery of auctioned corn from state inventories. Eligible sales are
required to be settled before April 30, 2017 and processed by June 30, 2017.
Starch-based sweeteners are a major corn industrial product. Starch processing capacity in July is
running at 75 to 85 percent across North East and North China. In calendar year 2016, the production of
starch-based sweeteners reached 3.8 million tons. July starch prices range between $294 and $338
(RMB 2,000 to 2,300), rising $4 to $7 per ton (RMB 30 to 50) from late June.
Starch prices are rising as seasonal demand for sweeteners increases. Rising domestic sugar prices are
expected to buoy the competitiveness of starch-based sweeteners. Starch-based sweetener production
costs have been declining for three years. As domestic demand from the food/beverage industries
saturates, Chinese starch-based sweeteners are beginning to be exported, mainly to neighboring Asian
countries such as the Philippines.
In July, ethanol prices ranged between $0.50 and $0.56 per liter (RMB 4,200 to 4,850 per ton), nearly
unchanged from June 2017 prices. At this time, ethanol processing capacity is at 47 percent of total
capacity due to the expiration of corn processing subsidies; heightened environmental regulatory
scrutiny; and higher corn prices. Processors currently face negative or slightly break even margins.
Overcapacity and weak demand for corn by-products have pressured prices lower.
From October 2016 to May 2017, China’s ethanol producers have exported more than 71.0 billion liters,
a 175 percent increase from the same period last year with three more months remaining in the

MY2016/17 marketing year.
Imports
Forecast MY2017/18 corn imports are halved from the July USDA forecast at 1.5 million tons, as
plentiful old-crop corn supplies are auctioned by the state and enter the market. In the short term, global
prices remain competitive in the South China feed market.
At present, MY2016/17 supplies to Guangdong are tight. Imported corn prices remain slightly lower
than domestic supplies. North-South corn freight spreads are between $5 to 10 per ton (RMB 30 to 70).
In June, cumulative domestic corn shipments to Guangdong port are estimated to reach about 600,000
tons.
China’s 2017 Tariff Rate Quota Policies for Corn
Commodity
TRQ
Volume
(MT)
Private
Allocation
State-Owned
Enterprise
Allocation
In-
Quota
Duty
Out-of-
Quota
Duty
Corn 7,200,000 40% 60% 3% 65%
Source: National Development and Reform Commission (NDRC)
MY2016/17 estimated corn imports are at 1.5 million tons, halved from the July USDA estimate on
trade data and reported vessel line ups. However, in the short term, imported corn remains competitive
in the South China feed market. Chinese buyers contracted large volumes for May and August delivery
from the United States and Ukraine.
Exports
Forecast MY2017/18 corn exports are at 50,000 tons, up 30,000 tons from the USDA July estimate on
expanded in-kind food assistance.
MY2016/17 corn exports are estimated at 50,000 tons, up 20,000 tons from the USDA July estimate on
greater volumes of food assistance shipments. China has responded to world famine with in-kind food
assistance to United Nations World Food Program (WFP).
Stocks
MY2017/18 corn ending stocks are forecast lower at 73.2 million tons, down 8.0 million tons from
USDA’s July forecast on greater consumption.
MY2016/17 ending stocks are estimated at 99.8 million tons, down 1.5 million tons from USDA July
estimates. On October 1, 2016, China began accumulating MY2016/17 corn supplies for national
reserves. Central government officials are directing local and provincial authorities to assist corn
producers with financial lease programs for storage and silage equipment and facilities.

Source: State Administration of Grain
On May 5, China’s State Administration of Grain began auctioning old crop supplies. China’s National
Grain and Oilseeds Center (CNGOIC) reports that China intends to rotate 323.2 million tons of corn
stocks currently held from MY2003/04 to MY2016/17. China is under pressure from the State Council
to liquidate stocks of old-crop corn, which overhang domestic and global markets.
To date, commercial traders and end-users in North East China hold pipeline stocks for two months of
use. Most buyers will hold onto current stocks as they wait for new crop supplies expected to begin
marketing in late August.
Rice
Production
Forecast MY2017/18 rough rice production is at 206.9 million tons, down 286,000 tons from USDA
July forecasts on lower harvested area. MY2017/18 forecast rice production is down slightly from
MY2016/17 on marginally lower harvested area.
Post forecasts MY2017/18 harvested area at 30.0 million hectares, down 200,000 hectares from USDA
July estimates as a decline in planted area in the Southern Yangtze River Basin offsets expanded area in
North East China. Harvested rice area continues a downward trend as overall rice consumption and
production margins slide relative to other crops.
As of early June 2017, MY2017/18 Japonica rice transplanting in North East China is complete, but
delayed compared to MY2016/17 by one week. Despite generous producer price supports, processing
subsidies, and direct payments, North East China farmers face tight margins. As a result, corn growers
have switched from planting corn to planting rice. Rice offers higher margins of $180 to $360 per
hectare (RMB 200 to 400 per mu).

Further south, forecast MY2017/18 early indica rice harvested area in the Pearl River Delta is 2 percent
higher than MY2016/17 as corn producers switch from planting corn to rice. The main early indica
producing areas will be harvested in mid-July.
Current weather conditions are negatively impacting potential rice yields. In June, CNGOIC forecasted
that assuming normal weather conditions, MY2017/18 rice yields will be the highest in nearly five
years. June and July rains and high temperatures threaten late development of early indica rice and the
establishment of late indica rice transplants. Despite monsoon rains along the Yangtze River in June
and July, rainfall deficits remain over parts of South China. The incidence of rice pests and diseases has
increased in MY2017/18 from MY2016/17.
Estimated MY2016/17 milled rice production is unchanged from the USDA July estimate at 144.9
million tons.
Consumption
Forecast MY2017/18 consumption is at 143.0 million tons unchanged from the USDA July estimate on
stable consumption and dropping per-capita consumption.
Rice is the largest staple grain consumed in China. However, per capita rice consumption is steadily
trending downward. Since October 2015, rice prices have gradually slipped by 10 percent.
Consumption of rice, wheat, and other staple grains will continue to fall as Chinese consumption of
meat and dairy rises. Seasonally, rice traders hedge risks and avoid holding inventories during the heat
and moisture of summer.
Domestic rice spot prices remain flat staying within a narrow band of $381 to $385 per ton (RMB 2,600
to 2,620) since October 2016. Futures prices also remained flat, within a narrow band between $375
and $415 per ton (RMB 2,440 to RMB 2,840).
In June, relatively tight supplies for japonica rice have pushed prices to a $20 to $45 per ton (RMB 150
to 300) premium over indica supplies.
Japonica Rice Spot Prices in in July 2017
Province/City Reference RMB per ton USD per ton
Beijing Wholesale 4,990 $734
Shanghai Wholesale 4,760 $700
Anhui Wholesale 4,540 $667
Jiangsu Wholesale 4,640 $682
Fuzhou Production 4,650 $683
Source: Industry sources

Sources: Industry sources, Pacific Exchange Rate Service, and Post calculations
Wholesale Indica Rice Spot Prices in in July 2017
Province/Region RMB per ton USD per ton
North East 4,600-5,120 $676-$753
Shandong 3,220 $470
Henan 3,160 $465
Jiangsu 4,600-4,650 $676-$683
Anhui 4,300 $632
Guangzhou 2800-4180 $412-$615
Sources: Industry sources
MY2016/17 consumption is estimated at 143.5 million tons based on average feed use and FSI use,
unchanged from USDA July estimates.
Rice processors are experiencing downward pressure on operating margins as corn starch supplies
overwhelm local markets.
Imports
Forecast MY2017/18 rice imports are at 5.0 million tons, unchanged from USDA July estimates.
Vietnam and Thailand remain leading exporters of rice to China due to their competitive prices and
freight advantage. Rice imports will continue to be profitable if South East Asian countries offer the
prices below China’s floor price of $389 per ton (RMB 2,660). China is the largest buyer of
Vietnamese rice, and the destination for nearly half of Vietnam’s rice exports.
Vietnamese rice to Hong Kong duty-paid quotes range between $492 and $507 per ton (RMB 3,300 and
3,400). Prices for Thai rice have risen by $45 per ton to $390 to $430 per ton.

Delivered Rice Spot Prices in End-User Provinces in June 2016
Origin Province/Region Minimum Maximum Average
RMB per ton RMB per Ton USD per ton
Heilongjiang Hangzhou 5,120 $753
Heilongjiang Anhui 4,520 $665
Heilongjiang Jiangsu 4,000 $588
Thailand Pearl River Delta $390-$430
Vietnam Pearl River Delta 3,082 3,092 $372
India Pearl River Delta 2,800 2,825 $413-$416
On April 25, 2017, the government agreed to grant licenses to eight additional Cambodian rice
exporters, expanding the number of certified Cambodian exporters to 34.
MY2016/17 imports are unchanged from the USDA July estimates at 5.2 million tons.
Exports
Forecast MY2017/18 rice exports are unchanged from USDA July estimates at 800,000 tons on policy-
driven exports to Africa. At the “One Belt, One Road” Summit, China proposed contributing in-kind
food assistance to the United Nations World Food Program (WFP).
Stocks
Forecast MY2017/18 ending stocks are down 200,000 tons from July USDA forecasts at 75.5 million
tons.
The purchase procurement period under China’s minimum price support program for rice began in July
and will end in September 2017.
MY2016/17 milled rice ending stocks are unchanged from USDA July estimated at 69.5 million tons.
Sorghum
Production
MY2017/18 sorghum production is raised to 3.9 million tons, up 50,000 tons from the July USDA
forecast on expanded harvested area. MY2017/18 sorghum harvested area is forecast at 800,000
hectares, up by 20,000 hectares from USDA July estimates on policy-driven mandates. As of July,
overall MY2017/18 sorghum planting is nearly complete.
MY2016/17 sorghum production estimates are unchanged from the USDA July estimate at 3.8 million
tons. MY2016/17 sorghum harvested area is unchanged at 760,000 hectares.

Consumption
MY2017/18 consumption is unchanged from USDA’s July forecast at 8.2 million tons.
MY2017/18 feed consumption is at 5.7 million tons, unchanged from USDA’s July forecast.
MY2017/18 FSI use is forecast at 2.5 million tons, unchanged from USDA’s July forecast.
MY2016/17 consumption is unchanged from the USDA July estimate at 8.5 million tons.
Imports
MY 2017/18 imports are unchanged from USDA’s July forecast at 4.2 million tons.
However, in comparison to MY2016/17 imports, MY2017/18 is down 500,000 tons as import
substitution policies have effectively diminished a large share of sorghum demand.
U.S sorghum has returned to price competitiveness over domestic corn. June and July will have the
greatest demand for alternative feed grains on late-season buying, as end users cover their needs before
the arrival of new-crop domestic supplies.
As late as June 2017, U.S. sorghum delivered to Chinese ports was quoted at CIF $208 per ton RMB
1,450), near parity with domestic corn quotes delivered to South China ports.
In July, congestion near Yangtze River ports raised competitiveness for imported sorghum.
Post forecasts half of China’s sorghum imports will ship to Guangdong. Niche pockets of sorghum
buyers continue to seek imported supplies for livestock feed due to the consistency and reliable quality
characteristics of U.S. sorghum.
MY2016/17 imports are unchanged from the USDA July estimates at 4.7 million tons, based on trade
data.
Stocks
Forecast MY2017/18 ending stocks are at 572,000 tons, 30,000 tons higher than USDA July estimates
on higher carry-in from MY2016/17.
Estimated MY2016/17 ending stocks are unchanged at 702,000 tons.

PSD Tables
Wheat 2015/2016 2016/2017 2017/2018 Market Begin Year Jul 2015 Jul 2016 Jul 2017
China USDA Official New Post USDA Official New Post USDA Official New Post
Area Harvested 24140 24140 24190 24190 24200 24200
Beginning Stocks 76105 76105 97042 97042 110992 110192
Production 130190 130190 128850 128850 130000 130000
MY Imports 3476 3476 4400 3600 3000 3000
TY Imports 3476 3476 4400 3000 3000 3000
TY Imp. from U.S. 613 613 0 0 0 0
Total Supply 209771 209771 230292 229492 243992 243192
MY Exports 729 729 800 800 800 800
TY Exports 729 729 800 800 800 800
Feed and Residual 10500 10500 16500 16500 13000 11000
FSI Consumption 101500 101500 102000 102000 103000 103000
Total Consumption 112000 112000 118500 118500 116000 114000
Ending Stocks 97042 97042 110992 110192 127192 128392
Total Distribution 209771 209771 230292 229492 243992 243192
Yield 5.3931 5.3931 5.3266 5.3266 5.3719 5.3719
(1000 HA) ,(1000 MT) ,(MT/HA)
Corn 2015/2016 2016/2017 2017/2018 Market Begin Year Oct 2015 Oct 2016 Oct 2017
China USDA Official New Post USDA Official New Post USDA Official New Post
Area Harvested 38119 38119 36760 36760 35000 35000
Beginning Stocks 100472 100472 110774 110774 101298 99778
Production 224632 224632 219554 219554 215000 210000
MY Imports 3174 3174 3000 1500 3000 1500
TY Imports 3174 3174 3000 1500 3000 1500
TY Imp. from U.S. 321 321 0 0 0 0
Total Supply 328278 328278 333328 331828 319298 311278
MY Exports 4 4 30 50 20 50
TY Exports 4 4 30 50 20 50
Feed and Residual 153500 153500 162000 162000 166000 166000
FSI Consumption 64000 64000 70000 70000 72000 72000
Total Consumption 217500 217500 232000 232000 238000 238000
Ending Stocks 110774 110774 101298 99778 81278 73228
Total Distribution 328278 328278 333328 331828 319298 311278
Yield 5.8929 5.8929 5.9726 5.9726 6.1429 6
(1000 HA) ,(1000 MT) ,(MT/HA)

Rice, Milled 2015/2016 2016/2017 2017/2018 Market Begin Year Jul 2015 Jul 2016 Jul 2017
China USDA Official New Post USDA Official New Post USDA Official New Post
Area Harvested 30210 30210 30160 30160 30200 30000
Beginning Stocks 57436 57436 63735 63735 69535 69535
Milled Production 145770 145770 144850 144850 145000 144800
Rough Production 208243 208243 206929 206929 207143 206857
Milling Rate (.9999) 7000 7000 7000 7000 7000 7000
MY Imports 4800 4800 5150 5150 5000 5000
TY Imports 4600 4600 5100 5100 5000 5000
TY Imp. from U.S. 0 0 0 0 0 0
Total Supply 208006 208006 213735 213735 219535 219335
MY Exports 271 271 700 700 800 800
TY Exports 368 368 800 800 900 900
Consumption and Residual 144000 144000 143500 143500 143000 143000
Ending Stocks 63735 63735 69535 69535 75735 75535
Total Distribution 208006 208006 213735 213735 219535 219335
Yield (Rough) 6.8932 6.8932 6.861 6.861 6.859 6.8952
(1000 HA) ,(1000 MT) ,(MT/HA)
Sorghum 2015/2016 2016/2017 2017/2018 Market Begin Year Oct 2015 Oct 2016 Oct 2017
China USDA Official New Post USDA Official New Post USDA Official New Post
Area Harvested 574 574 760 760 780 800
Beginning Stocks 706 706 717 717 702 702
Production 2750 2750 3800 3800 3850 3900
MY Imports 8284 8284 4700 4700 4200 4200
TY Imports 8284 8284 4700 4700 4200 4200
TY Imp. from U.S. 6218 6218 0 0 0 0
Total Supply 11740 11740 9217 9217 8752 8802
MY Exports 23 23 15 15 10 30
TY Exports 23 23 15 15 10 30
Feed and Residual 8800 8800 6000 6000 5700 5700
FSI Consumption 2200 2200 2500 2500 2500 2500
Total Consumption 11000 11000 8500 8500 8200 8200
Ending Stocks 717 717 702 702 542 572
Total Distribution 11740 11740 9217 9217 8752 8802
Yield 4.7909 4.7909 5 5 4.9359 4.875
(1000 HA) ,(1000 MT) ,(MT/HA)