Embed Size (px)
Citation preview

3rd Meeting of the Scientific Committee
Port Vila, Vanuatu 28 September - 3 October 2015
SC-03-09ψNJŜǾм
China’s Annual report – Part II: The Squid Jigging Fishery Gang Li, Xinjun Chen and Bilin Liu
1
National Report of China to the 2015 SPRFMO Science
Committee Part II: the Squid Jigging Fishery
Gang Li, Xinjun Chen and Bilin Liu
National Data Center for Distant-water Fisheries, Shanghai Ocean University
1 Description of Chinese Squid Jigging Fishery
Jumbo flying squid (Dosidicus gigas) has been targeted by the Chinese
distant-water squid jigging fleet since 2001. During June and September in
2001, the Chinese squid jigging industry made their first resources survey of
jumbo flying squid in the high seas of Peru and Costa Rica, followed by
commercial production (Chen et al., 2008).
The Chinese squid jigging vessels only operate in the international waters
outside Peru and Chile economic zones. In general, small vessels with hand
jiggers catch jumbo flying squid all year round, while the big vessels equipped
auto-machined jiggers move to the South East Pacific from the south-western
Atlantic to catch jumbo flying in a few months of the year.
The total of 22 fishing vessels arrived at the international waters of the South
East Pacific in 2001.The number of vessels increased to 119 in 2004 and then
declined continuously in the flowing three years. Over the period 2005-2014,
the number of Chinese vessels increased rapidly and peaked in 2014 (Table
1).
The number of active fishing vessels is constantly changing month by month in
a calendar year. During 2012-2014, the number of operating vessels was more
than 150 for 5 or 6 months a year. In 2014, the number of active fishing vessels
peaked in September, however, a total of 256 vessels were recorded to
operate in the South East Pacific in that year. In the first half of 2015, the
number of fishing vessels changed between 118 and 160 (Figure 1).
20 Aug 15 (updated 9 Sep) SC-03-09_rev1

2
Figure 1 Monthly variation in number of vessels during 2010-2015
Annual catch of jumbo flying squid presented similar trend as the number of
vessels during 2001-2014. Only 17,770 tons squid caught by 22 vessels in the
first fishing year, and increased rapidly in the following three years, however it
declined continuously in the next three years. Staring from 2008, the catch
increased again and reached a record 325 thousand tons in 2014 (Table 1).
Table 1 Number of vessels in the South East Pacific during 2001-2015
Year Number of vessels Catch in tons 2001 22 17,770 2002 43 50,483 2003 74 81,000 2004 119 205,600 2005 93 86,000 2006 43 62,000 2007 37 46,400 2008 50 79,064 2009 54 70,000 2010 104 142,000 2011 172 250,000 2012 254 261,000 2013 205 264,000 2014 264 325,000 2015* 160 129,000
Note: The total catch was 129,000 tons through June 2015.
0
50
100
150
200
250
Jan Feb Mar Apr May Jun Jul Aug Sep Oct Nov Dec
Nu
mb
er
of
vess
els 2010
2011
2012
2013
2014
2015
20 Aug 15 (updated 9 Sep) SC-03-09_rev1
3
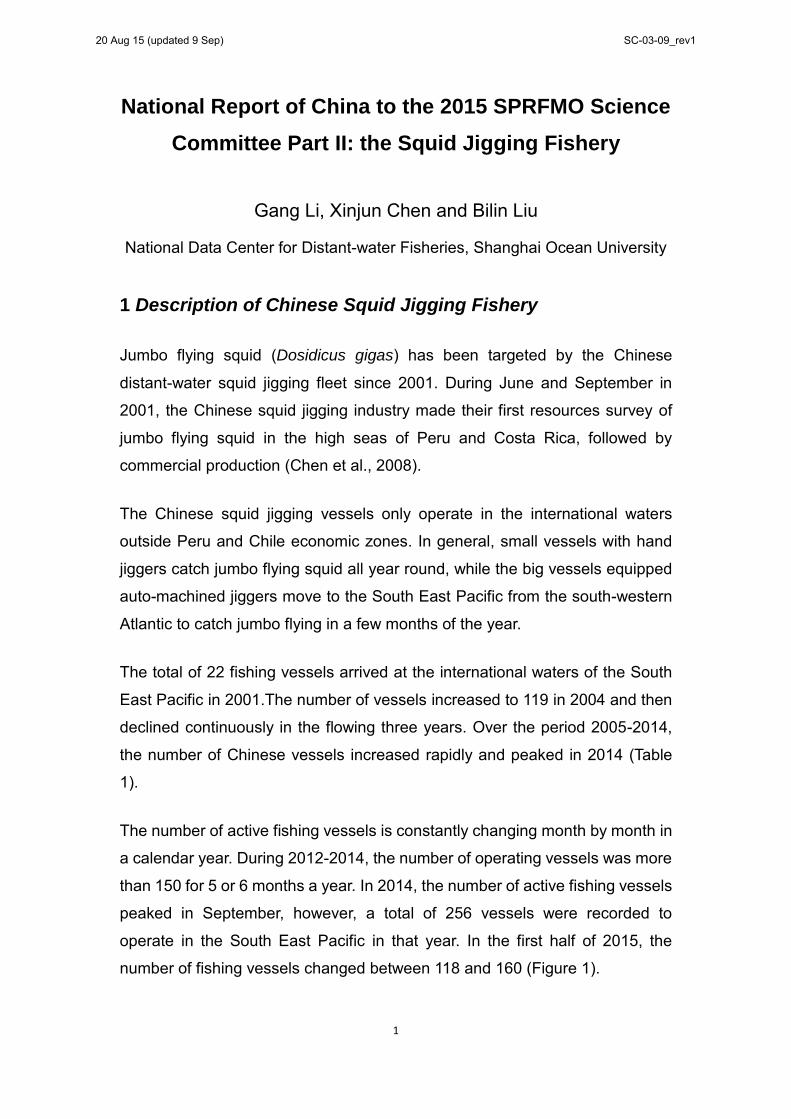
2 Catch, Effort and CPUE Summaries
Annual total catches of the Chinese squid jigging fishery in the South East
Pacific were over 250 thousand tons during the period of 2011-2014, before
that the highest catch was 205 thousand tons. In 2015, total catch was 129
thousand ton up until June.
Fishing effort, catch rate during 2010-2014 are showed in Table 2. Effort was
increased rapidly with the increasing fishing vessels and maintained high level
in the past 4 years. However, effort decreased from 65,530 fishing days in
2012 to 58,831 fishing days in 2013, and showed a slightly increase in 2014.
CPUE was fluctuant between 4.0 and 6.4 ton/day-vessel from 2010 to 2014.
Catch rate declined in the first 3 years but showed an increase trend from 2013
and reached 5.5 ton/day-vessel in 2014. The monthly catches over the period
2010-2015 are presented in Figure 2.
Monthly catches in the last 5 months during 2012-2014 increased obviously.
The maximum was over 60 thousand tons, appeared in November 2014, and
followed by 49.7 thousand tons in November 2013 and 41.6 thousand tons in
August 2012. In 2015, monthly catch data were available up until June and
monthly catch declined from 300 thousand ton in January to 118 thousand ton
in June.
Table 2 Catch, fishing days and catch per day of jack mackerel by the Chinese
fishing fleets over the period of 2010-2015
Year Catch in tons Fishing days CPUE(ton/day-vessel)
2010 142,000 22,242 6.4
2011 250,000 46,493 5.4
2012 261,000 65,530 4.0
2013 264,000 57,771 4.6
2014 325,000 58,831 5.5
2015* 129,000 - -
20 Aug 15 (updated 9 Sep) SC-03-09_rev1
4
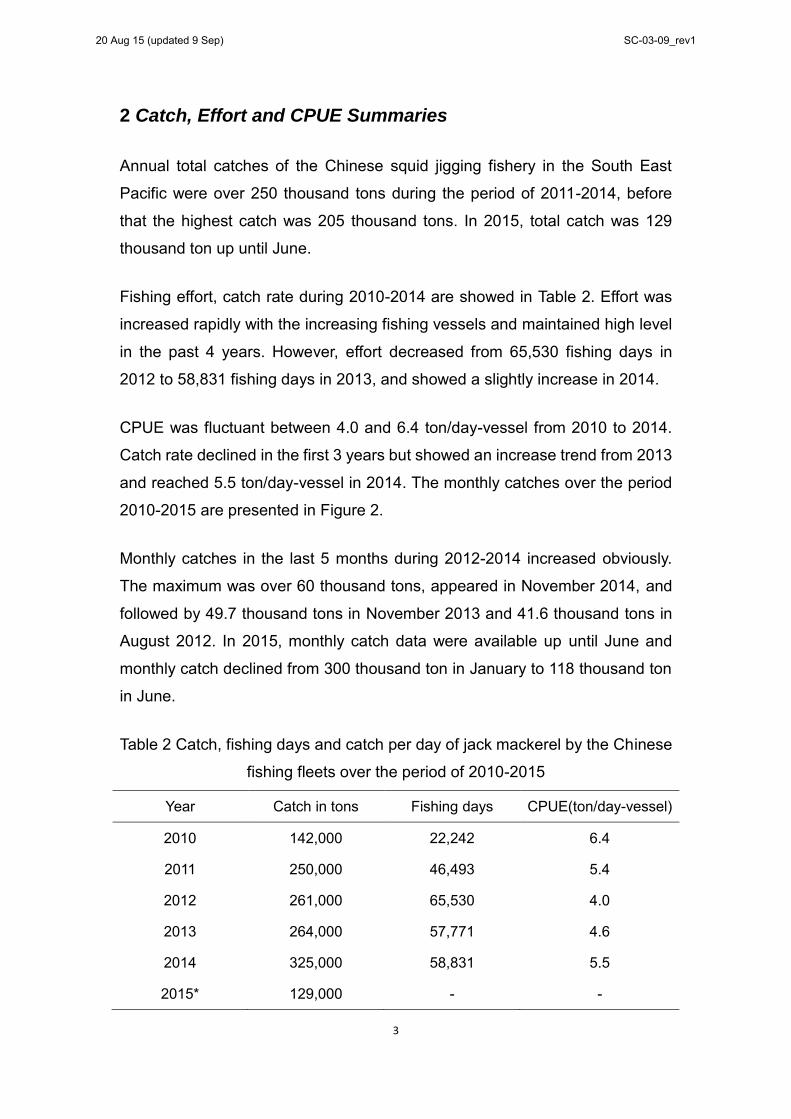
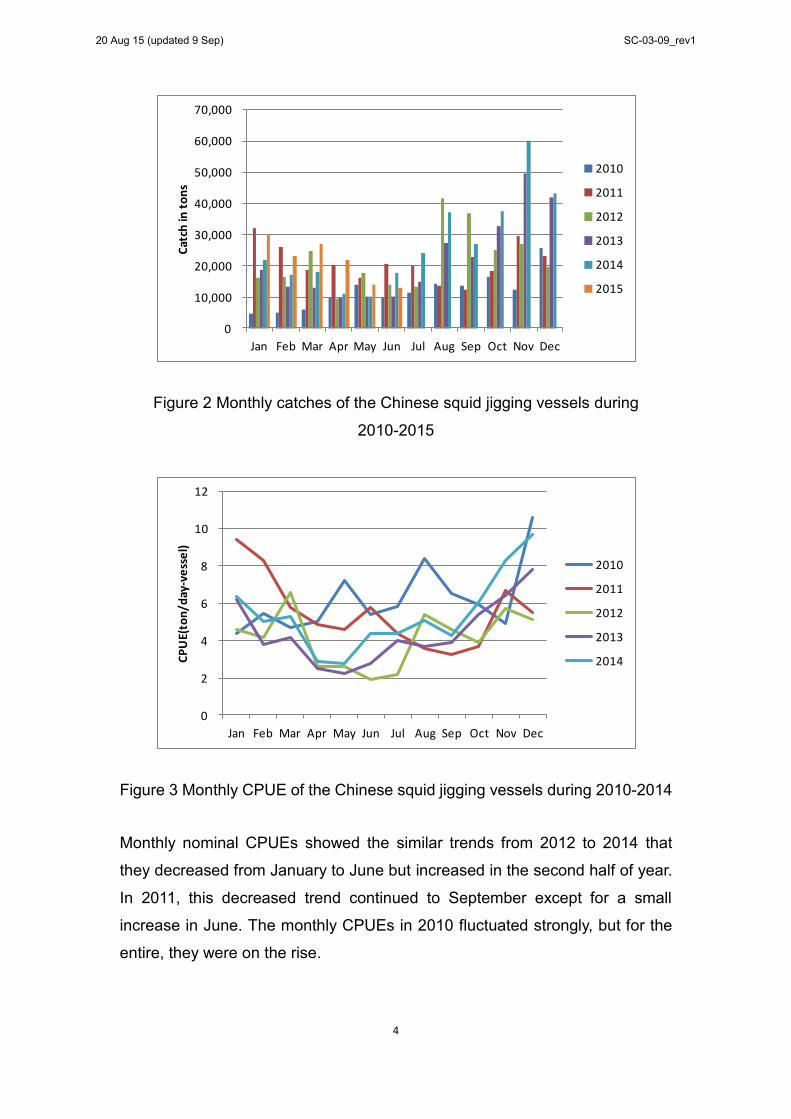
Figure 2 Monthly catches of the Chinese squid jigging vessels during
2010-2015
Figure 3 Monthly CPUE of the Chinese squid jigging vessels during 2010-2014
Monthly nominal CPUEs showed the similar trends from 2012 to 2014 that
they decreased from January to June but increased in the second half of year.
In 2011, this decreased trend continued to September except for a small
increase in June. The monthly CPUEs in 2010 fluctuated strongly, but for the
entire, they were on the rise.
0
10,000
20,000
30,000
40,000
50,000
60,000
70,000
Jan Feb Mar Apr May Jun Jul Aug Sep Oct Nov Dec
Cat
ch in
to
ns
2010
2011
2012
2013
2014
2015
0
2
4
6
8
10
12
Jan Feb Mar Apr May Jun Jul Aug Sep Oct Nov Dec
CP
UE(
ton
/day
-ve
sse
l)
2010
2011
2012
2013
2014
20 Aug 15 (updated 9 Sep) SC-03-09_rev1

5
3 Fisheries Data Collection and Research Activities
China Distant Water Fisheries Association (CDWFA) and Shanghai Ocean
University (SHOU) jointly take charge of the fisheries data collection. Data
collection of the Chinese squid jigging fishery began in 2001, the same year as
the Chinese scientists started research work for jumbo flying squid and its
fishery in the South East Pacific.
Data collection was relatively simple early on in the Chinese squid jigging
fishery. Fishery data collection system has been established and more detail
fishery data such as operating time, location and catch derived from logbooks
have been collected since 2003. Moreover, the fishing companies were
request to supply the weekly fishing report in which include number of fishing
vessels, the status of fishing vessels (operating, being repaired, returning or
shifting), catch, catch per vessel and accumulated catch.
As another important part of the system, biological and environmental data
were also collected by the Chinese scientists. The environmental data (such
as temperature, and salinity of water columns) and some important biological
information e.g. mantle length (ML), weight, sex, stage of maturity were
collected on board directivity by the scientists. Furthermore, the scientists
cooperated with fishmen and entrust them to collect samples of jumbo flying
squid on the sea. These squid samples were transported to SHOU finally.
One of the purposes of the Fishery data collection system for the jumbo flying
squid in the South East Pacific is to do scientific researches, which mainly
related to fisheries biology, stock structure, assessment and relationship with
marine environment. Some results have been published in international
journals in recent years. For example, Chen et al (2011) studied age,
maturation and population structure of the jumbo flying squid stock off the
Chilean economic zone base on samples collected during 2007-2008. Age
determined by counting daily rings on the statolith. At least two spawning
groups were identified, the main spawning peak tended to occur between
August and November (austral spring group), and the secondary peak
20 Aug 15 (updated 9 Sep) SC-03-09_rev1

6
appeared during March to June (austral autumn group). In the high seas of
Chilean waters, the squid were sampled in from 2008 to 2010 for aging and
estimating time of hatch (Liu et al., 2013). Estimated ages ranged from 144 to
633 days. Occurrence of mature females and hatching in each month indicated
that this species spawned year-round but peaked between January and March.
Area adjacent to 11°S off the Peruvian may be a potential spawning ground.
Trace elements in statoliths of the jumbo flying squid were studied. Sr: Ca, and
Mg:Ca were good indicators for distinguishing squid from autumn and winter
spawning seasons. Sr:Ca and Ba:Ca distribution patterns in statoliths
confirmed that paralarvae and juvenile squid inhabit surface waters, while
subadult squid migrate into deeper waters (Liu et al., 2011). The spatial
difference in trace elements of statolith can be used to separate geographic
populations. Jumbo flying squid in the high seas off Costa Rica could be
separated from those off Peru and Chile mostly due to the differences in Ni, Sr,
and Co, while samples off Peru and Chile could be distinguished mainly
because of differences in Mn and Co (Liu et al., 2013). And, furthermore,
morphology (Liu et al., 2015) and gene technology (Liu et al, 2014) were also
used to identify different geographic populations of the jumbo flying squid in
the South Pacific.
4 Biological Sampling and Length Composition of Catches
A total of 732 jumbo flying squid was sampled on the Chinese vessel in the
Eastern Central Pacific (110°W- 20 °W and 2°N-5°S) from April and June 2014.
Collected data include length, weight, sex, maturity stage, stomach fullness,
and so on. Among the 732 jumbo flying squid samples, 487 samples were
measured mantle length or body weight only and 100 samples were measured
for mantle length and body weight and determined sex and mature stage by
checking the gonad on the sea. There were 145 samples were measured and
examined in the laboratory of SHOU to get more detailed biological
characteristics such as age, gonad weigh, tentacle length, dimension of beak
and statolith etc. Body weight of jumbo flying squid samples ranged from 275 g
to 3330 g with mean of 596 g (sample size was 596 ).
20 Aug 15 (updated 9 Sep) SC-03-09_rev1

7
Length frequency based on all these samples was presented in Figure 4. In
2104, the first mode of mantle length was 30-35 cm and the second was
25-30cm. Data from 2013 survey showed that the vessel caught the similar
size of squid, but the principal mantle length was at 25-30 cm and the second
was 30-35 cm (sample size was 2018). Furthermore, smaller squid with mantle
length at 5-20 cm were also caught.
Figure 4 Mantle length frequency of jumbo flying squid in the Eastern Central
Pacific in 2013 and 2014
Figure 5 and 6 present the series of mantle length distributions based on the
biological data collected in the international waters of Peru and Chile during
2006-2013. The squid caught in the north area (Peru) seems smaller than it
caught in south area (Chile). However, additional measurement for the large
0
10
20
30
40
50
60
10 15 20 25 30 35 40 45 50 55 60
Fre
qu
en
cy
Mantle length (cm)
2014
2013
0
10
20
30
40
50
60
10 15 20 25 30 35 40 45 50 55 60
Fre
qu
en
cy
Mantle length (cm)
20 Aug 15 (updated 9 Sep) SC-03-09_rev1

8
squid were carried out in the 2009 survey outside Peru economic area, the
maximum mantle length was 114.9 cm with body weight 61.9 kg (Table 3).
Table 3 Mantle length and body weight for the large squid measured in 2009
Number Data Mantle length (cm) Body weight (kg) 1 9-Sep-09 98.26 - 2 10-Sep-09 101.56 - 3 12-Sep-09 90.56 - 4 12-Sep-09 70.5 11.87 5 13-Sep-09 97.33 - 6 13-Sep-09 95.33 - 7 14-Sep-09 113.85 - 8 15-Sep-09 66.47 - 9 16-Sep-09 100.9 - 10 16-Sep-09 100.8 - 11 16-Sep-09 73.4 - 12 18-Sep-09 76.8 - 13 20-Sep-09 103.3 - 14 23-Sep-09 98.85 36.5 15 24-Sep-09 103.25 47.1 16 25-Sep-09 108.9 53.2 17 1-Oct-09 97.4 40.5 18 1-Oct-09 94.9 30.5 19 4-Oct-09 100.08 33 20 4-Oct-09 99.28 33.1 21 4-Oct-09 97.8 42.3 22 4-Oct-09 85.4 21 23 6-Oct-09 102.48 44.8 24 6-Oct-09 91.48 25.8 25 10-Oct-09 114.9 61.9 26 10-Oct-09 93.51 32.3 27 10-Oct-09 81.6 16.1 28 14-Oct-09 111.8 54.5
20 Aug 15 (updated 9 Sep) SC-03-09_rev1

9
2008
2009
2010
0
10
20
30
40
50
15 20 25 30 35 40 45 50 55 60 65
Fre
qu
en
cy
Mantle length (cm)
0
10
20
30
40
50
15 20 25 30 35 40 45 50 55 60 65
Fre
qu
en
cy
Mantle length (cm)
0
10
20
30
40
50
15 20 25 30 35 40 45 50 55 60 65
Fre
qu
en
cy
Mantle length (cm)
20 Aug 15 (updated 9 Sep) SC-03-09_rev1

10
Figure 5. Mantle length frequency of jumbo flying squid in the high seas of
Peru
0
10
20
30
40
50
15 20 25 30 35 40 45 50 55 60 65
Fre
qu
en
cy
Mantle length (cm)
0
10
20
30
40
50
60
15 20 25 30 35 40 45 50 55 60 65
Fre
qu
en
cy
Mantle length (cm)
2011
2013
20 Aug 15 (updated 9 Sep) SC-03-09_rev1

11
0
10
20
30
40
50
20 25 30 35 40 45 50 55 60 65 70 75 80 85
Fre
qu
en
cy
Mantle length (cm)
0
10
20
30
40
50
20 25 30 35 40 45 50 55 60 65 70 75 80 85
Fre
qu
en
cy
Mantle length (cm)
0
10
20
30
40
50
20 25 30 35 40 45 50 55 60 65 70 75 80 85
Fre
qu
en
cy
Mantle length (cm)
2006
2007
2008
20 Aug 15 (updated 9 Sep) SC-03-09_rev1

12
Figure 6. Mantle length frequency of jumbo flying squid in the high seas of
Chile
5 Summary of Observer Programme
In 2001, China carried out the first survey for the jumbo flying squid in the
South Pacific and sent the first scientist on board. Since 2007, CDWFA has
cooperated with SHOU to send scientific observes on board to take charge of
the survey. One of the main responsibilities of the observers is to collect fishery
and environmental data. The details of these surveys present in Table 4.
Table 4. Survey information of the Chinese squid jigging fishery
Survey time Survey area Observer number
Vessel type
Jun-Sep 2001 high seas of Peru and Costa Rica 1 squid jigging
Jan-Jun 2007 high seas of Chile 1 squid jigging
Feb-Mar 2008 high seas of Chile 2 squid jigging
July-Nov 2009 high seas of Peru and Costa Rica 2 squid jigging
Apr-Jun 2013 eastern equatorial Pacific 2 squid jigging
Apr-Jun 2014 eastern equatorial Pacific 2 squid jigging
6 Summaries
In 2001, the Chinese squid jigging vessels arrived in the South East Pacific for
0
10
20
30
40
50
20 25 30 35 40 45 50 55 60 65 70 75 80 85
Fre
qu
en
cy
Mantle length (cm)
2010
20 Aug 15 (updated 9 Sep) SC-03-09_rev1
13
the first time for fishing jumbo flying squid. During the period of 2010-2014, this
fishery developed rapidly and annual catch, as well as active fishing vessels
reached the highest level on record in 2014. Furthermore, the fishing effort
also remained at high level with the nominal CPUE fluctuant between 4.0 and
6.4 ton/day-vessel. 2 observers worked on board and they sampled a total of
732 jumbo flying squid in the Eastern Central Pacific in 2014.
References
Chen X J, Lu H J, Liu B L, and Chen Y, 2011. Age, growth and population structure of
jumbo flying squid, Dosidicus Gigas, based on statolith microstructure off the
Exclusive Economic Zone of Chilean waters. Journal of the Marine Biological
Association of the United Kingdom, 91, 229-235.
Liu B L, Chen X J, Chen Y, Lu H J, and Qian W G, 2011. Trace Elements in the
statoliths of jumbo flying squid off the Exclusive Economic Zones of Chile and Peru.
Marine Ecology Progress Series, 429, 93-101.
Liu B L, Chen X J, Chen Y, Tian S Q, Li, J H, Fang Z, and Yang M X, 2013. Age,
maturation, and population structure of the Humboldt squid Dosidicus gigas off the
Peruvian Exclusive Economic Zones. Chinese Journal of Oceanology and Limnology,
31, 81-91.
Liu B L, Chen X J, Chen Y, and Tian S Q, 2013. Geographic variation in statolith trace
elements of the Humboldt squid, Dosidicus gigas, in high seas of Eastern Pacific
Ocean. Marine Biology, 160, 2853-2862.
Liu L W, Chen X J, Xu Q H, Tian S Q, and Liu B L, 2014. Development of 39
polymorphic microsatellite markers for the jumbo squid Dosidicus gigas using Illumina
paired-end sequencing. Conservation Genetics Resources, 6, 673-676.
Liu B L, Fang Z, Chen X J, and Chen Y, 2015. Spatial variations in beak structure to
20 Aug 15 (updated 9 Sep) SC-03-09_rev1
14
identify potentially geographic populations of Dosidicus gigas in the Eastern Pacific
Ocean. Fisheries Research, 164, 185-192.
20 Aug 15 (updated 9 Sep) SC-03-09_rev1