Embed Size (px)
Citation preview
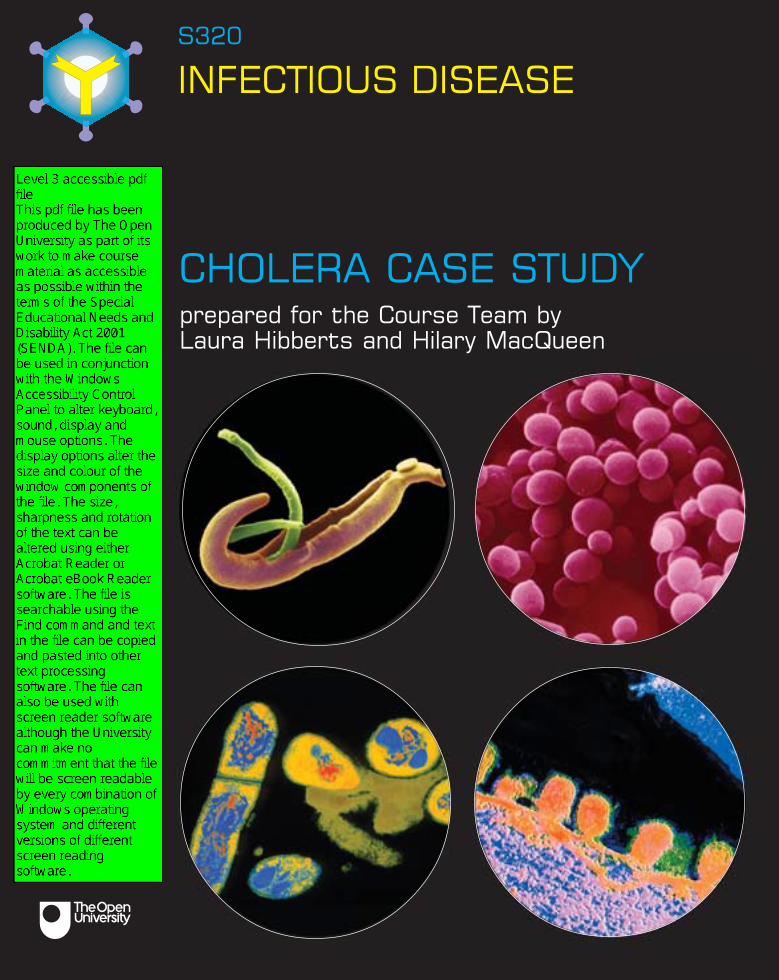
CHOLERA CASE STUDY
S320
INFECTIOUS DISEASE
prepared for the Course Team byLaura Hibberts and Hilary MacQueen
l
s320_cs_cholera_v4.pmd 15/01/2003, 16:541
2
This publication forms part of an Open University course S320 Infectious Disease.
Details of this and other Open University courses can be obtained from the Course
Information and Advice Centre, PO Box 724, The Open University, Milton Keynes
MK7 6ZS, United Kingdom: tel. +44 (0)1908 653231, e-mail [email protected]
Alternatively, you may visit the Open University website at http://www.open.ac.uk where
you can learn more about the wide range of courses and packs offered at all levels by
The Open University.
To purchase a selection of Open University course materials visit the webshop at
www.ouw.co.uk, or contact Open University Worldwide, Michael Young Building, Walton
Hall, Milton Keynes MK7 6AA, United Kingdom for a brochure. tel. +44 (0)1908 858785;
fax +44 (0)1908 858787; e-mail [email protected]
The Open University
Walton Hall, Milton Keynes
MK7 6AA
First published 2003.
Copyright © 2003 The Open University
All rights reserved. No part of this publication may be reproduced, stored in a retrieval
system, transmitted or utilized in any form or by any means, electronic, mechanical,
photocopying, recording or otherwise, without written permission from the publisher or a
licence from the Copyright Licensing Agency Ltd. Details of such licences (for
reprographic reproduction) may be obtained from the Copyright Licensing Agency Ltd of
90 Tottenham Court Road, London W1T 4LP.
Edited, designed and typeset by The Open University.
Printed and bound in the United Kingdom by The Alden Group, Oxford.
ISBN 0 749256648
1.1
Cover pictures
Top left: Schistosome parasites. Coloured scanning electron micrograph of adult
female (upper, thinner) and male (lower, fatter) Schistosoma mansonii parasitic
worms, cause of the disease bilharzia (schistosomiasis).
Top right: Scanning electron micrograph of Staphylococcus sp.
Lower left: Coloured electron transmission micrograph of Mycobacterium
tuberculosis.
Lower right: False colour transmission electron micrograph of influenza viruses
(orange) budding from the surface of an infected cell.
s320_cs_cholera_v4.pmd 15/01/2003, 16:032
3
CONTENTS
1 THE HISTORY OF CHOLERA 5
2 THE DISEASE 7
3 VIBRIO CHOLERAE, THE CAUSATIVE AGENT OF CHOLERA 9
4 IMMUNOLOGY OF CHOLERA 13
5 TREATMENT OF CHOLERA 15
6 THE CURRENT CHOLERA PANDEMIC 16
7 CHOLERA AT THE BEGINNING OF THE 21ST CENTURY 18
8 CONCLUSION 18
9 LEARNING OUTCOMES 20
REFERENCES AND FURTHER SOURCES 20
ACKNOWLEDGEMENTS 21
10
s320_cs_cholera_v4.pmd 15/01/2003, 16:033

4
s320_cs_cholera_v4.pmd 15/01/2003, 16:034
5
CHOLERA CASE STUDY
You are advised to attempt this case study when you have finished your study
of Book 2. However, there will be some material in Section 4 that may be
clearer after you have studied Book 3; so if you find this material difficult, youmight prefer to leave it for now and return to it later in the course. More detail
is available in the papers cited in the text, which are listed at the end. You may
wish to read some of these papers if you are particularly interested in thistopic. There is also a lot of relevant information available on the World Health
Organization website, should you wish to learn more. This case study should
take you no longer than 3 hours.
1 The history of cholera
Cholera has been known in India for a long time, where it is endemic, but in 1816 it
began to spread in an unprecedented manner. The British public first heard of
‘Asiatic’ cholera when the Marquis of Hastings’ army succumbed to the disease,
which had reached epidemic proportions in Bengal. The cholera swept on, affecting
the whole of India, and spreading as far as Japan and the Philippines in the East,
and Russia and Persia (now Iran) in the West. This first pandemic, as it was then
called, petered out in 1826, ten years after it had begun.
However, that was not the end of the story, and throughout the 19th and early 20th
centuries no fewer than five further cholera pandemics swept the world, with the
disease retreating to the Bengal Basin in between assaults. The duration and
frequency of these pandemics are shown in Table 1.1.
TABLE 1.1 The duration of cholera pandemics in the 19th and first half of the20th centuries.
Pandemic Duration/years Period
first 9 1817–1826
second 8 1829–1837
third 16 1846–1862
fourth 11 1864–1875
fifth 13 1883–1896
sixth 61 1899–1960
The second pandemic, which began in 1829, reached North Africa, Europe and the
Americas. It could not have arrived at a worse time for the increasingly
industrialized cities of Europe and North America. These cities were growing in size
rapidly, as people flocked to them, eager to find work in the new factories. Once in
the cities, they lived crowded together with no proper sewerage system and often
no clean water. In 1836 the registration of births, marriage and deaths became
compulsory in Britain and the first quantitative data on the nation’s health became
available. It was clear from these statistics that the poor suffered the most disease,
but this observation led to the advancing of opinions that would be regarded as
outrageous today. It was suggested that the poor were the cause of disease, and
s320_cs_cholera_v4.pmd 15/01/2003, 16:035
6
S320 INFECTIOUS DISEASE
brought it about by their unhygienic practices and immorality. These views have a
certain logic when seen in the context of their time: disease was still thought to be
caused by ‘bad airs’ or miasmas, and life was believed to be generated
spontaneously from non-living matter.
However, the tide was starting to turn: Edwin Chadwick, Secretary to the Poor Law
Commission, began to realize that poverty could be caused by disease, since the
sick and disabled were unable to work. In 1842, he published his ‘Report on the
Sanitary Condition of the Labouring Population of Great Britain’, which identified
the main causes of disease among the poor as urban squalor, overcrowding and
poor diet. Chadwick advocated a number of improvements in public health, such as
the removal of rubbish from poor areas, the building of new sewers, and improved
water supplies. Under the first British Public Health Act in 1848, some of these
improvements were begun.
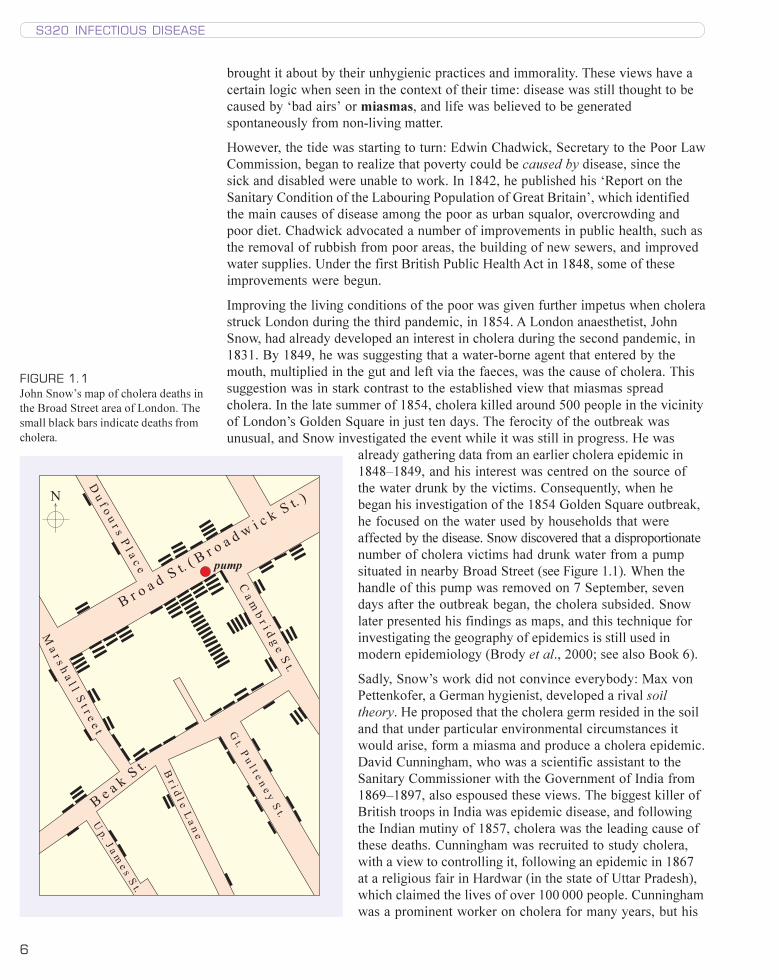
Improving the living conditions of the poor was given further impetus when cholera
struck London during the third pandemic, in 1854. A London anaesthetist, John
Snow, had already developed an interest in cholera during the second pandemic, in
1831. By 1849, he was suggesting that a water-borne agent that entered by the
mouth, multiplied in the gut and left via the faeces, was the cause of cholera. This
suggestion was in stark contrast to the established view that miasmas spread
cholera. In the late summer of 1854, cholera killed around 500 people in the vicinity
of London’s Golden Square in just ten days. The ferocity of the outbreak was
unusual, and Snow investigated the event while it was still in progress. He was
already gathering data from an earlier cholera epidemic in
1848–1849, and his interest was centred on the source of
the water drunk by the victims. Consequently, when he
began his investigation of the 1854 Golden Square outbreak,
he focused on the water used by households that were
affected by the disease. Snow discovered that a disproportionate
number of cholera victims had drunk water from a pump
situated in nearby Broad Street (see Figure 1.1). When the
handle of this pump was removed on 7 September, seven
days after the outbreak began, the cholera subsided. Snow
later presented his findings as maps, and this technique for
investigating the geography of epidemics is still used in
modern epidemiology (Brody et al., 2000; see also Book 6).
Sadly, Snow’s work did not convince everybody: Max von
Pettenkofer, a German hygienist, developed a rival soil
theory. He proposed that the cholera germ resided in the soil
and that under particular environmental circumstances it
would arise, form a miasma and produce a cholera epidemic.
David Cunningham, who was a scientific assistant to the
Sanitary Commissioner with the Government of India from
1869–1897, also espoused these views. The biggest killer of
British troops in India was epidemic disease, and following
the Indian mutiny of 1857, cholera was the leading cause of
these deaths. Cunningham was recruited to study cholera,
with a view to controlling it, following an epidemic in 1867
at a religious fair in Hardwar (in the state of Uttar Pradesh),
which claimed the lives of over 100 000 people. Cunningham
was a prominent worker on cholera for many years, but his
����
������������������������������ ���������
����������������������
����������
���������
��������������������� ��
����������������������������
��������������!���"�����
�������������#���!��
������������
$
FIGURE 1.1
John Snow’s map of cholera deaths in
the Broad Street area of London. The
small black bars indicate deaths from
cholera.
s320_cs_cholera_v4.pmd 15/01/2003, 16:036
7
CHOLERA CASE STUDY
adherence to the miasmic theory of the cause of cholera meant that some
preventative measures such as quarantines were not imposed, often with disastrous
consequences (Isaacs, 1998).
The field of microbiology was now just beginning to open up, and in 1883, with the
fifth cholera pandemic on its way to Europe, Robert Koch was despatched to
Egypt. The German doctor was fresh from his triumph of discovering the causative
agent of tuberculosis, and by working with cholera victims he was able to isolate
the causative agent of cholera. Koch showed that cholera was caused by a comma-
shaped bacterium, subsequently referred to as a ‘vibrio’ and named Vibrio cholerae.
Koch isolated the bacterium again in India in 1884, and showed that the bacillus
lived in the human gut and was spread by dirty water. Cunningham and von
Pettenkofer remained unconvinced, but one must have some sympathy with the
latter here. He asked Koch to send him some of his cholera vibrios, which he then
drank. Von Pettenkofer remained in perfect health, which convinced him that his
theory, that the cholera germ alone could not cause the disease, was vindicated! It
seems that von Pettenkofer had a stomach acidic enough to kill Vibrio cholerae.
What other reason might there have been for von Pettenkofer’s continuing
good health?
Perhaps a very high dose of vibrios is required to cause disease – more than von
Pettenkofer ingested. More prosaically, it is possible that the conditions under
which the bacteria were transported were unable to maintain them in a viable
condition.
As the 19th century drew to a close, the spectre of cholera had largely been
vanquished. Improvements in public health in the developed world had finally
achieved their goal, and many diseases, such as typhoid and tuberculosis as well as
cholera, had declined in incidence as a result. The last cholera epidemic in the
Americas occurred in 1895, and the disease was even absent from Africa for almost
a century. Nevertheless, sporadic cases, as well as epidemics elsewhere, show that
the disease is still a threat, as you will see below.
2 The disease
Cholera is only one of many types of diarrhoeal disease, but its global importance is
underlined by its inclusion in the WHO Communicable Disease Surveillance and
Response (CSR) list. Cholera is typically an acute disease, with an incubation period
of 2–3 days, but asymptomatic infections are common. Over 90% of infections are,
in fact, very mild or moderate and difficult to distinguish from other types of
diarrhoea, such as that caused by enterotoxigenic E. coli (ETEC) (Book 2, Section
2.6.4). Fewer than 10% of infected individuals go on to develop the typical disease,
with its sudden onset of profuse watery diarrhoea, effortless vomiting and in some
cases fever.
Recall the molecular mechanisms leading to the production of diarrhoea in
cholera and in ETEC infection.
Both cholera toxin and the heat-labile toxin of ETEC bind specific gangliosides
in the membranes of gut epithelial cells, and activate membrane-bound adenylate
cyclase. This increases cyclic AMP production, which causes efflux of Na+ and
s320_cs_cholera_v4.pmd 15/01/2003, 16:037
8
S320 INFECTIOUS DISEASE
Cl− ions across the membrane and into the gut lumen. The presence of these
ions in high concentrations ‘pulls’ water out of the surrounding cells, and the
result is copious amounts of water in the gut.
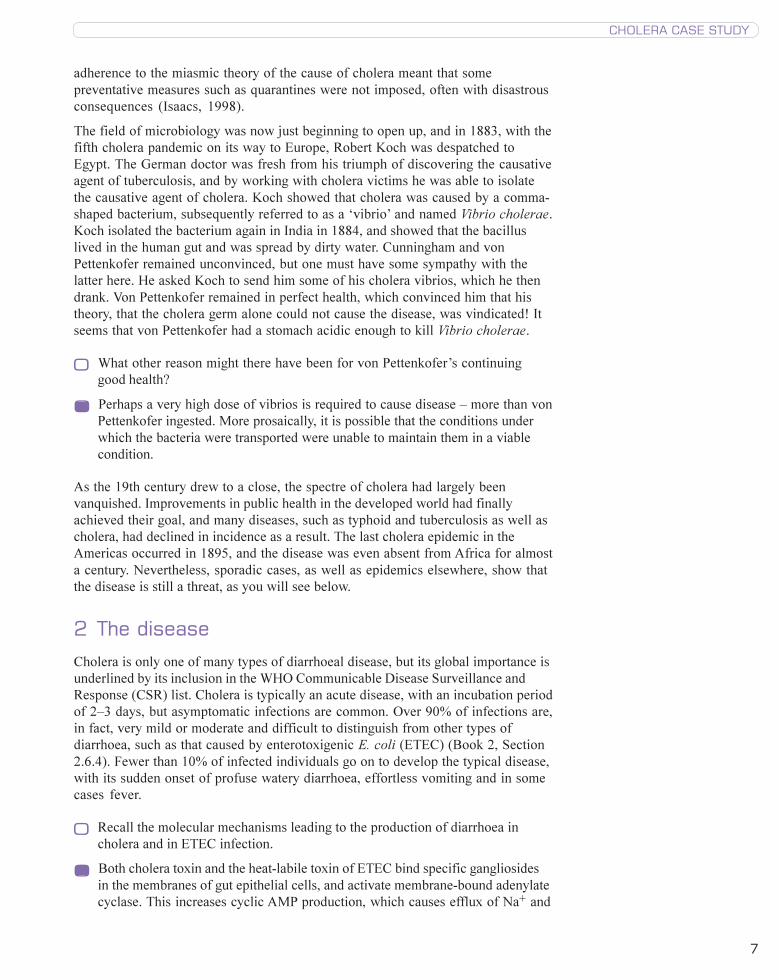
The main symptom of cholera is profuse, watery diarrhoea, which resembles the
cloudy water left behind after rice has been boiled and so is often described as
rice-water stools (see Figure 2.1). These stools are pale grey, flecked with mucus,
and have a fishy smell. As much as 10–15 litres of diarrhoea may be produced
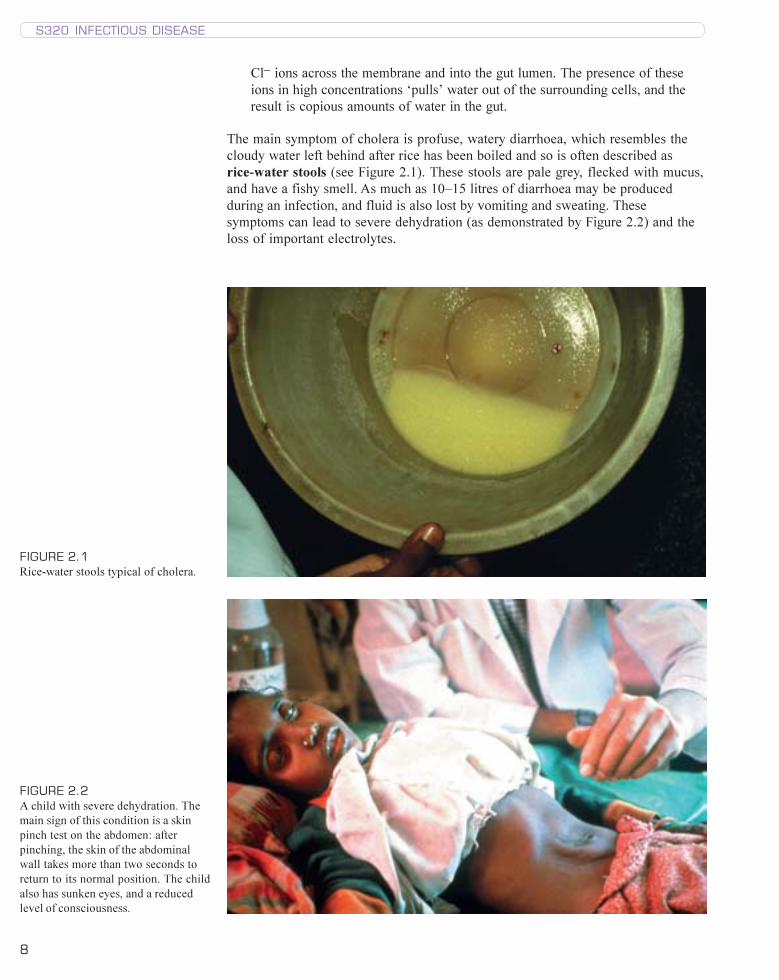
during an infection, and fluid is also lost by vomiting and sweating. These
symptoms can lead to severe dehydration (as demonstrated by Figure 2.2) and the
loss of important electrolytes.
FIGURE 2.1
Rice-water stools typical of cholera.
FIGURE 2.2
A child with severe dehydration. The
main sign of this condition is a skin
pinch test on the abdomen: after
pinching, the skin of the abdominal
wall takes more than two seconds to
return to its normal position. The child
also has sunken eyes, and a reduced
level of consciousness.
s320_cs_cholera_v4.pmd 15/01/2003, 16:038
9
CHOLERA CASE STUDY
Name two important electrolytes that are lost during cholera.
Na+ and Cl− ions, as mentioned above. Potassium (K+) and bicarbonate (HCO3
−)
ions are also lost in large quantities.
The loss of K+ ions results in cramps in the abdominal muscles, whereas a
reduction in HCO3− ions can upset the pH balance of the body. The resulting severe
dehydration causes the production of urine to cease, the skin to become wrinkled,
and sometimes the eyes to appear sunken. The subsequent loss of fluid volume
causes a drop in blood pressure and circulatory shock. If the patient remains
untreated, they become progressively weaker, sometimes to the point of death,
within 12–24 hours of the onset of symptoms. If the patient survives, then the
infection usually lasts 1–5 days.
3 Vibrio cholerae, the causative agent of cholera
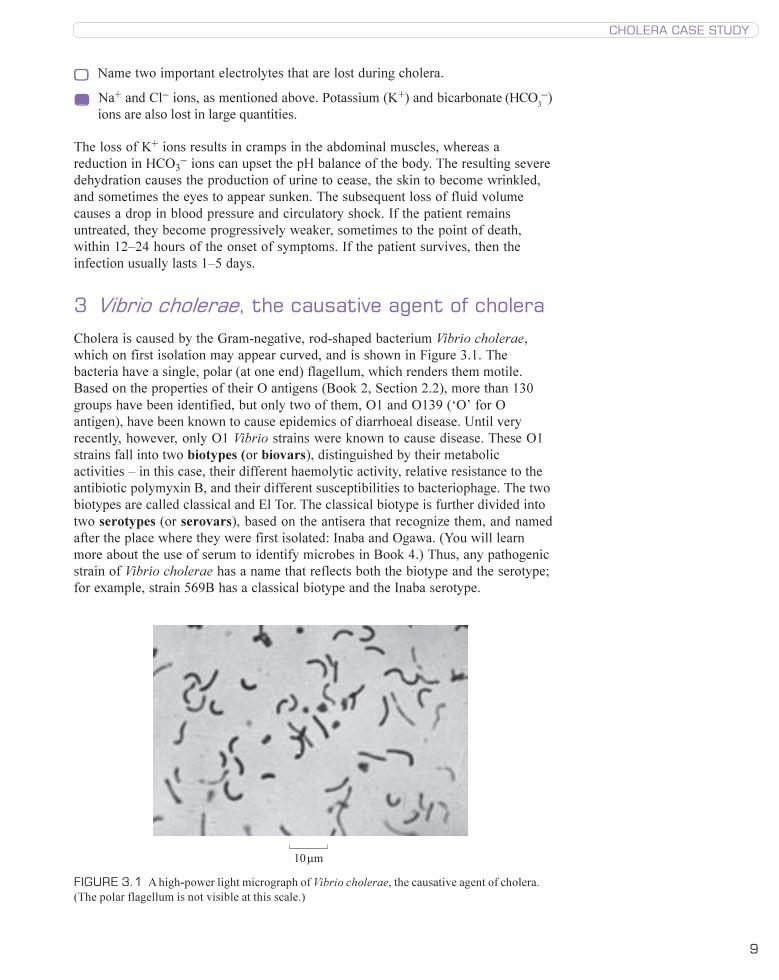
Cholera is caused by the Gram-negative, rod-shaped bacterium Vibrio cholerae,
which on first isolation may appear curved, and is shown in Figure 3.1. The
bacteria have a single, polar (at one end) flagellum, which renders them motile.
Based on the properties of their O antigens (Book 2, Section 2.2), more than 130
groups have been identified, but only two of them, O1 and O139 (‘O’ for O
antigen), have been known to cause epidemics of diarrhoeal disease. Until very
recently, however, only O1 Vibrio strains were known to cause disease. These O1
strains fall into two biotypes (or biovars), distinguished by their metabolic
activities – in this case, their different haemolytic activity, relative resistance to the
antibiotic polymyxin B, and their different susceptibilities to bacteriophage. The two
biotypes are called classical and El Tor. The classical biotype is further divided into
two serotypes (or serovars), based on the antisera that recognize them, and named
after the place where they were first isolated: Inaba and Ogawa. (You will learn
more about the use of serum to identify microbes in Book 4.) Thus, any pathogenic
strain of Vibrio cholerae has a name that reflects both the biotype and the serotype;
for example, strain 569B has a classical biotype and the Inaba serotype.
FIGURE 3.1 A high-power light micrograph of Vibrio cholerae, the causative agent of cholera.
(The polar flagellum is not visible at this scale.)
����
s320_cs_cholera_v4.pmd 15/01/2003, 16:049
10
S320 INFECTIOUS DISEASE
Until recently, humans were thought to be the only host for Vibrio cholerae,
especially as there are particular populations in which cholera is endemic. However,
in general the vibrios are aquatic bacteria, and recent studies have shown that
V. cholerae is also found naturally in aquatic environments, such as estuaries and
brackish water.
3.1 V. cholerae pathobiology
Infection with the cholera bacterium occurs by the faecal–oral route, as a result of
consuming food or water contaminated with V. cholerae. The infectious dose is
high, requiring a minimum of 108 bacteria for classical V. cholerae in a healthy host
(which may be why von Pettenkofer did not catch cholera – see above), but this
figure falls when acid production by the stomach is impaired. The vibrios that
survive passage through the stomach are able to multiply in the alkaline environment
of the small intestine. In fact, the tolerance of cholera vibrios to alkaline conditions
is one of their distinguishing features.
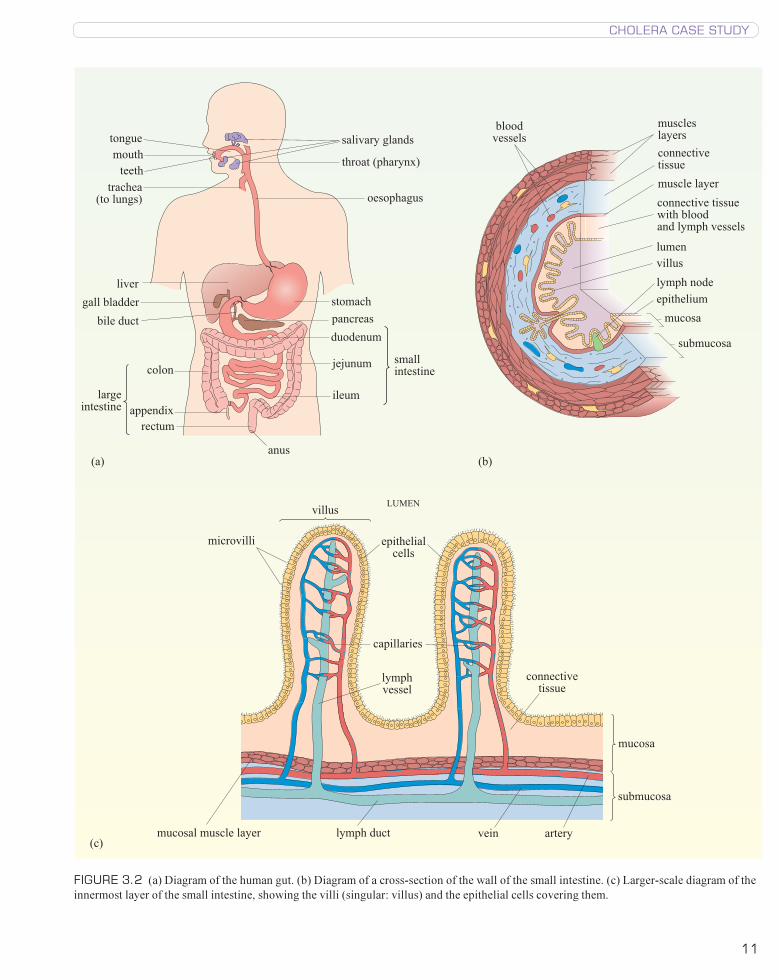
V. cholerae exerts its pathogenic effects in the small intestine, the structure of
which is shown in Figure 3.2. Once in the small intestine, the vibrios must reach
the epithelial cells, and they are probably aided in this task by their flagella, which
help in propulsion, and by their ability to produce mucinase (an enzyme capable of
degrading mucus) and other proteolytic enzymes. Actual attachment to the epithelial
cells is mediated by a number of factors, the most important of which is a surface
molecule called the toxin-coregulated pilus (TCP), discussed further below. A
number of haemagglutinins, fimbriae and the O antigens of lipopolysaccharide have
also been implicated in the attachment process.
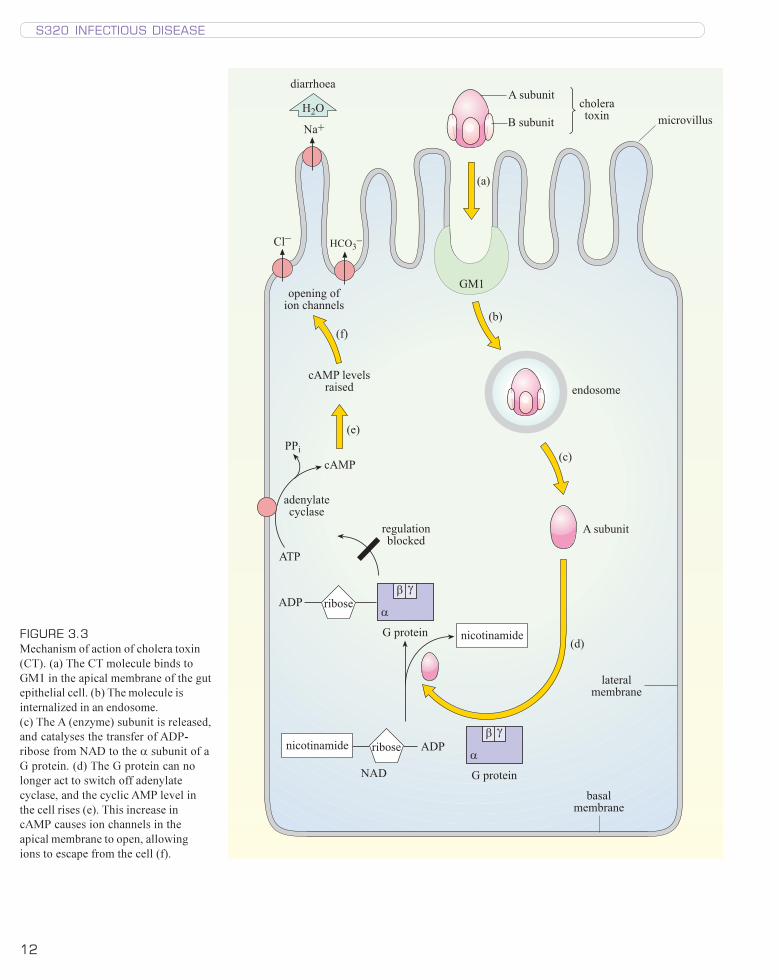
The cholera vibrios do not penetrate the gut epithelium, but they release a potent
enterotoxin called cholera toxin, CT (or choleragen), which is largely responsible
for the symptoms of cholera. CT has an A–B structure, comprising five B subunits
and one A subunit, which is an enzyme. The B subunits mediate attachment to the
villi of the epithelial cells by binding to the ganglioside receptor GM1, and the CT is
taken up by receptor-mediated endocytosis, as shown in Figure 3.3. The A subunit
is then released and goes on to catalyse the transfer of an ADP-ribose from NAD to
the α subunit of a G protein. The modified G protein is no longer able to switch off
adenylate cyclase, a membrane-bound enzyme located on the basal and lateral
membranes of the cell.
Adenylate cyclase produces cyclic adenosine monophosphate (cAMP) from ATP as
shown in the equation below:
ATPÔ cAMP + PPi + H+
cAMP is a key regulatory molecule that carries information from extracellular
signalling molecules such as hormones, to the cell’s interior. For this reason it is
called a second messenger.
What would be called the first messenger?
The hormone.
The level of cAMP within a cell therefore influences its activity, but its precise role
depends on the cell type. In a gut epithelial cell, cAMP level influences ion
transport, whereas in a pancreatic cell, it regulates insulin secretion. As mentioned
above, adenylate cyclase is regulated by a protein, known as a G protein, which is a
s320_cs_cholera_v4.pmd 15/01/2003, 16:0410
11
CHOLERA CASE STUDY
�����������
���������
��� ������
����
��� �����
���� ����
�����
������������
������������
���
����� �����
���� �������
�����������
��������
�������
�����
�������������
��
���������
������
������ ���
���������� ���������� ������� ����� �������
����������������
�����������
����������
�����
��������
����� ����
�����
������������
�����������
��������� ��������������
��������
�����������
����������������
�����
��������
������������ ���������� ������ ���
���
���
FIGURE 3.2 (a) Diagram of the human gut. (b) Diagram of a cross-section of the wall of the small intestine. (c) Larger-scale diagram of the
innermost layer of the small intestine, showing the villi (singular: villus) and the epithelial cells covering them.
s320_cs_cholera_v4.pmd 15/01/2003, 16:0411
12
S320 INFECTIOUS DISEASE
�
� �������
�
� �������
�������
� �
��������
��������
�����������
���
�����������
��������
��������������
�������������
��������
��
���
� �
���������������
����������������
����
�����������������
�������� ������������
!�"
��#
$!%&"
$'%
���������
�������
�����������
�����������
���
(�)
(�)
(�)
(�)
(�)
( )
FIGURE 3.3
Mechanism of action of cholera toxin
(CT). (a) The CT molecule binds to
GM1 in the apical membrane of the gut
epithelial cell. (b) The molecule is
internalized in an endosome.
(c) The A (enzyme) subunit is released,
and catalyses the transfer of ADP-
ribose from NAD to the α subunit of a
G protein. (d) The G protein can no
longer act to switch off adenylate
cyclase, and the cyclic AMP level in
the cell rises (e). This increase in
cAMP causes ion channels in the
apical membrane to open, allowing
ions to escape from the cell (f).
s320_cs_cholera_v4.pmd 15/01/2003, 16:0412
13
CHOLERA CASE STUDY
complex of three different subunits, α, β and γ. The A subunit of the cholera toxin
catalyses the transfer of ADP-ribose group from NAD to the α subunit of the
G protein. This prevents the G protein from switching off the synthesis of cAMP,
with the result that cAMP is produced constitutively (i.e. at a constant rate). The
high levels of cAMP cause ion channels in the cell membrane of the crypt cells at
the base of the villi in the small intestine to open, resulting in uncontrolled secretion
of Cl− and HCO3− ions into the lumen. The high cAMP levels also inhibit the uptake
of Na+ ions into the cells at the top of the villi, with the result that Na+ and Cl− ions
accumulate in the lumen. Water moves out of the epithelial cells into the lumen by
osmosis, and both water and electrolytes are lost from the body as the copious
diarrhoea of cholera.
The virulence factors that are responsible for the pathogenesis of Vibrio cholerae
are encoded by two lysogenic phages: CTXφ (pronounced CTX fie) and VPIφ.
Phage CTXφ encodes the cholera toxin (CT) and also two other toxins, accessory
cholera toxin (Ace) and zona occludens toxin (Zot), whose roles in pathogenesis
have not yet been clearly established. Zot is thought to contribute to the loss of
water and electrolytes from the gut epithelial cells. Phage VPIφ encodes the toxin-
coregulated pilus (TCP, see above), which – curiously – is the receptor for the
CTXφ phage when it infects Vibrio cholerae.
4 Immunology of cholera
4.1 The immune response to cholera
The immune response to enteric pathogens is initiated in the gut-associated
lymphoid tissue (GALT), known as Peyer’s patches. The gastrointestinal tract is an
important route of entry for pathogens, so this lymphoid tissue constantly ‘samples’
the gut contents for antigenic material. After appropriate processing and
presentation of antigen (see Block 3), B cells are stimulated to differentiate into
plasma cells that produce antibodies. The most important antibody classes in a
cholera infection are secretory IgA and, to a lesser extent, secretory IgM, which
are released from the gut mucosa.
What would you expect to happen to antibodies secreted into the gut?
Antibodies are protein molecules and so should be digested along with proteins
in food.
In fact, the antibodies are thought to be protected from this degradation by their J
chains, and secretory IgA has an additional polypeptide called a secretory component
that is believed to serve a similar protective function. The IgA and IgM antibodies
bind to the B subunit of cholera toxin, thereby inactivating it, and they also bind to
the lipopolysaccharide molecules of the bacteria themselves. IgG antibodies are
produced too in response to a cholera infection, but they are largely confined to the
blood. However, some of them do end up in the gut after leaking from the
bloodstream through the damaged epithelium, or following the migration of a B
lymphocyte, and these antibodies are thought to be significant elements of the
immune response to cholera (Qadri et al.,1998).
s320_cs_cholera_v4.pmd 15/01/2003, 16:0413
14
S320 INFECTIOUS DISEASE
4.2 Cholera vaccines
Recovery from a cholera infection brings about long-lasting natural immunity, but
infection with cholera of the classical biotype may provide better protection than a
similar infection with El Tor cholera. So far, the vaccines developed to combat
cholera have been unable to produce the same results.
What would be the best route for administration of a cholera vaccine?
Since Vibrio cholerae is an enteric pathogen, an oral vaccine would have the
most chance of provoking an immune response that resembled the response to a
natural infection, and so result in a similar immunity to the organism.
Several vaccines against cholera have been licensed: killed whole-cell vaccine, killed
whole-cell plus subunit vaccine, and live attenuated vaccines. We will look at each
in turn.
A killed whole-cell (WC) vaccine, comprising a mixture of El Tor and classical
biotypes and Inaba and Ogawa serotypes, has been tried. This vaccine was
administered by injection and did not perform well. The WHO describes it as
conveying ‘incomplete, unreliable protection of short duration’ and they do not
recommend its use.
Can you suggest why the vaccine performed poorly?
Administration of the WC vaccine by injection would not bring the cholera
vibrios into contact with the Peyer’s patches and the most important part of the
immune response against cholera would not be provoked.
A killed WC vaccine of a similar composition to the one above, but with the addition
of the B subunit of the cholera toxin (BS–WC), underwent field trials in Bangladesh
in the 1980s. This vaccine was given in two oral doses and stimulated a secretory
IgA response equivalent to that seen in clinical cholera. High levels of immunity to
cholera were obtained, but they were short-lived. This vaccination has been
suggested as a preventative measure for refugee populations, but has not been
found to provide increased cost-effectiveness in comparison with other prevention
and control measures (Murray et al., 1998).
Live attenuated cholera vaccines have also been developed; the strains used are
altered so that they cannot cause cholera but still retain the ability to colonize the
small intestine when given orally. The vaccine CVD103–HgR, derived from the
classical Inaba strain 569B, was tested in Indonesia between 1993 and 1997. To
produce CVD103–HgR from strain 569B, the Tox A gene, which encodes the A
subunit of cholera toxin, was deleted. The vaccine induced an IgG as well as a
secretory IgA response, but performed poorly overall. Since the current seventh
pandemic is caused by El Tor cholera (see below), a vaccine containing El Tor
V. cholerae might provide more protection than one based entirely on a classical
strain. A cholera vaccine based on CVD103–HgR, but with the addition of an
attenuated derivative of an El Tor strain lacking the genes encoding CT, Ace and Zot,
has since been developed and was very promising when tested in the USA and Peru.
Research and development in cholera vaccination are still ongoing. Recent trials in
Vietnam, which began in 1997, used a killed oral vaccine composed of Vibrio
cholerae O1 and O139 (described as bivalent); the results are not yet (2003)
s320_cs_cholera_v4.pmd 15/01/2003, 16:0414
15
CHOLERA CASE STUDY
available. As yet, routine cholera vaccination is not cost-effective, because more
than one dose is usually required, immunity does not last long and the disease is
relatively rare. Nevertheless, pre-emptive vaccination of refugee populations seems
to be effective in preventing large-scale epidemics. At present, no country demands
a certificate of cholera vaccination as a condition of entry.
5 Treatment of cholera
With no cost-effective vaccine available, other measures such as treatment and
prevention assume great importance. Prevention of cholera depends on interrupting
the faecal–oral route, so that food and drink remain uncontaminated with faecal
material. This can be achieved with proper sanitation, clean water and hygienic
methods of food preparation, which are fairly simple practices, but sadly, well
beyond the means of many people.
If a person contracts cholera, it is imperative that they are treated as quickly as
possible, since untreated cholera can have a case fatality rate as high as 50%.
Fortunately, effective treatment can reduce this rate to less than 1%. More
importantly, for many countries, effective treatment is cheap, comprising oral
rehydration to replace lost fluid and electrolytes.
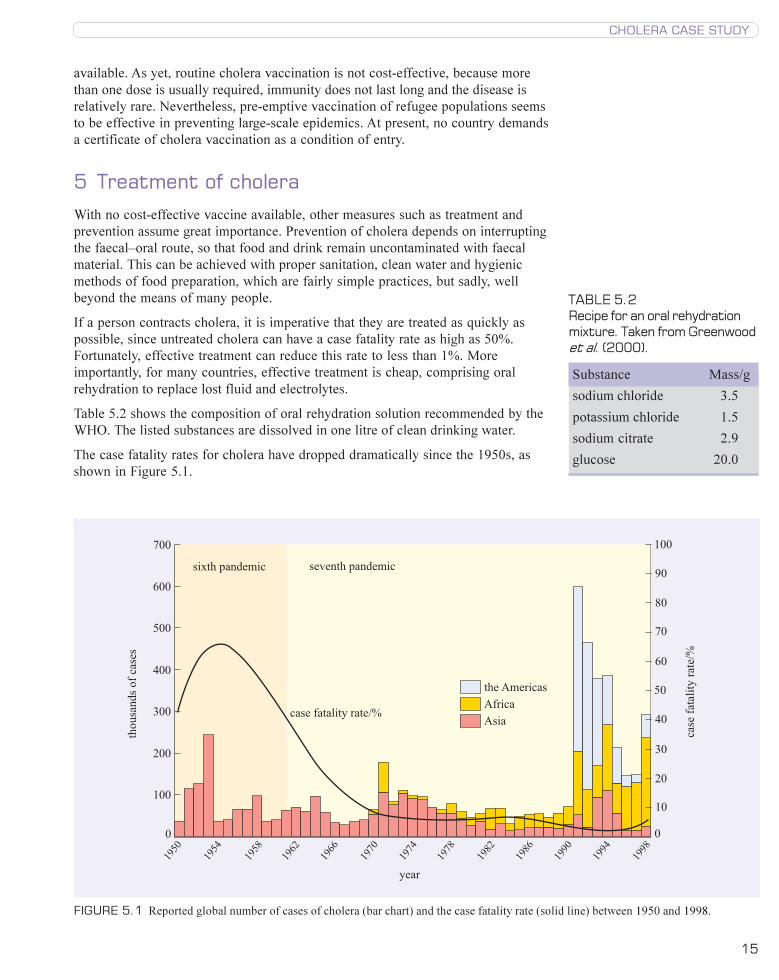
Table 5.2 shows the composition of oral rehydration solution recommended by the
WHO. The listed substances are dissolved in one litre of clean drinking water.
The case fatality rates for cholera have dropped dramatically since the 1950s, as
shown in Figure 5.1.
����������� ������������
����������� ����
�
���
���
���
���
���
���
���
������
�������������
�
��
��
��
��
��
��
��
��
�
���
!��� �����!���� ��
!���
����
� ��
� ��
� ��
� ��
� ��
� ��
� ��
� ��
� ��
� ��
� �
� �
� �
�������������������
TABLE 5.2Recipe for an oral rehydrationmixture. Taken from Greenwoodet al. (2000).
Substance Mass/g
sodium chloride 3.5
potassium chloride 1.5
sodium citrate 2.9
glucose 20.0
FIGURE 5.1 Reported global number of cases of cholera (bar chart) and the case fatality rate (solid line) between 1950 and 1998.
s320_cs_cholera_v4.pmd 15/01/2003, 16:0415
16
S320 INFECTIOUS DISEASE
What are the probable reasons for this fall?
Case fatality rates are likely to have dropped partly because treatment has
become more easily available, and, as you will learn below, partly because El Tor
cholera is less virulent than classical cholera.
Oral rehydration therapy was first introduced in the early 1970s, and became
widely available during the 1980s. In 80–90% of cases, oral rehydration alone is
sufficient treatment, but when dehydration is severe, intravenous fluids are
required. In these circumstances, antibiotics may be used to lessen the volume and
duration of diarrhoea and reduce the carriage of vibrios in the faeces. Tetracycline
is the drug of choice, but some V. cholerae are resistant to it and alternatives such
as erythromycin, chloramphenicol, cotrimoxazole or others have to be used instead.
The resistances exhibited by cholera vibrios can change rapidly; in their study of
diarrhoeal stool samples, Kaur and Lal (1998) reported that the strains they isolated
were sensitive to chloramphenicol until 1993, but resistant to this antibiotic from
then onwards. Conversely, these strains were resistant to cotrimoxazole until 1996,
but 100% sensitive to it in 1997.
Case fatality rates differ around the world, averaging around 1% for Asia, Europe
and the Americas but rising to around 5% in Africa. This marked difference reflects
disparities in access to treatment, rather than any variation in the virulence of
V. cholerae.
6 The current cholera pandemic
The seventh and current cholera pandemic began in 1961, immediately after the
‘end’ of the sixth. It arose surprisingly not in India, but in Indonesia in Sulawesi
(Celebes Islands). This time, the causative agent was not the usual, classical
cholera, but a new biotype, El Tor. This biotype was first isolated among pilgrims in
a quarantine station called El Tor, and belonged to the same group (O1) as classical
Vibrio cholerae, but was a different serotype from either Inaba or Ogawa. The
disease it caused was different too: the El Tor strain was less virulent, produced a
less effective immune response and was better able to persist in the environment.
The new El Tor cholera began a relentless advance across the world that continues
today. In 1963 it reached Bangladesh, in 1964 it got to India, and over the following
years it went on to invade the former Soviet Union, Iran and Iraq. Africa was
reached by 1970, but it took another 20 years for El Tor cholera to reach South
America. In January 1991, a Chinese ship released bilge water infected with the
cholera bacillus into the waters of Lima’s port city, Callao. It was summer time,
and the locals were eating ceviche, a dish that contains raw shellfish. The shellfish
quickly became contaminated with cholera bacteria, which soon infected the human
population. The spread of the epidemic was made easier by Lima’s water supply,
which was unchlorinated. In that year, cholera spread rapidly, causing 400 000
reported cases and 4000 deaths in 16 South American countries. Nowhere in the
world had seen an epidemic of these proportions since 1969, the year that cholera
was made reportable under International Health Regulations.
The question of exactly how Vibrio cholerae ended up in the bilge water of a ship is
an interesting one. El Tor vibrios are known to persist longer in the environment
than classical cholera bacteria. Research has shown that the El Tor bacillus is
capable of parasitizing algae and even goes into a kind of reversible suspended
s320_cs_cholera_v4.pmd 15/01/2003, 16:0416
17
CHOLERA CASE STUDY
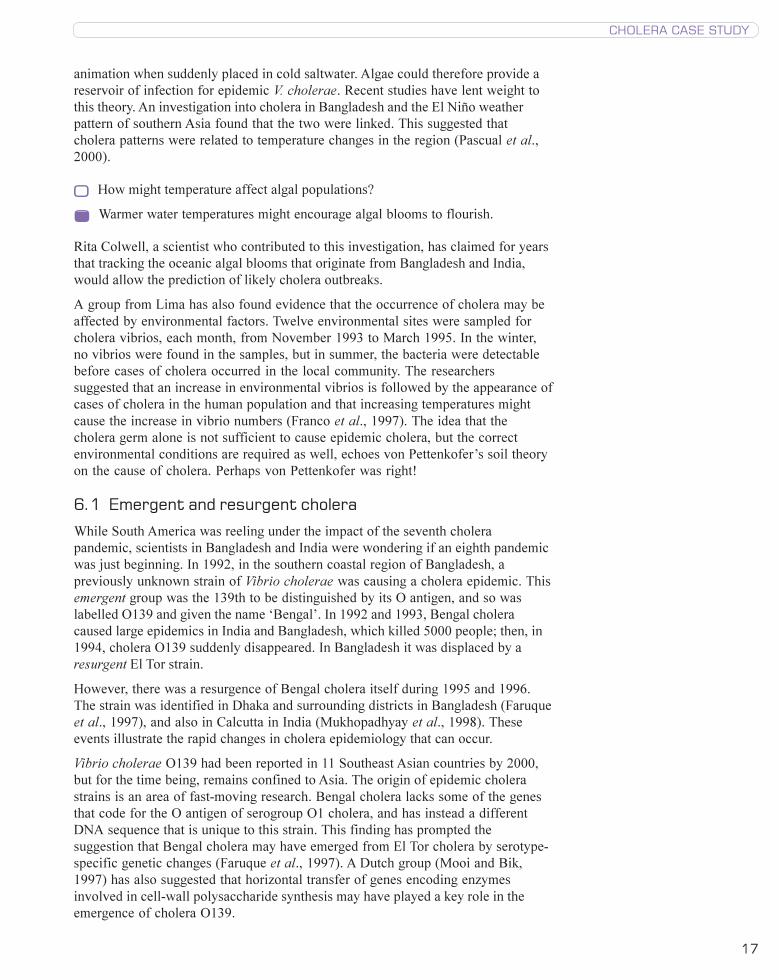
animation when suddenly placed in cold saltwater. Algae could therefore provide a
reservoir of infection for epidemic V. cholerae. Recent studies have lent weight to
this theory. An investigation into cholera in Bangladesh and the El Niño weather
pattern of southern Asia found that the two were linked. This suggested that
cholera patterns were related to temperature changes in the region (Pascual et al.,
2000).
How might temperature affect algal populations?
Warmer water temperatures might encourage algal blooms to flourish.
Rita Colwell, a scientist who contributed to this investigation, has claimed for years
that tracking the oceanic algal blooms that originate from Bangladesh and India,
would allow the prediction of likely cholera outbreaks.
A group from Lima has also found evidence that the occurrence of cholera may be
affected by environmental factors. Twelve environmental sites were sampled for
cholera vibrios, each month, from November 1993 to March 1995. In the winter,
no vibrios were found in the samples, but in summer, the bacteria were detectable
before cases of cholera occurred in the local community. The researchers
suggested that an increase in environmental vibrios is followed by the appearance of
cases of cholera in the human population and that increasing temperatures might
cause the increase in vibrio numbers (Franco et al., 1997). The idea that the
cholera germ alone is not sufficient to cause epidemic cholera, but the correct
environmental conditions are required as well, echoes von Pettenkofer’s soil theory
on the cause of cholera. Perhaps von Pettenkofer was right!
6.1 Emergent and resurgent cholera
While South America was reeling under the impact of the seventh cholera
pandemic, scientists in Bangladesh and India were wondering if an eighth pandemic
was just beginning. In 1992, in the southern coastal region of Bangladesh, a
previously unknown strain of Vibrio cholerae was causing a cholera epidemic. This
emergent group was the 139th to be distinguished by its O antigen, and so was
labelled O139 and given the name ‘Bengal’. In 1992 and 1993, Bengal cholera
caused large epidemics in India and Bangladesh, which killed 5000 people; then, in
1994, cholera O139 suddenly disappeared. In Bangladesh it was displaced by a
resurgent El Tor strain.
However, there was a resurgence of Bengal cholera itself during 1995 and 1996.
The strain was identified in Dhaka and surrounding districts in Bangladesh (Faruque
et al., 1997), and also in Calcutta in India (Mukhopadhyay et al., 1998). These
events illustrate the rapid changes in cholera epidemiology that can occur.
Vibrio cholerae O139 had been reported in 11 Southeast Asian countries by 2000,
but for the time being, remains confined to Asia. The origin of epidemic cholera
strains is an area of fast-moving research. Bengal cholera lacks some of the genes
that code for the O antigen of serogroup O1 cholera, and has instead a different
DNA sequence that is unique to this strain. This finding has prompted the
suggestion that Bengal cholera may have emerged from El Tor cholera by serotype-
specific genetic changes (Faruque et al., 1997). A Dutch group (Mooi and Bik,
1997) has also suggested that horizontal transfer of genes encoding enzymes
involved in cell-wall polysaccharide synthesis may have played a key role in the
emergence of cholera O139.
s320_cs_cholera_v4.pmd 15/01/2003, 16:0417
18
S320 INFECTIOUS DISEASE
7 Cholera at the beginning of the 21st century
In their recent ‘Report on Global Surveillance of Epidemic-prone Infectious
Diseases’ the WHO concluded that:
‘Cholera is a major public health problem that is becoming increasingly
important as the number of countries affected continues to increase.’
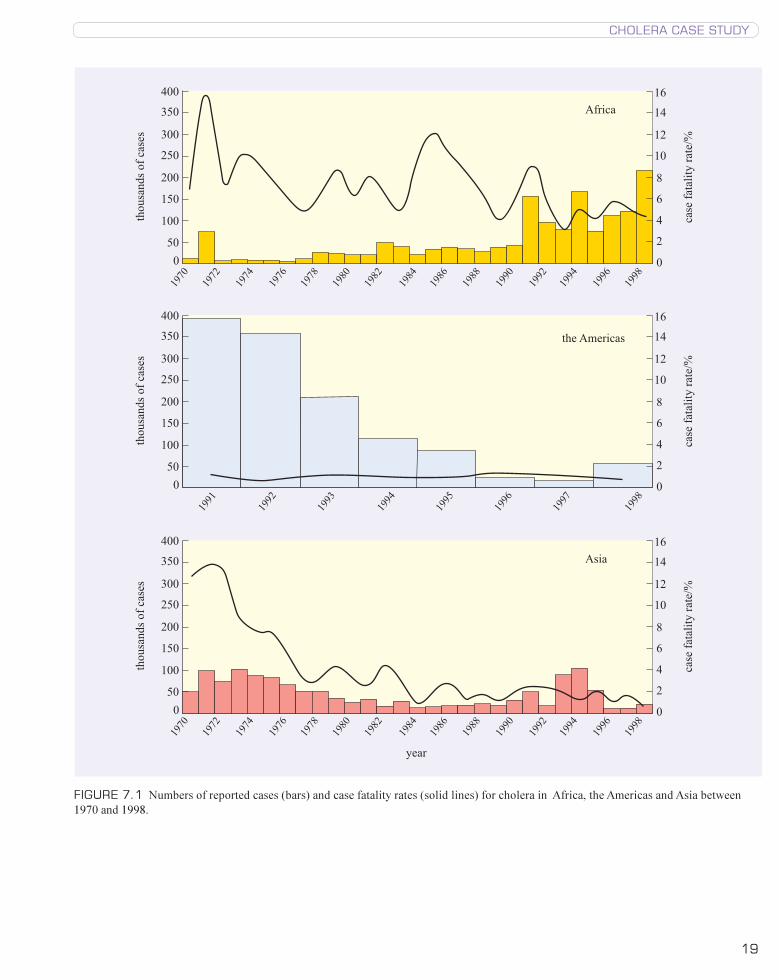
Figure 7.1, taken from the above report, provides a clear picture of cholera in the
closing years of the last century. The enormous impact of the seventh pandemic on
the Americas can be seen, with the number of cases the highest recorded in a
cholera outbreak in the last 30 years. The 1990s also saw large increases in cholera
cases in Asia and Africa, and the trend globally is that of increasing numbers of
people being affected. The WHO reports that the failure of effective epidemic
control has led to an increasing number of areas becoming endemic for cholera.
Africa, particularly, is bearing the brunt of this rise caused by the ongoing seventh
pandemic – in 1998 African cholera cases represented 72% of the global total.
New major outbreaks of cholera continue to occur, and many of these are
associated with climate changes such as El Niño, or the displacement of people into
refugee camps. During 1994 and 1995, the Crimea and Southern Ukraine
experienced a cholera epidemic that infected 1370 people, killing 32 of them. This
epidemic was caused by V. cholerae O1, biotype El Tor, serotype Ogawa bacteria
that were believed to have originated from the environment (Clarke et al., 1998). In
April 1997, cholera broke out among 90 000 Rwandan refugees in the Democratic
Republic of Congo (Morbidity and Mortality Weekly Report, 1998). It would seem
that wherever there is upheaval, whether social or environmental, there is the risk
of cholera. Furthermore, the threat of a new eighth pandemic caused by V. cholerae
O139 Bengal cannot be dismissed.
8 Conclusion
It is clear from the above discussion that cholera is an economically and socially
important disease that has been with us for centuries, and shows no signs of
disappearing. The main strategies for combating V. cholerae appear to be socio-
political: outbreaks occur when there is environmental stress to humans, such as
poverty, displacement or climate change, and where there is no infrastructure
available to support effective sewage disposal and the provision of safe water.
Ironically, cholera treatment is cheap and straightforward, and can be made easily
available almost everywhere. The search for an effective vaccine continues, but
meanwhile new bacterial strains emerge to perpetuate this most distressing disease.
s320_cs_cholera_v4.pmd 15/01/2003, 16:0418
19
CHOLERA CASE STUDY
����
����
��
���
��
�
�
�
�
����
������
�������
�������
�����������
����
����
����
���
����
����
����
����
���
����
����
����
����
����
���
�
��
��
�� ��
��
�
�
�
�
�
����
����
��
���
��
�
�
�
�
����
������
�������
��
����
����
����
����
�
��
��
�� ��
��
�
�
�
�
�
����
����
����
����
����
����
����
��
���
��
�
�
�
�
����
������
�������
������
����
����
����
���
����
����
����
����
���
����
����
����
����
����
���
�
��
��
�� ��
��
�
�
�
�
�
FIGURE 7.1 Numbers of reported cases (bars) and case fatality rates (solid lines) for cholera in Africa, the Americas and Asia between
1970 and 1998.
s320_cs_cholera_v4.pmd 15/01/2003, 16:0419
20
S320 INFECTIOUS DISEASE
9 Learning outcomes
When you have completed this case study, you should be able to:
1 Define and use, or recognize definitions and applications of, each of the terms
printed in bold in the text.
2 Outline the main steps in the identification of V. cholerae as the causative
organism of cholera.
3 Describe the symptoms of cholera.
4 Explain the molecular mechanisms underlying the disease.
5 Describe the body’s response to infection with V. cholerae.
6 Outline measures to prevent and treat cholera.
7 Describe epidemiological evidence that indicates the appearance of cholera
pandemics.
10 References and further sources
Brody, H., Rip, M. R., Vinten-Johansen, P., Paneth, N. and Rachman, S. (2000)
Map-making and myth-making in Broad Street: the London cholera epidemic, 1854,
Lancet, 356, pp. 64–68.
Clark, C. G., Kravetz, A. N., Alekseenko, V. V., Krendelev, Y. D. and Johnson, W.
M. (1998) Microbiological and epidemiological investigation of cholera epidemic in
Ukraine during 1994 and 1995, Epidemiology and Infection, 121(1), pp. 1–13.
Dixon, B. (1994) Power Unseen, W. H. Freeman, Oxford.
Faruque, F. M., Ahmed, K. M., Siddique, A. K., Zaman, K., Alim, A. R. and Albert,
M. J. (1997). Molecular analysis of toxigenic Vibrio cholerae O139 Bengal strains
isolated in Bangladesh between 1993 and 1996: evidence for emergence of a new
clone of the Bengal vibrios, Journal of Clinical Microbiology, 35, pp. 2299–2306.
Franco, A. A., Fix, A. D., Prada, A., Paredes, E., Palomino, J. C., Wright, A. C.,
Johnson, J. A., McCarter, R., Guerra, H. and Morris, J. G. Jr (1997) Cholera in
Lima, Peru, correlates with prior isolation of Vibrio cholerae from the environment,
American Journal of Epidemiology, 146, pp. 1067–1075.
Garrett, L. (1994) The Coming Plague, Penguin Books, London.
Greenwood, D., Slack, R. and Peutherer, J. (eds) (2000) Medical Microbiology
(15th edn), Churchill Livingstone, London.
Groisman, E. A. (ed.) (2001) Principles of Bacterial Pathogenesis, Academic
Press, London.
Isaacs, J. D. (1998) D. D. Cunningham and the aetiology of cholera in British India,
1869–1897, Medical History, 42, pp. 279–305.
Kaur, H. and Lal, M. (1998) Typing and antibiotic susceptibility patterns of Vibrio
cholerae during six consecutive cholera seasons in North India, Tropical
Gastroenterology, 19, pp. 59–61.
Krause, R. M. (2000) Emerging Infections, Academic Press, London.
Mims, C. A., Nash, A. and Stephen, J. (2001) Mims’ Pathogenesis of Infectious
Disease (5th edn), Academic Press, London.
Mooi, F. R. and Bik, E. M. (1997) The evolution of epidemic Vibrio cholerae
strains, Trends in Microbiology, 5, pp. 161–165.
s320_cs_cholera_v4.pmd 15/01/2003, 16:0420
21
CHOLERA CASE STUDY
Cholera outbreak among Rwandan refugees, Democratic Republic of Congo, April
1997, Morbidity and Mortality Weekly Report, 1998, 47(19), pp. 389–391.
Mukhophyay, A. K., Basu, A., Garg, P., Bag, P. K., Ghosh, A., Bhattachararya,
S. K., Takeda, Y. and Nair, G. B. (1998) Molecular epidemiology of re-emergent
Vibrio cholerae O139 Bengal in India, Journal of Clinical Microbiology, 36,
pp. 2149–2152.
Murray, J., McFarland, D. A. and Waldman, R. J. (1998) Cost-effectiveness of oral
cholera vaccine in a stable refugee population at risk for epidemic cholera and in a
population with endemic cholera, Bulletin of the World Health Organization, 76(4),
pp. 343–352.
Pascual, M., Rodo, X., Ellner, S. P., Colwell, R. and Bouma, M. J. (2000) Cholera
dynamics and the El Niño-Southern Oscillation, Science, 289, pp. 1766–1769.
Porter, R. (1997) The Greatest Benefit to Mankind, HarperCollins, London.
Prescott, L. M., Harley, J. P. and Klein, D. A. (1999) Microbiology (15th edn),
WCB McGraw-Hill, London
Qadri, F., Wenneras, C., Albert, M. J., Hossain, J., Mannoor, K., Begum, Y. A.,
Mohi, G., Salam, M. A., Sack, R. B. and Svennerholm A. M. (1997) Comparison of
immune responses in patients infected with Vibrio cholerae O139 and O1, Infection
and Immunity, 65(9), pp. 3571–3576.
Topics in International Health series (on CD-ROM): Diarrhoeal Diseases, The
Wellcome Trust, London.
Acknowledgements
Grateful acknowledgement is made to the following sources for permission to
reproduce material in this booklet:
Cover
Top left: NIBSC/Science Photo Library; top right: David M. Philips/Visual Sun
Limited; lower left: Dr Kari Lounatmaa/Science Photo Library; lower right: CNRI/
Science Photo Library.
Figures
Figure 1.1: Brody, H. et al. (2000) ‘Map-making and myth-making in Broad Street:
the London cholera epidemic, 1854’, Lancet, 356, pp. 64–68, Elsevier Science;
Figure 2.1: Wellcome Photo Library/TMR/R. H. Behrens; Figure 2.2: Wellcome
Photo Library/TMR/International Centre for Diarrhoeal Disease Research,
Bangladesh; Figure 3.1: Wellcome Photo Library/TMR; Figures 5.1, 7.1: WHO
Report on Global Surveillance of Epidemic-prone Infectious Diseases, World Health
Organization.
Table
Table 5.2: Greenwood, D. et al. (1997) ‘Formulation of oral rehydration solution
recommended by the WHO’, A Guide to Microbial Infections, 15th edn, p. 31,
Churchill Livingstone.
Every effort has been made to trace all the copyright owners, but if any has been
inadvertently overlooked, the publishers will be pleased to make the necessary
arrangements at the first opportunity.
s320_cs_cholera_v4.pmd 15/01/2003, 16:0421

22
s320_cs_cholera_v4.pmd 15/01/2003, 16:0422

23
s320_cs_cholera_v4.pmd 15/01/2003, 16:0423

The Open University
ISBN 0 7492 5664 8
s320_cs_cholera_v4.pmd 15/01/2003, 16:0424