Embed Size (px)
DESCRIPTION
hhh
Citation preview
Copyright © 2010 Pearson Education, Inc. Publishing as Prentice Hall.Copyright © 2010 Pearson Education, Inc. Publishing as Prentice Hall. 14-1
Chapter 14Sourcing
Decisions in a Supply Chain

Copyright © 2010 Pearson Education, Inc. Publishing as Prentice Hall. 14-2
Outline The Role of Sourcing in a Supply Chain In-House or Outsource Third- and Fourth-Party Logistics Providers Supplier Scoring and Assessment Supplier Selection – Auctions and Negotiations Contracts, risk Sharing, and Supply Chain Performance Design Collaboration The Procurement Process Sourcing Planning and Analysis The Role of IT in Sourcing Risk Management in sourcing Making Sourcing Decisions in Practice Summary of Learning Objectives
Copyright © 2010 Pearson Education, Inc. Publishing as Prentice Hall. 14-3
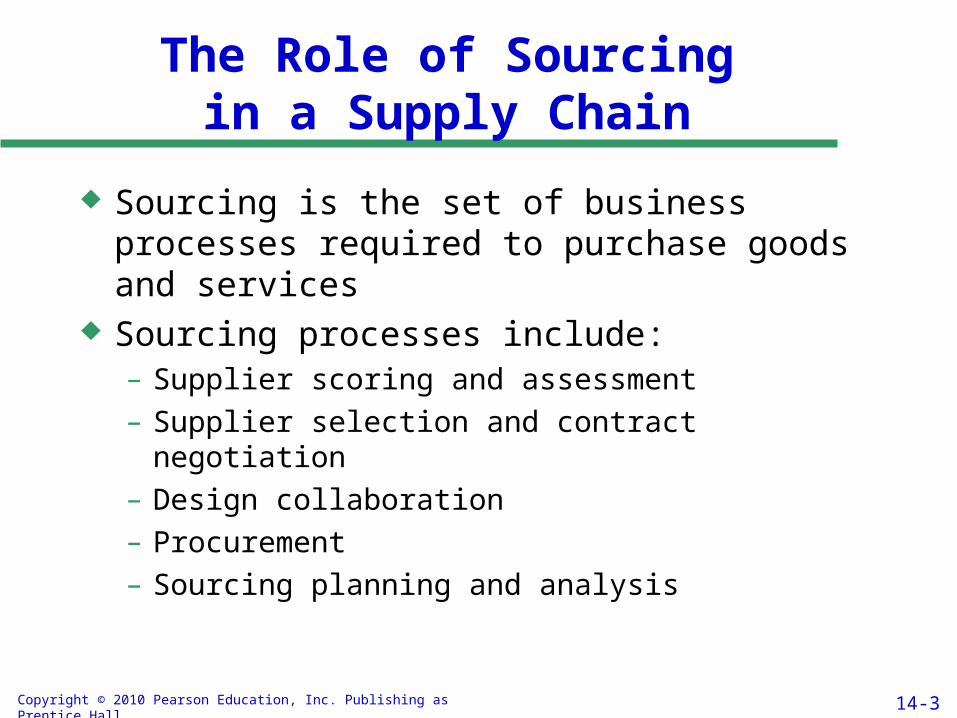
The Role of Sourcingin a Supply Chain
Sourcing is the set of business processes required to purchase goods and services
Sourcing processes include:– Supplier scoring and assessment
– Supplier selection and contract negotiation
– Design collaboration
– Procurement
– Sourcing planning and analysis

Copyright © 2010 Pearson Education, Inc. Publishing as Prentice Hall. 14-4
Benefits of EffectiveSourcing Decisions
Better economies of scale can be achieved if orders are aggregated
More efficient procurement transactions can significantly reduce the overall cost of purchasing
Design collaboration can result in products that are easier to manufacture and distribute, resulting in lower overall costs
Good procurement processes can facilitate coordination with suppliers
Appropriate supplier contracts can allow for the sharing of risk
Firms can achieve a lower purchase price by increasing competition through the use of auctions

Copyright © 2010 Pearson Education, Inc. Publishing as Prentice Hall.
Supplier Scoring and Assessment
Supplier performance should be compared on the basis of the supplier’s impact on total cost
There are several other factors besides purchase price that influence total cost
14-5

Copyright © 2010 Pearson Education, Inc. Publishing as Prentice Hall. 14-6
Supplier Assessment Factors
Replenishment Lead Time On-Time Performance Supply Flexibility Delivery Frequency /
Minimum Lot Size Supply Quality Inbound Transportation Cost
Pricing Terms Information Coordination
Capability Design Collaboration
Capability Exchange Rates, Taxes,
Duties Supplier Viability

Copyright © 2010 Pearson Education, Inc. Publishing as Prentice Hall. 14-7
Supplier Selection- Auctions and Negotiations
Supplier selection can be performed through competitive bids, reverse auctions, and direct negotiations
Supplier evaluation is based on total cost of using a supplier
Auctions:– Sealed-bid first-price auctions
– English auctions
– Dutch auctions
– Second-price (Vickery) auctions
Copyright © 2010 Pearson Education, Inc. Publishing as Prentice Hall. 14-8
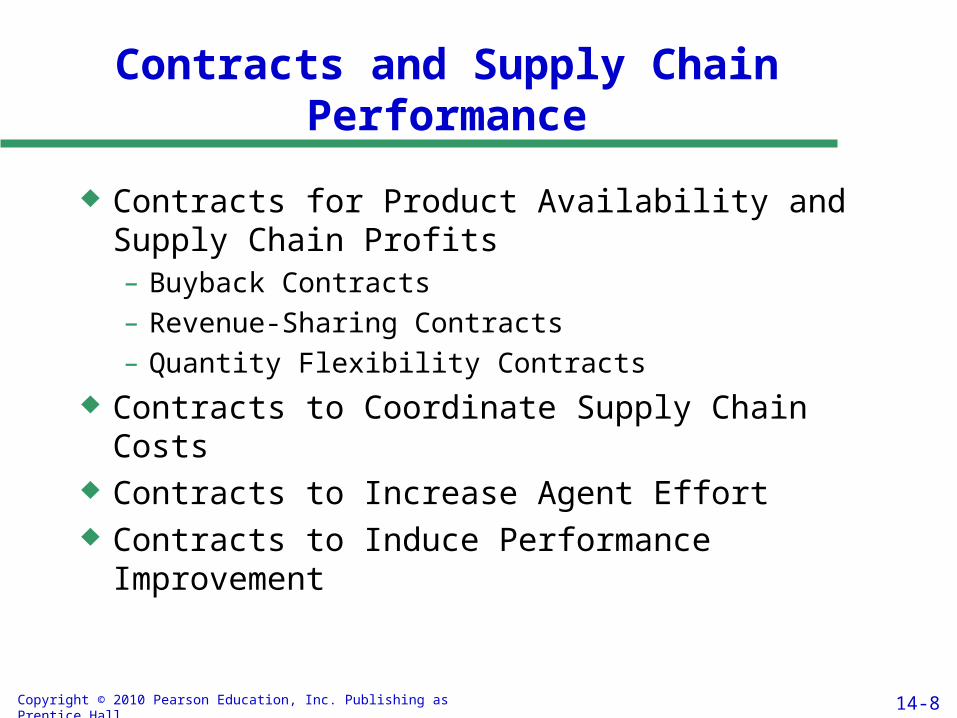
Contracts and Supply Chain Performance
Contracts for Product Availability and Supply Chain Profits– Buyback Contracts
– Revenue-Sharing Contracts
– Quantity Flexibility Contracts
Contracts to Coordinate Supply Chain Costs Contracts to Increase Agent Effort Contracts to Induce Performance Improvement

Copyright © 2010 Pearson Education, Inc. Publishing as Prentice Hall. 14-9
Contracts for Product Availability and Supply Chain Profits
Many shortcomings in supply chain performance occur because the buyer and supplier are separate organizations and each tries to optimize its own profit
Total supply chain profits might therefore be lower than if the supply chain coordinated actions to have a common objective of maximizing total supply chain profits
An approach to dealing with this problem is to design a contract that encourages a buyer to purchase more and increase the level of product availability
The supplier must share in some of the buyer’s demand uncertainty

Copyright © 2010 Pearson Education, Inc. Publishing as Prentice Hall.
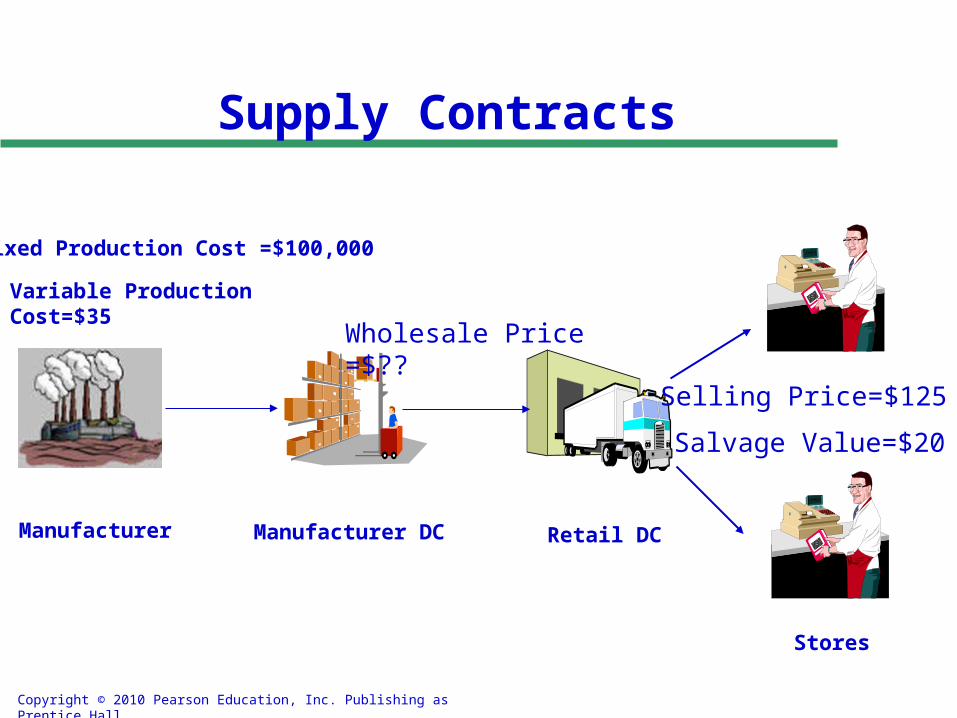
Manufacturer Manufacturer DC Retail DC
Stores
Fixed Production Cost =$100,000
Variable Production Cost=$35
Selling Price=$125Salvage Value=$20
Wholesale Price =$80
Supply Contracts

Copyright © 2010 Pearson Education, Inc. Publishing as Prentice Hall.
Demand Scenarios
Demand Scenarios
0%5%
10%15%20%25%30%
Sales
P
robabili
ty

Copyright © 2010 Pearson Education, Inc. Publishing as Prentice Hall.
Retailer Expected Profit
Expected Profit
0
100000
200000
300000
400000
500000
6000 8000 10000 12000 14000 16000 18000 20000
Order Quantity

Copyright © 2010 Pearson Education, Inc. Publishing as Prentice Hall.
Retailer Expected Profit
Expected Profit
0
100000
200000
300000
400000
500000
6000 8000 10000 12000 14000 16000 18000 20000
Order Quantity

Copyright © 2010 Pearson Education, Inc. Publishing as Prentice Hall.
Retailer orders for 12000 swimsuits
Demand ProbRevenue
125
Whole Sale
Price 80
Fixed Cost
Salvage Value 20
Retailer Profit
Weighted Retail
Average
Manuf Profit
Weighted Average Manuf Profit
8000 0.11 1000000 960000 100000 80000 120000 13200 440000 48400
10000 0.11 1250000 960000 100000 40000 330000 36300 440000 48400
12000 0.275 1500000 960000 100000 0 540000 148500 440000 121000
14000 0.225 1500000 960000 100000 0 540000 121500 440000 99000
16000 0.185 1500000 960000 100000 0 540000 99900 440000 81400
18000 0.095 1500000 960000 100000 0 540000 51300 440000 41800
Total Expected Profit 470700 440000
Total Supply Chain Profit 910700

Copyright © 2010 Pearson Education, Inc. Publishing as Prentice Hall.
Supply Contracts (cont.)
Retailer optimal order quantity is 12,000 units Retailer expected profit is $470,000 Manufacturer profit is $440,000 Total Supply Chain Profit is $910,000
–Is there anything that the retailer and manufacturer can do to increase the profit of both?

Copyright © 2010 Pearson Education, Inc. Publishing as Prentice Hall.
Manufacturer Manufacturer DC Retail DC
Stores
Fixed Production Cost =$100,000
Variable Production Cost=$35
Selling Price=$125
Salvage Value=$20
Wholesale Price =$80
Supply Contracts

Copyright © 2010 Pearson Education, Inc. Publishing as Prentice Hall. 14-17
Contracts for Product Availability and Supply Chain Profits: Buyback Contracts Allows a retailer to return unsold inventory up to a
specified amount at an agreed upon price Increases the optimal order quantity for the retailer,
resulting in higher product availability and higher profits for both the retailer and the supplier
Downside is that buyback contract results in surplus inventory that must be disposed of, which increases supply chain costs
Can also increase information distortion through the supply chain because the supply chain reacts to retail orders, not actual customer demand

Copyright © 2010 Pearson Education, Inc. Publishing as Prentice Hall.
Buy back contract
Retailer proposes that unsold goods should be taken back by the manufacturer under ‘Buy back’ arrangement for $55 per unit

Copyright © 2010 Pearson Education, Inc. Publishing as Prentice Hall.
Retailer orders for 12000 swimsuits with buy back arrangement
Demand ProbSalesPrice
BuyBack
Wholesle Price
Varialecost
Fixedcost
Profit Average Profit
125 55 80 35 100000 Retailer Manuf Retailer Manuf
8000 0.11 1000000 220000 96000042000
0 100000 260000 220000 28600 24200
10000 0.11 1250000 110000 96000042000
0 100000 400000 330000 44000 36300
12000 0.275 1500000 0 96000042000
0 100000 540000 440000 148500 121000
14000 0.225 1500000 0 96000042000
0 100000 540000 440000 121500 99000
16000 0.185 1500000 0 96000042000
0 100000 540000 440000 99900 81400
18000 0.095 1500000 0 96000042000
0 100000 540000 440000 51300 41800
Total Expected Profit 493800 403700
TotalSupply Chain Profit 897500

Copyright © 2010 Pearson Education, Inc. Publishing as Prentice Hall.
Retailer orders for 14000 swimsuits with buy back arrangement
Demand ProbSales Price
Buy Back
Wholesale Price
Variable cost
Fixed cost
Profit Average Profit
125 55 80 35 100000 Retailer Manuf Retailer Manuf
8000 0.11 1000000 330000 1120000 490000 100000 210000 200000 23100 22000
10000 0.11 1250000 220000 1120000 490000 100000 350000 310000 38500 34100
12000 0.275 1500000 110000 1120000 490000 100000 490000 420000 134750 115500
14000 0.225 1750000 0 1120000 490000 100000 630000 530000 141750 119250
16000 0.185 1750000 0 1120000 490000 100000 630000 530000 116550 98050
18000 0.095 1750000 0 1120000 490000 100000 630000 530000 59850 50350
Total Expected Profit 514500 439250
Total Supply Chain Profit 953750
Copyright © 2010 Pearson Education, Inc. Publishing as Prentice Hall.
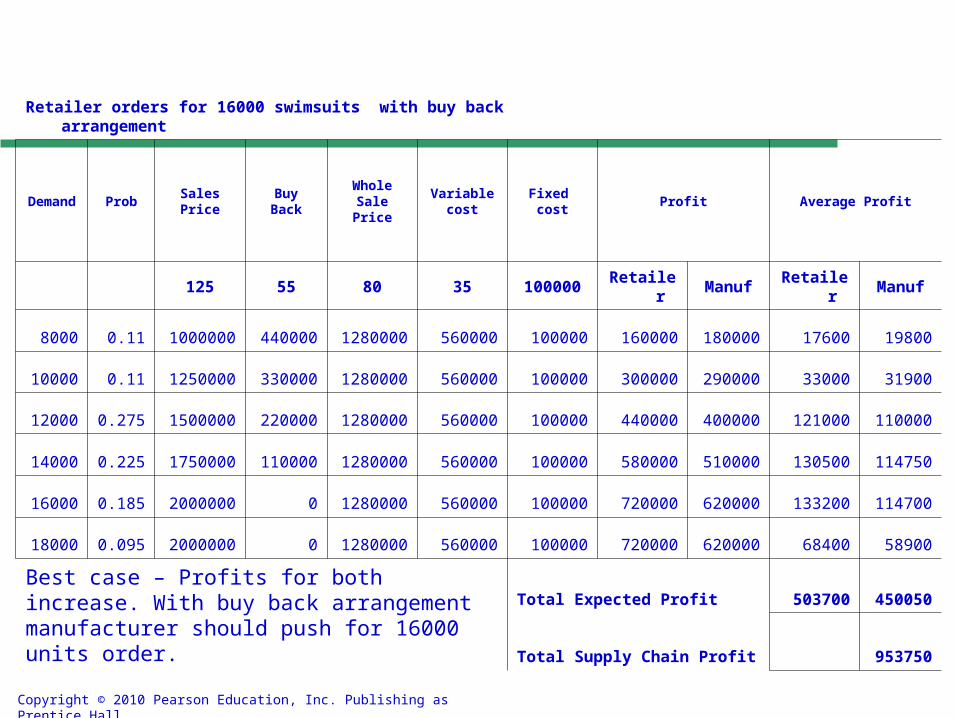
Retailer orders for 16000 swimsuits with buy back arrangement
Demand ProbSalesPrice
BuyBack
WholeSalePrice
Variablecost
Fixed cost
Profit Average Profit
125 55 80 35 100000 Retailer Manuf Retailer Manuf
8000 0.11 1000000 440000 1280000 560000 100000 160000 180000 17600 19800
10000 0.11 1250000 330000 1280000 560000 100000 300000 290000 33000 31900
12000 0.275 1500000 220000 1280000 560000 100000 440000 400000 121000 110000
14000 0.225 1750000 110000 1280000 560000 100000 580000 510000 130500 114750
16000 0.185 2000000 0 1280000 560000 100000 720000 620000 133200 114700
18000 0.095 2000000 0 1280000 560000 100000 720000 620000 68400 58900
Best case – Profits for both increase. With buy back arrangement manufacturer should push for 16000 units order.
Total Expected Profit 503700 450050
Total Supply Chain Profit 953750
Copyright © 2010 Pearson Education, Inc. Publishing as Prentice Hall.
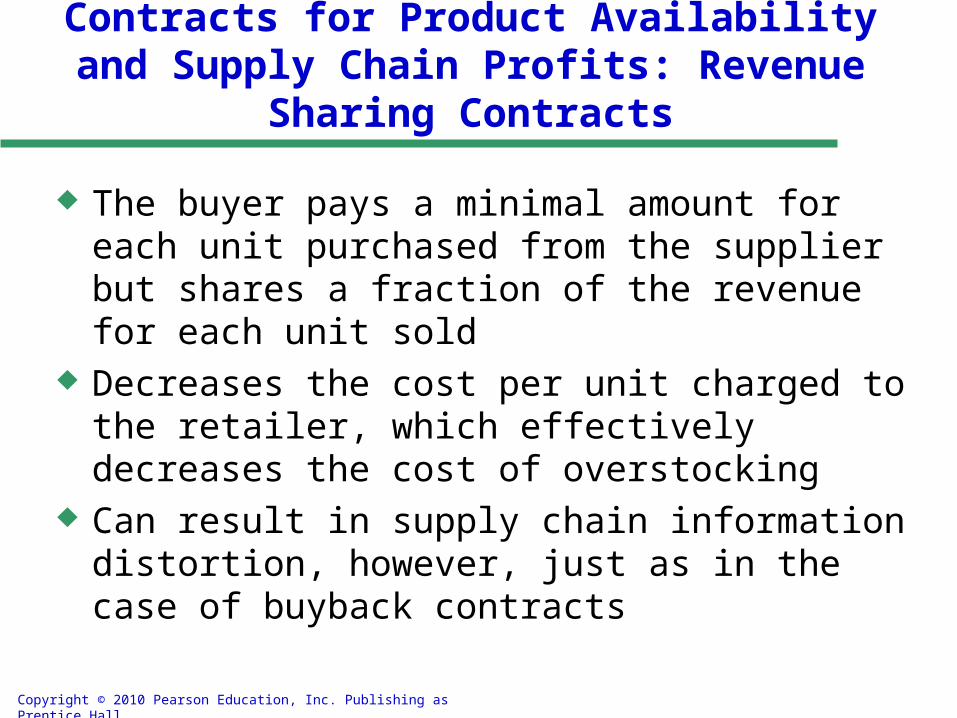
Contracts for Product Availability and Supply Chain Profits: Revenue Sharing Contracts
The buyer pays a minimal amount for each unit purchased from the supplier but shares a fraction of the revenue for each unit sold
Decreases the cost per unit charged to the retailer, which effectively decreases the cost of overstocking
Can result in supply chain information distortion, however, just as in the case of buyback contracts
Copyright © 2010 Pearson Education, Inc. Publishing as Prentice Hall.
Manufacturer Manufacturer DC Retail DC
Stores
Fixed Production Cost =$100,000
Variable Production Cost=$35
Selling Price=$125
Salvage Value=$20
Wholesale Price =$??
Supply Contracts

Copyright © 2010 Pearson Education, Inc. Publishing as Prentice Hall.
Revenue Sharing Contract
Manufacturer and retailer have a revenue sharing contract
Manufacturer agrees to decrease the whole sale price from $80 to $60
In return retailer provides 15% of the product revenue to the manufacturer

Copyright © 2010 Pearson Education, Inc. Publishing as Prentice Hall.
Retailer orders for 12000 swimsuits with revenue sharing arrangement
Demand ProbSales Price
Rev Share
Wholesale Price
Variable cost
Fixed cost
Profit Average Profit
125 15% 60 35 100000 Retailer ManuF Retailer Manuf
8000 0.11 1000000 150000 720000 420000 100000 130000 350000 14300 38500
10000 0.11 1250000 187500 720000 420000 100000 342500 387500 37675 42625
12000 0.275 1500000 225000 720000 420000 100000 555000 425000 152625 116875
14000 0.225 1500000 225000 720000 420000 100000 555000 425000 124875 95625
16000 0.185 1500000 225000 720000 420000 100000 555000 425000 102675 78625
18000 0.095 1500000 225000 720000 420000 100000 555000 425000 52725 40375
SUM 484875 412625
Total SC Profit 897500

Copyright © 2010 Pearson Education, Inc. Publishing as Prentice Hall.
Retailer orders for 14000 swimsuits with revenue sharing arrangement
Demand Prob Sales Price Rev ShareWholesale
PriceVariable
costFixed cost
Profit Average Profit
125 15% 60 35 100000 Retailer Manuf Retailer Manuf
8000 0.11 1000000 150000 840000 490000 100000 10000 400000 1100 44000
10000 0.11 1250000 187500 840000 490000 100000 222500 437500 24475 48125
12000 0.275 1500000 225000 840000 490000 100000 435000 475000 119625 130625
14000 0.225 1750000 262500 840000 490000 100000 647500 512500 145688 115313
16000 0.185 1750000 262500 840000 490000 100000 647500 512500 119788 94813
18000 0.095 1750000 262500 840000 490000 100000 647500 512500 61513 48688
Best case. Profits for both increase. Retailer should negotiate for reduction in the wholesale price to $60 by committing to lift 14000 units.
SUM 472188 481563
Total SC Profit 953750

Copyright © 2010 Pearson Education, Inc. Publishing as Prentice Hall.
Retailer orders for 16000 swimsuits with revenue sharing arrangement
Demand Prob Sales Price Rev ShareWholesale
PriceVariable
costFixed cost
Profit Average Profit
125 15% 60 35 100000 Retailer Manuf Retailer Manuf
8000 0.11 1000000 150000 960000 560000 100000 -110000 450000 -12100 49500
10000 0.11 1250000 187500 960000 560000 100000 102500 487500 11275 53625
12000 0.275 1500000 225000 960000 560000 100000 315000 525000 86625 144375
14000 0.225 1750000 262500 960000 560000 100000 527500 562500 118688 126563
16000 0.185 2000000 300000 960000 560000 100000 740000 600000 136900 111000
18000 0.095 2000000 300000 960000 560000 100000 740000 600000 70300 57000
SUM 411688 542063
Total SC Profit 953750

Copyright © 2010 Pearson Education, Inc. Publishing as Prentice Hall.
Supply Contracts
Strategy Retailer Manufacturer TotalSequential Optimization 470,700 440,000 910,700 Buyback 503,700 450,050 953,750 Revenue Sharing 472,188 481,573 953,761
QuantitySequential Optimization 12000Buyback 16000Revenue Sharing 14000

Copyright © 2010 Pearson Education, Inc. Publishing as Prentice Hall.
Manufacturer Manufacturer DC Retail DC
Stores
Fixed Production Cost =$100,000
Variable Production Cost=$35
Selling Price=$125
Salvage Value=$20
Wholesale Price =$80
Supply Contracts

Copyright © 2010 Pearson Education, Inc. Publishing as Prentice Hall.
Supply Chain Profit
0
200,000
400,000
600,000
800,000
1,000,000
1,200,000
Production Quantity
Su
pp
ly C
ha
in P
rofi
t
Copyright © 2010 Pearson Education, Inc. Publishing as Prentice Hall.
Supply Chain Profit
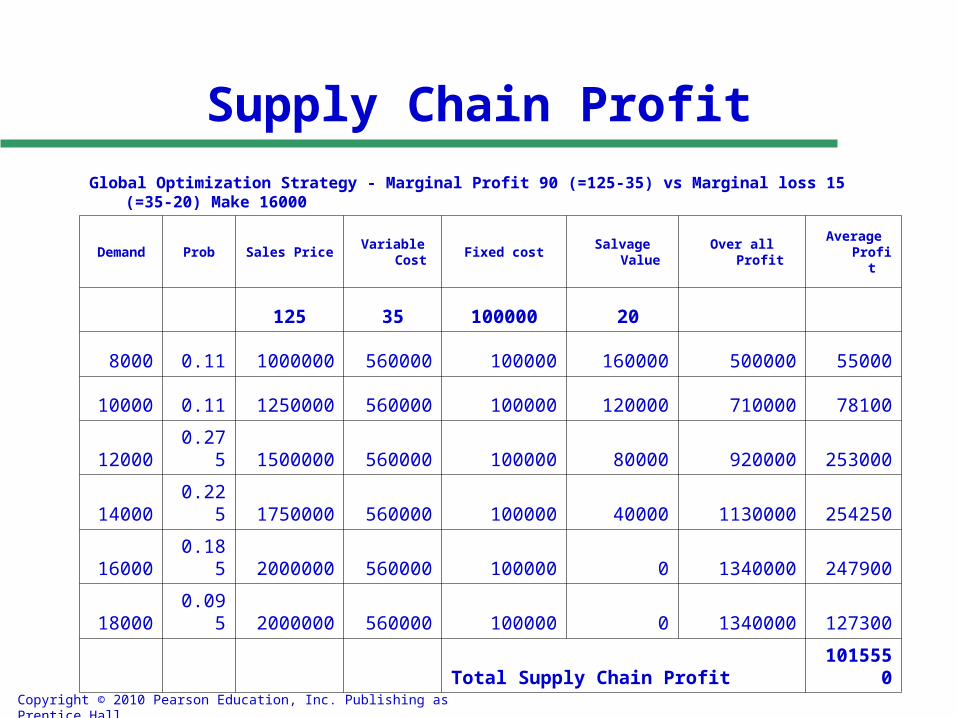
Global Optimization Strategy - Marginal Profit 90 (=125-35) vs Marginal loss 15 (=35-20) Make 16000
Demand Prob Sales PriceVariable
CostFixed cost Salvage Value Over all Profit
Average Profit
125 35 100000 20
8000 0.11 1000000 560000 100000 160000 500000 55000
10000 0.11 1250000 560000 100000 120000 710000 78100
12000 0.275 1500000 560000 100000 80000 920000 253000
14000 0.225 1750000 560000 100000 40000 1130000 254250
16000 0.185 2000000 560000 100000 0 1340000 247900
18000 0.095 2000000 560000 100000 0 1340000 127300
Total Supply Chain Profit 1015550

Copyright © 2010 Pearson Education, Inc. Publishing as Prentice Hall.
32
Supply Contracts
Strategy Retailer Manufacturer TotalSequential Optimization 470,700 440,000 910,700 Buyback 503,700 450,050 953,750 Revenue Sharing 472,188 481,573 953,761 Global Optimization 1,015,550
QuantitySequential Optimization 12000Buyback 16000Revenue Sharing 14000Global Optimization 16000

Copyright © 2010 Pearson Education, Inc. Publishing as Prentice Hall.
Supply Contracts: Key Insights
Effective supply contracts allow supply chain partners to replace – sequential optimization by
– global optimization
Buy Back and Revenue Sharing contracts achieve this objective through – risk sharing

Copyright © 2010 Pearson Education, Inc. Publishing as Prentice Hall.
Other Contracts
Quantity Flexibility Contracts– Supplier provides full refund for returned items as long as
the number of returns is no larger than a certain quantity
Sales Rebate Contracts– Supplier provides direct incentive for the retailer to increase
sales by means of a rebate paid by the supplier for any item sold above a certain quantity

Copyright © 2010 Pearson Education, Inc. Publishing as Prentice Hall. 14-35
Contracts to CoordinateSupply Chain Costs
Differences in costs at the buyer and supplier can lead to decisions that increase total supply chain costs
Example: Replenishment order size placed by the buyer. The buyer’s EOQ does not take into account the supplier’s costs.
A quantity discount contract may encourage the buyer to purchase a larger quantity (which would be lower costs for the supplier), which would result in lower total supply chain costs
Quantity discounts lead to information distortion because of order batching

Copyright © 2010 Pearson Education, Inc. Publishing as Prentice Hall. 14-36
Design Collaboration
50-70 percent of spending at a manufacturer is through procurement
80 percent of the cost of a purchased part is fixed in the design phase
Design collaboration with suppliers can result in reduced cost, improved quality, and decreased time to market
Important to employ design for logistics, design for manufacturability
Manufacturers must become effective design coordinators throughout the supply chain

Copyright © 2010 Pearson Education, Inc. Publishing as Prentice Hall. 14-37
The Procurement Process
The process in which the supplier sends product in response to orders placed by the buyer
Goal is to enable orders to be placed and delivered on schedule at the lowest possible overall cost
Two main categories of purchased goods:– Direct materials: components used to make finished goods– Indirect materials: goods used to support the operations of a firm– Differences between direct and indirect materials listed in Table
Focus for direct materials should be on improving coordination and visibility with supplier
Focus for indirect materials should be on decreasing the transaction cost for each order
Procurement for both should consolidate orders where possible to take advantage of economies of scale and quantity discounts

Copyright © 2010 Pearson Education, Inc. Publishing as Prentice Hall. 14-38
Product Categorization by Value and Criticality
Critical Items Strategic Items
General Items Bulk Purchase Items
Low
Low
High
HighValue/Cost
Cri
tica
lity

Copyright © 2010 Pearson Education, Inc. Publishing as Prentice Hall. 14-39
Sourcing Planning and Analysis
A firm should periodically analyze its procurement spending and supplier performance and use this analysis as an input for future sourcing decisions
Procurement spending should be analyzed by part and supplier to ensure appropriate economies of scale
Supplier performance analysis should be used to build a portfolio of suppliers with complementary strengths– Cheaper but lower performing suppliers should be used to
supply base demand– Higher performing but more expensive suppliers should be
used to buffer against variation in demand and supply from the other source

Copyright © 2010 Pearson Education, Inc. Publishing as Prentice Hall.
The Role of IT in Sourcing
Design collaboration
Negotiate
Buy
Supply collaboration
14-40

Copyright © 2010 Pearson Education, Inc. Publishing as Prentice Hall.
Risk Management in Sourcing
Supply disruption
Increased procurement costs
Intellectual property
14-41

Copyright © 2010 Pearson Education, Inc. Publishing as Prentice Hall. 14-42
Making SourcingDecisions in Practice
Use multifunction teams Ensure appropriate coordination across regions
and business units Always evaluate the total cost of ownership Build long-term relationships with key suppliers
Copyright © 2010 Pearson Education, Inc. Publishing as Prentice Hall. 14-43
Summary of Learning Objectives
What is the role of sourcing in a supply chain? What factors affect the decision to outsource a supply chain
function? What dimensions of supplier performance affect total cost? How do you structure successful auctions and negotiations? What is the impact of risk sharing on supplier performance
and information distortion? What are different categories of purchased products and
services? What is the desired focus for procurement for each of these categories?


