Embed Size (px)
Citation preview

Corporate presentationCIBC Whistler Institutional Investor ConferenceJanuary 21, 2010

Certain information in this presentation and statements made during this presentation, including any question
and answer session, may contain forward-looking statements, including but not limited to, those regarding
projected economic indicators, future expansion plans for WestJet and WestJet Vacations Inc. (WVI),
capacity growth, fleet expansion, potential interline and code-share agreements, ASM, RASM, CASM and
future revenue and profits, implementation of the new reservation system, the planned reward program and
branded credit card, cost-saving initiatives, addition of new destinations, market-share and business travel
expansion, hedging activities and ancillary revenue expansion. Certain material factors and assumptions
were applied in formulating these forward-looking statements. These forward-looking statements are subject
to, and may be affected by, numerous risks and uncertainties which may cause WestJet’s actual results may
differ materially from a conclusion, forecast or projection expressed in or implied by such statements. Factors
that could cause or contribute to these differences include, but are not limited to: changes in government
policy, exchange rates, interest rates, disruption of supplies, volatility of fuel prices, terrorism, general
economic conditions, the competitive environment and other factors described in WestJet’s public reports
and filings which are available under WestJet’s profile on SEDAR (www.sedar.com). Forward-looking
statements are subject to change and WestJet does not undertake to update or revise any forward-looking
information as a result of any new information, future events or otherwise, except as required by applicable
law.
Forward-looking statement
January 2009

Who we are • Canada’s low-cost, high-value airline
• 86 Next-Generation 737 aircraft
• Serving 67 destinations in 12 countries
• One of the most profitable airlines in North America
• One of Canada’s most admired corporate cultures
• Provide a world-class guest experience
• Schedule flexibility and seasonal deployment

External environment

The Canadian economy
3.41.54.2Real Disposable Income
(% Change YoY)
3.0
6.1
2008
8.58.3Unemployment Rate (%)
2.70.1Consumer Spending
(% Change YoY)
2009 (f) 2010 (f)
Economic indicators
Source: BMO Capital Markets – November 2009
WJA
OIL
TSX
Stock market
60%
65%
70%
75%
80%
85%
90%
95%
100%
105%
110%
Nov-07
Dec-0
7Ja
n-08
Feb-
08Mar
-08
Apr-08
May-08
Jun-
08Ju
l-08
Aug-08
Sep-0
8Oct
-08Nov
-08Dec
-08
Jan-
09Fe
b-09
Mar-0
9Apr
-09May
-09Ju
n-09
Jul-0
9Aug
-09Sep
-09
Oct-09
Nov-09
Con
sum
er C
onfid
ence
Inde
x (2
002
= 10
0%)
Source: Conference Board of Canada
Source: Thomson Financial
Canadian consumer confidenceCanada GDP growth rate
Reducing risk
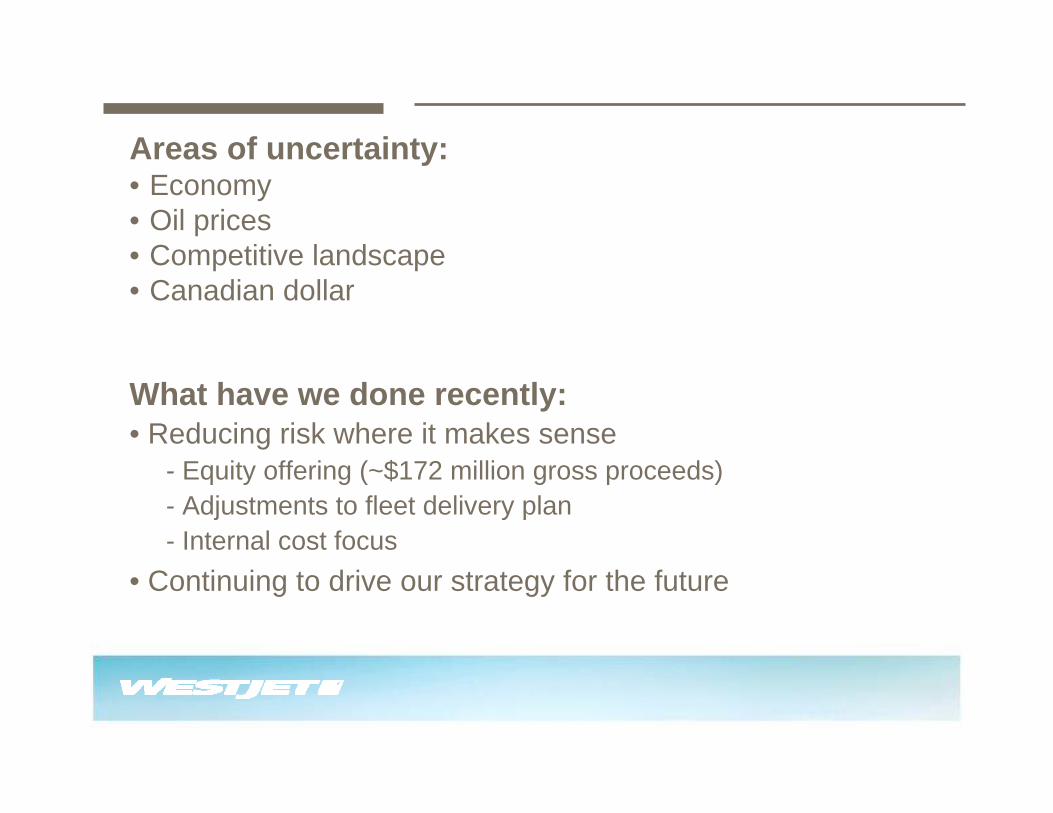
Areas of uncertainty:• Economy• Oil prices• Competitive landscape• Canadian dollar
What have we done recently:• Reducing risk where it makes sense
- Equity offering (~$172 million gross proceeds)- Adjustments to fleet delivery plan- Internal cost focus
• Continuing to drive our strategy for the future

Financial highlights
19%(35.4%)$254Cash flow from operations ($ millions)
n/a
24%
n/a
24%
Five-year
CAGR*
(1.9 pts.)10.2%Operating margin
Nine months ended
Sept 30,2009
Year-over-year
Change
Revenue ($ millions) $1,711 (11.5%)
Earnings before tax margin 6.6% (3.5 pts.)
Net earnings($ millions)
$78 (42.8%)
2008 numbers reclassified for current year presentation and policies. *Five-year CAGR as at 12 months ended December 31, 2008.
$0.10
$0.11
$0.12
$0.13
$0.14
$0.15
$0.16
1st Qtr 2nd Qtr 3rd Qtr 4th Qtr
Year-over-year RASM
2008 RASM 2009 RASM
(9.8%) (15.4%)
(15.5%)Q4 2009
based on guidance estimates

Financial security • At September 30, 2009: Cash of C$962 millionCurrent ratio of 1.44x Adjusted debt to equity ratio of 1.44xAdjusted net debt to EBITDAR of 2.17x
0
200
400
600
800
1000
2005 2006 2007 2008 Q3 09
$ m
illio
ns
Cash
0
1
2
3
4
5
6
2005 2006 2007 2008 Q3 2009
times
Adj. Debt/Equity Adj. net Debt/EBITDAR
Note: All figures are full-year figures, except 2009 is as of Sept 30.2008 numbers reclassified for current year presentation and policies. Debt ratios include aircraft operating leases

Measured capacity growth and fleet expansion
11110598918676706356Total confirmed fleet
676155535352494538Owned
24 33 38 44444318 2118Leased
0
5,000
10,000
15,000
20,000
25,000
30,000
2005 2006 2007 2008 2009 2010 2011 2012 2013
ASMs
(000
,000)
19%17%
16%
18%3%
Projected growth (approximately 10% per annum)
8-10%
3--------Lease expiries
677510----Net change in aircraft
6147810--Net change in aircraft prior to revised schedule

Controlling costs• Highly engaged workforce• Focus on CASM reduction• Hedge a portion of fuel to reduce volatility• Aircraft debt repayments fixed in CAD$ for term of debt
• Next 12 month aircraft US$ leasing costs 60% hedged into CAD$ at September 30, 2009
• High aircraft utilization rates

Low-cost philosophy generates history of positive margins
• Consistently produce positive margins
• Ancillary revenue and WestJet Vacations adding to RASM
• Fuel accounts for about 1/3 of costs and is most variable factor
• All other costs being held relatively flat
8.3 8.7 8.7 8.9 8.5 8.5
2.73.3 3.4 3.5 4.7
3.20.7
0.9 1.9 2.2 1.7
1.3
0
2
4
6
8
10
12
14
16
2004
2005
2006
2007
2008
9M 2
009
(cen
ts p
er A
SM)
CASM (ex fuel) Fuel Op. Margin
*2009 results as at Sept. 30, 2009. Excludes reservation system impairment of $31.9 million in 2007 and $47.6 million impairment related to retirement of 200-series aircraft in 20042008 numbers reclassified for current year presentation and policies.
6% 7% 13% 16% 11% 10%
Operating margins

Among top financial performers in North American airline industry
-250
-150
-50
50
150
250
Alle
gian
t
Wes
tJet
Ala
ska
Air
Tran
JetB
lue
Sout
hwes
t
Con
tinen
tal
Del
ta
US
Airw
ays
Air
Can
ada
Am
eric
an
Uni
ted
$Mill
ions
-35.00%
-25.00%
-15.00%
-5.00%
5.00%
15.00%
25.00%
35.00%
EBT Margin %
Earnings before tax (EBT) for YTD Q3 2009
EBT and EBT margin adjusted for special items and gains/losses on mark-to-market fuel hedges (non-operating portion). WestJet and Air Canada earnings in CAD$, all others in US$.

The flight plan

Our vision

Our business: A great guest experience and a low-cost base
Our strategy is based on four pillars:
People and culture• Fundamental drivers of our success
Guest experience and performance• Uncompromised guest experience and performance builds loyalty
Revenue and growth• Delivering results
Cost and margins• Continuing our low-cost commitment

Strengthening the foundation for the future
• Build world-class guest experience • Enhance reservation systems• Enter airline partnerships• Expand non-domestic flying• Continue people development
• Implement rewards program • Focus on business traveller• Grow WestJet Vacations• Improve cost advantage • Cultivate culture

111108 99
133
83
153
8457
159 151
68
132
78
119
3652
86111118 111119
97
151
88
214
92 88
170
50
197
61
215
Nor
m 8
0-12
7
West
Nor
m 8
0-12
7
Nor
m 8
0-12
7
Montreal
Nor
m 8
0-12
7
Atlantic Canada
Ontario
2005 2006 2007 2008
Air Canada Air Canada
Air CanadaAir Canada
Strengthening and expanding our trusted brand

Domestic
Market share growth:Domestic
36%
56%
8% 40% - 50%
WestJet Air Canada / Jazz Other
12 months ending December 31, 2009 2013 target
86Total fleet
• Capacity-share calculation based on data from IATA-SRS.
• Increased frequencies andnon-stops
• Commercial partnerships• WestJet Vacations • New destinations

Market share growth:Transborder and international
12 months ending December 31, 2009 2013 target
15%39%
46%
13%
34%53%
Transborder
Mexico / Caribbean
20+%
20+%
86Total fleet
WestJet Air Canada / Jazz Other
• Capacity-share calculation based on data from IATA-SRS. Mexico / Caribbean capacity share does not include charters.
• Seasonal-deploymentstrategy
• New destinations andincreased frequencies
• WestJet Vacations• Point of sale U.S.• Commercial partnerships

Summary • We continue to outperform the industry in North America
• We are a well-positioned, low-cost and efficient carrier
• We have a strong brand in the market place• Highly attractive combination of planned growth and strong balance sheet
• Attractive valuation relative to peer group
For further information:
Rob McInnisDirector, Investor RelationsP: (403) 539-7412E: [email protected]: www.westjet.com