Embed Size (px)
Citation preview

ORIGINAL RESEARCH ARTICLEpublished: 13 October 2014
doi: 10.3389/feart.2014.00025
Circulation weather types and spatial variability of dailyprecipitation in the Iberian PeninsulaAlexandre M. Ramos1*, Nicola Cortesi2 and Ricardo M. Trigo1
1 Instituto Dom Luiz, Faculdade de Ciências, Universidade de Lisboa, Lisboa, Portugal2 Centre Européen de Recherche et de Formación Avancée en Calcul Scientifique, Meteo France, Toulouse, France
Edited by:
Raquel Nieto, University of Vigo,Spain
Reviewed by:
Ashok Kumar Jaswal, IndiaMeteorological Department, IndiaThando Ndarana, South AfricanWeather Service, South AfricaMichelle Simoes Reboita, FederalUniversity of Itajubá, Brazil
*Correspondence:
Alexandre M. Ramos, Faculdade deCiências, Instituto Dom Luiz,Universidade de Lisboa, CampoGrande, Edf. C8, Piso 3, Sala 8.3.1,1749-016 Lisboa, Portugale-mail: [email protected]
The relationships between atmospheric circulation patterns and daily Iberian rainfall arehere explored at high spatial resolution (0.2◦) using the Jenkinson and Collison automatedclassification scheme with 26 Weather Types (WTs). The WTs were computed by meansof the daily EMULATE Mean Sea Level Pressure dataset (EMSLP) while the high resolutionprecipitation database corresponds to the recent Iberia02 daily gridded precipitationdataset over the 1950–2003 period. Six monthly indexes relating the WTs and precipitationwere analyzed: their Frequency, the Mean Precipitation, the Percentage Contribution, theArea of Influence, the Precipitation Intensity, and Efficiency. Except for the Frequencyof the WTs, all other indexes were evaluated studying their spatial distribution over theIberian Peninsula, focusing on a WT and a month at time. A small number of WTs(7) was found to capture a high percentage (∼70%) of monthly Iberian precipitation.The Westerly WT is the most influent one, followed by the Cyclonic, the Northwesterlyand the Southwesterly WTs. Westerly flows, however, do not affect the Mediterraneanfringe or the Cantabrian coast, which are dominated by the Easterly and Northerly WTs,respectively. Rainfall along the Mediterranean coastline and the Ebro basin depends on avariety of WTs, but their effects are confined to narrow areas and short temporal intervals,suggesting that local factors such as convective processes, orography and the proximityto a warm water body could play a major role in precipitation processes. We show thatthe use of daily gridded precipitation dataset holds the advantage of measuring the dailyrainfall amount due to each WT directly instead to relying on the predicted values of theregression model as done in previous works.
Keywords: circulation weather types, daily gridded precipitation, Iberian Peninsula, spatial variability, seasonal
variability
INTRODUCTIONRainfall variability is a well know characteristic of Mediterraneanclimate, and it has been particularly well studied aroundMediterranean Basin particularly at the monthly and seasonalscales (Corte-Real et al., 1995; Kutiel et al., 1996; Xoplaki et al.,2004; Paredes et al., 2006). A comprehensive analysis for the entireMediterranean is presented in Dünkeloh and Jacobeit (2003),which the authors show that their main modes of variabilitycapture 75% of precipitation variability, with up to five signifi-cant atmospheric patterns responsible for Mediterranean seasonalprecipitation.
In the context of Mediterranean basin, the Iberian Peninsula(IP) has been recognized as one of the most challenging placesfor analyzing spatial and temporal climate variability due to anumber of reasons (Lionello et al., 2012), namely: (1) the sin-gular location of the IP in the transition between tropical tomild climate in western area of Mediterranean basin; (2) itsconfinement between two contrasted water masses (the AtlanticOcean and the Mediterranean sea); (3) its compact configurationwith the vast majority of the Peninsular area (circa 500,000 km2)being enclosed by mountain chains. Additionally, the east-westalignment of the major mountain chains contributes to shape the
high spatial variability of the region (Martin-Vide, 2004; Morataet al., 2006; Valero et al., 2009; Casado et al., 2010). In particularthe IP orography has a strong influence on how low pressure sys-tems affect the climate at a more local scale, as mountain rangescan shield eastern regions from the predominant Atlantic mois-ture advection (Gimeno et al., 2010). Some of these constrainingfactors can produce a relative disconnection from general cir-culation in some areas of IP, particularly in what concerns theMediterranean fringe and Ebro basin to the east, where localfactors can give marked regional variations as well as a highregional variability of precipitation (Muñoz-Diaz and Rodrigo,2004; Martin-Vide and Lopez-Bustins, 2006).
As an example of rainfall variability in the IP, Table 1 showsa brief list of previous studies focusing on the regionalization ofprecipitation. Differences in the number of regions retained canresult from different choices in what concerns: length of periodsconsidered, different spatial station density, but also distinct sta-tistical methods used. Nevertheless, it is possible to state that threemain areas are often defined: northern and eastern fringes, (i.e.,Cantabrian and Mediterranean coastland), and central-south,being the mountain chains the frontiers (see Figure 1A), althoughthey do not exactly match between authors.
www.frontiersin.org October 2014 | Volume 2 | Article 25 | 1
EARTH SCIENCE

Ramos et al. WTs spatial variability precipitation IP
Table 1 | Examples of regionalization of precipitation in the IP.
Authors Time resolution Number of series Grid resolution Period Number of years Number of regions
Fernandez-Mills, 1995 Daily 68 – 1961–1990 30 10
Rodriguez-Puebla et al., 1998 Annual 51 – 1949–1995 47 4
Esteban-Parra et al., 1998 Seasonal 40 – 1880–1992 112 3
Martin-Vide and Gomez, 1999 Daily 35 – 1951–1990 40 3
Serrano et al., 1999 Monthly 40 – 1919–1992 74 7
Garcia et al., 2002 Monthly 40 – 1919–1992 74 6
Muñoz-Diaz and Rodrigo, 2004 Seasonal 32 – 1912–2000 89 3–4*
Morata et al., 2006 Daily 960 25 km2 1961–2003 43 7-5-3**
Queralt et al., 2009 Daily 102 – 1997–2006 10 8
Casado et al., 2010 Daily n.a. 50 km2 1961–1990 30 3
Cortesi et al., 2013a,b Monthly 3030 10 km2 1948–2003 56 1
*Depending on season.**Different lags.
The aforementioned variability introduces difficulties whenmodeling IP precipitation regimes particularly within the scopeof generation of climate change scenarios. Thus, downscaling ofprecipitation over a limited region is often attempted throughthe identification of the dynamical-statistical links between localprecipitation features and large scale atmospheric circulation pat-terns (e.g., Quadrelli et al., 2001; Trigo and Palutikof, 2001;Ramos et al., 2010).
There are several previous examples of atmospheric circulationapproach and precipitation analyses around the Mediterraneanbasin. Kostopoulou and Jones (2007a,b) developed a classificationof circulation types for the Eastern Mediterranean and establishedlinks with temperature and precipitation. In Greece, Michailidouet al. (2009) presented a method for grouping weather types(WTs) restricted to the cold and wet sub-period of the year. InIsrael, Saaroni et al. (2010) analyzed the relationship between thelow of Cyprus and precipitation during wet period (NovemberMarch). In Italy, Tartaglione et al. (2009) analyzed intense precip-itation events covering the period from 1951 to 2000, comparingthe resemblance between two states of the atmosphere leadingto the same outcome. In the boundary region of the Swiss Alps,Hanggi et al. (2011) analyzed how changes in WTs were related toprecipitation trends.
Likewise, there have also been developed downscalingapproaches linking the large scale atmospheric circulation and theprecipitation over the IP. The first objective classifications of theatmospheric circulation were developed in the 1990s (e.g., Zoritaet al., 1992; Zhang et al., 1997; Romero et al., 1999; Santos et al.,2005). At the same time a number of researchers was also inter-ested in adopting a different approach, using slightly differentversions of the automated version of the Lamb WTs (e.g., Goodessand Palutikof, 1998; Spellman, 2000; Trigo and DaCamara, 2000;Goodess and Jones, 2002).
Queralt et al. (2009) presents an analysis of winter intensityand frequency of precipitation based on 102 daily precipitationstations over Spain which have been merged in eight differentregions. It was shown the complex regional relationship betweenthe most important large-scale atmospheric pattern, the NorthAtlantic Oscillation (NAO) and precipitation which was alsorevealed through the modulation of the NAO in the preferred
WTs associated to precipitation in each region. Casado et al.(2010) using a grid of 203 points, described the variability ofwinter precipitation over different climatic regions of Spain forthe period 1961–1990 using different WTs classification. In theEbro basin (northeast inland of IP), Vicente-Serrano and Lopez-Moreno (2006) analyzed WTs and drought in winter period dur-ing 1952–1999; they found a high spatial variability, and identifieddifferent sectors and WTs related to intensification of droughts.All of the above mentioned works deal with datasets character-ized in general by a low station density for the vast area (circa500,000 km2) of IP, but also the use of different periods, andthe tendency to restrict the analysis to wet winter season. In thisregard, the accuracy of spatial detail is quite low and informationfor not-winter months is scarce. As a consequence, the spatial andtemporal variability of precipitation in the IP is not entirely cap-tured and transitional areas, relief barrier effects, altitudinal effectand subregional details, between other research targets, are notwell known. Last but not least, an extended area of IP registersits maximum precipitation in transitional seasons, i.e., in springor autumn (de Luis et al., 2010) being information about suchperiods virtually absent in many cases.
This limitation prompted the authors to use a much denserdataset with ∼3000 stations for all Iberia (Cortesi et al., 2013a,b)to model the monthly relationship between WTs and precipita-tion following the approach of Trigo and DaCamara (2000). Inthat work a large number of regression models were developed atthe monthly scale (one per station, about 3000 stations). Such avast amount of long-term (1948–2003) time series was obtainedafter merging the dense network of monthly precipitation seriesfrom MOPREDAS database (MOnthly PREcipitation DAtabaseof Spain) for Spanish land (Gonzalez-Hidalgo et al., 2011) anda Portuguese database from INAG—Instituto da Água (ServicioNacional de Informaçao de Recurcos Hídricos) (Lorenzo-Lacruzet al., 2011). According to this high density analysis it was foundthat precipitation depends on higher number of WTs to the westthan to the East and in general better prediction is expected tothe west.
However, despite the massive number of stations employedin Cortesi et al. (2013a,b) it became apparent that model-ing monthly precipitation based on monthly frequency of WTs
Frontiers in Earth Science | Atmospheric Science October 2014 | Volume 2 | Article 25 | 2

Ramos et al. WTs spatial variability precipitation IP
FIGURE 1 | (A) Main Mountain Ranges and Depressions of the Iberian Peninsula and (B) 16 SLP grid points used in the WTs computation.
www.frontiersin.org October 2014 | Volume 2 | Article 25 | 3
Ramos et al. WTs spatial variability precipitation IP
implied major disadvantages. The main caveat is related withthe unavoidable large estimation errors due to the limited num-ber of predictors, but also as a consequence of multicollinearityand heteroscedasticity that hamper the overall quality of attainedmodels (Wilks, 2006). Another serious limitation found was apositive (negative) bias for the wet (dry) WTs, overestimatingthe contribution for the WTs selected as predictors and under-estimating it for the WTs not selected by the regression model.Therefore, the use of a daily dataset, even with a smaller totalnumber of stations, could represent an advantage to the analysis.This goal has become feasible only recently due to the merging ofSpanish (Herrera et al., 2012) and Portuguese (Belo-Pereira et al.,2011), into the high density daily gridded precipitation data set“Iberia02.”
To a certain extent, this work provides the extension of the pre-vious studies by the authors Cortesi et al. (2013a,b), with severalmajor changes; on the one hand, unlike the monthly regres-sion model widely used in Cortesi et al. (2013a), the analysis inthis work was performed using the daily gridded “Iberia02” pre-cipitation dataset. The use of a daily dataset holds the obviousadvantage of measuring the daily rainfall amount due to each WTdirectly instead to relying on the predicted values of the regres-sion model as done by the authors in their previous works. Onthe other hand, the use of daily data allows the study of severalprecipitation intensity related indices that are highly informativeand impossible to measure directly with monthly data, includingthe mean precipitation of each WT and its relative PrecipitationContribution, Precipitation Intensity, and Efficiency. Thus, thebroad objective of this work is to analyze at the higher possiblespatial and temporal detail the role played by each individual WTat the daily scale and how they determine the Iberian precipi-tation regime. To the best of our knowledge no previous workhas defined these daily WTs characteristics with so many stationscovering the entire IP.
DATABASE AND METHODSPRECIPITATION DATABASEAs previously mentioned, the current work relies on the use ofthe new daily gridded precipitation database “Iberia02,” whichspans the period 1950–2003 with a resolution of 0.2◦ (∼16 ×22 km at latitude 40◦), for a total of 1673 pixels. It is based ona dense network of rain gauges, combining two national datasets, “Spain02” for peninsular Spain and Balearic islands (Herreraet al., 2012), and “PT02” for mainland Portugal (Belo-Pereiraet al., 2011), with a total of more than 2000 station over Spainand four hundred stations over Portugal, all quality-controlledand homogenized. Although the actual number of stations in anygiven year varies substantially due to variable availability of sta-tions. Specifically, Spain02 is based on 2756 stations with at least20 years of data and was interpolated by an indicator Kriging(to select pixel with rainfall) followed by an ordinary Kriging.The Portuguese dataset is based on a total of 806 station, mostof which (726) have at least 10 years of data. Although severalinterpolation methods were tested to build the Portuguese grid-ded dataset (Belo-Pereira et al., 2011), the final choice was thesame ordinary Kriging employed for the Spanish data (Herreraet al., 2012).
Although Iberia02 results from a combination of two differ-ent data sets, albeit with a common grid, there is no evidence ofartificial features at the border between Spain and Portugal, nei-ther at the monthly scale nor at daily scale (Belo-Pereira et al.,2011). The most important difference between Spain02 and PT02is in the start of the daily accumulation period: daily precipitationrecords obtained in Portugal for any given day n correspond to theprecipitation registered between 0900 UTC of day n − 1 and 0900UTC of day n. On the other hand, Spanish rainfall records forthe same day n correspond to the precipitation registered between0700 UTC of day n and 0700 UTC of day n + 1 (notice the differ-ence in both the hours and the days). Thus, in order to derivethe most consistent common data set, the Portuguese daily pre-cipitation database was shifted by 1 day, reducing the temporaldifference between the two database from 22 h to only 2 h. TheSpain02 has been recently used by the authors to rank precipita-tion events in the IP and several major river basins (Ramos et al.,2014).
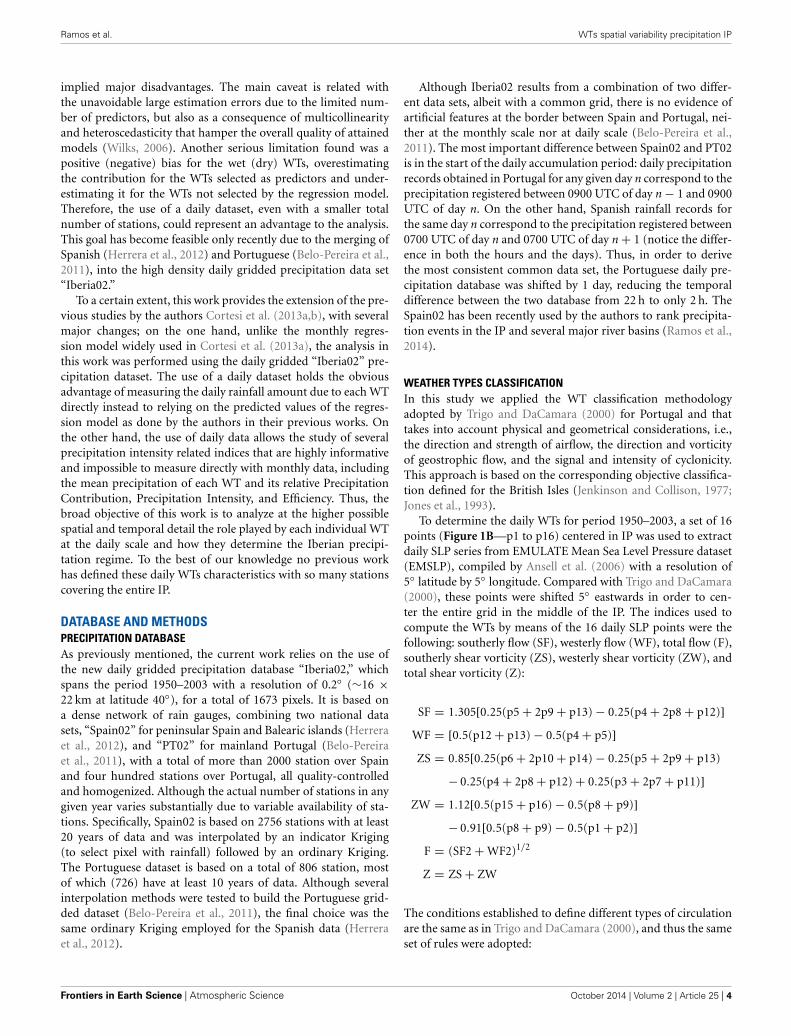
WEATHER TYPES CLASSIFICATIONIn this study we applied the WT classification methodologyadopted by Trigo and DaCamara (2000) for Portugal and thattakes into account physical and geometrical considerations, i.e.,the direction and strength of airflow, the direction and vorticityof geostrophic flow, and the signal and intensity of cyclonicity.This approach is based on the corresponding objective classifica-tion defined for the British Isles (Jenkinson and Collison, 1977;Jones et al., 1993).
To determine the daily WTs for period 1950–2003, a set of 16points (Figure 1B—p1 to p16) centered in IP was used to extractdaily SLP series from EMULATE Mean Sea Level Pressure dataset(EMSLP), compiled by Ansell et al. (2006) with a resolution of5◦ latitude by 5◦ longitude. Compared with Trigo and DaCamara(2000), these points were shifted 5◦ eastwards in order to cen-ter the entire grid in the middle of the IP. The indices used tocompute the WTs by means of the 16 daily SLP points were thefollowing: southerly flow (SF), westerly flow (WF), total flow (F),southerly shear vorticity (ZS), westerly shear vorticity (ZW), andtotal shear vorticity (Z):
SF = 1.305[0.25(p5 + 2p9 + p13) − 0.25(p4 + 2p8 + p12)]WF = [0.5(p12 + p13) − 0.5(p4 + p5)]ZS = 0.85[0.25(p6 + 2p10 + p14) − 0.25(p5 + 2p9 + p13)
− 0.25(p4 + 2p8 + p12) + 0.25(p3 + 2p7 + p11)]ZW = 1.12[0.5(p15 + p16) − 0.5(p8 + p9)]
− 0.91[0.5(p8 + p9) − 0.5(p1 + p2)]F = (SF2 + WF2)1/2
Z = ZS + ZW
The conditions established to define different types of circulationare the same as in Trigo and DaCamara (2000), and thus the sameset of rules were adopted:
Frontiers in Earth Science | Atmospheric Science October 2014 | Volume 2 | Article 25 | 4

Ramos et al. WTs spatial variability precipitation IP
(a) Direction of flow was given by tan−1(WF/SF), 180◦ beingadded if WF was positive. The appropriate direction wascomputed using an eight-point compass, allowing 45◦ persector.
(b) If |Z| < F, the flow is essentially straight and was considered tobe of a pure directional type (eight different cases, accordingto the directions of the compass).
(c) If |Z| > 2F, the pattern was considered to be of a pure cyclonictype if Z > 0, or of a pure anticyclonic type if Z < 0.
(d) If F < |Z| < 2F, the flow was considered to be of a hybridtype and was therefore characterized by both direction andcirculation (8 × 2 different types).
Taking into account this set of rules, a total of 26 WTs weredefined, 10 pure types (Figure 2: NE, E, SE, S, SW, W, NW, N, C,and A), and 16 hybrid types (8 for each C or A hybrid). The 8 puretypes associated to a specific wind direction are called Directionaltypes. We disseminated the fairly few cases (<1%) with possiblyunclassified situations among the 26 classes.
PRECIPITATION INDICESTo study the relationship between daily precipitation and WTs, sixmean monthly indices were analyzed: the WTs Frequency, MeanPrecipitation, Percentage Contribution, Intensity, Efficiency, andArea of Influence. All these indexes (except the WTs Frequency)are first calculated for each individual pixel of the precipitationgrid, and then are averaged over the 1673 Iberian pixel (includingBalearic Islands).
The shift from monthly to daily precipitation allows to com-pute new rainfall indexes such as the Mean Precipitation of eachWT, the Precipitation Intensity and Efficiency that were not stud-ied in the previous work (Cortesi et al., 2013b). In that work alarge number of regression models were developed at the monthlyscale for each station; however, such approach presents seriouslimitations, for example the systematical overestimation of pre-cipitation assigned to the WTs that were selected as predictors bythe stepwise regression model and vice versa, the wrong attribu-tion of no rainfall amount to the WTs that were not selected aspredictors. In order to avoid any misleading interpretation of theresults obtained we would like to provide a brief description of allthe precipitation indices used:
• The Mean Precipitation of each WT is the simple sum of therainfall amount during the days affected by that specific WTthroughout all the years of the study period (1950–2003) atmonthly level, divided by the total number of years (i.e., themonthly climatology of the WT in mm):
Pwt =∑2003
j = 1950
∑365i = 1 Pwt(i, j)
N
• The Percentage Contribution of each WT is equal to the MeanPrecipitation of that WT divided by the mean monthly totalprecipitation during the same period:
Cwt = Pwt
Ptot
• The Precipitation Intensity for a given WT is defined as thesum of the daily precipitation due to the WT during the period1950–2003 at monthly level, divided by the total number ofdays that belong to the same WT and period (including drydays):
Iwt =∑2003
j = 1950
∑365i = 1 Pwt(i, j)
∑2003y = 1950 nwt(y)
• WT monthly Precipitation Efficiency is a percentage defined asthe ratio between the number of wet days (≥1 mm.) affectedby the WT for all the same months during the whole period1950–2003 and the total number of days affected by the WTin all months of the same period. Thus, it measures the dailyrainfall probability (%) of the WT:
Ewt =∑2003
y = 1950 nwetwt (y)
∑2003y = 1950 nwt(y)
• The Area of Influence of each WT is the ratio between the num-ber of grid pixel with Mean Precipitation of 1 mm. or greaterand the total number of IP pixel. As such, it measures the % ofthe IP land surface where a WT has at least a small influence(1 mm) on precipitation:
Awt = Npixel(Pwt ≥ 1 mm)
Ntotpixel
The Mean Precipitation, Percentage Contribution, and thePrecipitation Intensity were first introduced by Trigo andDaCamara (2000) and where also measured by Fernández-González et al. (2012), who in the same paper presented thePrecipitation Efficiency index for the key series of Leon (NWSpain). In particular the Area of Influence index, to the best ofour knowledge, was never presented before in literature.
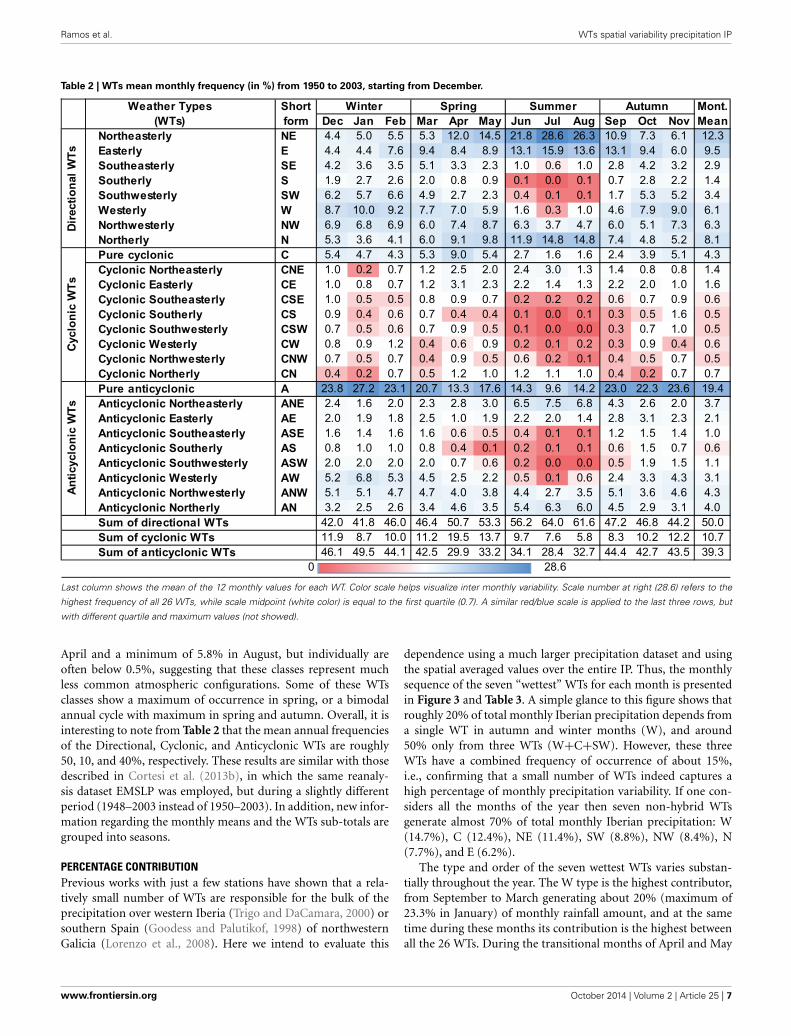
WT FREQUENCY AND OVERALL CONTRIBUTION TOPRECIPITATIONWT FREQUENCYA crucial characteristic to determine the role played by the WTson the monthly precipitation regime is provided by how oftenthey occur, i.e. by their frequency. The monthly frequency of WTs,expressed in % of days per month, is shown in Table 2. It is imme-diately noticeable that no WT occurs more than 30% of days fora given month.
The pure A type is the most frequent WT from Septemberto May (maximum of 27.2% in January); in June it is replacedby the NE as the most frequent WT during the three summermonths (maximum of 28.6% in July). If we are interested in thetop three WTs throughout the year than A, W, and SW are morefrequent during winter, while NE, N, and E during summer. Onthe other hand C, SE, and NW present higher frequencies duringspring and S during autumn. Hybrid Anticyclonic WTs globallydominate in winter, with a global overall maximum of 49.5% inJanuary and a minimum of 28.4% in July. Hybrid Cyclonic WTsare the less frequent, with a combined maximum of 19.5% in
www.frontiersin.org October 2014 | Volume 2 | Article 25 | 5

Ramos et al. WTs spatial variability precipitation IP
FIGURE 2 | Mean SLP field configuration of the 10 pure WTs for period 1950–2003. The contour interval is 2 hPa.
Frontiers in Earth Science | Atmospheric Science October 2014 | Volume 2 | Article 25 | 6
Ramos et al. WTs spatial variability precipitation IP
Table 2 | WTs mean monthly frequency (in %) from 1950 to 2003, starting from December.
Last column shows the mean of the 12 monthly values for each WT. Color scale helps visualize inter monthly variability. Scale number at right (28.6) refers to the
highest frequency of all 26 WTs, while scale midpoint (white color) is equal to the first quartile (0.7). A similar red/blue scale is applied to the last three rows, but
with different quartile and maximum values (not showed).
April and a minimum of 5.8% in August, but individually areoften below 0.5%, suggesting that these classes represent muchless common atmospheric configurations. Some of these WTsclasses show a maximum of occurrence in spring, or a bimodalannual cycle with maximum in spring and autumn. Overall, it isinteresting to note from Table 2 that the mean annual frequenciesof the Directional, Cyclonic, and Anticyclonic WTs are roughly50, 10, and 40%, respectively. These results are similar with thosedescribed in Cortesi et al. (2013b), in which the same reanaly-sis dataset EMSLP was employed, but during a slightly differentperiod (1948–2003 instead of 1950–2003). In addition, new infor-mation regarding the monthly means and the WTs sub-totals aregrouped into seasons.
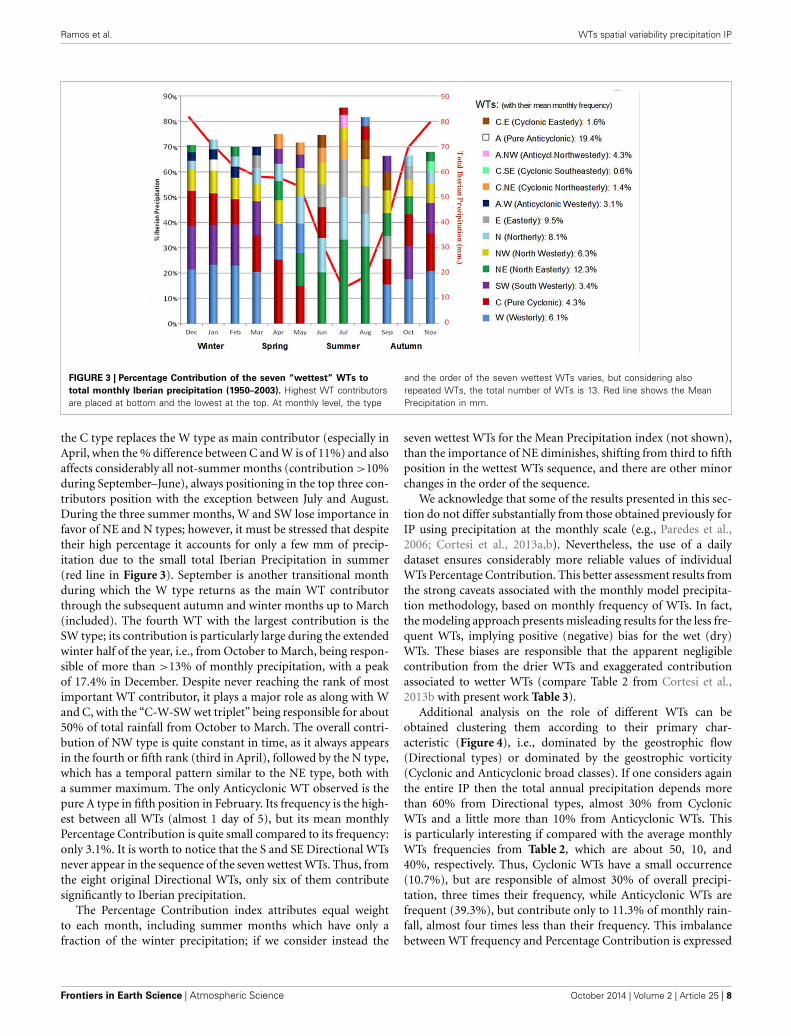
PERCENTAGE CONTRIBUTIONPrevious works with just a few stations have shown that a rela-tively small number of WTs are responsible for the bulk of theprecipitation over western Iberia (Trigo and DaCamara, 2000) orsouthern Spain (Goodess and Palutikof, 1998) of northwesternGalicia (Lorenzo et al., 2008). Here we intend to evaluate this
dependence using a much larger precipitation dataset and usingthe spatial averaged values over the entire IP. Thus, the monthlysequence of the seven “wettest” WTs for each month is presentedin Figure 3 and Table 3. A simple glance to this figure shows thatroughly 20% of total monthly Iberian precipitation depends froma single WT in autumn and winter months (W), and around50% only from three WTs (W+C+SW). However, these threeWTs have a combined frequency of occurrence of about 15%,i.e., confirming that a small number of WTs indeed captures ahigh percentage of monthly precipitation variability. If one con-siders all the months of the year then seven non-hybrid WTsgenerate almost 70% of total monthly Iberian precipitation: W(14.7%), C (12.4%), NE (11.4%), SW (8.8%), NW (8.4%), N(7.7%), and E (6.2%).
The type and order of the seven wettest WTs varies substan-tially throughout the year. The W type is the highest contributor,from September to March generating about 20% (maximum of23.3% in January) of monthly rainfall amount, and at the sametime during these months its contribution is the highest betweenall the 26 WTs. During the transitional months of April and May
www.frontiersin.org October 2014 | Volume 2 | Article 25 | 7
Ramos et al. WTs spatial variability precipitation IP
FIGURE 3 | Percentage Contribution of the seven “wettest” WTs to
total monthly Iberian precipitation (1950–2003). Highest WT contributorsare placed at bottom and the lowest at the top. At monthly level, the type
and the order of the seven wettest WTs varies, but considering alsorepeated WTs, the total number of WTs is 13. Red line shows the MeanPrecipitation in mm.
the C type replaces the W type as main contributor (especially inApril, when the % difference between C and W is of 11%) and alsoaffects considerably all not-summer months (contribution >10%during September–June), always positioning in the top three con-tributors position with the exception between July and August.During the three summer months, W and SW lose importance infavor of NE and N types; however, it must be stressed that despitetheir high percentage it accounts for only a few mm of precip-itation due to the small total Iberian Precipitation in summer(red line in Figure 3). September is another transitional monthduring which the W type returns as the main WT contributorthrough the subsequent autumn and winter months up to March(included). The fourth WT with the largest contribution is theSW type; its contribution is particularly large during the extendedwinter half of the year, i.e., from October to March, being respon-sible of more than >13% of monthly precipitation, with a peakof 17.4% in December. Despite never reaching the rank of mostimportant WT contributor, it plays a major role as along with Wand C, with the “C-W-SW wet triplet” being responsible for about50% of total rainfall from October to March. The overall contri-bution of NW type is quite constant in time, as it always appearsin the fourth or fifth rank (third in April), followed by the N type,which has a temporal pattern similar to the NE type, both witha summer maximum. The only Anticyclonic WT observed is thepure A type in fifth position in February. Its frequency is the high-est between all WTs (almost 1 day of 5), but its mean monthlyPercentage Contribution is quite small compared to its frequency:only 3.1%. It is worth to notice that the S and SE Directional WTsnever appear in the sequence of the seven wettest WTs. Thus, fromthe eight original Directional WTs, only six of them contributesignificantly to Iberian precipitation.
The Percentage Contribution index attributes equal weightto each month, including summer months which have only afraction of the winter precipitation; if we consider instead the
seven wettest WTs for the Mean Precipitation index (not shown),than the importance of NE diminishes, shifting from third to fifthposition in the wettest WTs sequence, and there are other minorchanges in the order of the sequence.
We acknowledge that some of the results presented in this sec-tion do not differ substantially from those obtained previously forIP using precipitation at the monthly scale (e.g., Paredes et al.,2006; Cortesi et al., 2013a,b). Nevertheless, the use of a dailydataset ensures considerably more reliable values of individualWTs Percentage Contribution. This better assessment results fromthe strong caveats associated with the monthly model precipita-tion methodology, based on monthly frequency of WTs. In fact,the modeling approach presents misleading results for the less fre-quent WTs, implying positive (negative) bias for the wet (dry)WTs. These biases are responsible that the apparent negligiblecontribution from the drier WTs and exaggerated contributionassociated to wetter WTs (compare Table 2 from Cortesi et al.,2013b with present work Table 3).
Additional analysis on the role of different WTs can beobtained clustering them according to their primary char-acteristic (Figure 4), i.e., dominated by the geostrophic flow(Directional types) or dominated by the geostrophic vorticity(Cyclonic and Anticyclonic broad classes). If one considers againthe entire IP then the total annual precipitation depends morethan 60% from Directional types, almost 30% from CyclonicWTs and a little more than 10% from Anticyclonic WTs. Thisis particularly interesting if compared with the average monthlyWTs frequencies from Table 2, which are about 50, 10, and40%, respectively. Thus, Cyclonic WTs have a small occurrence(10.7%), but are responsible of almost 30% of overall precipi-tation, three times their frequency, while Anticyclonic WTs arefrequent (39.3%), but contribute only to 11.3% of monthly rain-fall, almost four times less than their frequency. This imbalancebetween WT frequency and Percentage Contribution is expressed
Frontiers in Earth Science | Atmospheric Science October 2014 | Volume 2 | Article 25 | 8

Ramos et al. WTs spatial variability precipitation IP
Table 3 | Percentage Contribution of each WT to total monthly Iberian precipitation.
Last column shows the mean of the 12 monthly values for each WT. Color scale helps visualize inter monthly variability. Scale number at right (33.2%) refers to the
highest contribute of all 26 WTs, while scale midpoint (white color) is equal to the first quartile (0.8%).
FIGURE 4 | Monthly mean of WT Frequency, Percentage Contribution,
and Precipitation Efficiency for the three main WT classes: Directional
(N, NE, E, SE, S, SW, W, NW), Cyclonic (C, CN, CNE, CE, CSE, CS, CSW,
CW, CNW), and Anticyclonic (A, AN, ANE, AE, ASE, AS, ASW, AW and
ANW).
by the Precipitation Efficiency that is considerably higher for theCyclonic types (40.6%) and low for Anticyclonic ones (9.9%) asshown in Figure 4.
SPATIAL ANALYSISThe effects of each WT on the precipitation regime of theIP are related to all the indices mentioned in the MethodsSection, i.e., its temporal Frequency (Table 2), Mean Precipitation(Table 3), Percentage Contribution (Table S1), total Area affected(Table S2), Precipitation Intensity (Table S3), and Efficiency(Table S4). This preliminary analysis conducted in the previoussection and also in the above mentioned Tables is based only onprecipitation averaged over the entire IP. Naturally, results willvary considerably if one looks into the individual behavior of eachsingle grid cell or pixel. Therefore, it is of paramount importanceto analyze the spatial distribution of each index, focusing on oneWT at a time.
The analysis of WTs that follows illustrates the spatial distri-bution of the effects on monthly precipitation relative to three
www.frontiersin.org October 2014 | Volume 2 | Article 25 | 9

Ramos et al. WTs spatial variability precipitation IP
of the seven most prominent (i.e., wettest) WTs, namely; theW, C, and NE (Figures 4–6) with the remaining WTs beingshowed in the Supplementary Material. Taking into account thestrong seasonal cycle but also the impossibility of showing theresults for all the months we have limited this analysis to thefour representative months in the middle of each season: Januaryfor winter, April for spring, July for summer, and October forautumn. Each figure includes 16 different sub-plots of the areaaffected by the specific WT at the monthly scale relative to fourindices; (1) Mean Precipitation, (2) Percentage Contribution,(3) Precipitation Intensity, and (4) Precipitation Efficiency. Notethat the spatial distribution of the Mean Precipitation is alwaysproportional to the Precipitation Intensity, only the magni-tude is different (recall definitions in Section PrecipitationIndices).
WESTERLY (W) WEATHER TYPEThe most prominent WT affecting IP precipitation at monthlylevel is W and the overall characterization is shown in Figure 5.The corresponding atmospheric circulation pattern consists ofhigh pressure centered west of the Canary Islands and a low pres-sure system placed on average just west of Ireland (Figure 2). Asa consequence, Atlantic westerly flows enter in the IP reachingthe mountain arch and affecting the entire IP but particularlythe north-western sector. This pattern affects substantially fromSeptember to March. Highest effects are noticed to the northwest-ern areas where more than 30% of January, February and Marchprecipitation depends on this WT, even if its influence spreadseven along the western part of the Pyrenees (Figure 1). There aretwo areas in which the effects of W type do not contribute noto-riously to explain monthly precipitation: the Cantabric coastland
FIGURE 5 | Westerly (W) composite maps for the Mean Precipitation, Percentage Contribution, Precipitation Intensity, and Efficiency. The 4 months inthe middle of each season are representative of each season: January for winter, April for spring, July for summer, and October for autumn.
Frontiers in Earth Science | Atmospheric Science October 2014 | Volume 2 | Article 25 | 10

Ramos et al. WTs spatial variability precipitation IP
FIGURE 6 | As Figure 5 but relative to the Cyclonic (C) class.
to the north, and the Mediterranean fringe to the east, includ-ing the north-inland Ebro basin. Precipitation Intensity is highestin the northwestern areas (including most of Portugal) becauseof local orography. The same is true for Precipitation Efficiency,which reaches a maximum of almost 100% in the same areas andthen decreases to almost 0% in a clear diagonal gradient fromnorth-west to south-east.
PURE CYCLONIC (C) WEATHER TYPEThe spatial distribution and contribution to precipitationassociated to the C type is shown in Figure 6. The correspondingcomposite SLP pattern (Figure 2) is dominated by a low pressurecenter over the IP. The spatial impact of this WT type is differ-ent from the W type described previously. Its maximum effects,
in terms of contribution to monthly precipitation are clearlyobserved in spring season, but are also relevant during autumnand winter. The shape of the affected area of its PercentageContribution has a diagonal orientation from north-east tosouth-west, i.e., relative precipitation in the northwest and south-east sectors of IP does not depend much on this WT, while theshape of the affected area of its Mean Precipitation gives moreweight to the orography, particularly to the Central System andthe Bethic System. Differently from the Percentage Contribution,the Precipitation Intensity is highest in autumn and winter, notin spring, because C frequency is smaller in the former season,while the Precipitation Efficiency is almost the same for bothseasons, generally between 25 and 75%, and increasing fromwest to east, with a spatial variation inferior than the Westerly
www.frontiersin.org October 2014 | Volume 2 | Article 25 | 11

Ramos et al. WTs spatial variability precipitation IP
WT, which in the same month could range from 1 to 100% ofEfficiency.
NORTHEASTERLY (NE) WEATHER TYPEThe NE type pattern consists of a high SLP center located to thenorth of Azores but extending further north and east than theaverage patterns for the N type (Figure 2). Its effects on IP precip-itation are less extended than those described previously for the Wand C types and with a different peak season (Figure 7). Thus, theMean Precipitation and Area of Influence are lower throughoutthe year (Tables S1 and S2), and limited to some coastal areas tothe east and north of IP. Only its Percentage Contribution is veryhigh in summer, particularly in July and August, because in thesemonths there are few WTs contributing to monthly rainfall. Thus,its Percentage Contribution can reach very high values (>40%),even if the Mean Precipitation is small or very small (<1–2 mm.).This is also due to the very high summer NE frequencies, thatdistributes the small NE rainfall amount in a large number of
days, determining a very small summer Precipitation Intensity(<1 mm/day) and Efficiency (<25% for the majority of IP).
COMBINED ANALYSIS OF PRECIPITATION INDICESIn this section we perform a combined analysis of the threemost innovative precipitation indices (Precipitation Intensity,Precipitation Efficiency, and Area of Influence). In this way, wecan identify visually in appropriate scatter-plots the nature ofthese relationships (e.g., linear vs. non-linear, level of dispersion,etc.) and also how such links vary with WTs. In these represen-tations (Figures 8–10) each point represents a single WT duringa specific month, therefore there is a total of 312 values (26 ×12 = 312 points).
PRECIPITATION INTENSITY vs. PRECIPITATION EFFICIENCYDue to the similar definition of Precipitation Intensity andPrecipitation Efficiency (see Section Precipitation Indices), whichonly differ in the numerator, these two indexes are highly
FIGURE 7 | As Figure 5 but relative to the Northeasterly (NE) class.
Frontiers in Earth Science | Atmospheric Science October 2014 | Volume 2 | Article 25 | 12

Ramos et al. WTs spatial variability precipitation IP
FIGURE 8 | Scatter plot between the Precipitation Intensity and the
Precipitation Efficiency. Each point represents a single WT during aspecific month (total of 26 × 12 = 312 points). R2 of the linear fit is 0.94.The five WTs with the highest mean monthly Efficiency are highlighted incolor, in order of decreasing Efficiency from left to right. For these five WTs,the three winter months (D-J-F) are shown as circles, the three springmonths (M-A-M) as triangles, summer months (J-J-A) as squares, andautumn (S-O-N) as triangles pointing downward.
FIGURE 9 | Scatter plot of the Percentage Contribution as a function of
the Area of Influence. The five “wettest” WTs (W, C, NE, SW, and NW)are highlighted in color with a legend similar to Figure 8.
correlated between them, as can be seen from their scatter plot inFigure 8. This fact explains the sequence of the five most intenseWTs is very similar to the sequence of the five most efficient ones(from Figure 8: CW; CSW; CNW; C; W). Four of the five WTs
FIGURE 10 | Similar to Figure 9 but for Percentage Contribution vs.
Precipitation Intensity.
with the highest Precipitation Efficiency are hybrid C types; thefifth is the W type. We should elucidate that these Cyclonic hybridtypes tend to occur at much lower rates than most Directional orAnticyclonic types (Table 1), often less than 1%, and thereforecontribute poorly to the total precipitation. Another interest-ing aspect results from the apparent existence of two regimes inFigure 8, with higher correlation values and lower dispersion atlow intensity or efficiencies.
The global high Precipitation Intensity and Efficiency of pureCyclonic type (C) is also extensive to all hybrid C types. The maxi-mum value of Efficiency is 70.2%, reached by the CSW in January.Each WT presents a seasonal cycle that alternates between mini-mum Efficiency and Intensity values in summer months, and itsmaximum in one of the other seasons.
PERCENTAGE CONTRIBUTION vs. AREA OF INFLUENCEA different measure of the relevance of each WT on IP precipi-tation regime is given in Figure 9, where we present the scatterplot between the Area of Influence for each month and WTand its corresponding Percentage Contribution. The correlationis good but not as high as for the Precipitation Intensity andEfficiency (Figure 8) due to the non-linear nature of this rela-tionship, especially for values with very high (>80%) Area ofInfluence.
The only WT which almost completely affects the IP (>99.9%)is the C type from October to April; its Area of Influence is veryhigh also during September, May, and June (>92%), and only inJuly and August falls below 31% (see Table S2). The second mostwidespread WT influential area is the NW, which spreads to over90% of IP during all non-summer months and March, followedclosely by the W, which covers more than 89% of IP during allnot-summer months. These three WTs impinge their influenceover extended areas of IP, while in general other WTs provide amore localized contribution over relatively narrow areas usually
www.frontiersin.org October 2014 | Volume 2 | Article 25 | 13

Ramos et al. WTs spatial variability precipitation IP
with a limited percentage of total monthly precipitation of IP, butlocally being important.
The spatial extension of NE and N types is also important butlower than the three previous ones, in any case their global meanmonthly extension is over 65% of IP, and during a few monthstheir affected area is larger than 90% (May–June for NE, May forN, October to March for SW). Their seasonal cycle is similar tothe most prominent WTs but often affecting considerably smallerareas than those three wet WTs.
It’s important to stress that other WTs can affect extendedareas but during shorter periods of the year. Among thosethat are relevant during the warm season we can find (seeTable S1 of the Supplementary Material): E (May, June, andSeptember), CNE (April), and CE (May); during autumn manyWTs reach their maximum extension, between them 5 Cyclonicand 5 Anticyclonic types: the SE (October), CSE (October),CE (September), CSW (November), CW (October), CNW(November), A (September, with a secondary maximum inJanuary), ANE (September), AS and AE (October), and lastly ASE(November). Even in winter season several extended WTs are vis-ible, such as NW, S, CS, CSW, CNW, AW, ANW, ASW, even ifthe three last Anticyclonic WTs affect at their maximum less than70% of IP. Only in spring the Area of Influence is minimum, andit is limited to only the CNE and CE types.
PERCENTAGE CONTRIBUTION vs. PRECIPITATION INTENSITYAs we have shown previously in Table 3 and Figures 2, 3, just afew “wet” WTs dominate the precipitation over large parts of IPparticularly the W, C, SW, NE, and NW. The situation is more var-ied in case of the Precipitation Intensity. The scatter plot betweenthe Percentage Contribution and the Precipitation Intensity ispresented in Figure 10. The majority of WTs show low contribu-tions (<3%), but have varying intensities, ranging from near 0 to9.2 mm/day, typically lower for Anticyclonic types and higher forCyclonic ones.
Precipitation Intensity of Cyclonic WTs is clearly higher thanDirectional or Anticyclonic types, as they produce more precipi-tation when they occur, even if their Percentage Contribution isinferior to the Directional types. For this reason, the C Type isfound along the lower right tail of the distribution in Figure 10.
The five “wettest” WTs dominate the upper right part of thescatter plot with contribution >3%, always reaching their maxi-mum Precipitation Intensity during autumn or winter, and thenfalling to a minimum of both Intensity and Contribution dur-ing summer (except NE, which in summer reaches the maximumContribution). The same seasonal pattern is also observed formost other WTs, exceptions being CN during spring and CNEduring summer (see Table S3 of the Supplementary Material).The three green squares in the upper left corner of Figure 10refer to the high Contribution of NE type during summer, butits Intensity is low because in this period its Frequency is veryhigh (≈25%).
DISCUSSION AND CONCLUSIONSClimate variability at sub-regional scale is generally higher thanon hemispheric or global scale (Giorgi, 2002). This is especiallytrue for precipitation because its variability shows less spatial
averaged predictability and higher temporal variability than anyother climate element (Quadrelli et al., 2001; Xoplaki et al., 2004).It also reflects the fact that several different spatial scale pro-cesses from hemispheric to local convective, are in one way oranother, related to precipitation. Thus, research on precipitationat sub-regional scales depends more than other climate elementson both, (1) the availability of spatially dense databases (Lana andBurgueño, 2000; Huntington, 2006; Trenberth et al., 2007), and(2) the length and completeness of the series (Llasat and Quintas,2004; Xoplaki et al., 2004). We have applied this approach inthe present study to analyze at the highest available spatial detailthe relationship between WTs and daily monthly precipitationin the IP.
In a recent paper focused on WTs at general scale of the IP,Cortesi et al. (2013a) stated that the number of WTs that con-tribute to monthly precipitation decreases from western areas toeastern Mediterranean fringe. The authors concluded that thehigh variability of precipitation in the eastern areas is due tothe dependence on a few number of WTs, while to the west theanomalous behavior of one or two WTs could affect the totalamount to a lesser extent.
Some of the results presented in the present work are in accor-dance with those obtained previously by other researchers forIP using precipitation at the monthly scale (e.g., Paredes et al.,2006; Cortesi et al., 2013a,b). However, the use of a high resolu-tion daily dataset implies much more robust results, in particularwe have noticed that the monthly approach has serious limita-tions, namely positive (negative) bias for the wet (dry) WTs, quiteoften stating that the contribution from drier WTs is negligibleor null while the contribution of wetter WTs is overestimated.For comparison see the large number of zero entrances in theindividual WTs contribution in Table 2 (Cortesi et al., 2013b)that are not negligible at all in the corresponding analysis in thepresent work (Table 3). Additionally we have obtained finer spa-tial detail results of the WT impact in precipitation and novelresults related with combined analysis of precipitation indicesrelated to WTs.
Overall the main results can be summarized as follows:
1. Most of the precipitation is produced by just a few WTs thatcontribute to a large percentage of the monthly precipitationin most areas of IP; however, their Efficiency varies substan-tially, being the most efficient WTs the Cyclonic cluster typesthroughout the year, and the Directional (those with a west-ern component) being also efficient precipitation generatorsin winter months.
2. The WTs that dominate the precipitation during wintermonths (D-J-F) in central, western and southwestern areasof IP are pure C, and Directional W and SW. These threeWTs have a combined frequency of occurrence of about 15%,but are responsible for up to 50% of the precipitation inwinter. This confirms that a small number of WTs indeedcaptures a high percentage of monthly precipitation variabil-ity (Trigo and DaCamara, 2000; Paredes et al., 2006) In theMediterranean coastland the winter precipitation is linkedmostly with easterly flows, noticed by Queralt et al. (2009) andMuñoz-Diaz and Rodrigo (2006).
Frontiers in Earth Science | Atmospheric Science October 2014 | Volume 2 | Article 25 | 14

Ramos et al. WTs spatial variability precipitation IP
3. Summer monthly precipitation is usually associated toNortherly or Easterly flows in the IP as suggested by Lorenzoet al. (2011) in northwest areas, or by Muñoz-Diaz andRodrigo (2006) for the whole IP. During summer months theanalyses show that different WTs effects are restricted to rela-tively narrow areas and during short temporal intervals (oneor two months), suggesting that local factors such as reliefand deep convection processes could play a major role inprecipitation spatial variability.
4. Monthly precipitation during spring and autumn dependsmainly from two WTs, namely W and C. We did not observea clear distinction at IP scale previously noticed between thesetwo seasons as suggested by Lorenzo et al. (2011), Muñoz-Diazand Rodrigo (2006).
5. Three contrasted areas accordingly WTs can be delimited:
5.1. Northern Cantabrian coastland, from the sea line to themountain line, extended from west to the east, whereprecipitation depends particularly on N and NW.
5.2. Central-southwest, depending on W, SW, and C, extendfrom western coastland to the inland mountain line.
5.3. Mediterranean coastland and Ebro basin, delimited bythe Iberian System and Bethic System mountain chain (tothe west), the Pyrenees (to the north), and the sea line (tothe east). In this area monthly precipitation depends on avariety of WTs, and their effects are confined to very smallareas.
6. The geographical disposition of the main mountain chains inthe IP, i.e., from west to the east, has been attributed as oneof the main factor that promotes the spatial distribution ofprecipitation and their trends (Gonzalez-Hidalgo et al., 2011),and here we have shown that also they contribute to estab-lish a very well delimited areas accordingly to specific WTseffects.
7. The most efficient WTs corresponds to the CW; CSW; CNW;C; W. However, these Cyclonic hybrid types tend to have lowoccurrence monthly rates and therefore do not contributesignificantly to the total precipitation.
8. The spatial influence of the five “wettest” WTs (W, C, NE,SW, and NW) is particularly large. For the C type, the areaof influence is almost 100% of the IP during the extendedinter months and decreases for the other months of the year.In addition, the other four WTs impinge their influence overextended areas of IP, while in general the remaining WTsprovide a more localized contribution over relatively narrowareas.
All of these aspects are crucial to understand the recent behav-ior of precipitation in the IP, and form the basis for detaileddownscaling analyses for future projections. Finally, this studyshows that WTs approach is able to explain at high spa-tial detail a very high proportion of monthly precipitationvariability, and can be a useful argument for precipitationanalyses at high resolution in future projections. The resultscover also the spring and autumn season less studied untilnow, and offer information about both seasons in which, for
extended areas of IP, the maximum of precipitation are produced(de Luis et al., 2010).
ACKNOWLEDGMENTSThis work was supported by the Portuguese Foundation forScience and Technology (FCT) through project PTDC/GEO-MET/3476/2012—Predictability assessment and hybridization ofseasonal drought forecasts in Western Europe (PHDROUGHT).Alexandre M. Ramos was also supported by FCT through grantFCT/DFRH/SFRH/BPD/84328/2012. The authors would like tothank Dr. Jose Carlos Gonzalez-Hidalgo for providing usefulsuggestions and stimulating discussions about this work.
SUPPLEMENTARY MATERIALThe Supplementary Material for this article can be foundonline at: http://www.frontiersin.org/journal/10.3389/feart.2014.00025/abstract
REFERENCESAnsell, T., Jones, P. D., Allan, R. J., Lister, D., Parker, D. E., Brunet-India, M.,
et al. (2006). Daily mean sea level pressure reconstructions for the European –North Atlantic region for the period 1850–2003. J. Clim. 19, 2717–2742. doi:10.1175/JCLI3775.1
Belo-Pereira, M., Dutra, E., and Viterbo, P. (2011). Evaluation of global precipi-tation data sets over the Iberian Peninsula. J. Geophys. Res. 116, 148–227. doi:10.1029/2010JD015481
Casado, M. J., Pastor, M. A., and Doblas-Reyes, F. J. (2010). Links between circu-lation types and precipitation over Spain. Phys. Chem. Earth 35, 437–447. doi:10.1016/j.pce.2009.12.007
Corte-Real, J., Zhang, X., and Wang, X. (1995). Downscaling GCM informationto regional scales: a non-parametric multivariate approach. Clim. Dyn. 11,413–424.
Cortesi, N., Gonzalez-Hidalgo, J. C., Trigo, R. M., and Ramos, A. M. (2013b).Weather types and spatial variability of precipitation in the Iberian Peninsula.Int. J. Clim. 34, 2661–2677. doi: 10.1002/joc.3866
Cortesi, N., Trigo, R. M., Gonzalez-Hidalgo, J. C., and Ramos, A. M. (2013a).Modelling monthly precipitation with circulation weather types for a dense net-work of stations over Iberia. Hydrol. Earth Syst. Sci. 17, 665–678. doi: 10.5194/hess-17-665-2013
de Luis, M., Brunetti, M., Gonzalez-Hidalgo, J. C., Longares, L. A., andMartin-Vide, J. (2010). Changes in seasonal precipitation in the IberianPeninsula during 1946–2005. Global Planet. Change 74, 27–33. doi:10.1016/j.gloplacha.2010.06.006
Dünkeloh, A., and Jacobeit, J. (2003). Circulation dynamics of Mediterraneanprecipitation variability 1948–1998. Int. J. Clim. 23, 1843–1866. doi:10.1002/joc.973
Esteban-Parra, M., Rodrigo, F., and Castro, M. Y. (1998). Spatial and temporalpatterns of precipitation in Spain for the period 1880–1992. Int. J. Clim. 18,1557–1574.
Fernández-González, S., del Rio, S., Castro, A., Penas, A., Fernández-Raga, M.,Calvo, A., et al. (2012). Connection between NAO, weather types and precip-itation in León, Spain (1948–2008). Int. J. Clim. 32, 2181–2196. doi: 10.1002/joc.2431
Fernandez-Mills, G. F. (1995). Principal component analysis of precipitation andrainfall regionalization in Spain. Theor. Appl. Climatol. 50, 169–183.
Garcia, J. A., Serrano, A., and Gallego, M. D. (2002). A spectral analysis of IberianPeninsula monthly rainfall. Theor. Appl. Climatol. 71, 77–95. doi: 10.1007/s704-002-8209-y
Gimeno, L., Nieto, R., Trigo, R. M., Vicente-Serrano, S. M., and Lopez-Moreno,J. I. (2010). Where does the Iberian Peninsula moisture come from? ananswer based on a lagrangian approach. J. Hydrometeorol. 11, 421–436. doi:10.1175/2009JHM1182.1
Giorgi, F. (2002). Variability and trends of subcontinental scale surface climatein the twentieth century. Part I: observatorios. Clim. Dyn. 18, 675–691. doi:10.1007/s00382-001-0204-x
www.frontiersin.org October 2014 | Volume 2 | Article 25 | 15
Ramos et al. WTs spatial variability precipitation IP
Gonzalez-Hidalgo, J. C., Brunetti, M., and de Luis, M. (2011). A new tool formonthly precipitation analysis in Spain: MOPREDAS database (Monthly pre-cipitation trends December 1945–November 2005). Int. J. Clim. 31, 715–731.doi: 10.1002/joc.2115
Goodess, C. M., and Jones, P. D. (2002). Links between circulation and changesin the characteristics of Iberian rainfall. Int. J. Clim. 22, 1593–1615. doi:10.1002/joc.810
Goodess, C. M., and Palutikof, J. P. (1998). Development of daily rainfall scenariosfor southeast Spain using a circulation-type approach to downscaling. Int. J.Clim. 18, 1051–1083.
Hanggi, P., Jete, M., Kuttel, M., Wanner, H., and Weingartner, R. (2011).Weather type-related trend analysis of precipitation in Switzerland. Hydrol.Wasserbewirts. 55, 140–154.
Herrera, S., Gutiérrez, J. M., Ancell, R., Pons, M. R., Frías, M. D., and Fernández,J. (2012). Development and analysis of a 50-year high-resolution daily griddedprecipitation dataset over Spain (Spain02). Int. J. Clim. 32, 74–85. doi: 10.1002/joc.2256
Huntington, T. G. (2006). Evidence for intensification of the global watercycle: review and synthesis. J. Hydrol. 319, 83–95. doi: 10.1016/j.jhydrol.2005.07.003
Jenkinson, A. F., and Collison, F. P. (1977). “An initial climatology of galesover the North Sea,” in Synoptic Climatology Branch Memorandum (Bracknell:Meteorological Office).
Jones, P. D., Hulme, M., and Briffa, K. R. (1993). A comparison of Lamb circulationtypes with an objective classification scheme. Int. J. Clim. 13, 655–663.
Kostopoulou, E., and Jones, P. D. (2007a). Comprehensive analysis of the climatevariability in the eastern Mediterranean. Part I: map-pattern. Int.J. Clim. 27,1189–1214. doi: 10.1002/joc.1467
Kostopoulou, E., and Jones, P. D. (2007b). Comprehensive analysis of the cli-mate variability in the eastern Mediterranean. Part II: relationships betweenatmospheric circulation patterns and surface climatic elements. Int. J. Clim. 27,1351–1371. doi: 10.1002/joc.1466
Kutiel, H., Maheras, P., and Guika, S. (1996). Circulation indices over theMediterranean and Europe and their relationship with rainfall condi-tions across the Mediterranean. Theor. Appl. Climatol. 54, 125–138. doi:10.1007/BF00865155
Lana, X., and Burgueño, A. (2000). Some statistical characteristics of monthly andannual pluviometric irregularity for the Spanish Mediterranean coast. Theor.Appl. Climatol. 65, 79–97. doi: 10.1007/s007040050006
Lionello, P., Gacic, M., Gomis, D., Garcia-Herrera, R., Giorgi, F., Planton, S., et al.(2012). Program focuses on climate of the Mediterranean region. EOS Trans.Am. Geophys. Union 93, 105–106. doi: 10.1029/2012EO100001
Llasat, M. C., and Quintas, L. (2004). Stationarity of monthly rainfall series sincethe middle of the XIXth century. Application to the case of Peninsular Spain.Nat. Hazards 31, 613–622. doi: 10.1023/B:NHAZ.0000024894.66869.46
Lorenzo, M. N., Ramos, A. M., Taboada, J., and Gimeno, L. (2011). Changes inpresent and future circulation types frequency in Northwest Iberian Peninsula.PLoS ONE 6:e16201. doi: 10.1371/journal.pone.0016201
Lorenzo, M. N., Taboada, J. J., and Gimeno, L. (2008). Links between circulationweather types and teleconnection patterns and their influence on precipi-tatioon patterns in Galicia (NW Spain). Int. J. Clim. 28, 1493–1505. doi:10.1002/joc.1646
Lorenzo-Lacruz, J., Vicente-Serrano, S. M., López-Moreno, J. I., Gonzalez-Hidalgo,J. C., and Morán-Tejeda, E. (2011). The response of Iberian rivers to the NorthAtlantic Oscillation. Hydrol. Earth Syst. Sci. 15, 2581–2597. doi: 10.5194/hess-15-2581-2011
Martin-Vide, J. (2004). Spatial distribution of a daily precipitation concentrationindex in peninsular Spain. Int. J. Clim. 24, 959–971. doi: 10.1002/joc.1030
Martin-Vide, J., and Gomez, L. (1999). Regionalization of peninsular Spain basedon the length of dry spells. Int. J. Clim. 19, 537–555.
Martin-Vide, J., and Lopez-Bustins, J. A. (2006). The western Mediterranean oscil-lation and rainfall in the Iberian Peninsula. Int. J. Clim. 26, 1455–1475. doi:10.1002/joc.1388
Michailidou, C., Maheras, P., Arseni-Papadimititriou, A. F., Kolyva-Machera, A.,and Anagnostopoulou, C. (2009). A study of weather types at Athens andThessaloniki and their relationship to circulation types for the cold-wet period,part I: two-step cluster analysis. Theor. Appl. Climatol. 97, 163–177. doi:10.1007/s00704-008-0057-x
Morata, A., Martin, M. L., Luna, M. Y., and Valero, F. (2006). Self-similarity patternsof precipitation in the Iberian Peninsula. Theor. Appl. Climatol. 85, 41–59. doi:10.1007/s00704-005-0175-7
Muñoz-Diaz, D., and Rodrigo, F. S. (2004). Spatio-temporal patterns of sea-sonal rainfall in Spain (1912–2000) using cluster and principal componentanalysis: comparison. Ann. Geophys. 22, 1435–1448. doi: 10.5194/angeo-22-1435-2004
Muñoz-Diaz, D., and Rodrigo, F. S. (2006). Seasonal rainfall variations in Spain(1912–2000) and the links to atmospheric circulation. Atmos. Res. 81, 94–110.doi: 10.1016/j.atmosres.2005.11.005
Paredes, D., Trigo, R. M., García-Herrera, R., and Trigo, I. F. (2006).Understanding precipitation changes in Iberia in early spring: weather typingand storm-tracking approaches. J. Hydrometeorol. 7, 101–113. doi: 10.1175/JHM472.1
Quadrelli, R., Pavan, V., and Molteni, F. (2001). Wintertime variability ofMediterranean precipitation and its links with large-scale circulation anomalies.Clim. Dyn. 17, 457–466. doi: 10.1007/s003820000121
Queralt, S., Hernandez, E., Barriopedro, D., Gallego, D., Ribera, P., and Casanova,C. (2009). North Atlantic Oscillation influence and weather types associatedwith Winter total and extreme precipitation events in Spain. Atmos. Res. 94,675–683. doi: 10.1016/j.atmosres.2009.09.005
Ramos, A. M., Lorenzo, M. N., and Gimeno, L. (2010). Compatibility betweenmodes of low-frequency variability and circulation types: a case study ofthe northwest Iberian Peninsula. J. Geophys. Res. Atmos. 115:D02113. doi:10.1029/2009JD012194
Ramos, A. M., Trigo, R. M., and Liberato, M. L. R. (2014). A ranking of high-resolution daily precipitation extreme events for the Iberian Peninsula. Atmos.Sci. Lett. doi: 10.1002/asl2.507
Rodriguez-Puebla, C., Encinas, A. H., Nieto, S., and Garmenia, J. (1998). Spatialand temporal patterns of annual precipitation variability over the IberianPeninsula. Int. J. Clim. 18, 299–316.
Romero, R., Ramis, C., and Guijarro, J. A. (1999). Daily rainfall patterns in theSpanish Mediterranean area: an objective classification. Int. J. Clim. 19, 95–112.
Saaroni, H., Halfon, N., and Ziv, B. (2010). Links between the rainfall regime inIsrael and location and intensity of Cyprus lows. Int. J. Clim. 30, 1014–1025.doi: 10.1002/joc.1912
Santos, J. A., Corte-Real, J., and Leite, S. M. (2005). Weather regimes and theirconnections to the winter rainfall in Portugal. Int. J. Clim. 25, 33–50. doi:10.1002/joc.1101
Serrano, A., Garcia, J. A., Mateos, V. L., Cancillo, M. L., and Garrido, J. (1999).Monthly modes of variation of precipitation over the Iberian peninsula. J. Clim.12, 2894–2919.
Spellman, G. (2000). The use of an index-based regression model for precipita-tion analysis on the Iberian Peninsula. Theor. Appl. Climatol. 66, 229–239. doi:10.1007/s007040070027
Tartaglione, N., Maugeri, M., Dalan, F., Brunetti, M., Nanni, T., and Speranza, A.(2009). Searching for resemblance between large-scale sea level pressure pat-terns leading to “intense” precipitation events over Italy. Theor. Appl. Climatol.95, 183–196. doi: 10.1007/s00704-007-0374-5
Trenberth, K. E., Jones, P. D., Ambenje, P., Bojariu, R., Easterling, D., Klein Tank,A., et al. (2007). “Observations: surface and atmospheric climate change,” inClimate Change 2007: The Physical Science Basis. Contribution of Working GroupI to the Fourth Assessment Report of the Intergovernmental Panel on ClimateChange, eds S. Solomon, D. Qin, M. Manning, Z. Chen, M. Marquis, K. B.Averyt, M. Tignor and H. L. Miller (Cambridge; New York, NY: CambridgeUniversity Press).
Trigo, R. M., and DaCamara, C. C. (2000). Circulation weather types andtheir impact on the precipitation regime in Portugal. Int. J. Clim. 20,1559–1581. doi: 10.1002/1097-0088(20001115)20:13<1559::AID-JOC555>3.0.CO;2-5
Trigo, R. M., and Palutikof, J. P. (2001). Precipitation scenarios over Iberia: a com-parison between direct GCM output and different downscaling techniques.Int. J. Clim. 14, 4422–4446. doi: 10.1175/1520-0442(2001)014<4422:PSOIAC>
2.0.CO;2Valero, F., Martín, M. L., Sotillo, M. G., Morata, A., and Luna, M. Y. (2009).
Characterization of the autumn Iberian precipitation from long term datasets:comparison between observed and hindcasted data. Int. J. Clim. 29, 527–541.doi: 10.1002/joc.1726
Frontiers in Earth Science | Atmospheric Science October 2014 | Volume 2 | Article 25 | 16

Ramos et al. WTs spatial variability precipitation IP
Vicente-Serrano, S. M., and Lopez-Moreno, J. I. (2006). The influence of atmo-spheric circulation at different spatial scales on winter drought variabilitythrough a semi-arid climatic gradient in Northeast Spain. Int. J. Clim. 26,1427–1453. doi: 10.1002/joc.1387
Wilks, D. S. (2006). Statistical Methods in the Atmospheric Sciences: An Introduction.International Geophysics. Series 59. St. Louis, MO: Academic Press.
Xoplaki, E., González-Rouco, F., Luterbacher, J., and Wanner, A. (2004).Wet season Mediterranean precipitation variability: influence of large scaledynamics and trends. Clim. Dyn. 23, 63–78. doi: 10.1007/s00382-004-0422-0
Zhang, X., Wang, X. L., and Corte-Real, J. (1997). On the relationships betweendaily circulation patterns and precipitation in Portugal. J. Geophys. Res. 102,13495–13507.
Zorita, E., Kharin, V., and von Storch, H. (1992). The atmospheric circu-lation and sea surfuce temperature in the North Atlantic area in win-ter: their interaction and relevance for Iberian precipitation. J. Clim. 5,1097–1108.
Conflict of Interest Statement: The authors declare that the research was con-ducted in the absence of any commercial or financial relationships that could beconstrued as a potential conflict of interest.
Received: 15 July 2014; paper pending published: 22 August 2014; accepted: 16September 2014; published online: 13 October 2014.Citation: Ramos AM, Cortesi N and Trigo RM (2014) Circulation weather types andspatial variability of daily precipitation in the Iberian Peninsula. Front. Earth Sci.2:25. doi: 10.3389/feart.2014.00025This article was submitted to Atmospheric Science, a section of the journal Frontiers inEarth Science.Copyright © 2014 Ramos, Cortesi and Trigo. This is an open-access article distributedunder the terms of the Creative Commons Attribution License (CC BY). The use, dis-tribution or reproduction in other forums is permitted, provided the original author(s)or licensor are credited and that the original publication in this journal is cited, inaccordance with accepted academic practice. No use, distribution or reproduction ispermitted which does not comply with these terms.
www.frontiersin.org October 2014 | Volume 2 | Article 25 | 17