Embed Size (px)
Citation preview
CISC 322Software Architecture
Project Scheduling (PERT/CPM)
Ahmed E. Hassan
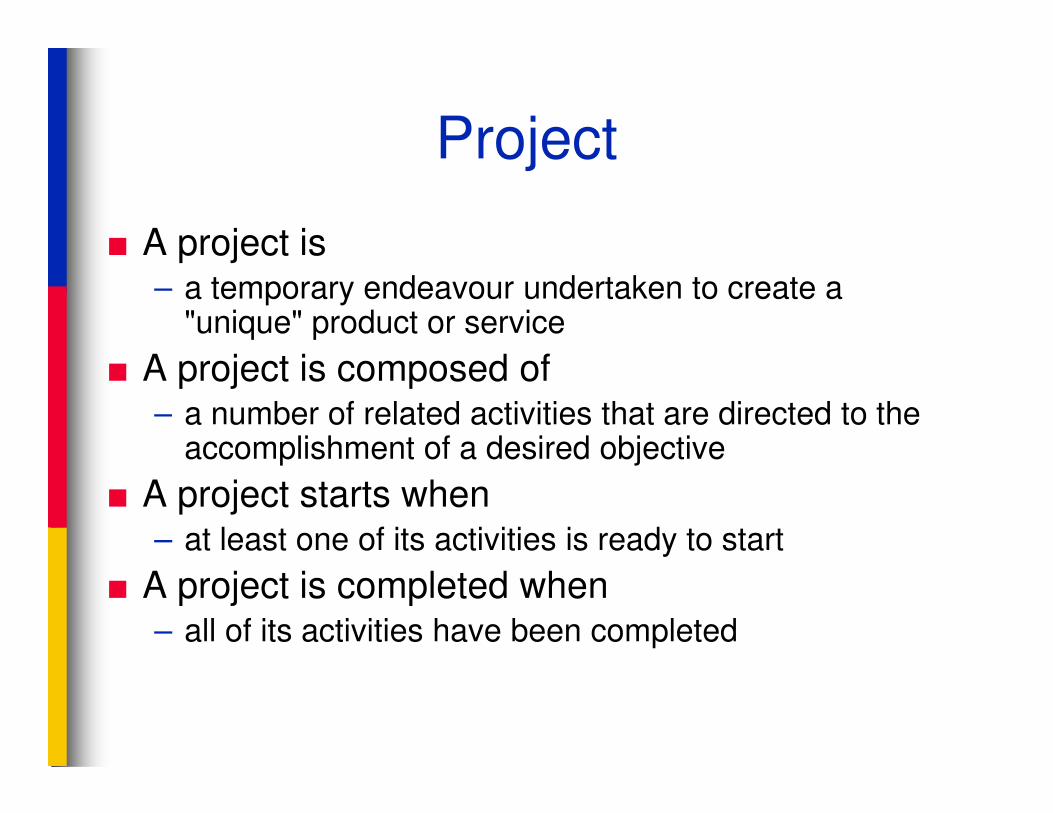
Project
■ A project is– a temporary endeavour undertaken to create a
"unique" product or service
■ A project is composed of – a number of related activities that are directed to the – a number of related activities that are directed to the
accomplishment of a desired objective
■ A project starts when – at least one of its activities is ready to start
■ A project is completed when – all of its activities have been completed
Activity
■ An activity
– Must have a clear start and a clear stop
– Must have a duration that can be forecasted
– May require the completion of other activities – May require the completion of other activities
before it begins
– should have some ‘deliverables’ for ease of
monitoring
Project plan
■ A project plan is a schedule of activities
indicating
– The start and stop for each activity. The start and stop
of each activity should be visible and easy to measure
– When a resource is required
– Amount of required project resources

Project Planning
■Managers should consider:
– Resource availability
– Resource allocation
– Staff responsibility– Staff responsibility
– Cash flow forecasting
■Mangers need to monitor and re-plan as the project progresses towards its pre-defined goal
Work Breakdown Structure (WBS)
■ Contains a list of activities for a project derived from– Previous experience
– Expert brainstorming
■ WBS helps in ■ WBS helps in – identifying the main activities
– break each main activity down into sub-activities which can further be broken down into lower level sub-activities
■ WBS problems:– Too many levels
– Too few levels
Creating WBS
■ Phase based approach
■ Product based approach
■ Hybrid approach
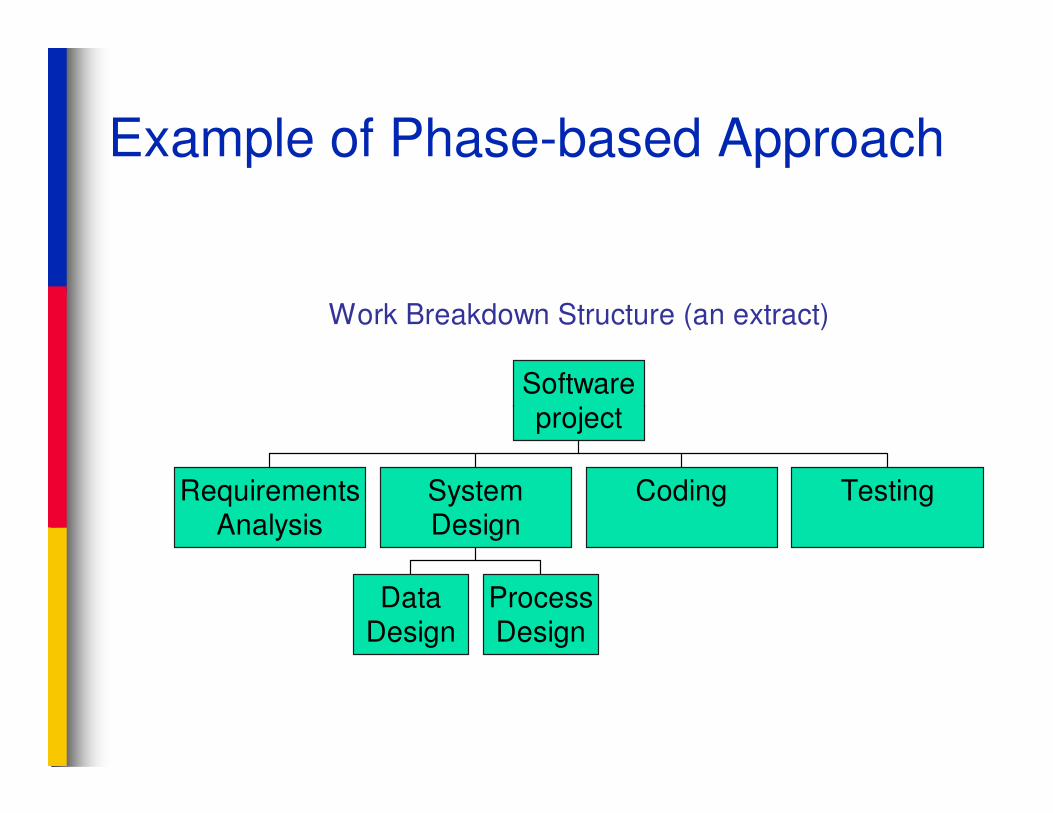
Example of Phase-based Approach
Work Breakdown Structure (an extract)
Softwareproject
RequirementsAnalysis
DataDesign
ProcessDesign
SystemDesign
Coding Testing
project
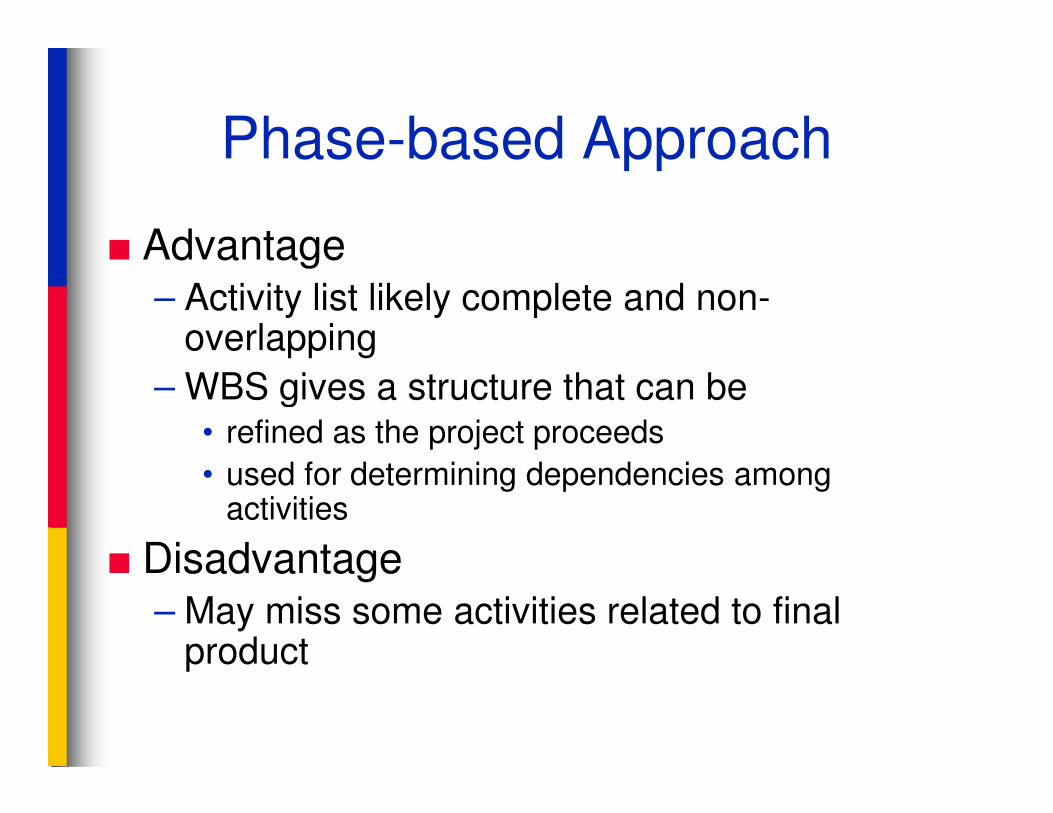
Phase-based Approach
■ Advantage– Activity list likely complete and non-
overlapping
– WBS gives a structure that can be– WBS gives a structure that can be• refined as the project proceeds
• used for determining dependencies among activities
■ Disadvantage– May miss some activities related to final
product
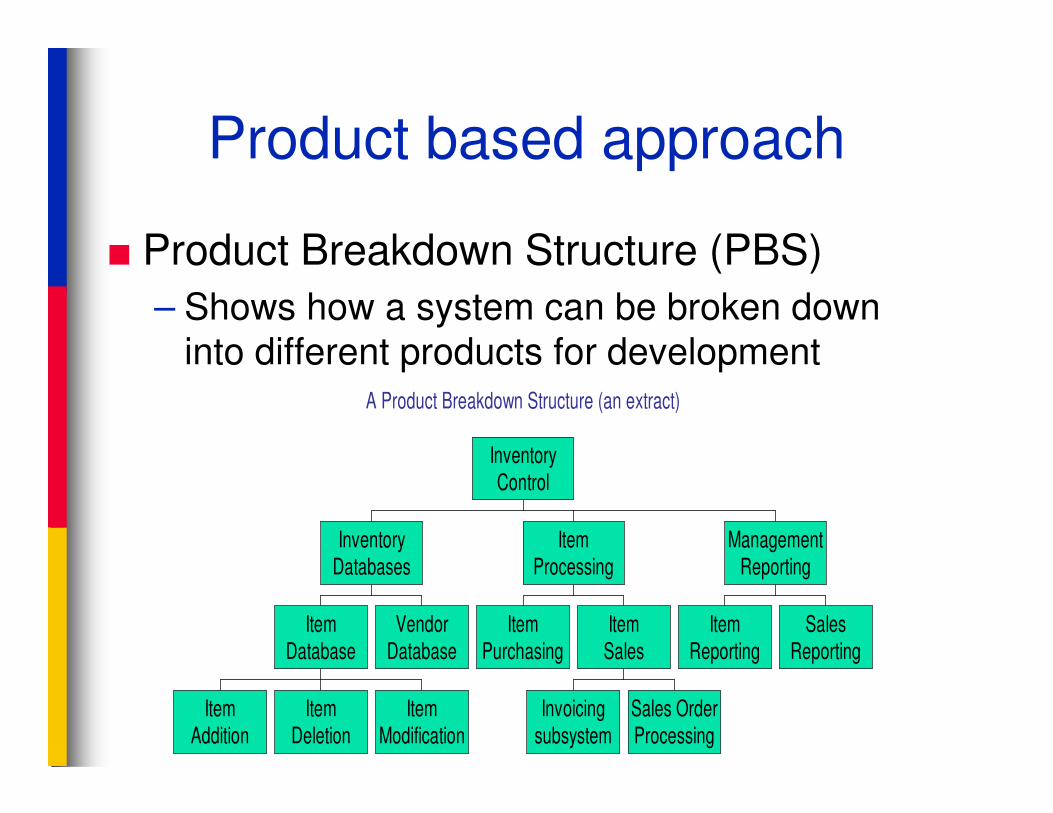
Product based approach
■ Product Breakdown Structure (PBS)
– Shows how a system can be broken down
into different products for developmentA Product Breakdown Structure (an extract)A Product Breakdown Structure (an extract)
ItemAddition
ItemDeletion
ItemModification
ItemDatabase
VendorDatabase
InventoryDatabases
ItemPurchasing
Invoicingsubsystem
Sales OrderProcessing
ItemSales
ItemProcessing
ItemReporting
SalesReporting
ManagementReporting
InventoryControl
Hybrid Approach
■ A mix of the phase-based and product-based approaches (most commonly used)
■ The WBS consists of
– a list of the products of the project; and– a list of the products of the project; and
– a list of phases for each product
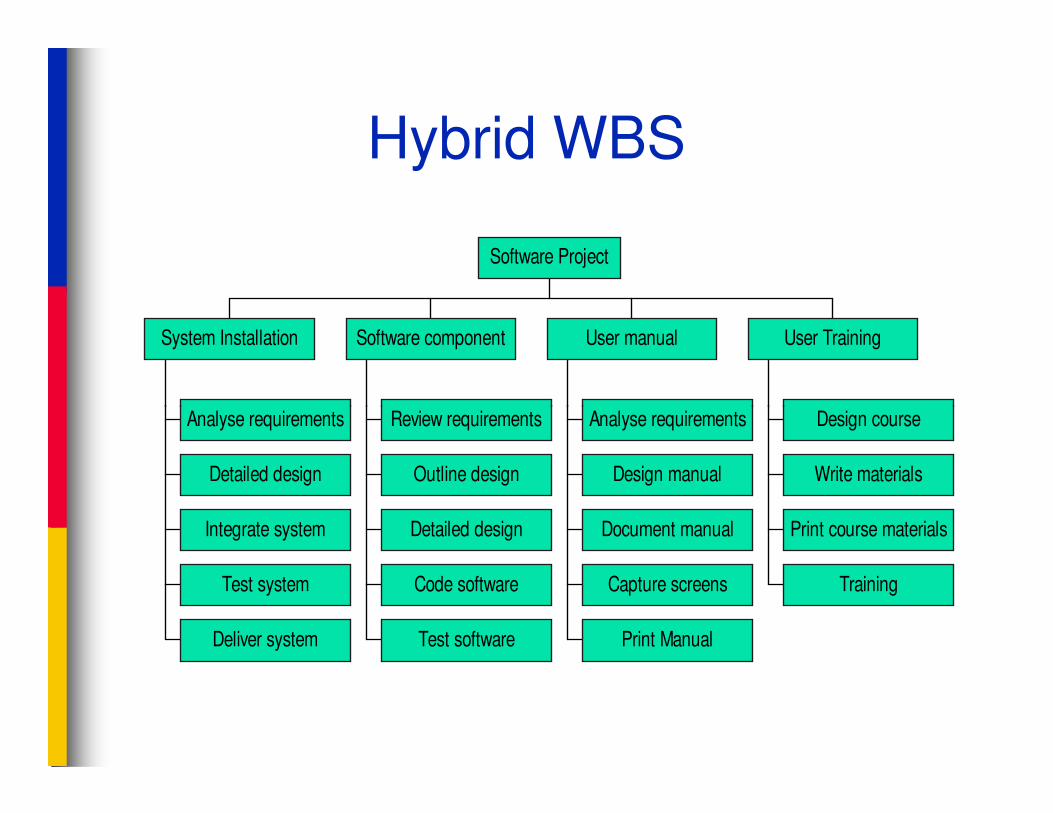
Hybrid WBS
System Installation Software component User manual User Training
Software Project
Analyse requirements
Detailed design
Integrate system
Test system
Deliver system
Review requirements
Outline design
Detailed design
Code software
Test software
Analyse requirements
Design manual
Document manual
Capture screens
Print Manual
Design course
Write materials
Print course materials
Training
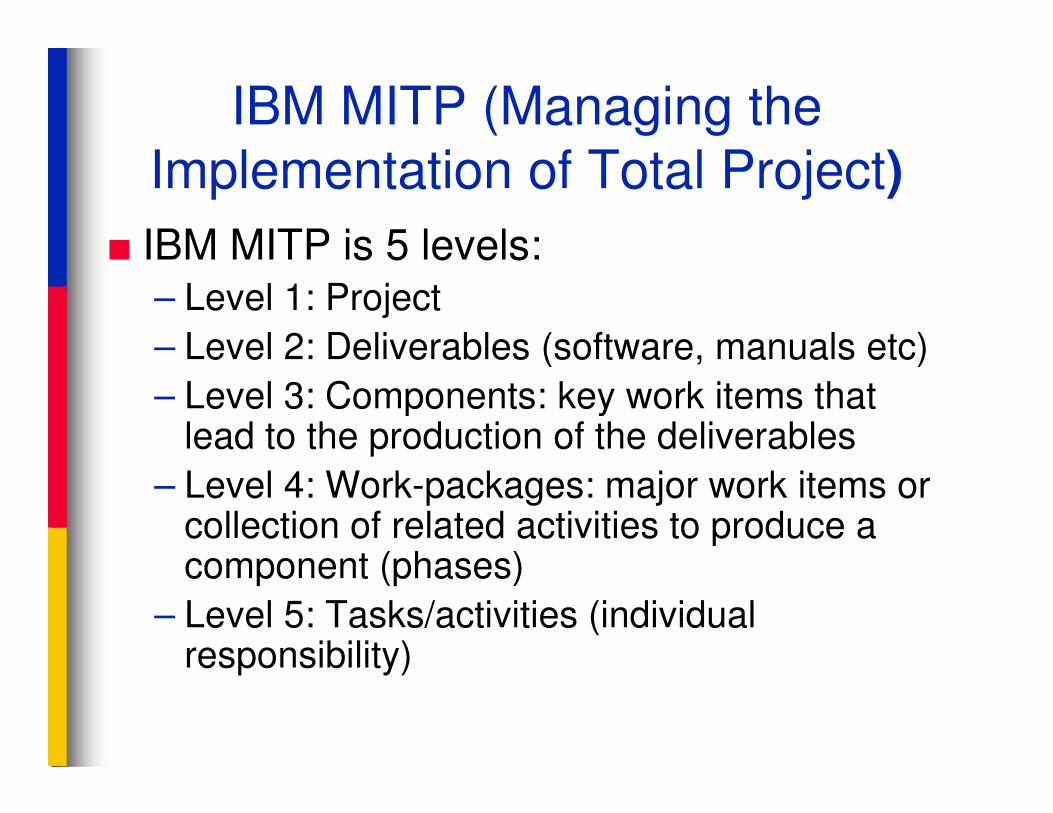
IBM MITP (Managing the
Implementation of Total Project)
■ IBM MITP is 5 levels:– Level 1: Project
– Level 2: Deliverables (software, manuals etc)
– Level 3: Components: key work items that – Level 3: Components: key work items that lead to the production of the deliverables
– Level 4: Work-packages: major work items or collection of related activities to produce a component (phases)
– Level 5: Tasks/activities (individual responsibility)
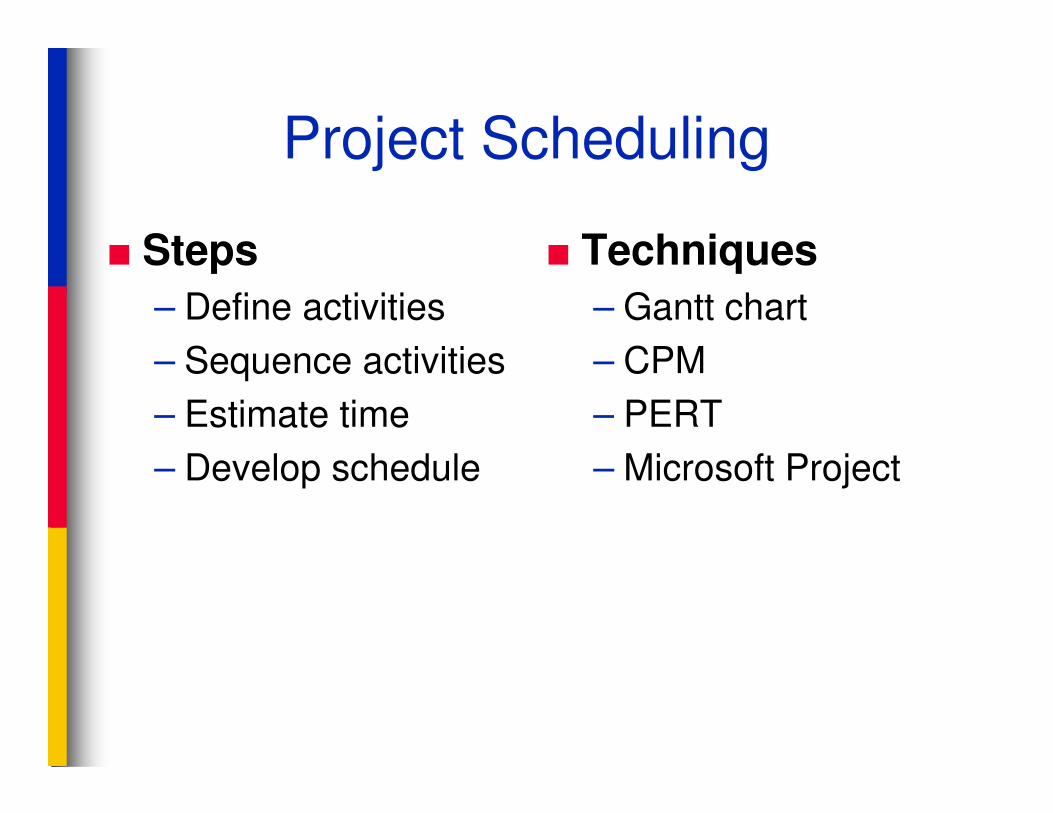
Project Scheduling
■ Steps
– Define activities
– Sequence activities
– Estimate time
■ Techniques
– Gantt chart
– CPM
– PERT– Estimate time
– Develop schedule
– PERT
– Microsoft Project
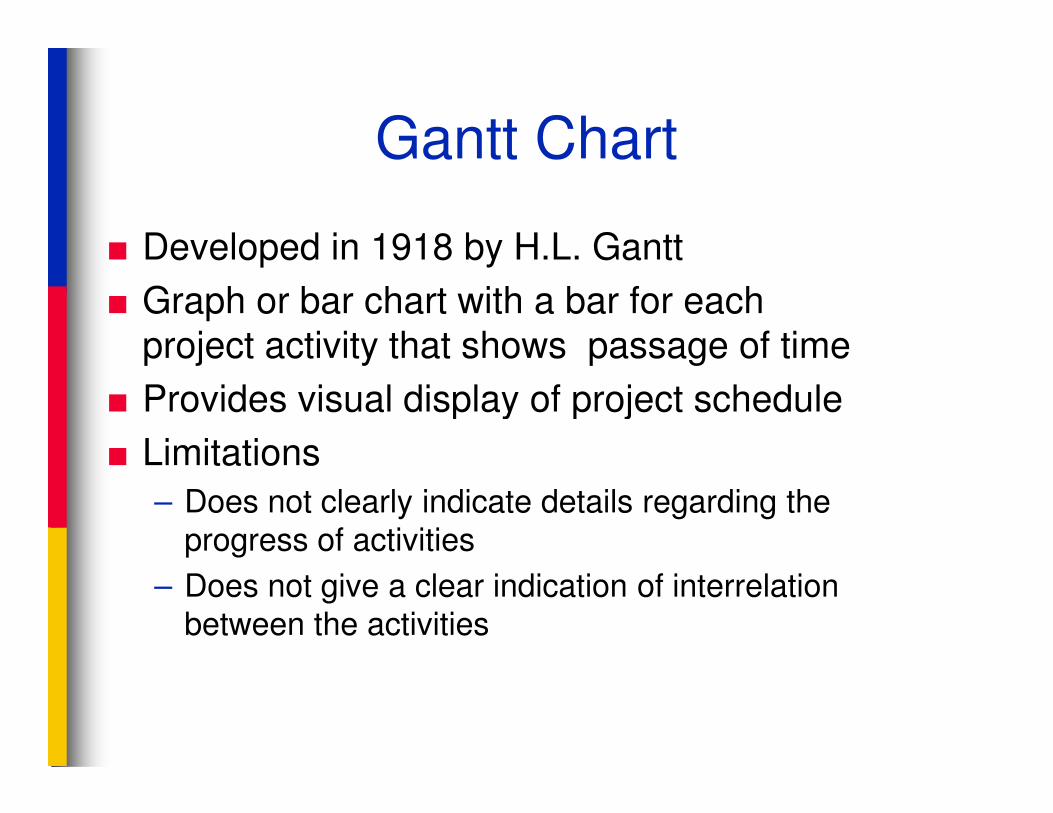
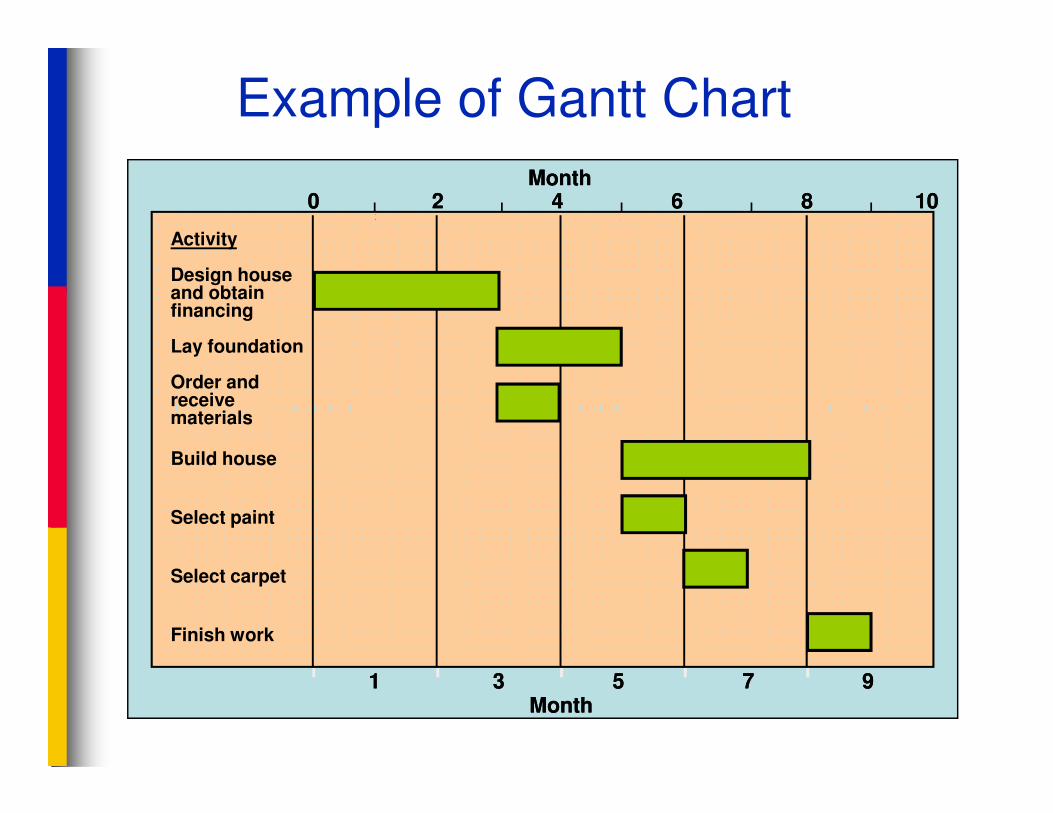
Gantt Chart
■ Developed in 1918 by H.L. Gantt
■ Graph or bar chart with a bar for each
project activity that shows passage of time
■ Provides visual display of project schedule■ Provides visual display of project schedule
■ Limitations
– Does not clearly indicate details regarding the
progress of activities
– Does not give a clear indication of interrelation
between the activities
| | | | |
Activity
Design house and obtain financing
Lay foundation
Order and receive materials
00 22 44 66 88 1010MonthMonth
Example of Gantt Chart
receive materials
Build house
Select paint
Select carpet
Finish work
MonthMonth11 33 55 77 99
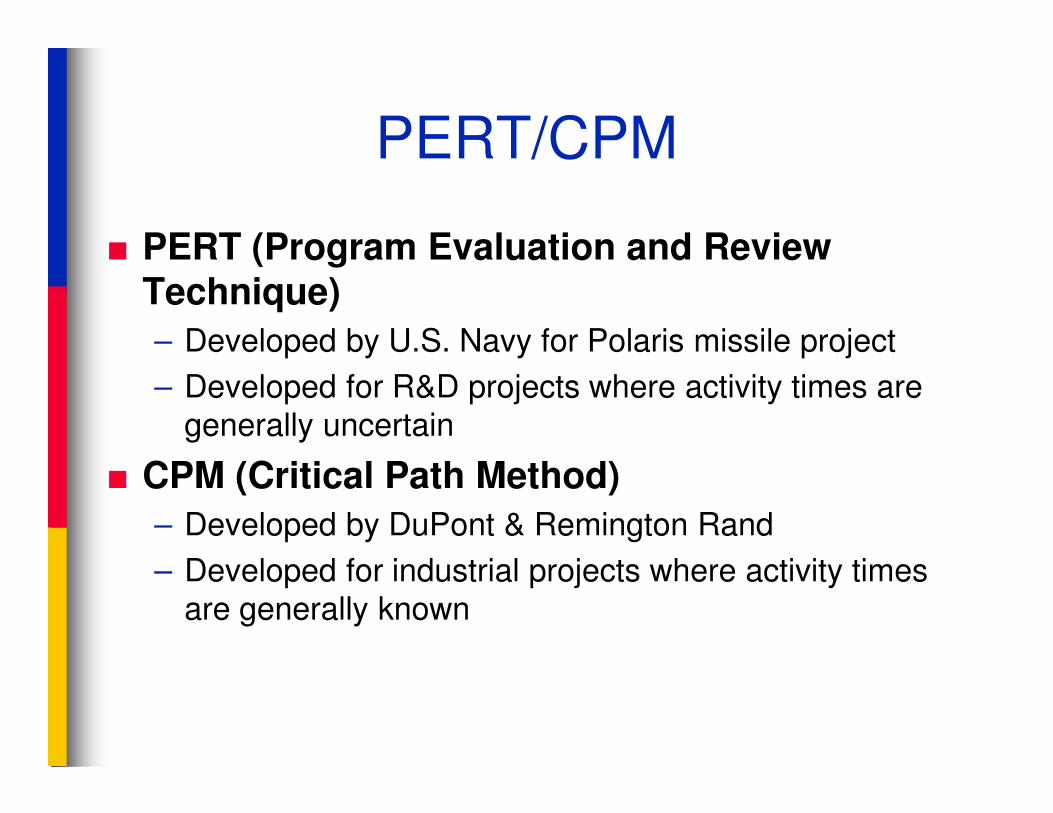
PERT/CPM
■ PERT (Program Evaluation and Review Technique)
– Developed by U.S. Navy for Polaris missile project
– Developed for R&D projects where activity times are
generally uncertain
■ CPM (Critical Path Method)
– Developed by DuPont & Remington Rand
– Developed for industrial projects where activity times
are generally known
PERT/CPM
■ CPM and PERT have been used to plan, schedule, and control a wide variety of projects:
– R&D of new products and processes– R&D of new products and processes
– Construction of buildings and highways
– Maintenance of large and complex equipment
– Design and installation of new systems
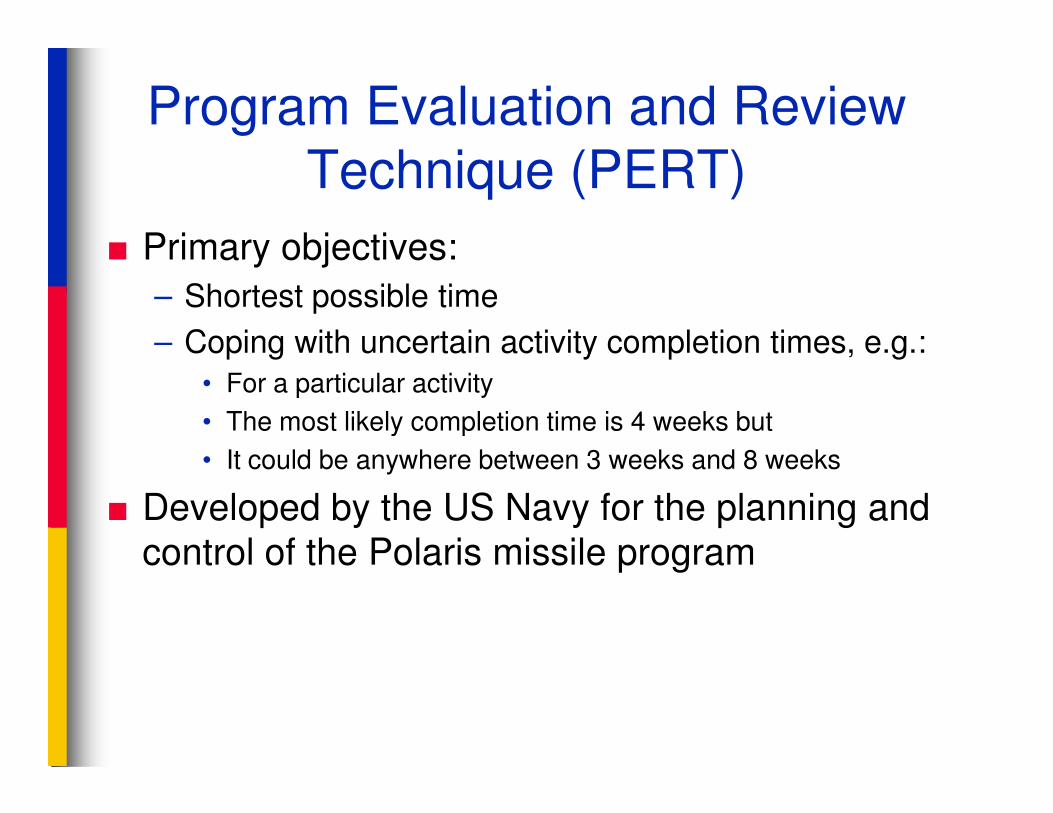
Program Evaluation and Review
Technique (PERT)
■ Primary objectives:
– Shortest possible time
– Coping with uncertain activity completion times, e.g.:
• For a particular activity
• The most likely completion time is 4 weeks but • The most likely completion time is 4 weeks but
• It could be anywhere between 3 weeks and 8 weeks
■ Developed by the US Navy for the planning and
control of the Polaris missile program
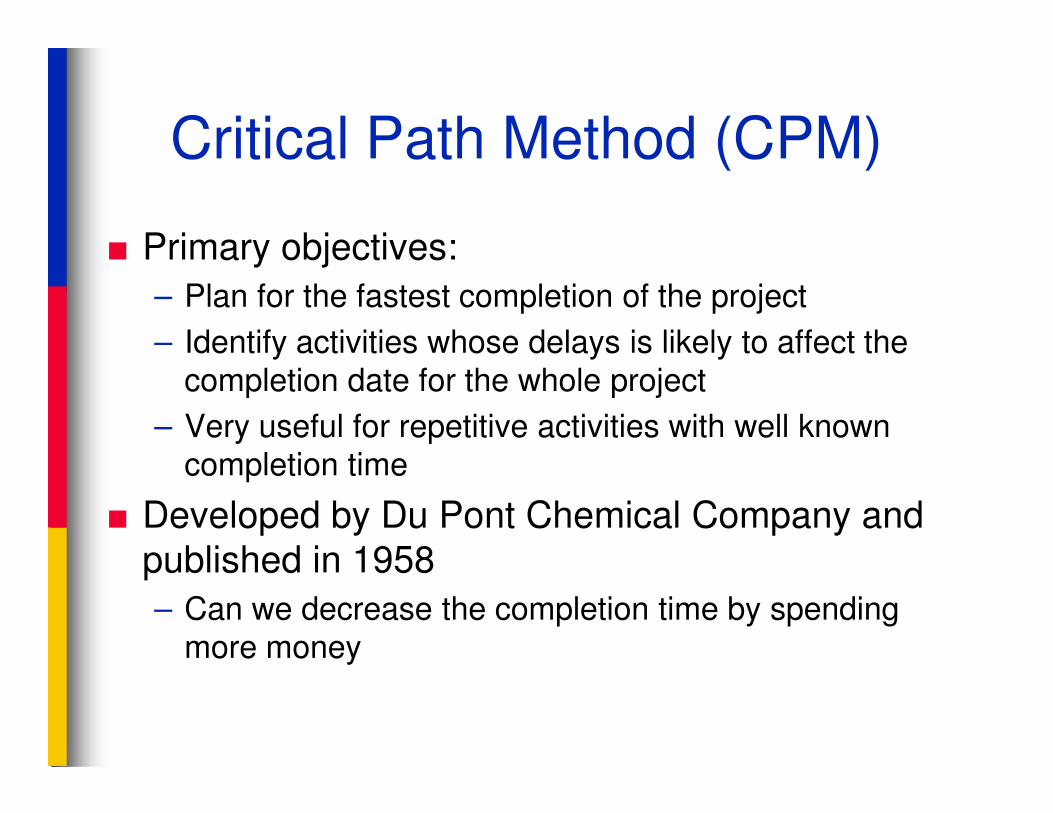
Critical Path Method (CPM)
■ Primary objectives:
– Plan for the fastest completion of the project
– Identify activities whose delays is likely to affect the
completion date for the whole project
– Very useful for repetitive activities with well known
completion time
■ Developed by Du Pont Chemical Company and
published in 1958
– Can we decrease the completion time by spending
more money
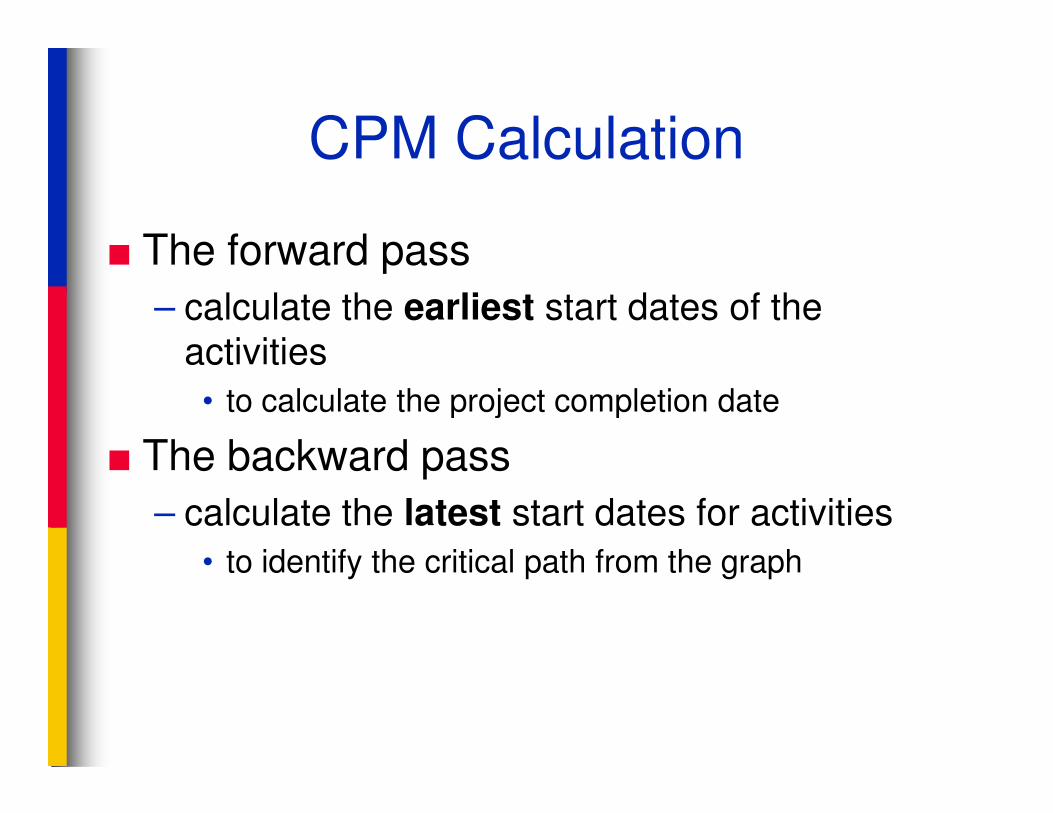
CPM Calculation
■ The forward pass
– calculate the earliest start dates of the
activities
• to calculate the project completion date• to calculate the project completion date
■ The backward pass
– calculate the latest start dates for activities
• to identify the critical path from the graph
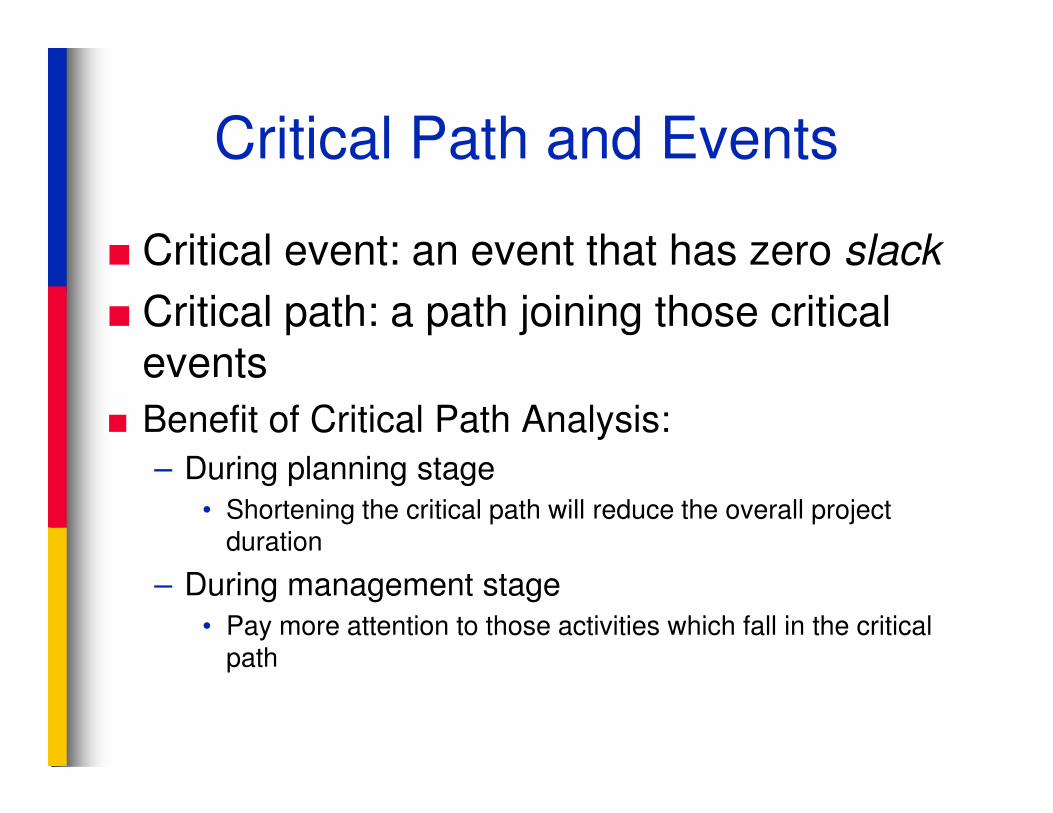
Critical Path and Events
■ Critical event: an event that has zero slack
■ Critical path: a path joining those critical events
■ Benefit of Critical Path Analysis:■ Benefit of Critical Path Analysis:
– During planning stage
• Shortening the critical path will reduce the overall project duration
– During management stage
• Pay more attention to those activities which fall in the critical path
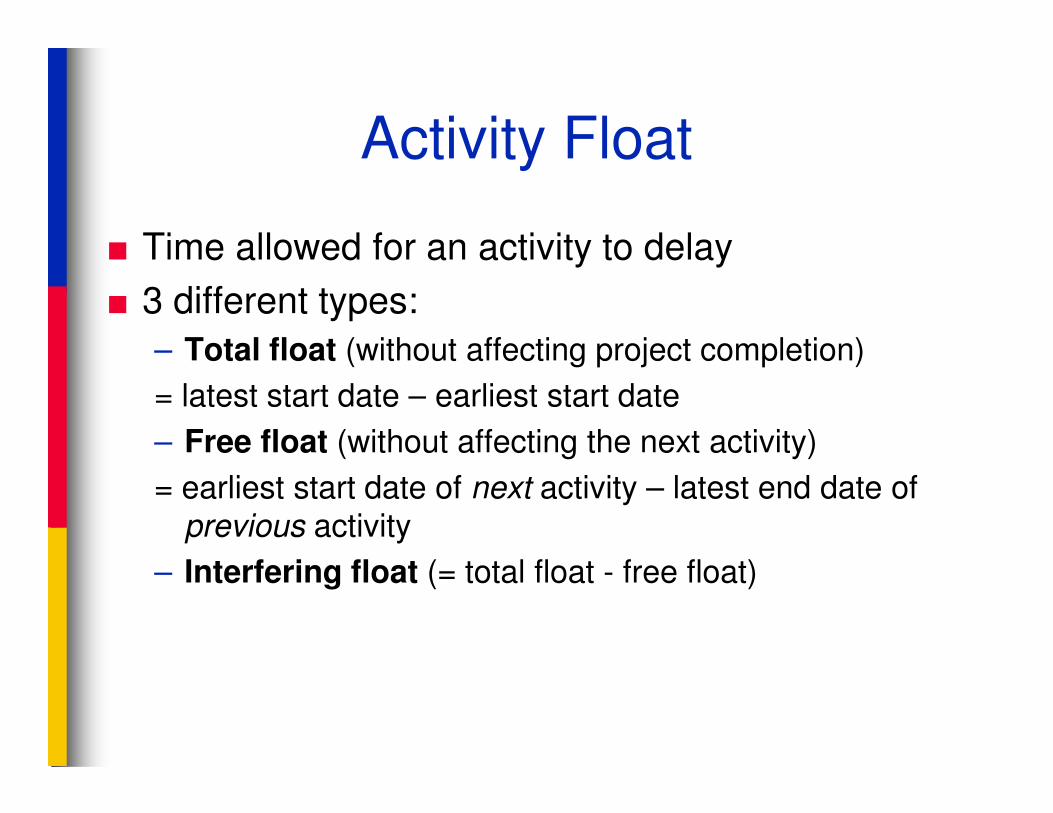
Activity Float
■ Time allowed for an activity to delay
■ 3 different types:
– Total float (without affecting project completion)
= latest start date – earliest start date= latest start date – earliest start date
– Free float (without affecting the next activity)
= earliest start date of next activity – latest end date of
previous activity
– Interfering float (= total float - free float)
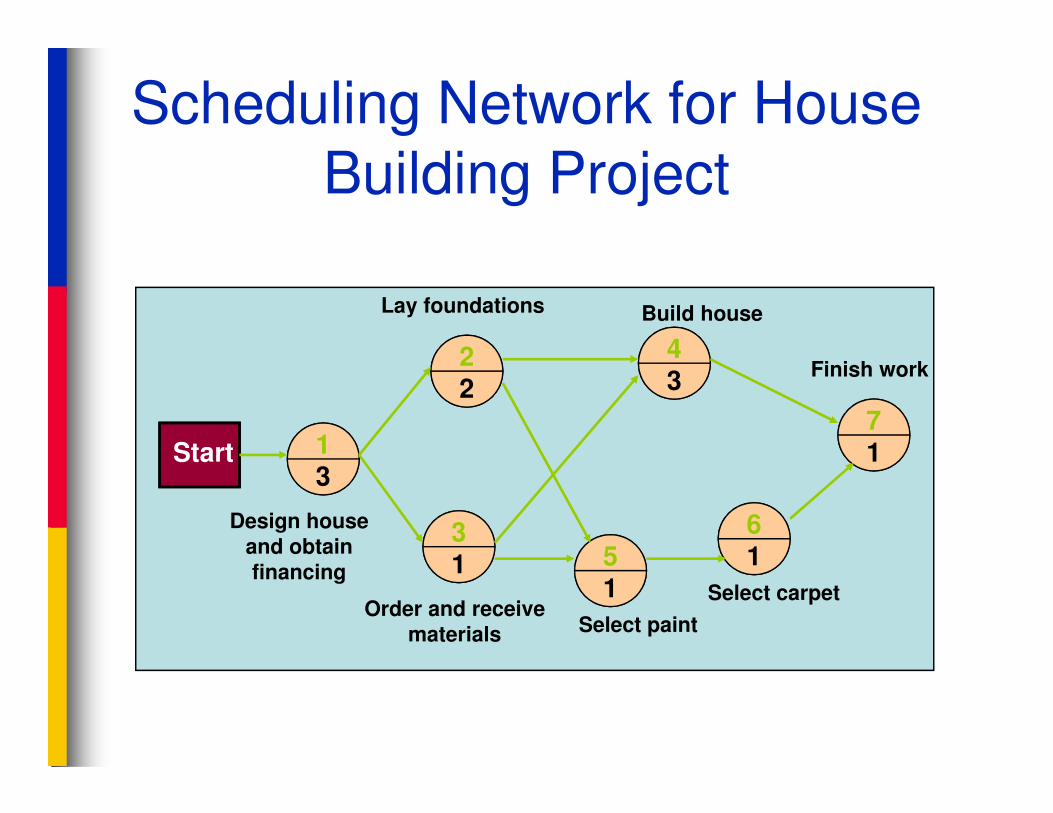
Scheduling Network for House
Building Project
22
43
7
Lay foundations Build house
Finish work
13
31 5
1
61
71Start
Design house and obtain financing
Order and receive materials Select paint
Select carpet
13
22
43
3 6
71Start
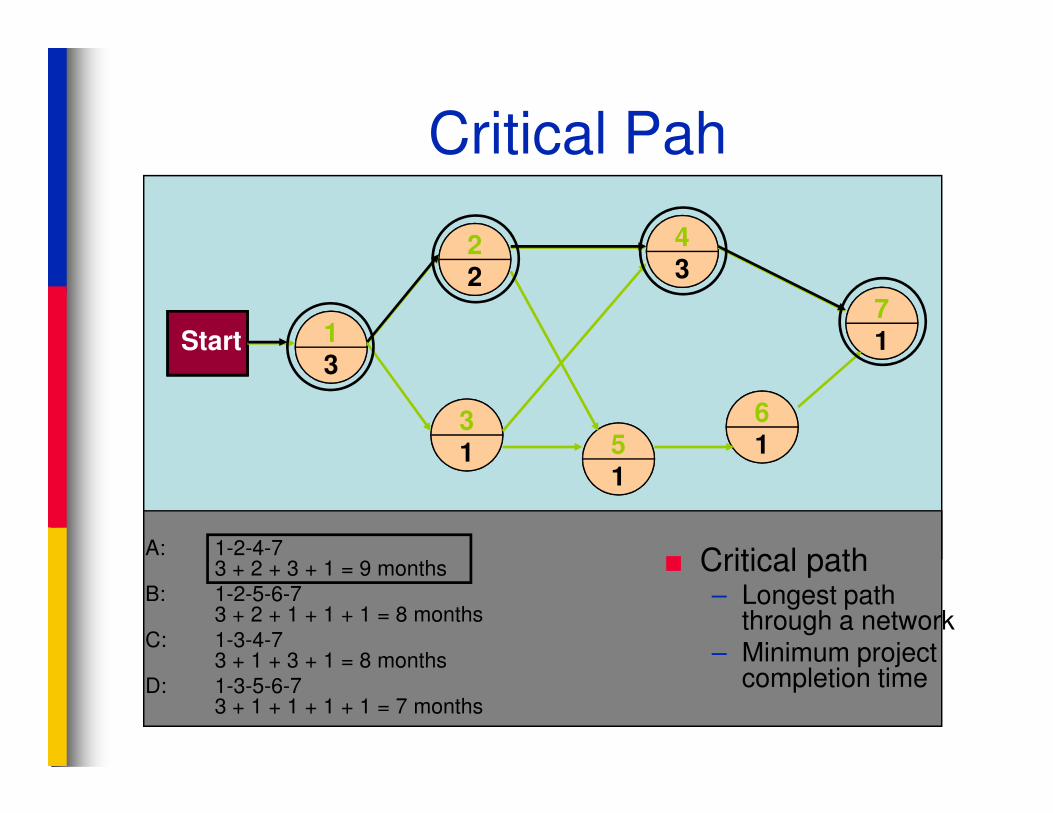
Critical Pah
31 5
1
61
■ Critical path– Longest path
through a network– Minimum project
completion time
A: 1-2-4-73 + 2 + 3 + 1 = 9 months
B: 1-2-5-6-73 + 2 + 1 + 1 + 1 = 8 months
C: 1-3-4-73 + 1 + 3 + 1 = 8 months
D: 1-3-5-6-73 + 1 + 1 + 1 + 1 = 7 months
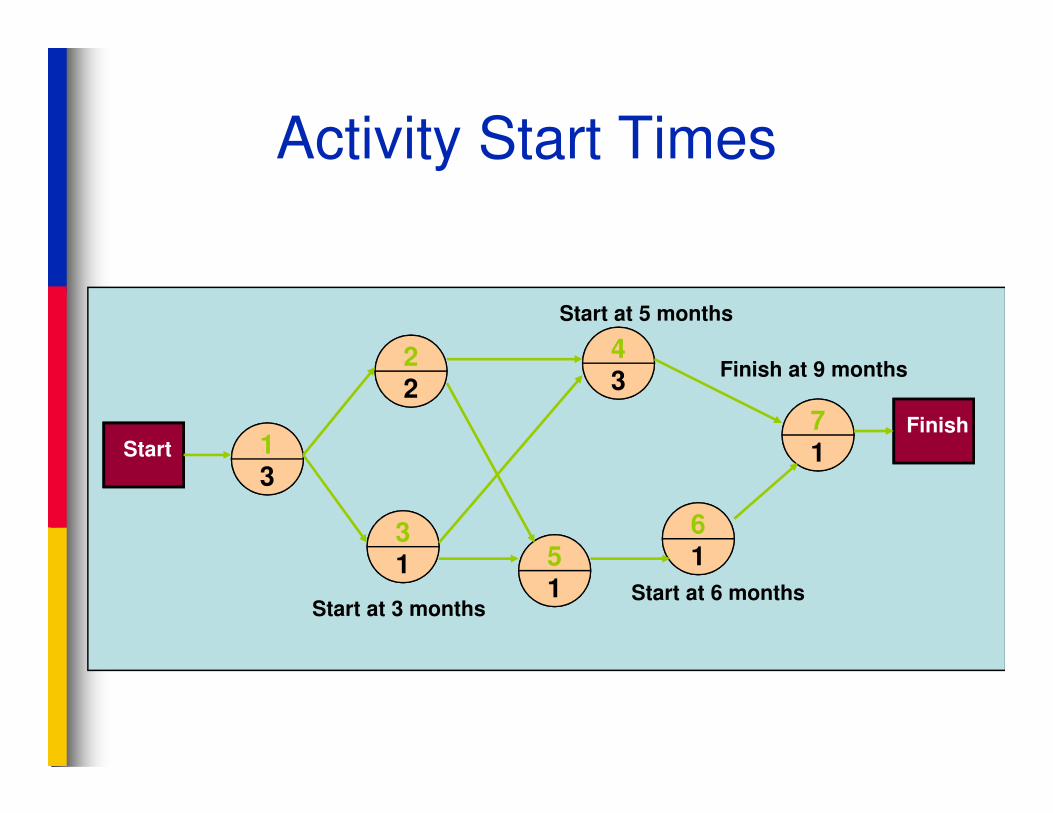
Activity Start Times
22
43
7
Start at 5 months
Finish at 9 months
13
31 5
1
61
71Start
Start at 3 monthsStart at 6 months
Finish
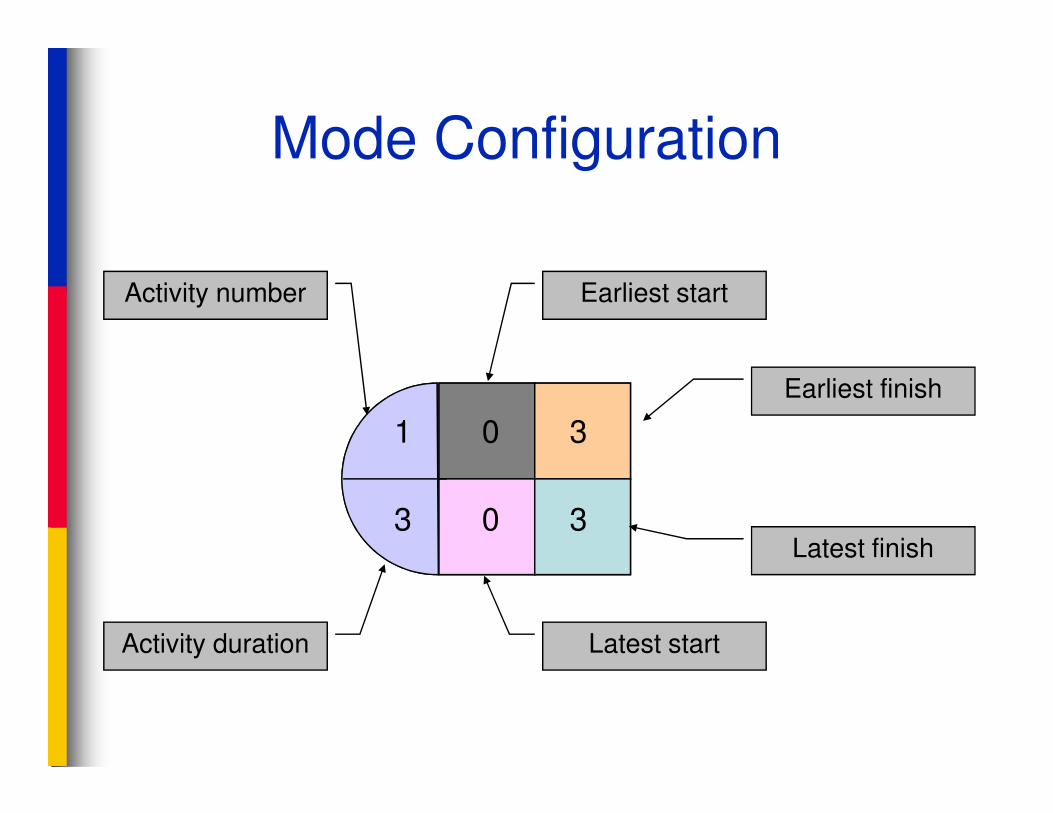
Mode Configuration
Activity number Earliest start
Earliest finish
1 0 3
3 0 3
Activity duration Latest start
Latest finish
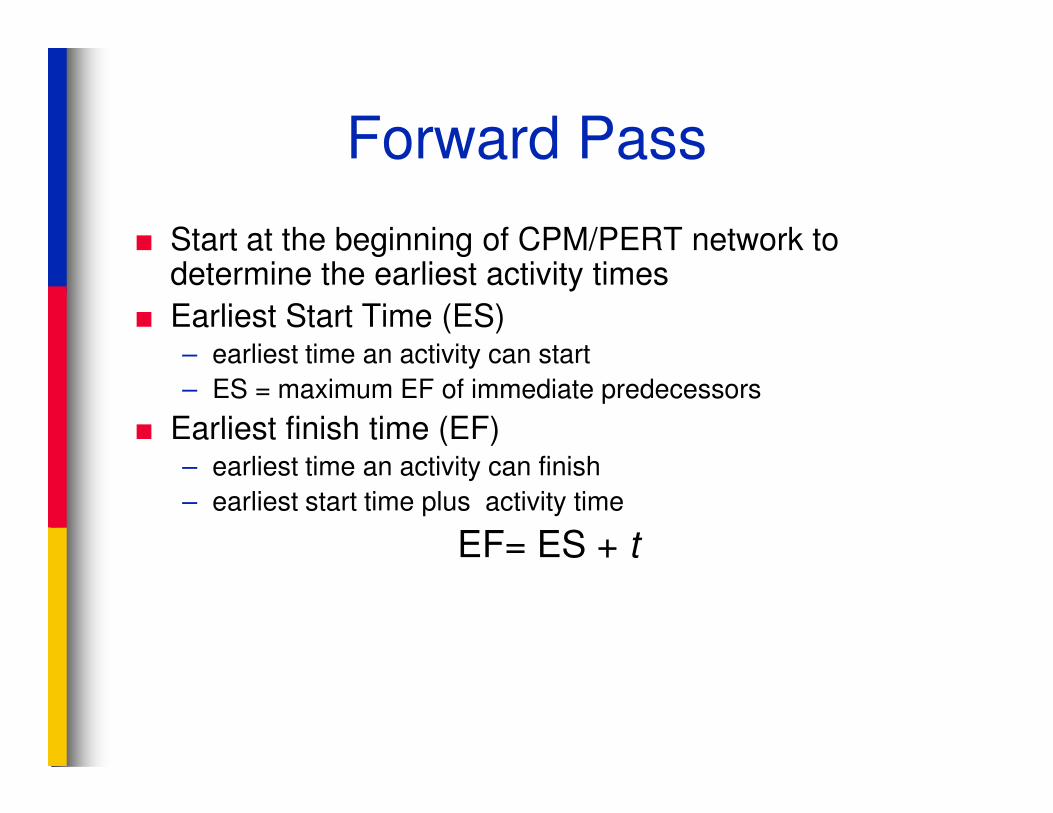
Forward Pass
■ Start at the beginning of CPM/PERT network to determine the earliest activity times
■ Earliest Start Time (ES)– earliest time an activity can start
– ES = maximum EF of immediate predecessors
■ Earliest finish time (EF)– earliest time an activity can finish
– earliest start time plus activity time
EF= ES + t
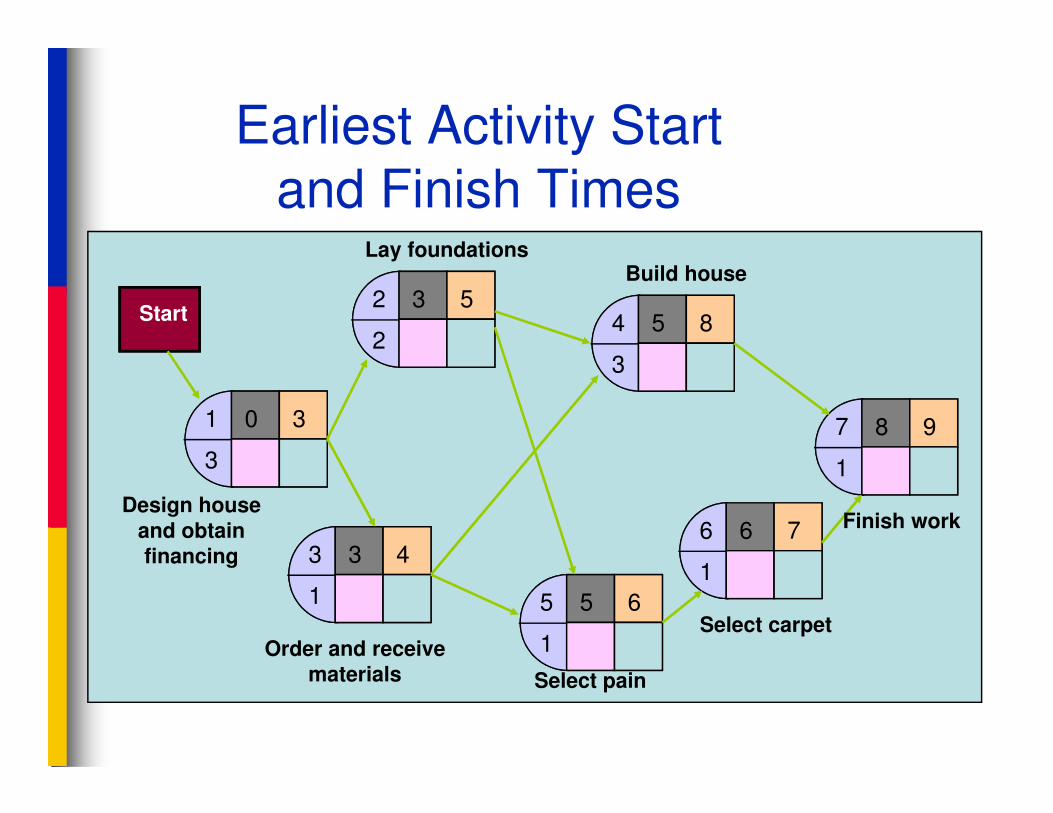
Earliest Activity Start
and Finish Times
1 0 3
2 3 5
24 5 8
3
Start
Lay foundationsBuild house
1 0 3
3
3 3 4
1 5 5 6
1
6 6 7
1
7 8 9
1
Design house and obtain financing
Select pain
Select carpet
Finish work
Order and receive materials
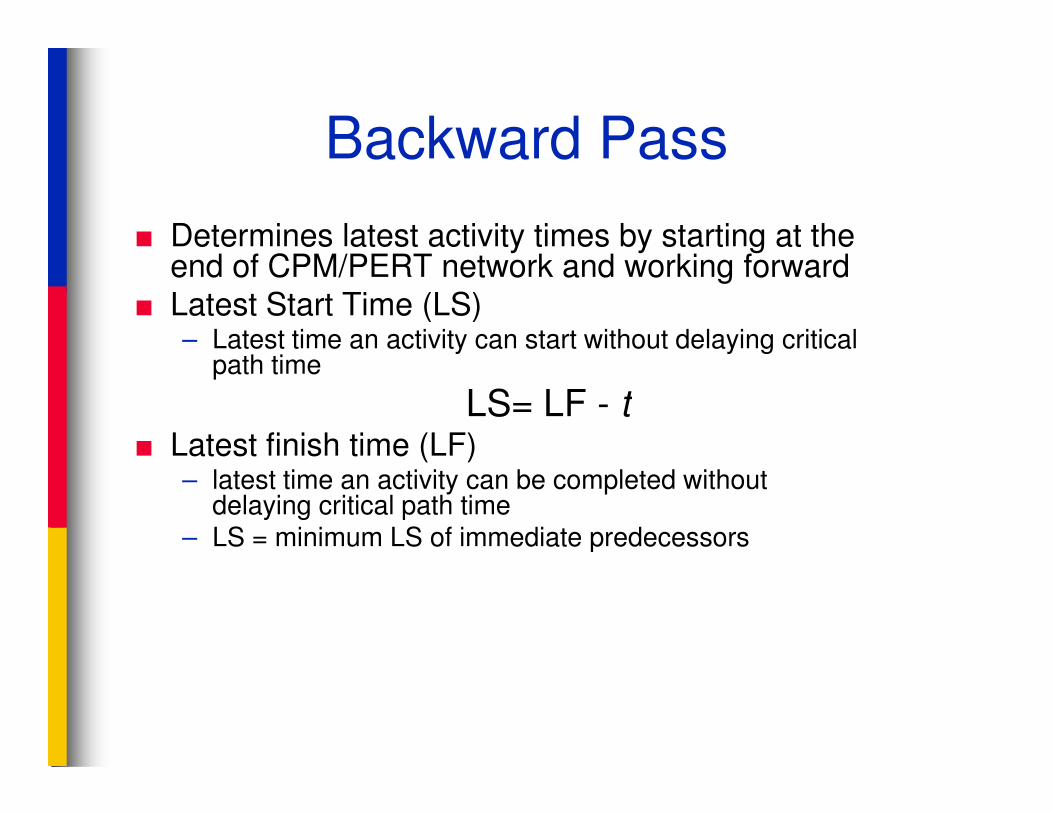
Backward Pass
■ Determines latest activity times by starting at the end of CPM/PERT network and working forward
■ Latest Start Time (LS)– Latest time an activity can start without delaying critical
path time
LS= LF - tLS= LF - t■ Latest finish time (LF)
– latest time an activity can be completed without delaying critical path time
– LS = minimum LS of immediate predecessors
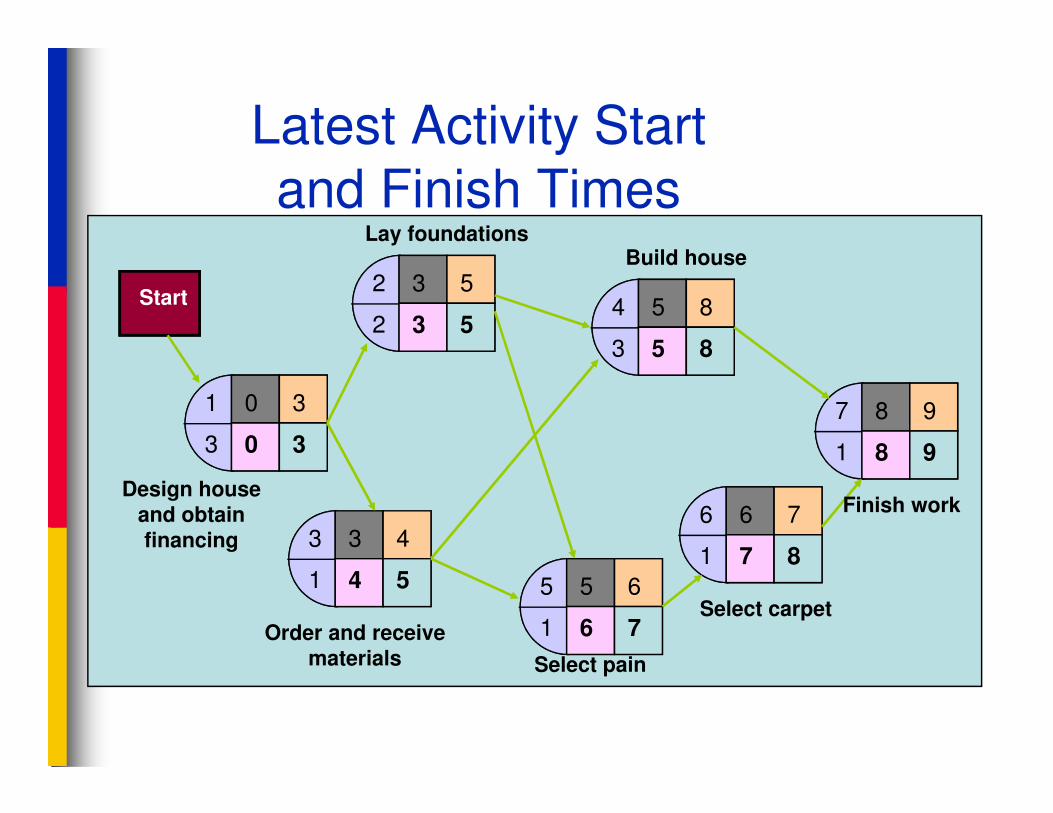
Latest Activity Start
and Finish Times
1 0 3
2 3 5
2 3 54 5 8
3 5 8
7 8 9
Start
Lay foundationsBuild house
1 0 3
3 0 3
3 3 4
1 4 5 5 5 6
1 6 7
6 6 7
1 7 8
7 8 9
1 8 9
Design house and obtain financing
Select pain
Select carpet
Finish work
Order and receive materials
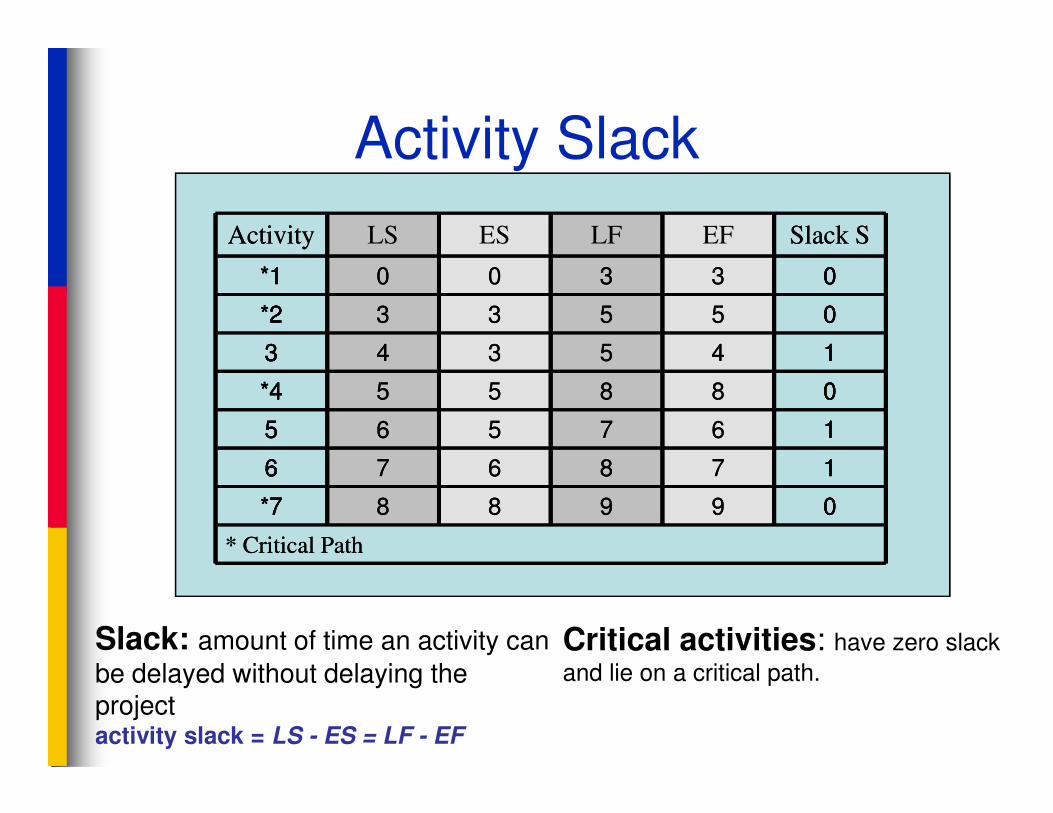
00008888888855555555*4*4*4*4
111144445555333344443333
00005555555533333333*2*2*2*2
00003333333300000000*1*1*1*1
Slack SSlack SEFEFLFLFESESLSLSActivityActivity
Activity Slack
* Critical Path* Critical Path
00009999999988888888*7*7*7*7
111177778888666677776666
111166667777555566665555
Slack: amount of time an activity can
be delayed without delaying the project activity slack = LS - ES = LF - EF
Critical activities: have zero slack
and lie on a critical path.
Probabilistic Time Estimates
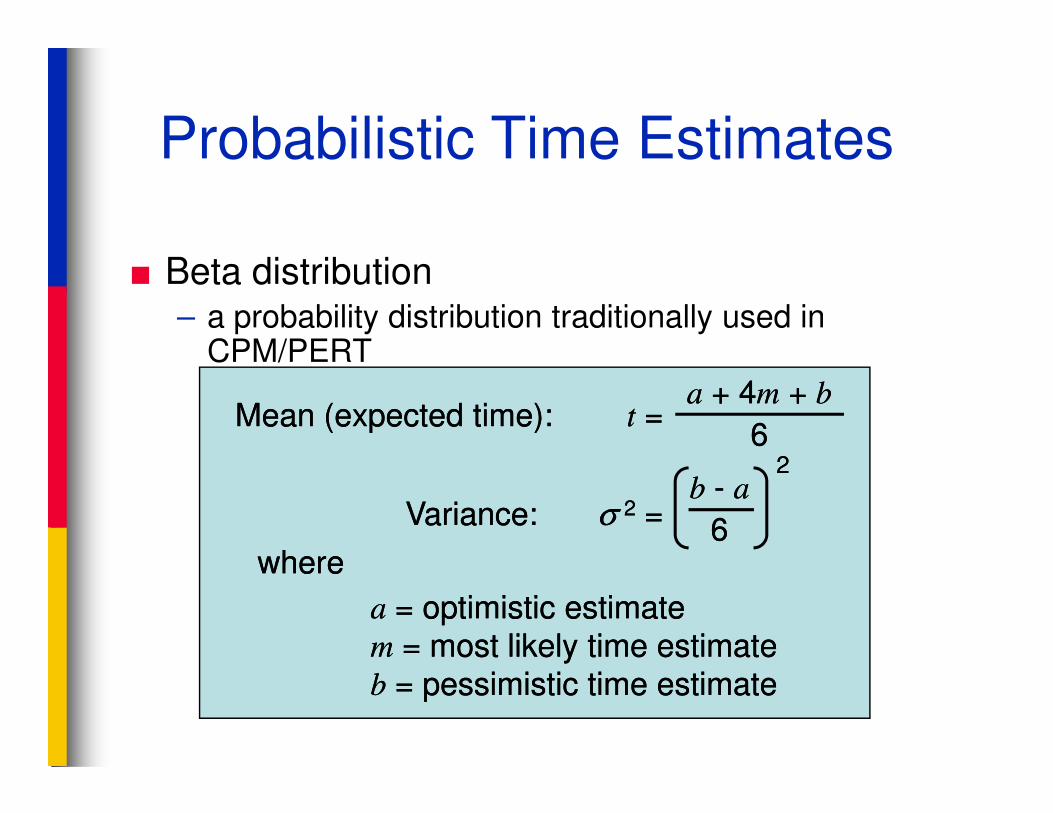
■ Beta distribution– a probability distribution traditionally used in
CPM/PERT
Mean (expected time):Mean (expected time): tt ==aa + 4+ 4mm + + bb
aa = optimistic estimate= optimistic estimate
mm = most likely time estimate= most likely time estimate
bb = pessimistic time estimate= pessimistic time estimate
wherewhere
Mean (expected time):Mean (expected time): tt ==aa + 4+ 4mm + + bb
66
Variance:Variance: σσ 22 ==bb -- aa
66
22
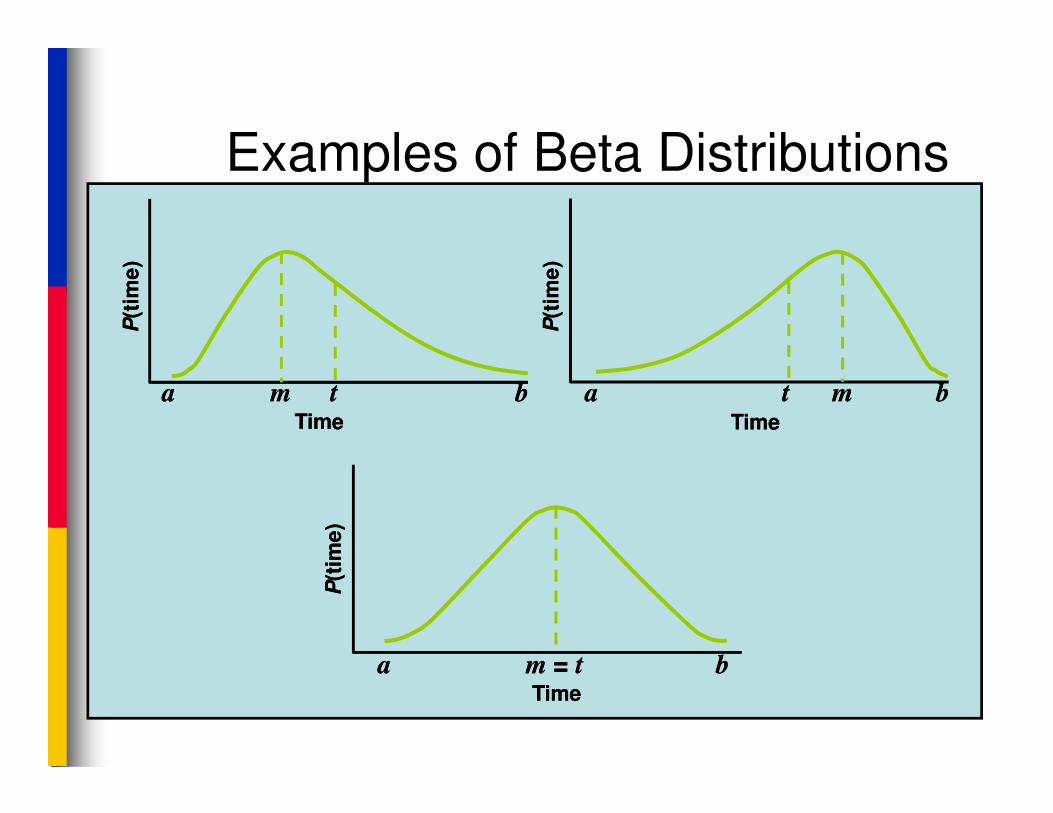
Examples of Beta Distributions
PP(t
ime
)(t
ime
)
PP(t
ime
)(t
ime
)
aa mmtt bbaa mm tt bb
PP(t
ime
)(t
ime
)
TimeTime
m m = = tt
TimeTime
TimeTime
bbaa
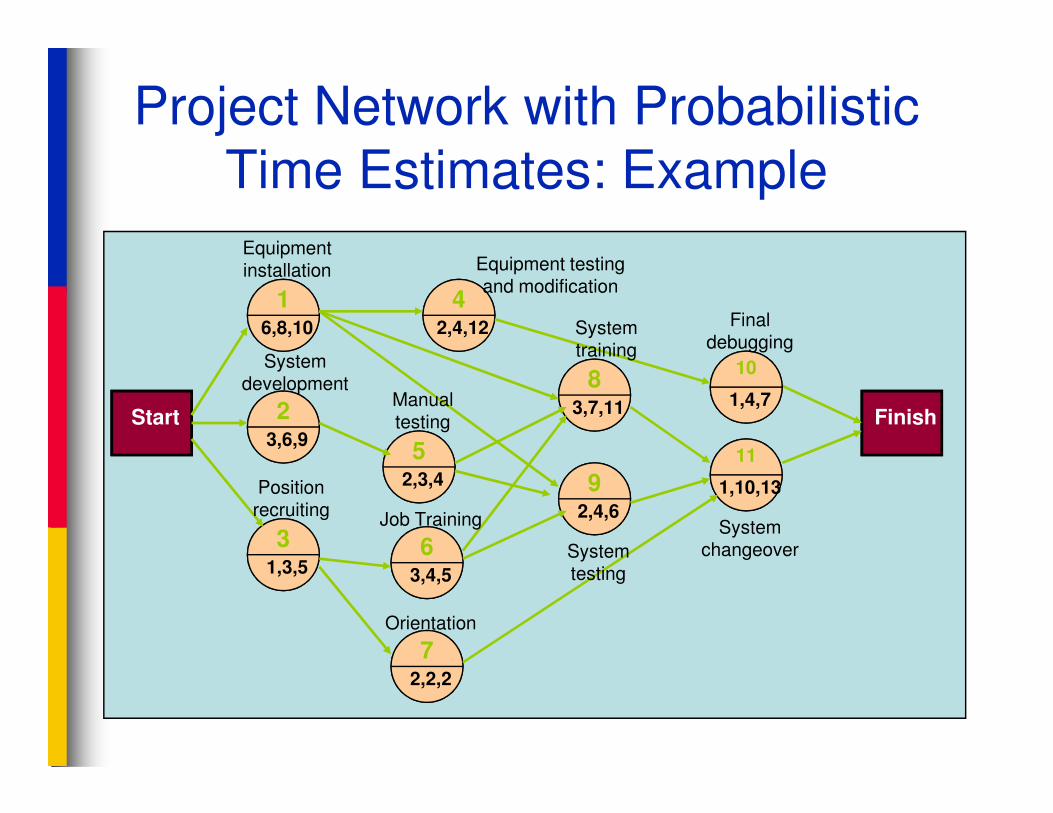
Project Network with Probabilistic
Time Estimates: Example
Start Finish2
16,8,10
42,4,12
83,7,11
10
1,4,7
Equipment installation
System development
Equipment testing and modification
Manual
System training
Final debugging
Start Finish23,6,9
31,3,5
52,3,4
63,4,5
72,2,2
3,7,11
92,4,6
1,4,7
11
1,10,13Position recruiting
Manual testing
Job Training
Orientation
System testing
System changeover
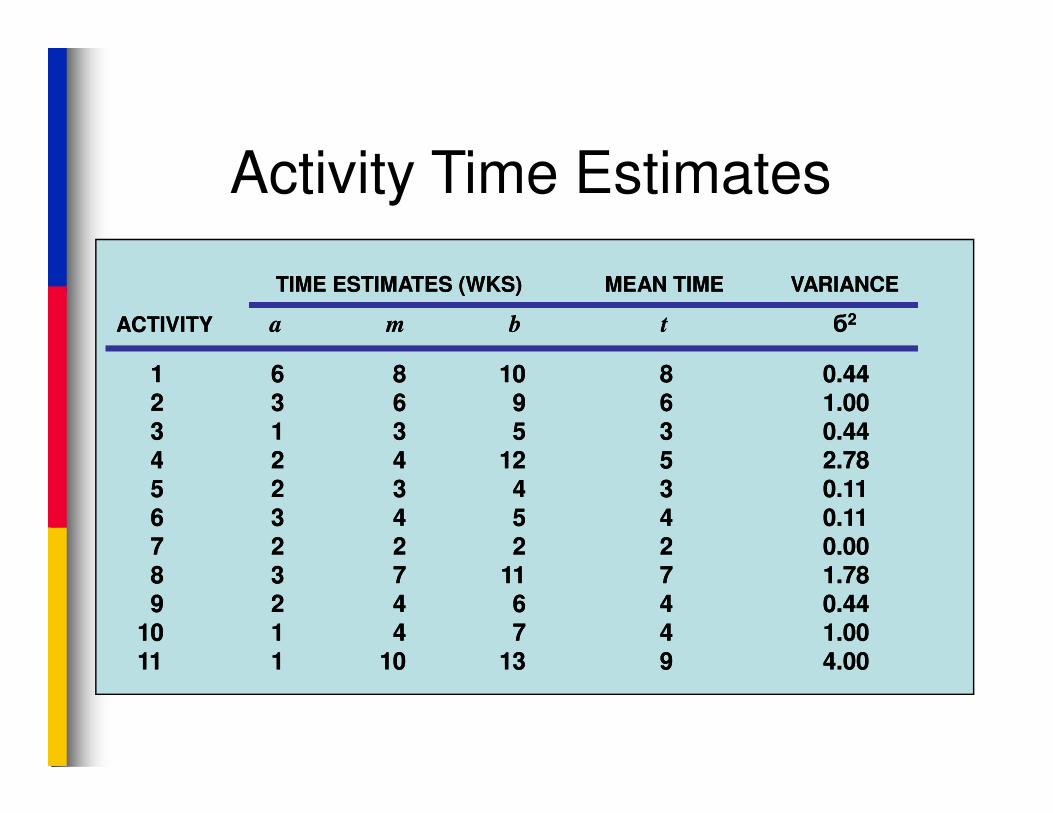
Activity Time Estimates
1 1 66 88 1010 88 0.440.4422 33 66 99 66 1.001.00
TIME ESTIMATES (WKS)TIME ESTIMATES (WKS) MEAN TIMEMEAN TIME VARIANCEVARIANCE
ACTIVITYACTIVITY aa mm bb tt бб22
22 33 66 99 66 1.001.0033 11 33 55 33 0.440.4444 22 44 1212 55 2.782.7855 22 33 44 33 0.110.1166 33 44 55 44 0.110.1177 22 22 22 22 0.000.0088 33 77 1111 77 1.781.7899 22 44 66 44 0.440.44
1010 11 44 77 44 1.001.001111 11 1010 1313 99 4.004.00
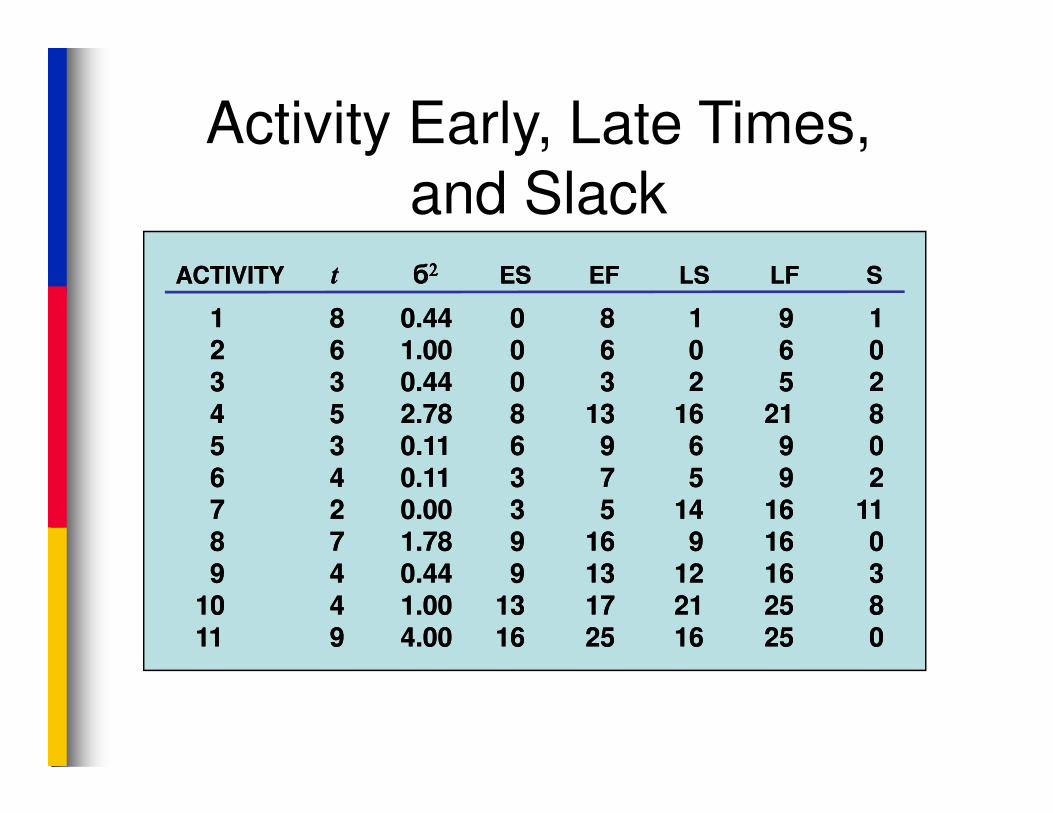
Activity Early, Late Times,
and SlackACTIVITYACTIVITY tt бб22222222 ESES EFEF LSLS LFLF SS
11 88 0.440.44 00 88 11 99 1122 66 1.001.00 00 66 00 66 0033 33 0.440.44 00 33 22 55 224 4 55 2.782.78 88 1313 1616 2121 884 4 55 2.782.78 88 1313 1616 2121 885 5 33 0.110.11 66 99 66 99 0066 44 0.110.11 33 77 55 99 2277 22 0.000.00 33 55 1414 1616 111188 77 1.781.78 99 1616 99 1616 0099 44 0.440.44 99 1313 1212 1616 33
1010 44 1.001.00 1313 1717 2121 2525 881111 99 4.004.00 1616 2525 1616 2525 00
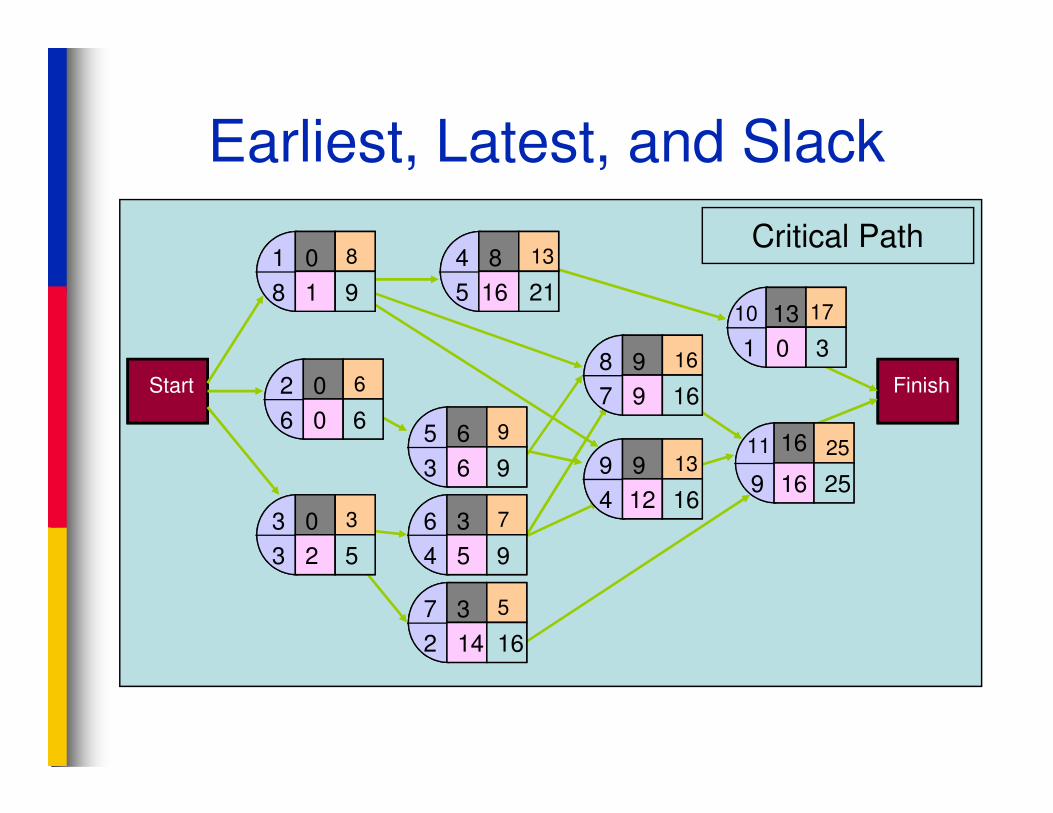
Start Finish
1 0 8
8 1 9
4 8 13
5 16 2110 13 17
1 0 3
2 0 6
6 0 6
8 9 16
7 9 16
Critical Path
Earliest, Latest, and Slack
3 0 3
3 2 5
6 3 7
4 5 9
7 3 5
2 14 16
9 9 13
4 12 16
6 0 65 6 9
3 6 9
7 9 16
11 16 25
9 16 25
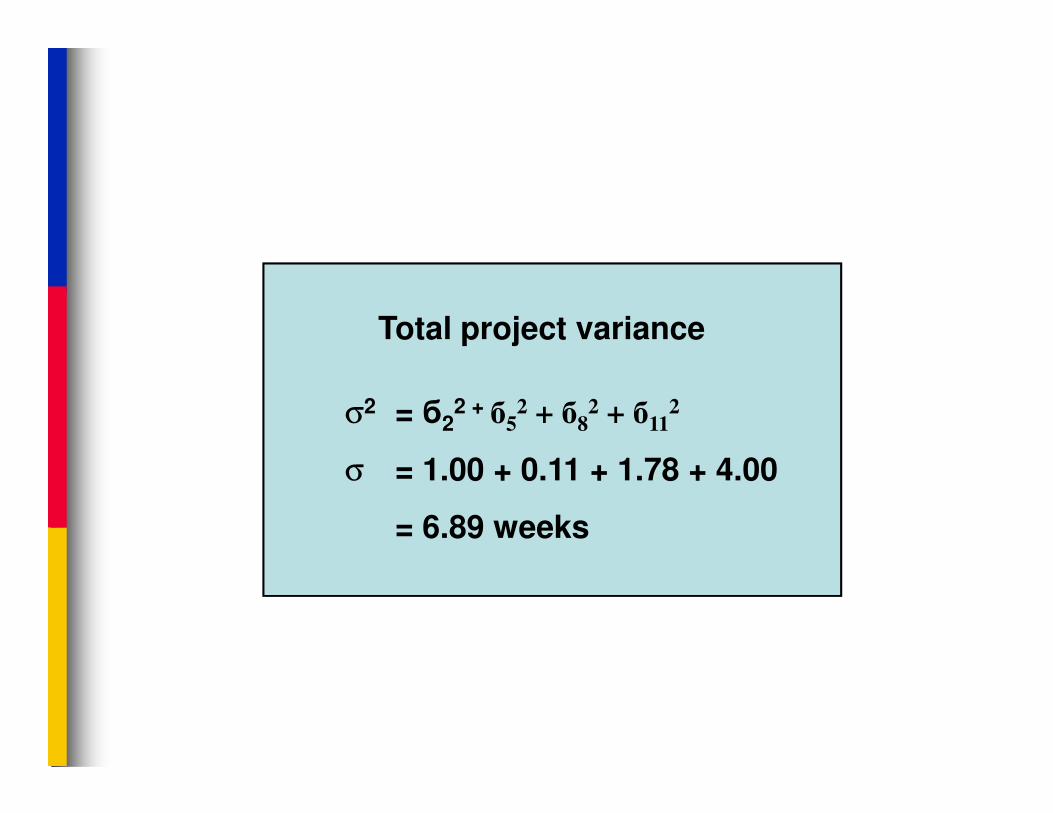
σ2 = б 2 + б 2 + б 2 + б 2
Total project variance
σ2 = б22 + б
52 + б
82 + б
112
σ = 1.00 + 0.11 + 1.78 + 4.00
= 6.89 weeks
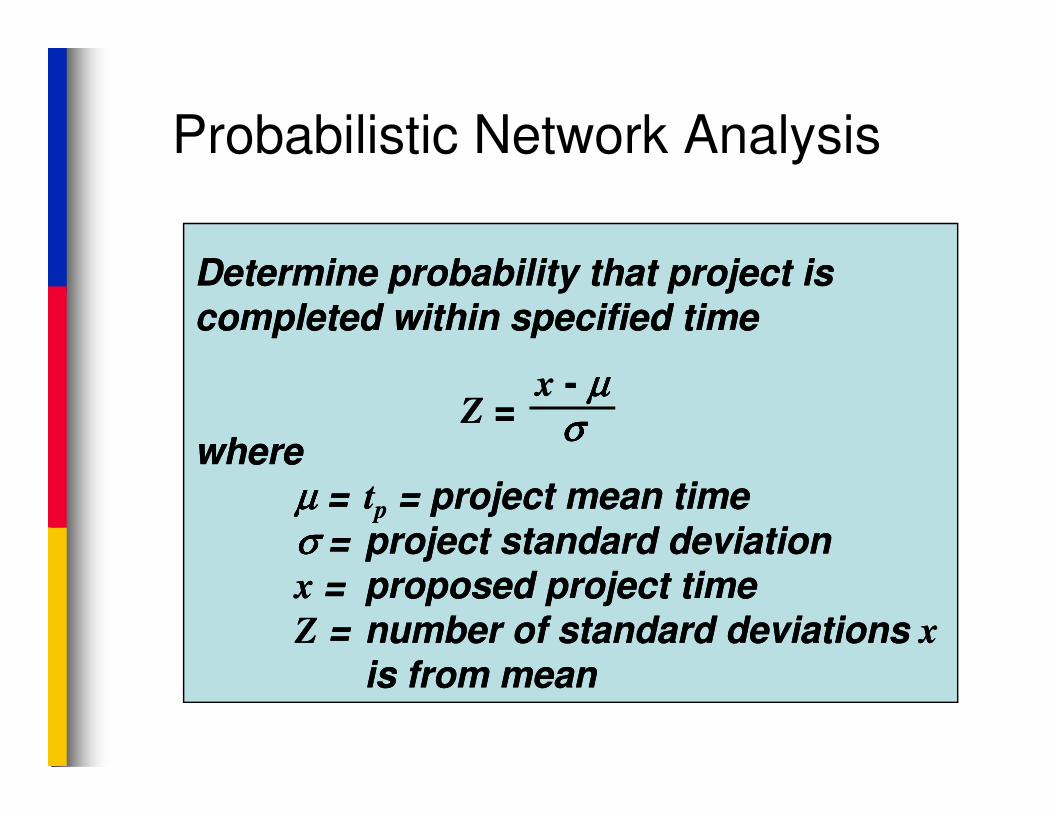
Probabilistic Network Analysis
Determine probability that project is Determine probability that project is
completed within specified timecompleted within specified time
ZZ ==xx -- µµµµµµµµ
σσσσσσσσwherewhere
µµµµµµµµ == ttpp = project mean time= project mean time
σσσσσσσσ == project standard deviationproject standard deviationx x == proposed project timeproposed project time
ZZ == number of standard deviations number of standard deviations xx
is from meanis from mean
ZZ == σσσσσσσσ
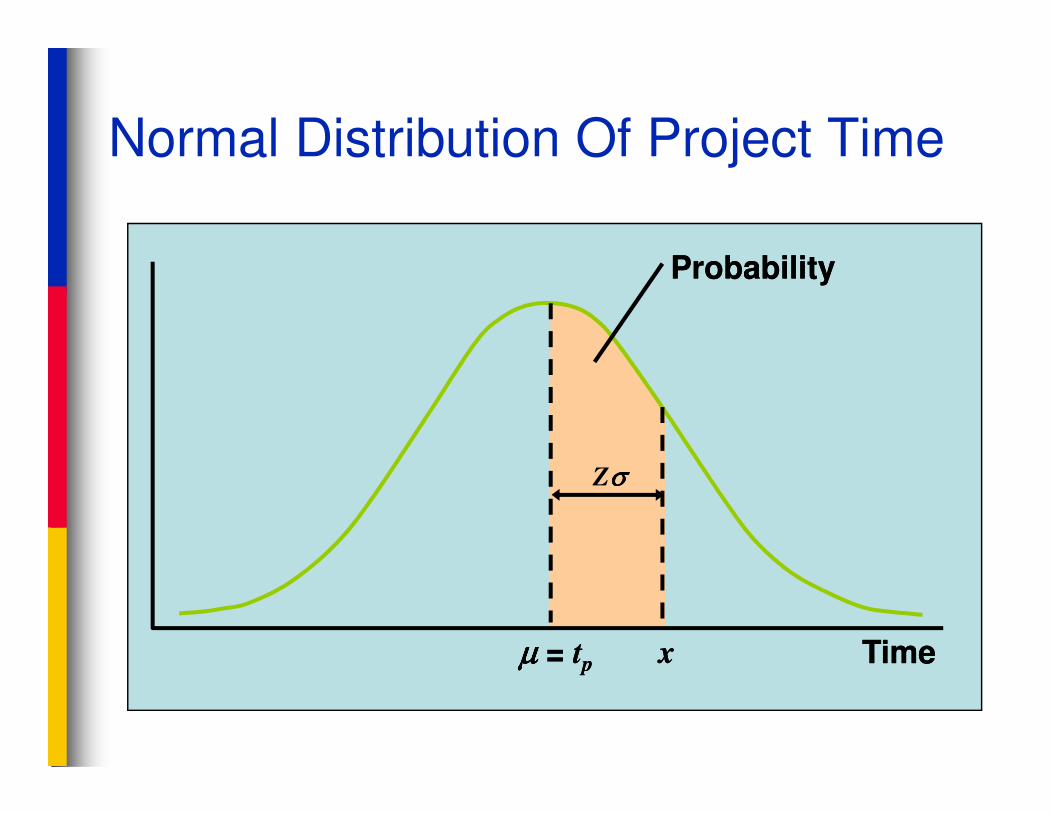
Normal Distribution Of Project Time
ProbabilityProbability
µµµµµµµµ = = ttpp TimeTimexx
Zσσσσ
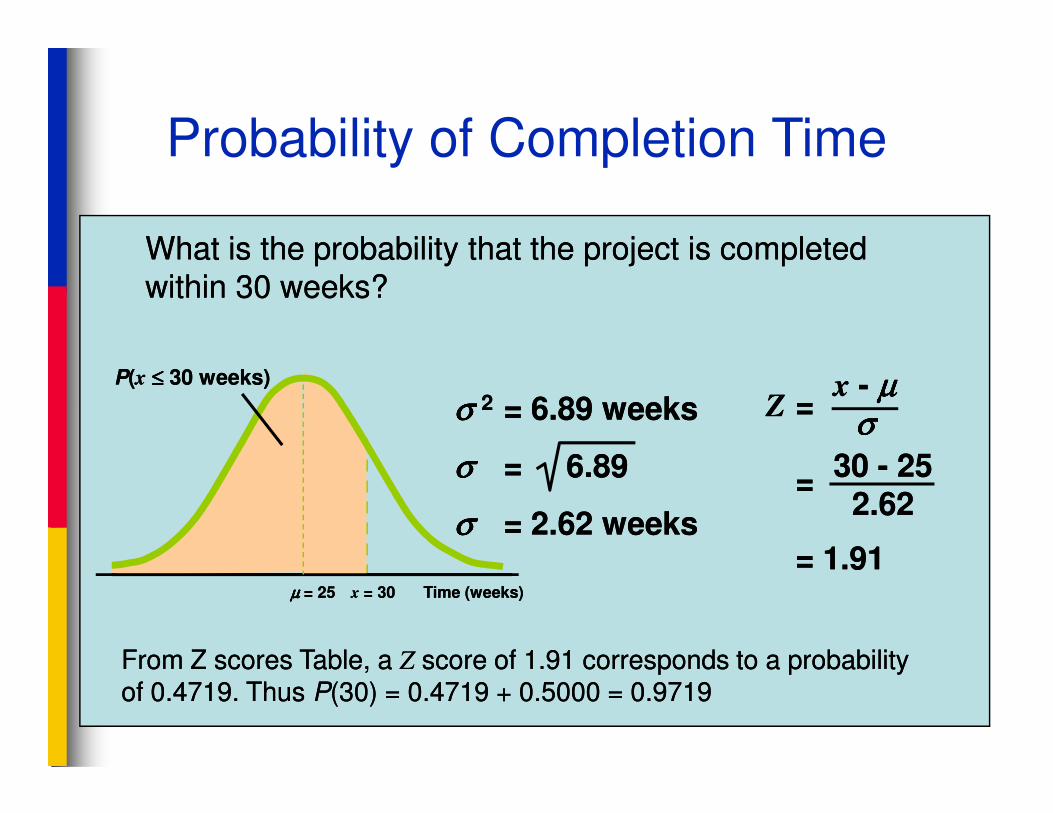
Probability of Completion Time
What is the probability that the project is completed What is the probability that the project is completed
within 30 weeks?within 30 weeks?
σσσσσσσσ 22 = 6.89 weeks= 6.89 weeks ZZ ==xx -- µµµµµµµµ
σσσσσσσσ
PP((xx ≤≤≤≤≤≤≤≤ 30 weeks)30 weeks)
σσσσσσσσ 22 = 6.89 weeks= 6.89 weeks
σσσσσσσσ = 6.89= 6.89
σσσσσσσσ = 2.62 weeks= 2.62 weeks
ZZ ==
==
= 1.91= 1.91
σσσσσσσσ
30 30 -- 25252.622.62
From Z scores Table, a From Z scores Table, a ZZ score of 1.91 corresponds to a probability score of 1.91 corresponds to a probability
of 0.4719. Thus of 0.4719. Thus PP(30) = 0.4719 + 0.5000 = 0.9719(30) = 0.4719 + 0.5000 = 0.9719
µµµµµµµµ = 25= 25 Time (weeks)Time (weeks)xx = 30= 30
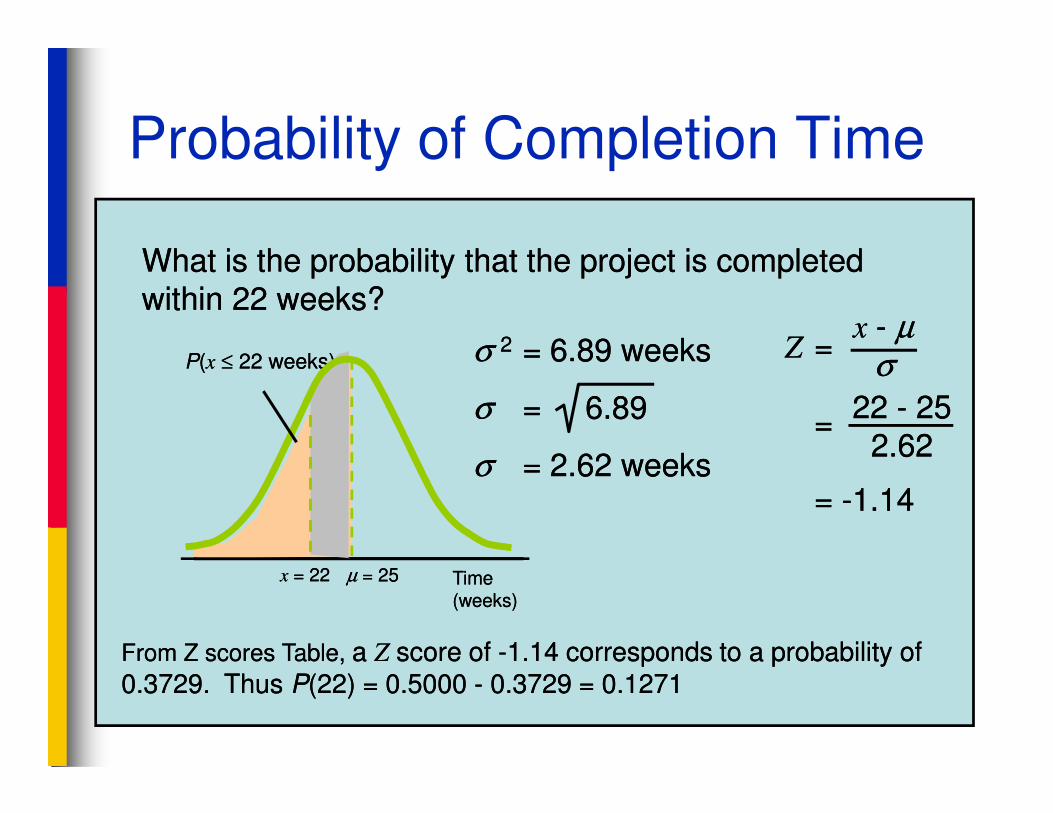
PP((xx ≤≤ 22 weeks)22 weeks)
What is the probability that the project is completed What is the probability that the project is completed
within 22 weeks?within 22 weeks?
σσ 22 = 6.89 weeks= 6.89 weeks
σσ = 6.89= 6.89
ZZ ==
==
xx -- µµ
σσ
22 22 -- 2525
Probability of Completion Time
µµ = 25= 25 Time Time (weeks)(weeks)
xx = 22= 22
σσ = 6.89= 6.89
σσ = 2.62 weeks= 2.62 weeks
==
= = --1.141.14
22 22 -- 2525
2.622.62
From Z scores Table,From Z scores Table, a a ZZ score of score of --1.14 corresponds to a probability of 1.14 corresponds to a probability of
0.3729. Thus 0.3729. Thus PP(22) = 0.5000 (22) = 0.5000 -- 0.3729 = 0.12710.3729 = 0.1271
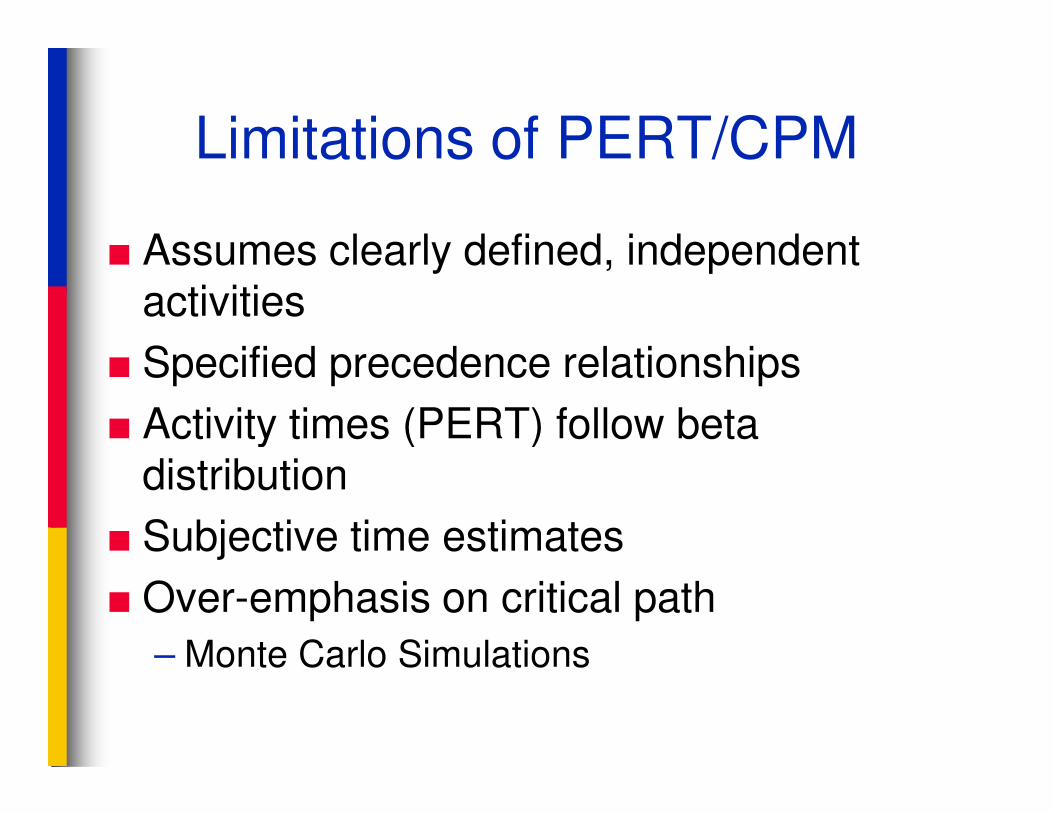
Limitations of PERT/CPM
■ Assumes clearly defined, independent activities
■ Specified precedence relationships
■ Activity times (PERT) follow beta ■ Activity times (PERT) follow beta distribution
■ Subjective time estimates
■ Over-emphasis on critical path
– Monte Carlo Simulations
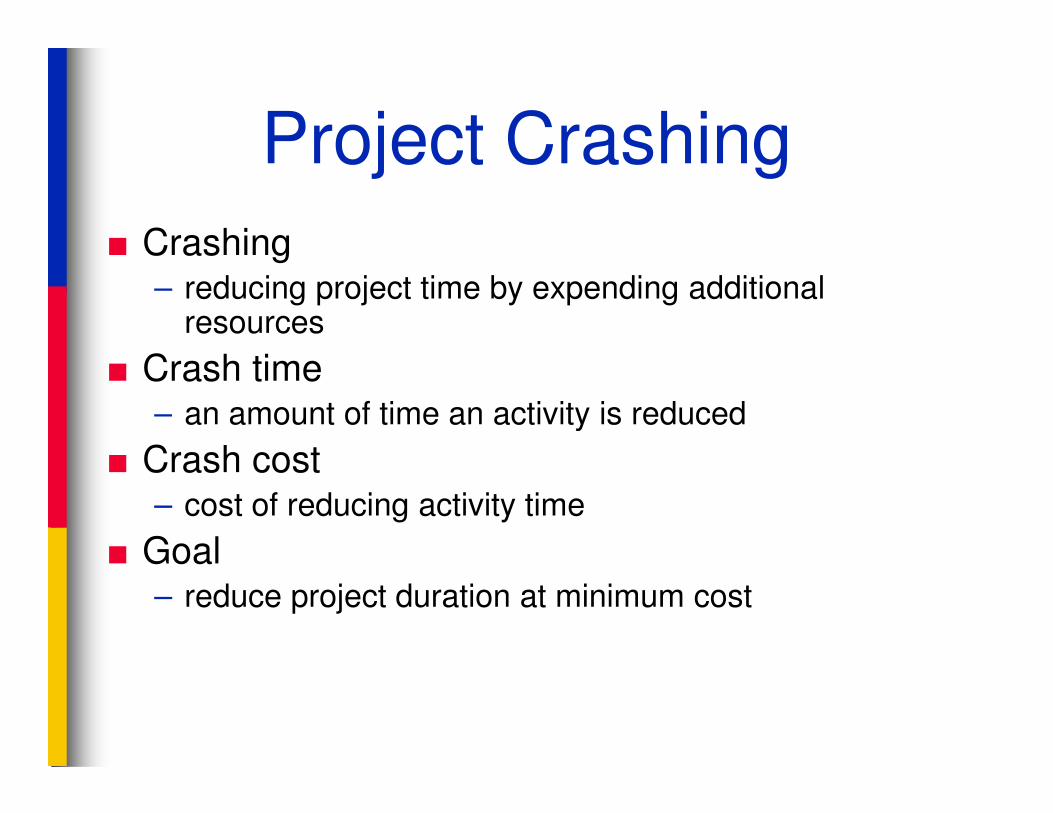
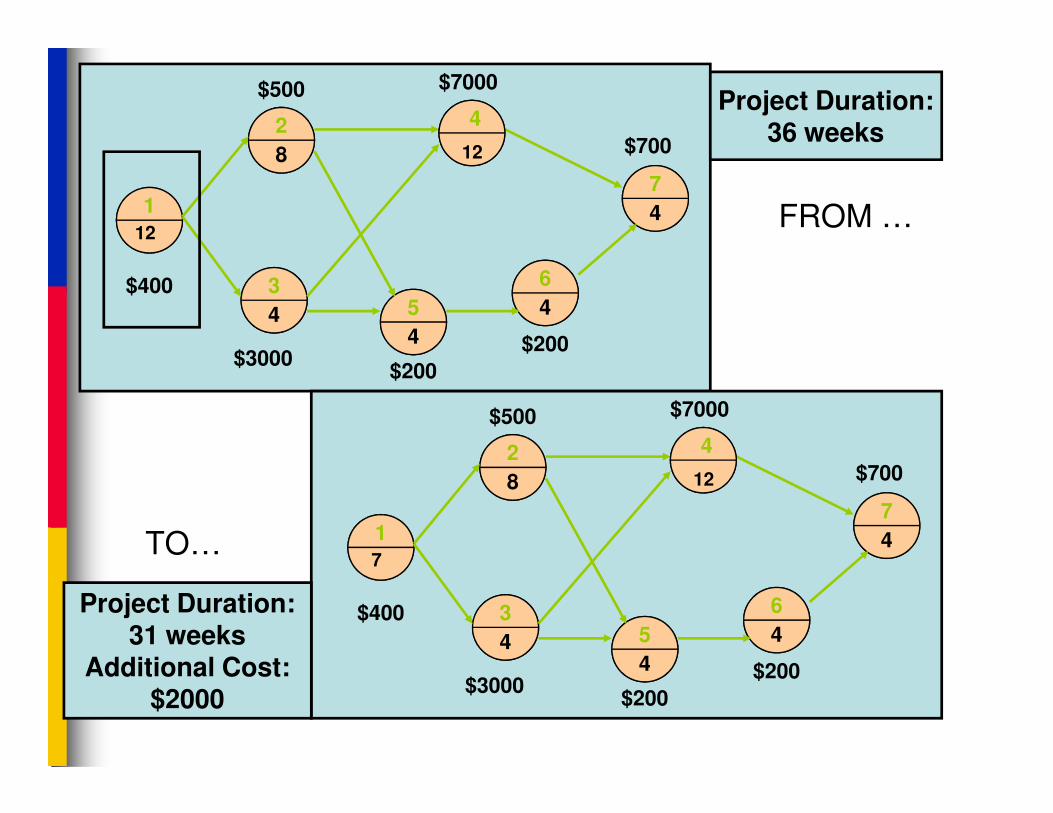
Project Crashing
■ Crashing– reducing project time by expending additional
resources
■ Crash time– an amount of time an activity is reduced– an amount of time an activity is reduced
■ Crash cost– cost of reducing activity time
■ Goal– reduce project duration at minimum cost
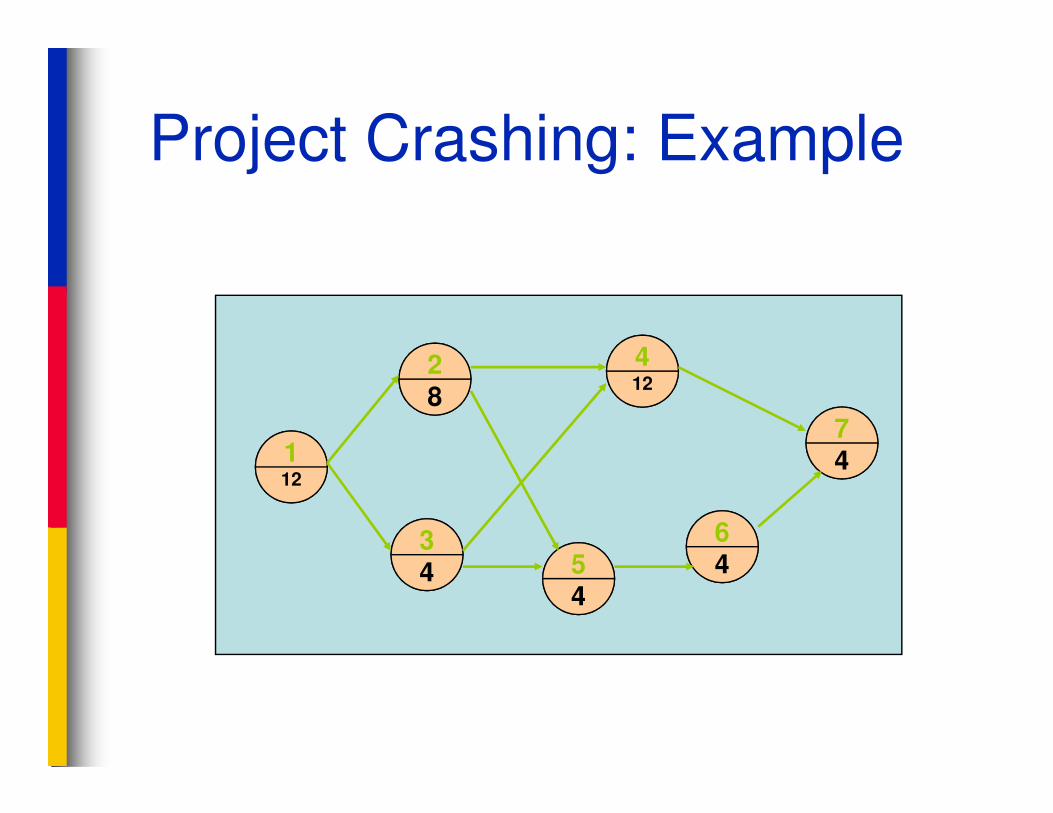
28
412
Project Crashing: Example
112
8
34 5
4
64
74
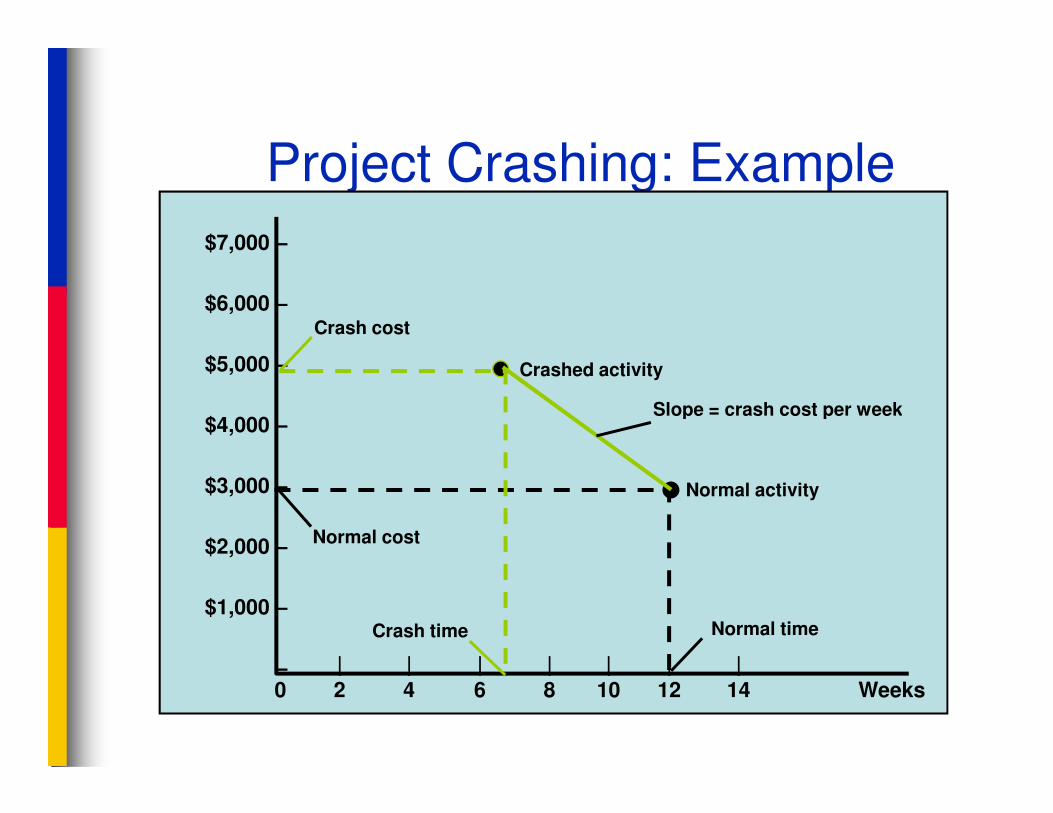
Project Crashing: Example
$7,000 –
$6,000 –
$5,000 – Crashed activity
Crash cost
Slope = crash cost per week$4,000 –
$3,000 –
$2,000 –
$1,000 –
– | | | | | | |0 2 4 6 8 10 12 14 Weeks
Normal activity
Normal time
Normal cost
Crash time
Slope = crash cost per week
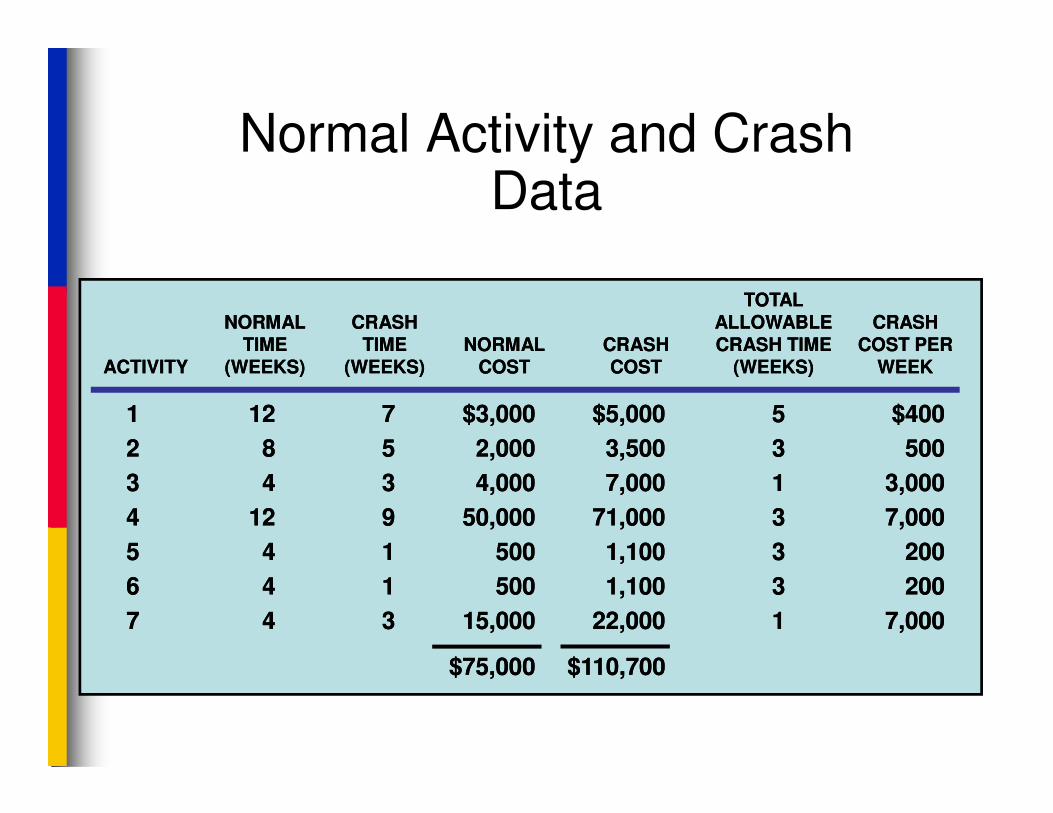
Normal Activity and Crash Data
TOTALTOTALNORMALNORMAL CRASHCRASH ALLOWABLEALLOWABLE CRASHCRASH
TIMETIME TIMETIME NORMALNORMAL CRASHCRASH CRASH TIMECRASH TIME COST PERCOST PERACTIVITYACTIVITY (WEEKS)(WEEKS) (WEEKS)(WEEKS) COSTCOST COSTCOST (WEEKS)(WEEKS) WEEKWEEK
11 1212 77 $3,000$3,000 $5,000$5,000 55 $400$40011 1212 77 $3,000$3,000 $5,000$5,000 55 $400$400
22 88 55 2,0002,000 3,5003,500 33 500500
33 44 33 4,0004,000 7,0007,000 11 3,0003,000
44 1212 99 50,00050,000 71,00071,000 33 7,0007,000
55 44 11 500500 1,1001,100 33 200200
66 44 11 500500 1,1001,100 33 200200
77 44 33 15,00015,000 22,00022,000 11 7,0007,000
$75,000$75,000 $110,700$110,700
1
12
2
8
3
4 5
4
6
4
7
4
$400
$500
$3000
$7000
$200
$200
$70012
4Project Duration:
36 weeks
FROM …
$500 $7000
1
7
2
8
3
4 5
4
6
4
7
4
$400
$500
$3000
$7000
$200
$200
$70012
4
Project Duration:31 weeks
Additional Cost:$2000
TO…
Time-Cost Relationship
■ Crashing costs increase as project duration decreases
■ Indirect costs increase as project duration increasesincreases
■ Reduce project length as long as crashing costs are less than indirect costs
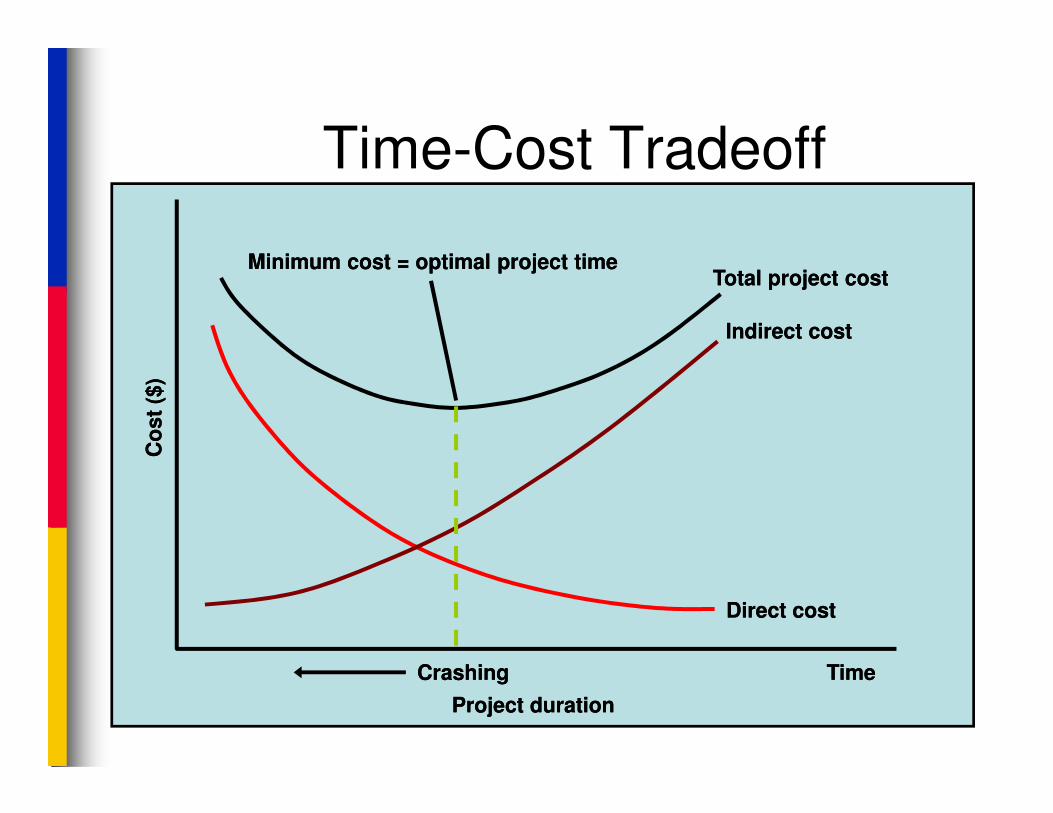
Time-Cost TradeoffC
os
t ($
)C
os
t ($
)
Minimum cost = optimal project timeMinimum cost = optimal project timeTotal project costTotal project cost
Indirect costIndirect cost
Co
st
($)
Co
st
($)
Project durationProject duration
CrashingCrashing TimeTime
Direct costDirect cost
References
■ Hughes, B., and Cotterell, M. (1999) Software Project Management, 2nd edition, McGraw-Hill. (slides)
■ Pfleeger, S.L. (1998) Software ■ Pfleeger, S.L. (1998) Software Engineering: Theory and Practice, Prentice Hall.
■ Roberta Russell & Bernard W. Taylor, III (2006) Operations Management - 5th Edition, John Wiley & Sons (slides)
Copyright 2006 John Wiley & Sons, Inc.Copyright 2006 John Wiley & Sons, Inc.
All rights reserved. Reproduction or translation of this work beyond that All rights reserved. Reproduction or translation of this work beyond that
permitted in section 117 of the 1976 United States Copyright Act without permitted in section 117 of the 1976 United States Copyright Act without
express permission of the copyright owner is unlawful. Request for further express permission of the copyright owner is unlawful. Request for further express permission of the copyright owner is unlawful. Request for further express permission of the copyright owner is unlawful. Request for further
information should be addressed to the Permission Department, John Wiley & information should be addressed to the Permission Department, John Wiley &
Sons, Inc. The purchaser may make backSons, Inc. The purchaser may make back--up copies for his/her own use only and up copies for his/her own use only and
not for distribution or resale. The Publisher assumes no responsibility for not for distribution or resale. The Publisher assumes no responsibility for
errors, omissions, or damages caused by the use of these programs or from the errors, omissions, or damages caused by the use of these programs or from the
use of the information herein. use of the information herein.