Embed Size (px)
Citation preview
Cisco Reports Third Quarter Earnings
SAN JOSE, CA--(Marketwired - May 16, 2017) - Cisco (NASDAQ: CSCO)
• Q3 Revenue: $11.9 billion
-- Decrease of (1)% year over year
-- Recurring revenue was 31% of total revenue, up 2 pts year over year
• Q3 Earnings per Share: $0.50 GAAP; $0.60 non-GAAP
• Q4 FY2017 Outlook: -- Revenue: (6)% to (4)% decline year over year
-- Earnings per Share: GAAP $0.46 to $0.51; Non-GAAP: $0.60 to $0.62
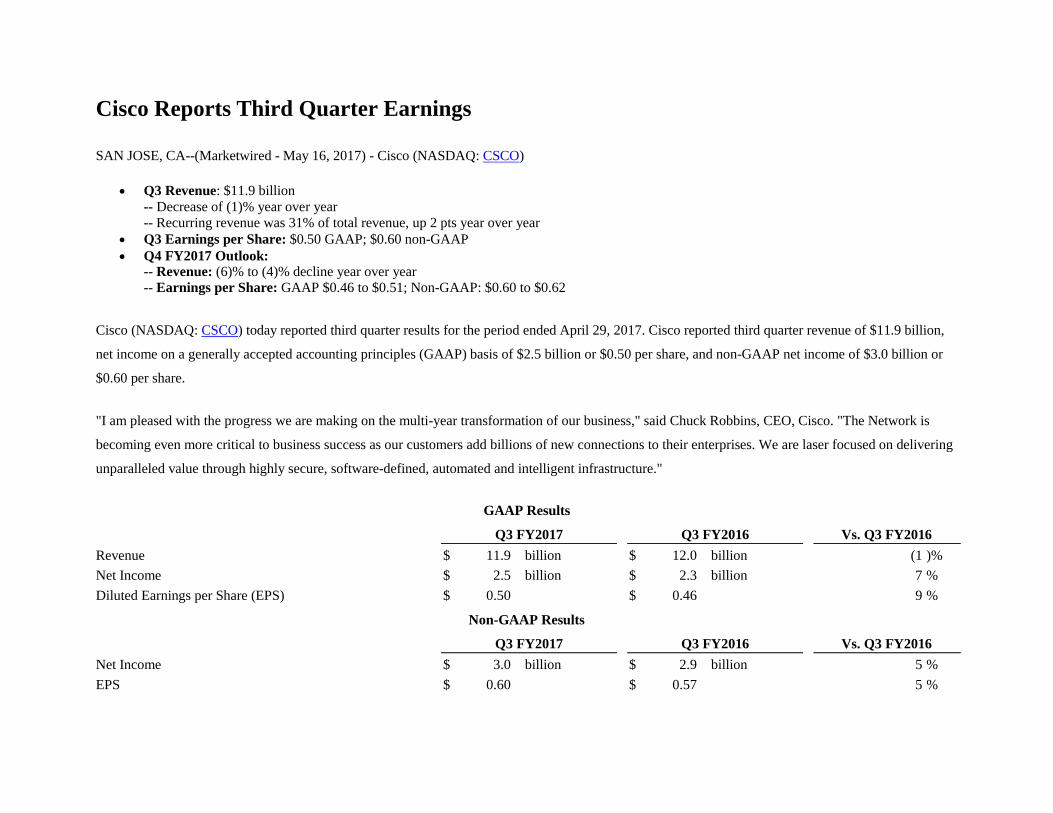
Cisco (NASDAQ: CSCO) today reported third quarter results for the period ended April 29, 2017. Cisco reported third quarter revenue of $11.9 billion,
net income on a generally accepted accounting principles (GAAP) basis of $2.5 billion or $0.50 per share, and non-GAAP net income of $3.0 billion or
$0.60 per share.
"I am pleased with the progress we are making on the multi-year transformation of our business," said Chuck Robbins, CEO, Cisco. "The Network is
becoming even more critical to business success as our customers add billions of new connections to their enterprises. We are laser focused on delivering
unparalleled value through highly secure, software-defined, automated and intelligent infrastructure."
GAAP Results
Q3 FY2017
Q3 FY2016
Vs. Q3 FY2016
Revenue
$ 11.9
billion
$ 12.0
billion
(1 )%
Net Income
$ 2.5
billion
$ 2.3
billion
7 %
Diluted Earnings per Share (EPS)
$ 0.50
$ 0.46
9 %
Non-GAAP Results
Q3 FY2017
Q3 FY2016
Vs. Q3 FY2016
Net Income
$ 3.0
billion
$ 2.9
billion
5 %
EPS
$ 0.60
$ 0.57
5 %
The third quarter of fiscal 2017 had 13 weeks compared with 14 weeks in the third quarter of fiscal 2016.
Reconciliations between net income, EPS and other measures on a GAAP and non-GAAP basis are provided in the tables located in the section entitled
"Reconciliations of GAAP to non-GAAP Measures."
"We executed well in Q3, delivering $11.9 billion in total revenue, while driving solid profitability and cash generation as we deliver on our strategic
priorities," said Kelly Kramer, CFO, Cisco. "We will continue to invest in growth areas as we move the business toward more software and recurring
revenue and return value to shareholders."
Financial Summary
All comparative percentages are on a year-over-year basis unless otherwise noted.
Q3 FY 2017 Highlights
Revenue -- Total revenue was $11.9 billion, down 1%, with product revenue flat and service revenue down 2%. 31% of total revenue was from recurring
offers, up from 29% for the third quarter of fiscal 2016. Revenue by geographic segment was: Americas flat, EMEA flat, and APJC down 2%. Product
revenue performance was led by Wireless and Security, which increased by 13% and 9%, respectively. Switching revenue increased by 2%. NGN
Routing, Collaboration, Data Center, and Service Provider Video revenue decreased by 2%, 4%, 5%, and 30%, respectively.
Gross Margin -- On a GAAP basis, total gross margin and product gross margin were 63.0% and 61.7%, respectively. The decrease in the product gross
margin compared with 63.8% in the third quarter of fiscal 2016 was primarily due to pricing, a supplier component remediation adjustment in the third
quarter of fiscal 2016, and product mix, partially offset by continued productivity improvements.
Non-GAAP total gross margin and product gross margin were 64.4% and 63.2%, respectively. The decrease in non-GAAP product gross margin
compared with 64.5% in the third quarter of fiscal 2016 was primarily due to pricing and product mix, partially offset by continued productivity
improvements.
GAAP service gross margin was 66.7% and non-GAAP service gross margin was 67.8%.
Total gross margins by geographic segment were: 64.6% for the Americas, 65.5% for EMEA and 61.8% for APJC.
Operating Expenses -- On a GAAP basis, operating expenses were $4.3 billion, down 8%. Non-GAAP operating expenses were $3.8 billion, down 9%,
and were 32.1% of revenue.
Operating Income -- GAAP operating income was $3.2 billion, up 6%, with GAAP operating margin of 26.5%. Non-GAAP operating income was $3.9
billion, up 7%, with non-GAAP operating margin at 32.3%.
Provision for Income Taxes -- The GAAP tax provision rate was 21.2%. The non-GAAP tax provision rate was 22.0%.
Net Income and EPS -- On a GAAP basis, net income was $2.5 billion and EPS was $0.50. On a non-GAAP basis, net income was $3.0 billion, an
increase of 5%, and EPS was $0.60, an increase of 5%.
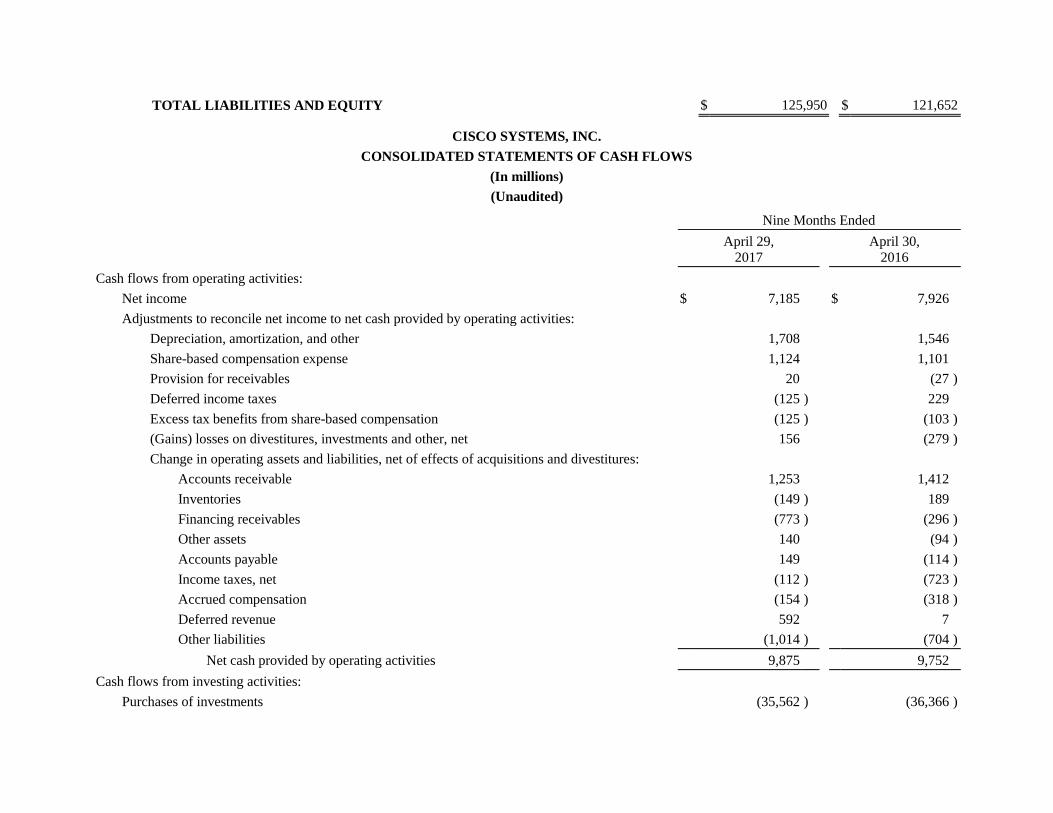
Cash Flow from Operating Activities -- was $3.4 billion, an increase of 10% compared with $3.1 billion for the third quarter of fiscal 2016.
Balance Sheet and Other Financial Highlights
Cash and Cash Equivalents and Investments -- were $68.0 billion at the end of the third quarter of fiscal 2017, compared with $71.8 billion at the end of
the second quarter of fiscal 2017, and compared with $65.8 billion at the end of fiscal 2016. The total cash and cash equivalents and investments available
in the United States at the end of the third quarter of fiscal 2017 were $2.9 billion.
Deferred Revenue -- was $17.3 billion, up 13% in total, with deferred product revenue up 26%, driven largely by subscription-based and software
offerings. Deferred service revenue was up 7%. The portion of product deferred revenue related to recurring software and subscription businesses grew
57% which includes the acquisition during the third quarter of fiscal 2017 of AppDynamics. Excluding AppDynamics, the increase was 51%.
Capital Allocation -- In the third quarter of fiscal 2017, Cisco declared and paid a cash dividend of $0.29 per common share, or $1.5 billion. For the third
quarter of fiscal 2017, Cisco repurchased approximately 15 million shares of common stock under its stock repurchase program at an average price of
$33.71 per share for an aggregate purchase price of $0.5 billion.
As of April 29, 2017, Cisco had repurchased and retired 4.7 billion shares of Cisco common stock at an average price of $21.21 per share for an
aggregate purchase price of approximately $99.1 billion since the inception of the stock repurchase program. The remaining authorized amount for stock
repurchases under this program is approximately $12.9 billion with no termination date.
Acquisitions
In the third quarter of fiscal 2017, Cisco completed its acquisition of AppDynamics, Inc. The AppDynamics acquisition provides cloud application and
business monitoring platforms that are designed to enable companies to improve application and business performance.
On May 1, 2017, Cisco announced its intent to acquire Viptela, Inc., a privately held software-defined wide area network company. The acquisition is
expected to close in the second half of calendar 2017.
On May 4, 2017, Cisco announced its intent to acquire the Advanced Analytics team and associated advanced analytics intellectual property developed
by Saggezza, a privately held technology services company. The acquisition is expected to close in the fourth quarter of fiscal 2017.
On May 11, 2017, Cisco announced its intent to acquire MindMeld, Inc., a privately held artificial intelligence (AI) company. The acquisition is expected
to close in the fourth quarter of fiscal 2017.
Business Outlook for Q4 FY 2017
Cisco expects to achieve the following results for the fourth quarter of fiscal 2017:
Q4 FY 2017
Revenue
(6)% to (4)% decline Y/Y
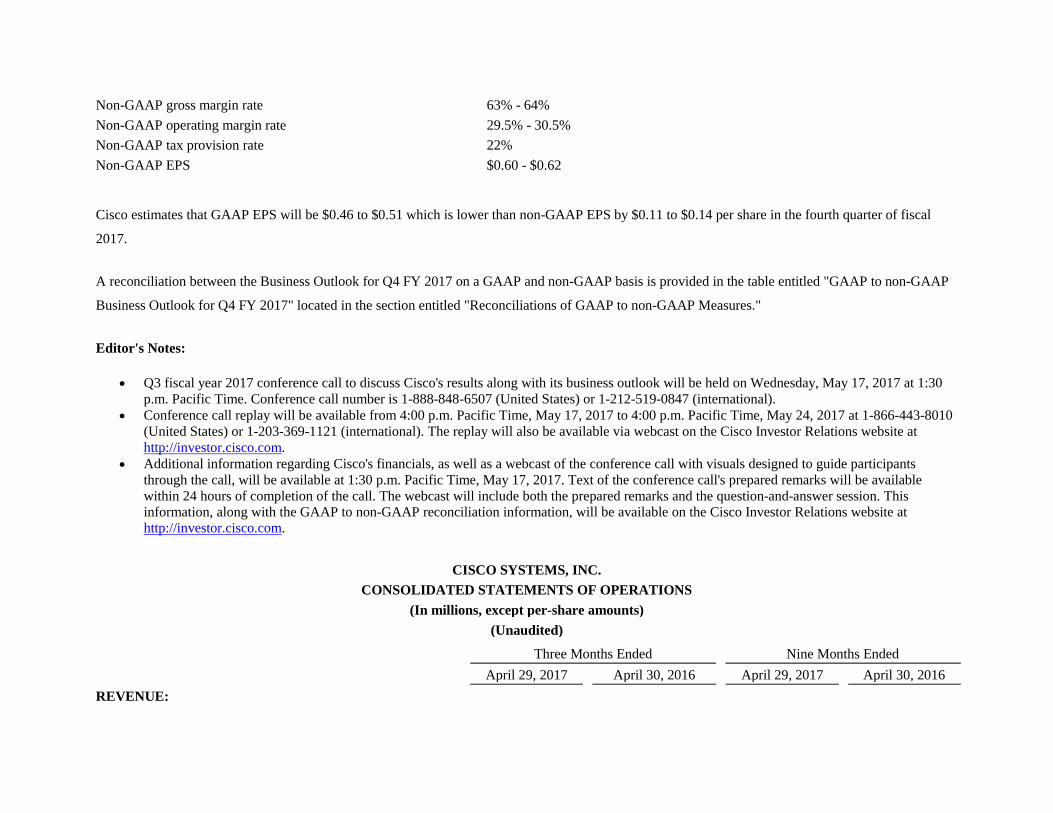
Non-GAAP gross margin rate
63% - 64%
Non-GAAP operating margin rate
29.5% - 30.5%
Non-GAAP tax provision rate
22%
Non-GAAP EPS
$0.60 - $0.62
Cisco estimates that GAAP EPS will be $0.46 to $0.51 which is lower than non-GAAP EPS by $0.11 to $0.14 per share in the fourth quarter of fiscal
2017.
A reconciliation between the Business Outlook for Q4 FY 2017 on a GAAP and non-GAAP basis is provided in the table entitled "GAAP to non-GAAP
Business Outlook for Q4 FY 2017" located in the section entitled "Reconciliations of GAAP to non-GAAP Measures."
Editor's Notes:
• Q3 fiscal year 2017 conference call to discuss Cisco's results along with its business outlook will be held on Wednesday, May 17, 2017 at 1:30
p.m. Pacific Time. Conference call number is 1-888-848-6507 (United States) or 1-212-519-0847 (international).
• Conference call replay will be available from 4:00 p.m. Pacific Time, May 17, 2017 to 4:00 p.m. Pacific Time, May 24, 2017 at 1-866-443-8010
(United States) or 1-203-369-1121 (international). The replay will also be available via webcast on the Cisco Investor Relations website at
http://investor.cisco.com.
• Additional information regarding Cisco's financials, as well as a webcast of the conference call with visuals designed to guide participants
through the call, will be available at 1:30 p.m. Pacific Time, May 17, 2017. Text of the conference call's prepared remarks will be available
within 24 hours of completion of the call. The webcast will include both the prepared remarks and the question-and-answer session. This
information, along with the GAAP to non-GAAP reconciliation information, will be available on the Cisco Investor Relations website at
http://investor.cisco.com.
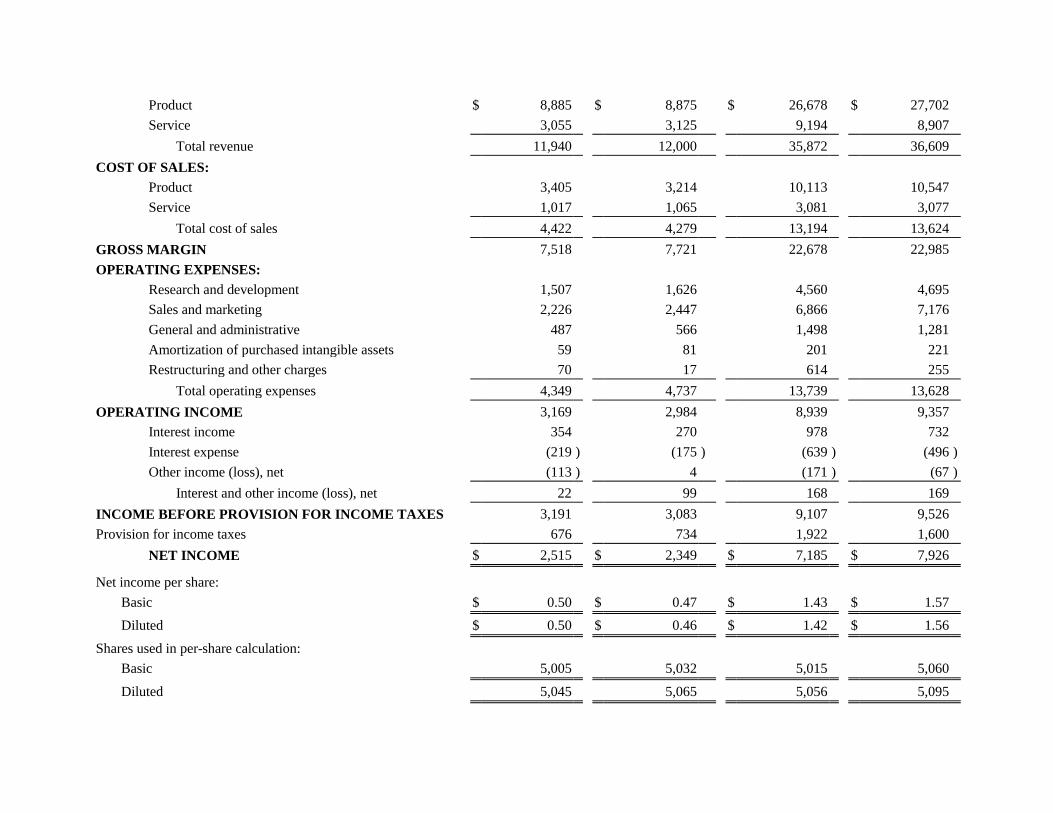
CISCO SYSTEMS, INC.
CONSOLIDATED STATEMENTS OF OPERATIONS
(In millions, except per-share amounts)
(Unaudited)
Three Months Ended
Nine Months Ended
April 29, 2017
April 30, 2016
April 29, 2017
April 30, 2016
REVENUE:
Product
$ 8,885
$ 8,875
$ 26,678
$ 27,702
Service
3,055
3,125
9,194
8,907
Total revenue
11,940
12,000
35,872
36,609
COST OF SALES:
Product
3,405
3,214
10,113
10,547
Service
1,017
1,065
3,081
3,077
Total cost of sales
4,422
4,279
13,194
13,624
GROSS MARGIN
7,518
7,721
22,678
22,985
OPERATING EXPENSES:
Research and development
1,507
1,626
4,560
4,695
Sales and marketing
2,226
2,447
6,866
7,176
General and administrative
487
566
1,498
1,281
Amortization of purchased intangible assets
59
81
201
221
Restructuring and other charges
70
17
614
255
Total operating expenses
4,349
4,737
13,739
13,628
OPERATING INCOME
3,169
2,984
8,939
9,357
Interest income
354
270
978
732
Interest expense
(219 )
(175 )
(639 )
(496 )
Other income (loss), net
(113 )
4
(171 )
(67 )
Interest and other income (loss), net
22
99
168
169
INCOME BEFORE PROVISION FOR INCOME TAXES
3,191
3,083
9,107
9,526
Provision for income taxes
676
734
1,922
1,600
NET INCOME
$ 2,515
$ 2,349
$ 7,185
$ 7,926
Net income per share:
Basic
$ 0.50
$ 0.47
$ 1.43
$ 1.57
Diluted
$ 0.50
$ 0.46
$ 1.42
$ 1.56
Shares used in per-share calculation:
Basic
5,005
5,032
5,015
5,060
Diluted
5,045
5,065
5,056
5,095
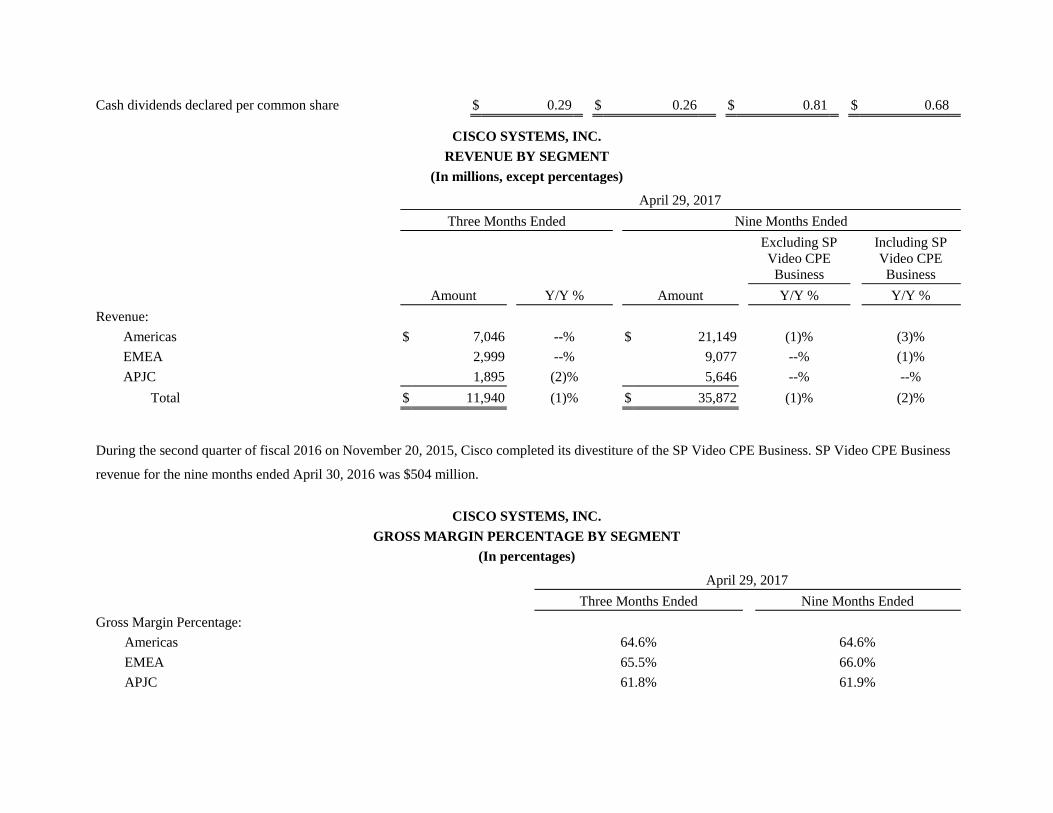
Cash dividends declared per common share
$ 0.29
$ 0.26
$ 0.81
$ 0.68
CISCO SYSTEMS, INC.
REVENUE BY SEGMENT
(In millions, except percentages)
April 29, 2017
Three Months Ended
Nine Months Ended
Excluding SP
Video CPE
Business
Including SP
Video CPE
Business
Amount
Y/Y %
Amount
Y/Y %
Y/Y %
Revenue:
Americas
$ 7,046
--%
$ 21,149
(1)%
(3)%
EMEA
2,999
--%
9,077
--%
(1)%
APJC
1,895
(2)%
5,646
--%
--%
Total
$ 11,940
(1)%
$ 35,872
(1)%
(2)%
During the second quarter of fiscal 2016 on November 20, 2015, Cisco completed its divestiture of the SP Video CPE Business. SP Video CPE Business
revenue for the nine months ended April 30, 2016 was $504 million.
CISCO SYSTEMS, INC.
GROSS MARGIN PERCENTAGE BY SEGMENT
(In percentages)
April 29, 2017
Three Months Ended
Nine Months Ended
Gross Margin Percentage:
Americas
64.6%
64.6%
EMEA
65.5%
66.0%
APJC
61.8%
61.9%
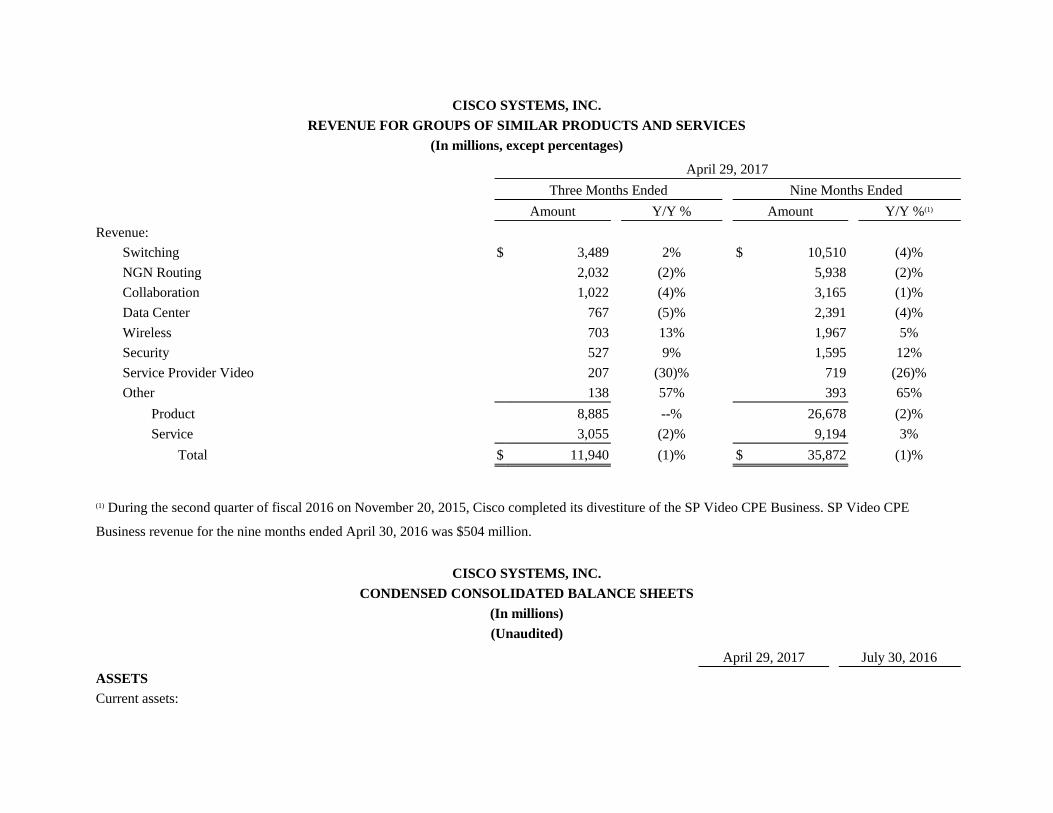
CISCO SYSTEMS, INC.
REVENUE FOR GROUPS OF SIMILAR PRODUCTS AND SERVICES
(In millions, except percentages)
April 29, 2017
Three Months Ended
Nine Months Ended
Amount
Y/Y %
Amount
Y/Y %(1)
Revenue:
Switching
$ 3,489
2%
$ 10,510
(4)%
NGN Routing
2,032
(2)%
5,938
(2)%
Collaboration
1,022
(4)%
3,165
(1)%
Data Center
767
(5)%
2,391
(4)%
Wireless
703
13%
1,967
5%
Security
527
9%
1,595
12%
Service Provider Video
207
(30)%
719
(26)%
Other
138
57%
393
65%
Product
8,885
--%
26,678
(2)%
Service
3,055
(2)%
9,194
3%
Total
$ 11,940
(1)%
$ 35,872
(1)%
(1) During the second quarter of fiscal 2016 on November 20, 2015, Cisco completed its divestiture of the SP Video CPE Business. SP Video CPE
Business revenue for the nine months ended April 30, 2016 was $504 million.
CISCO SYSTEMS, INC.
CONDENSED CONSOLIDATED BALANCE SHEETS
(In millions)
(Unaudited)
April 29, 2017
July 30, 2016
ASSETS
Current assets:
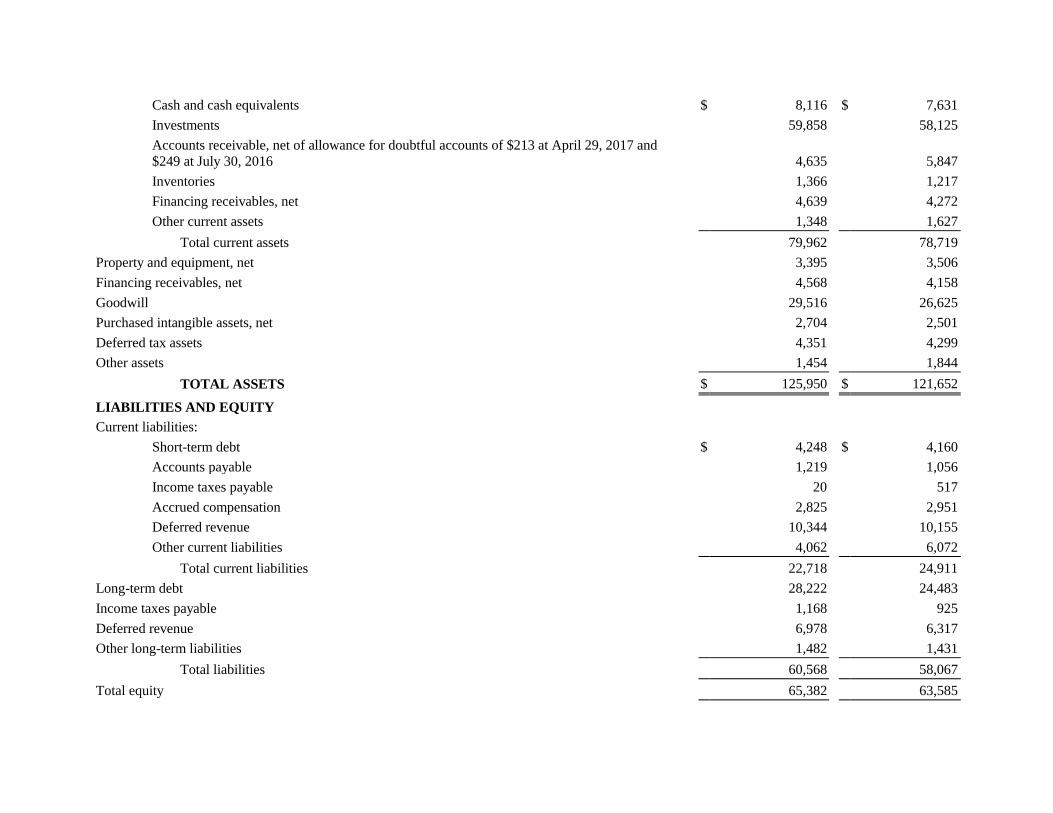
Cash and cash equivalents
$ 8,116
$ 7,631
Investments
59,858
58,125
Accounts receivable, net of allowance for doubtful accounts of $213 at April 29, 2017 and
$249 at July 30, 2016
4,635
5,847
Inventories
1,366
1,217
Financing receivables, net
4,639
4,272
Other current assets
1,348
1,627
Total current assets
79,962
78,719
Property and equipment, net
3,395
3,506
Financing receivables, net
4,568
4,158
Goodwill
29,516
26,625
Purchased intangible assets, net
2,704
2,501
Deferred tax assets
4,351
4,299
Other assets
1,454
1,844
TOTAL ASSETS
$ 125,950
$ 121,652
LIABILITIES AND EQUITY
Current liabilities:
Short-term debt
$ 4,248
$ 4,160
Accounts payable
1,219
1,056
Income taxes payable
20
517
Accrued compensation
2,825
2,951
Deferred revenue
10,344
10,155
Other current liabilities
4,062
6,072
Total current liabilities
22,718
24,911
Long-term debt
28,222
24,483
Income taxes payable
1,168
925
Deferred revenue
6,978
6,317
Other long-term liabilities
1,482
1,431
Total liabilities
60,568
58,067
Total equity
65,382
63,585
TOTAL LIABILITIES AND EQUITY
$ 125,950
$ 121,652
CISCO SYSTEMS, INC.
CONSOLIDATED STATEMENTS OF CASH FLOWS
(In millions)
(Unaudited)
Nine Months Ended
April 29,
2017
April 30,
2016
Cash flows from operating activities:
Net income
$ 7,185
$ 7,926
Adjustments to reconcile net income to net cash provided by operating activities:
Depreciation, amortization, and other
1,708
1,546
Share-based compensation expense
1,124
1,101
Provision for receivables
20
(27 )
Deferred income taxes
(125 )
229
Excess tax benefits from share-based compensation
(125 )
(103 )
(Gains) losses on divestitures, investments and other, net
156
(279 )
Change in operating assets and liabilities, net of effects of acquisitions and divestitures:
Accounts receivable
1,253
1,412
Inventories
(149 )
189
Financing receivables
(773 )
(296 )
Other assets
140
(94 )
Accounts payable
149
(114 )
Income taxes, net
(112 )
(723 )
Accrued compensation
(154 )
(318 )
Deferred revenue
592
7
Other liabilities
(1,014 )
(704 )
Net cash provided by operating activities
9,875
9,752
Cash flows from investing activities:
Purchases of investments
(35,562 )
(36,366 )
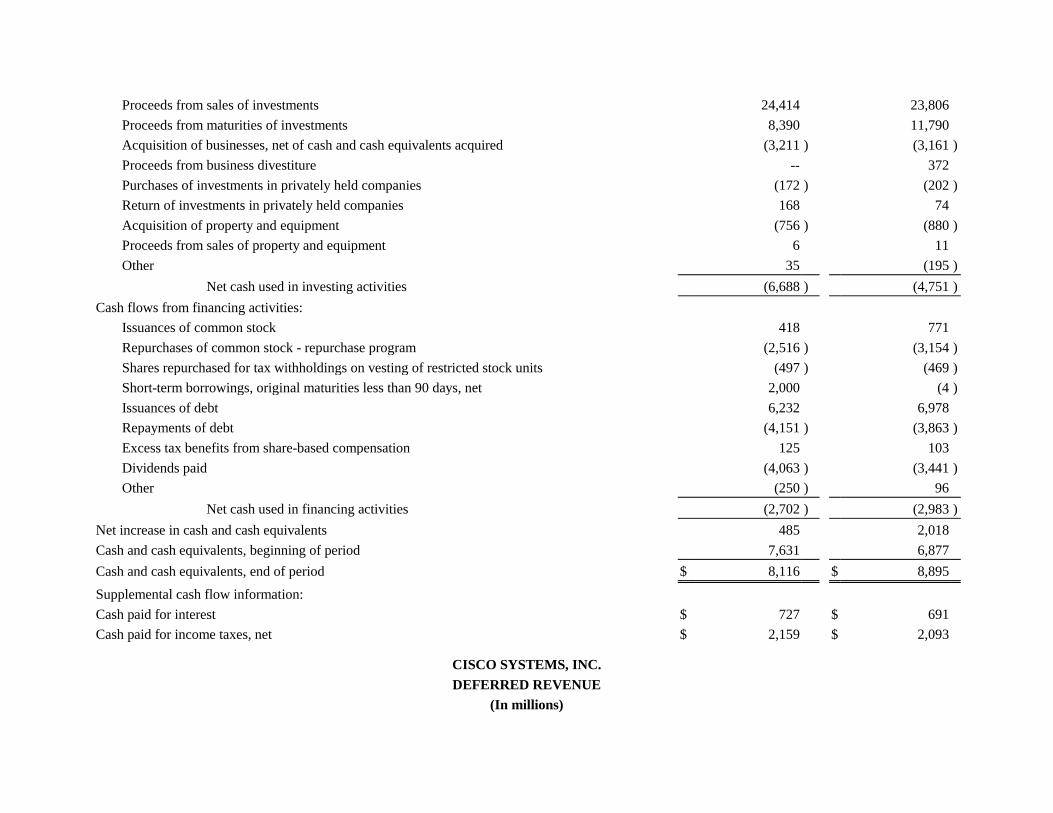
Proceeds from sales of investments
24,414
23,806
Proceeds from maturities of investments
8,390
11,790
Acquisition of businesses, net of cash and cash equivalents acquired
(3,211 )
(3,161 )
Proceeds from business divestiture
--
372
Purchases of investments in privately held companies
(172 )
(202 )
Return of investments in privately held companies
168
74
Acquisition of property and equipment
(756 )
(880 )
Proceeds from sales of property and equipment
6
11
Other
35
(195 )
Net cash used in investing activities
(6,688 )
(4,751 )
Cash flows from financing activities:
Issuances of common stock
418
771
Repurchases of common stock - repurchase program
(2,516 )
(3,154 )
Shares repurchased for tax withholdings on vesting of restricted stock units
(497 )
(469 )
Short-term borrowings, original maturities less than 90 days, net
2,000
(4 )
Issuances of debt
6,232
6,978
Repayments of debt
(4,151 )
(3,863 )
Excess tax benefits from share-based compensation
125
103
Dividends paid
(4,063 )
(3,441 )
Other
(250 )
96
Net cash used in financing activities
(2,702 )
(2,983 )
Net increase in cash and cash equivalents
485
2,018
Cash and cash equivalents, beginning of period
7,631
6,877
Cash and cash equivalents, end of period
$ 8,116
$ 8,895
Supplemental cash flow information:
Cash paid for interest
$ 727
$ 691
Cash paid for income taxes, net
$ 2,159
$ 2,093
CISCO SYSTEMS, INC.
DEFERRED REVENUE
(In millions)
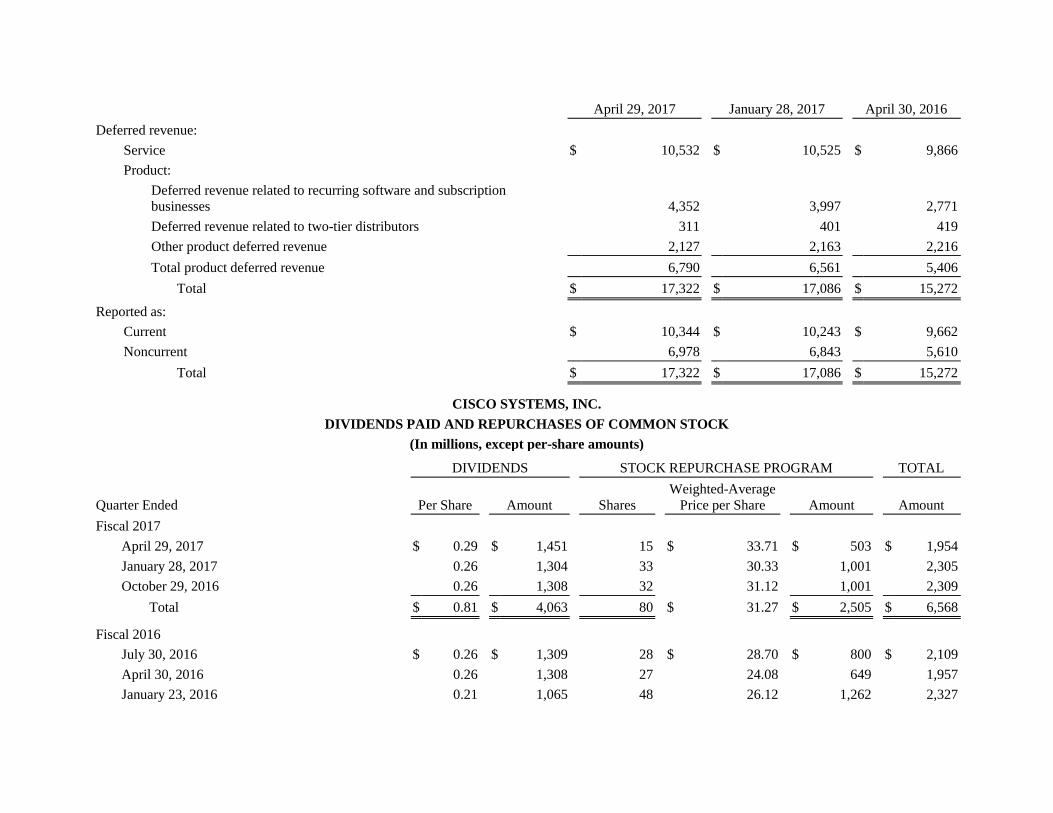
April 29, 2017
January 28, 2017
April 30, 2016
Deferred revenue:
Service
$ 10,532
$ 10,525
$ 9,866
Product:
Deferred revenue related to recurring software and subscription
businesses
4,352
3,997
2,771
Deferred revenue related to two-tier distributors
311
401
419
Other product deferred revenue
2,127
2,163
2,216
Total product deferred revenue
6,790
6,561
5,406
Total
$ 17,322
$ 17,086
$ 15,272
Reported as:
Current
$ 10,344
$ 10,243
$ 9,662
Noncurrent
6,978
6,843
5,610
Total
$ 17,322
$ 17,086
$ 15,272
CISCO SYSTEMS, INC.
DIVIDENDS PAID AND REPURCHASES OF COMMON STOCK
(In millions, except per-share amounts)
DIVIDENDS
STOCK REPURCHASE PROGRAM
TOTAL
Quarter Ended Per Share Amount Shares
Weighted-Average
Price per Share Amount Amount
Fiscal 2017
April 29, 2017
$ 0.29
$ 1,451
15
$ 33.71
$ 503
$ 1,954
January 28, 2017
0.26
1,304
33
30.33
1,001
2,305
October 29, 2016
0.26
1,308
32
31.12
1,001
2,309
Total
$ 0.81
$ 4,063
80
$ 31.27
$ 2,505
$ 6,568
Fiscal 2016
July 30, 2016
$ 0.26
$ 1,309
28
$ 28.70
$ 800
$ 2,109
April 30, 2016
0.26
1,308
27
24.08
649
1,957
January 23, 2016
0.21
1,065
48
26.12
1,262
2,327
October 24, 2015
0.21
1,068
45
26.83
1,207
2,275
Total
$ 0.94
$ 4,750
148
$ 26.45
$ 3,918
$ 8,668
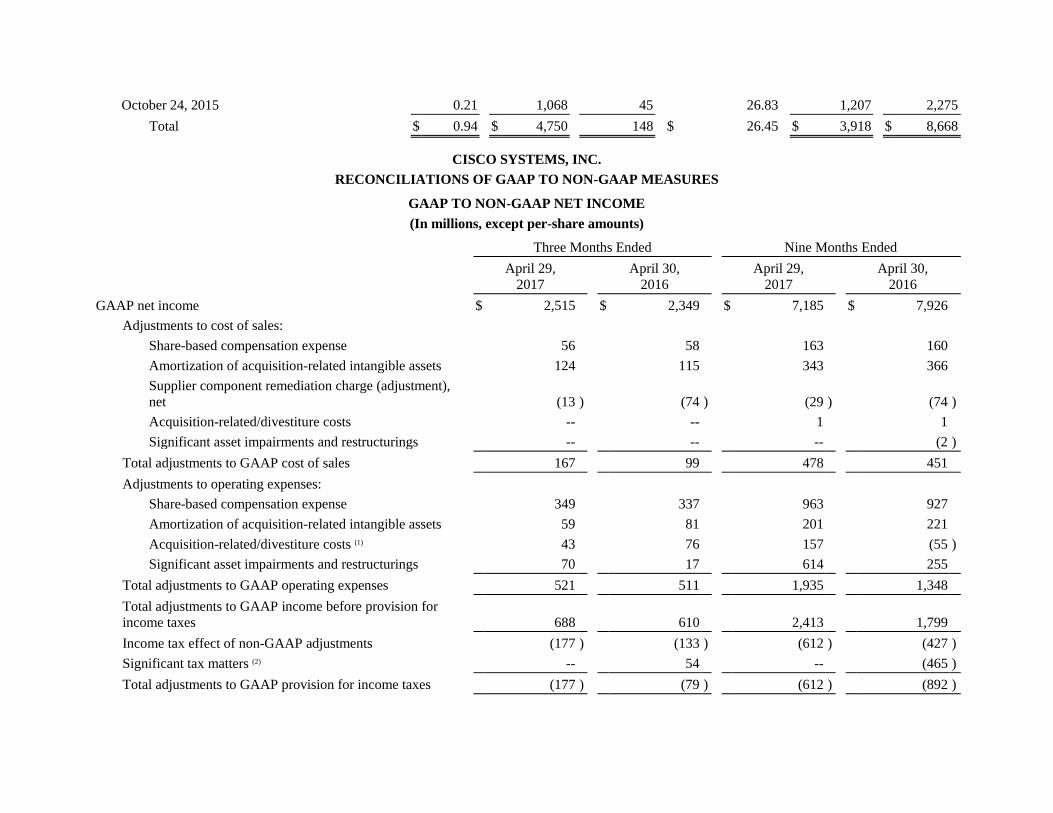
CISCO SYSTEMS, INC.
RECONCILIATIONS OF GAAP TO NON-GAAP MEASURES
GAAP TO NON-GAAP NET INCOME
(In millions, except per-share amounts)
Three Months Ended
Nine Months Ended
April 29,
2017
April 30,
2016
April 29,
2017
April 30,
2016
GAAP net income
$ 2,515
$ 2,349
$ 7,185
$ 7,926
Adjustments to cost of sales:
Share-based compensation expense
56
58
163
160
Amortization of acquisition-related intangible assets
124
115
343
366
Supplier component remediation charge (adjustment),
net
(13 )
(74 )
(29 )
(74 )
Acquisition-related/divestiture costs
--
--
1
1
Significant asset impairments and restructurings
--
--
--
(2 )
Total adjustments to GAAP cost of sales
167
99
478
451
Adjustments to operating expenses:
Share-based compensation expense
349
337
963
927
Amortization of acquisition-related intangible assets
59
81
201
221
Acquisition-related/divestiture costs (1)
43
76
157
(55 )
Significant asset impairments and restructurings
70
17
614
255
Total adjustments to GAAP operating expenses
521
511
1,935
1,348
Total adjustments to GAAP income before provision for
income taxes
688
610
2,413
1,799
Income tax effect of non-GAAP adjustments
(177 )
(133 )
(612 )
(427 )
Significant tax matters (2)
--
54
--
(465 )
Total adjustments to GAAP provision for income taxes
(177 )
(79 )
(612 )
(892 )
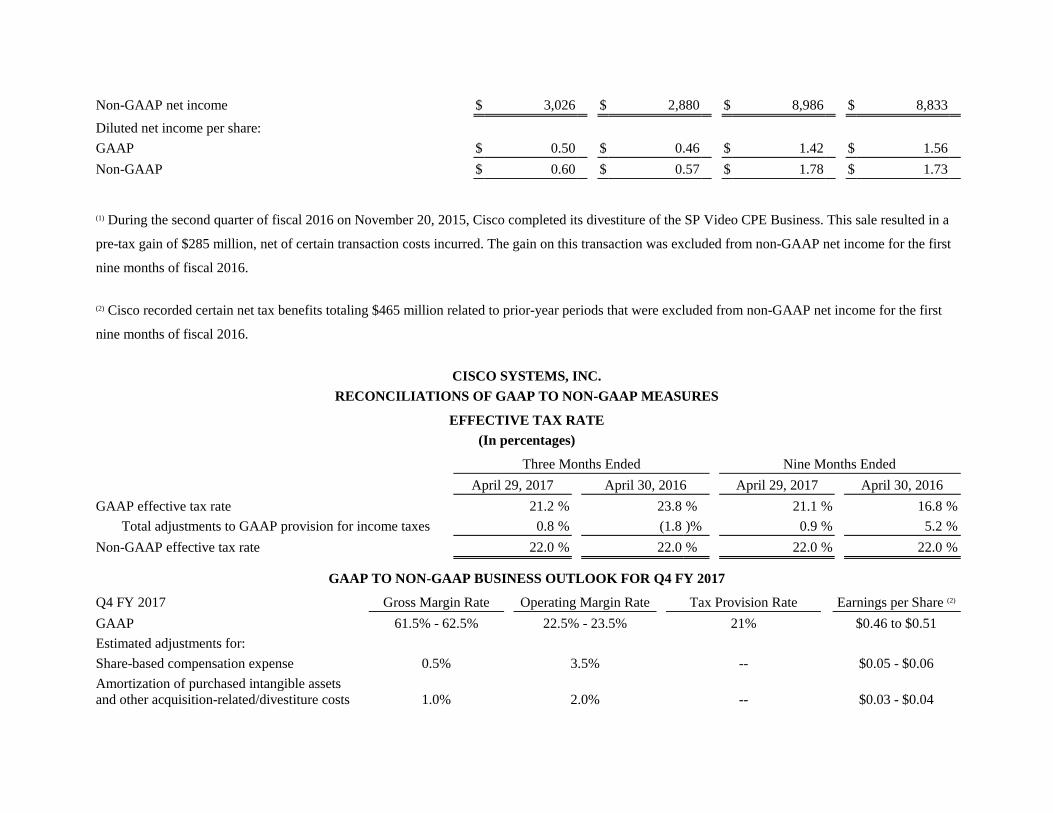
Non-GAAP net income
$ 3,026
$ 2,880
$ 8,986
$ 8,833
Diluted net income per share:
GAAP
$ 0.50
$ 0.46
$ 1.42
$ 1.56
Non-GAAP
$ 0.60
$ 0.57
$ 1.78
$ 1.73
(1) During the second quarter of fiscal 2016 on November 20, 2015, Cisco completed its divestiture of the SP Video CPE Business. This sale resulted in a
pre-tax gain of $285 million, net of certain transaction costs incurred. The gain on this transaction was excluded from non-GAAP net income for the first
nine months of fiscal 2016.
(2) Cisco recorded certain net tax benefits totaling $465 million related to prior-year periods that were excluded from non-GAAP net income for the first
nine months of fiscal 2016.
CISCO SYSTEMS, INC.
RECONCILIATIONS OF GAAP TO NON-GAAP MEASURES
EFFECTIVE TAX RATE
(In percentages)
Three Months Ended
Nine Months Ended
April 29, 2017
April 30, 2016
April 29, 2017
April 30, 2016
GAAP effective tax rate
21.2 %
23.8 %
21.1 %
16.8 %
Total adjustments to GAAP provision for income taxes
0.8 %
(1.8 )%
0.9 %
5.2 %
Non-GAAP effective tax rate
22.0 %
22.0 %
22.0 %
22.0 %
GAAP TO NON-GAAP BUSINESS OUTLOOK FOR Q4 FY 2017
Q4 FY 2017
Gross Margin Rate
Operating Margin Rate
Tax Provision Rate
Earnings per Share (2)
GAAP
61.5% - 62.5%
22.5% - 23.5%
21%
$0.46 to $0.51
Estimated adjustments for:
Share-based compensation expense
0.5%
3.5%
--
$0.05 - $0.06
Amortization of purchased intangible assets
and other acquisition-related/divestiture costs 1.0% 2.0% -- $0.03 - $0.04
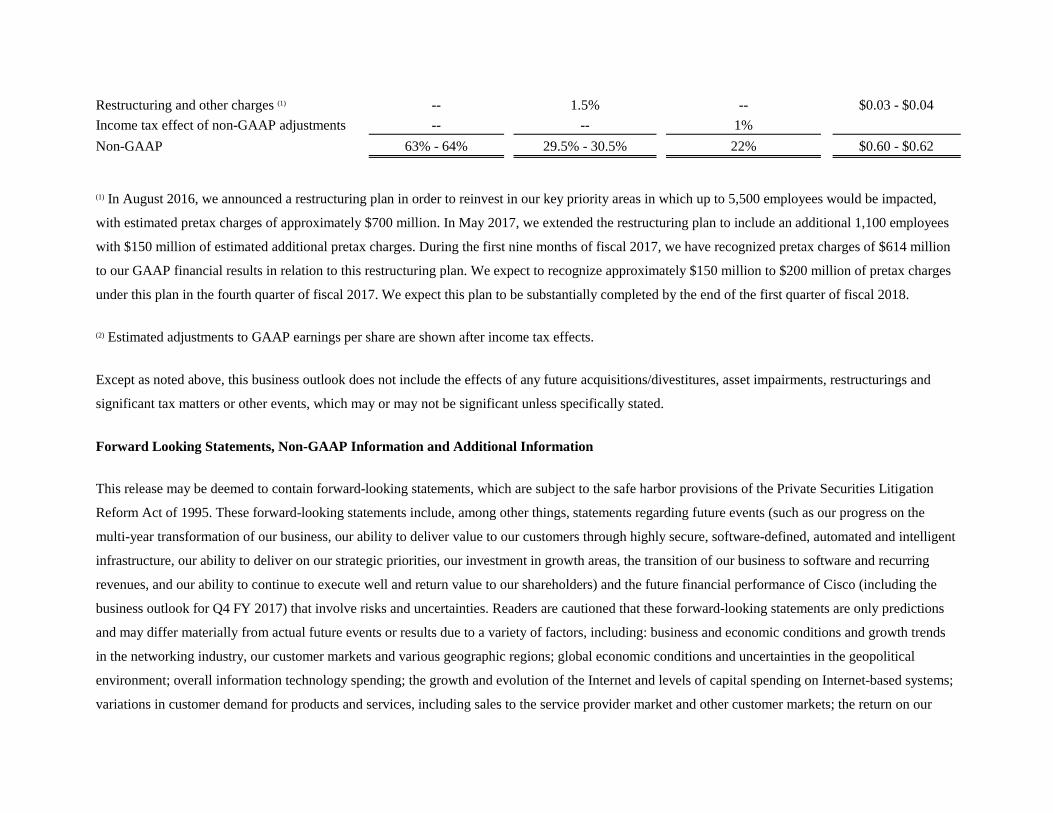
Restructuring and other charges (1)
--
1.5%
--
$0.03 - $0.04
Income tax effect of non-GAAP adjustments
--
--
1%
Non-GAAP
63% - 64%
29.5% - 30.5%
22%
$0.60 - $0.62
(1) In August 2016, we announced a restructuring plan in order to reinvest in our key priority areas in which up to 5,500 employees would be impacted,
with estimated pretax charges of approximately $700 million. In May 2017, we extended the restructuring plan to include an additional 1,100 employees
with $150 million of estimated additional pretax charges. During the first nine months of fiscal 2017, we have recognized pretax charges of $614 million
to our GAAP financial results in relation to this restructuring plan. We expect to recognize approximately $150 million to $200 million of pretax charges
under this plan in the fourth quarter of fiscal 2017. We expect this plan to be substantially completed by the end of the first quarter of fiscal 2018.
(2) Estimated adjustments to GAAP earnings per share are shown after income tax effects.
Except as noted above, this business outlook does not include the effects of any future acquisitions/divestitures, asset impairments, restructurings and
significant tax matters or other events, which may or may not be significant unless specifically stated.
Forward Looking Statements, Non-GAAP Information and Additional Information
This release may be deemed to contain forward-looking statements, which are subject to the safe harbor provisions of the Private Securities Litigation
Reform Act of 1995. These forward-looking statements include, among other things, statements regarding future events (such as our progress on the
multi-year transformation of our business, our ability to deliver value to our customers through highly secure, software-defined, automated and intelligent
infrastructure, our ability to deliver on our strategic priorities, our investment in growth areas, the transition of our business to software and recurring
revenues, and our ability to continue to execute well and return value to our shareholders) and the future financial performance of Cisco (including the
business outlook for Q4 FY 2017) that involve risks and uncertainties. Readers are cautioned that these forward-looking statements are only predictions
and may differ materially from actual future events or results due to a variety of factors, including: business and economic conditions and growth trends
in the networking industry, our customer markets and various geographic regions; global economic conditions and uncertainties in the geopolitical
environment; overall information technology spending; the growth and evolution of the Internet and levels of capital spending on Internet-based systems;
variations in customer demand for products and services, including sales to the service provider market and other customer markets; the return on our
investments in certain priorities, key growth areas, and in certain geographical locations, as well as maintaining leadership in routing, switching and
services; the timing of orders and manufacturing and customer lead times; changes in customer order patterns or customer mix; insufficient, excess or
obsolete inventory; variability of component costs; variations in sales channels, product costs or mix of products sold; our ability to successfully acquire
businesses and technologies and to successfully integrate and operate these acquired businesses and technologies; our ability to achieve expected benefits
of our partnerships; increased competition in our product and service markets, including the data center market; dependence on the introduction and
market acceptance of new product offerings and standards; rapid technological and market change; manufacturing and sourcing risks; product defects and
returns; litigation involving patents, intellectual property, antitrust, shareholder and other matters, and governmental investigations; our ability to achieve
the benefits of the announced restructuring and possible changes in the size and timing of the related charges; man-made problems such as cyber-attacks,
data protection breaches, computer viruses or terrorism; natural catastrophic events; a pandemic or epidemic; our ability to achieve the benefits
anticipated from our investments in sales, engineering, service, marketing and manufacturing activities; our ability to recruit and retain key personnel; our
ability to manage financial risk, and to manage expenses during economic downturns; risks related to the global nature of our operations, including our
operations in emerging markets; currency fluctuations and other international factors; changes in provision for income taxes, including changes in tax
laws and regulations or adverse outcomes resulting from examinations of our income tax returns; potential volatility in operating results; and other factors
listed in Cisco's most recent reports on Forms 10-Q and 10-K filed on February 21, 2017 and September 8, 2016, respectively. The financial information
contained in this release should be read in conjunction with the consolidated financial statements and notes thereto included in Cisco's most recent reports
on Forms 10-Q and 10-K as each may be amended from time to time. Cisco's results of operations for the three and nine months ended April 29, 2017 are
not necessarily indicative of Cisco's operating results for any future periods. Any projections in this release are based on limited information currently
available to Cisco, which is subject to change. Although any such projections and the factors influencing them will likely change, Cisco will not
necessarily update the information, since Cisco will only provide guidance at certain points during the year. Such information speaks only as of the date
of this release.
This release includes non-GAAP net income, non-GAAP gross margins, non-GAAP operating expenses, non-GAAP operating income and margin, non-
GAAP effective tax rates, and non-GAAP net income per share data for the periods presented. It also includes future estimated ranges for gross margin,
operating margin, tax provision rate and EPS on a non-GAAP basis.
These non-GAAP measures are not in accordance with, or an alternative for, measures prepared in accordance with generally accepted accounting
principles and may be different from non-GAAP measures used by other companies. In addition, these non-GAAP measures are not based on any
comprehensive set of accounting rules or principles. Cisco believes that non-GAAP measures have limitations in that they do not reflect all of the
amounts associated with Cisco's results of operations as determined in accordance with GAAP and that these measures should only be used to evaluate
Cisco's results of operations in conjunction with the corresponding GAAP measures.
Cisco believes that the presentation of non-GAAP measures when shown in conjunction with the corresponding GAAP measures, provides useful
information to investors and management regarding financial and business trends relating to its financial condition and its historical and projected results
of operations.
For its internal budgeting process, Cisco's management uses financial statements that do not include, when applicable, share-based compensation
expense, amortization of acquisition-related intangible assets, acquisition-related/divestiture costs, significant asset impairments and restructurings,
significant litigation and other contingencies, significant gains and losses on investments, the income tax effects of the foregoing and significant tax
matters. Cisco's management also uses the foregoing non-GAAP measures, in addition to the corresponding GAAP measures, in reviewing the financial
results of Cisco. In prior periods, Cisco has excluded other items that it no longer excludes for purposes of its non-GAAP financial measures. From time
to time in the future there may be other items that Cisco may exclude for purposes of its internal budgeting process and in reviewing its financial results.
For additional information on the items excluded by Cisco from one or more of its non-GAAP financial measures, refer to the Form 8-K regarding this
release furnished today to the Securities and Exchange Commission.
Cisco divested the Customer Premises Equipment portion of the Service Provider Video Connected Devices business ("SP Video CPE Business") during
the second quarter of fiscal 2016 on November 20, 2015. This release includes, where indicated, financial measures that exclude the SP Video CPE
Business. Cisco believes that the presentation of these measures provides useful information to investors and management regarding financial and
business trends relating to its financial condition and its historical and projected results of operations because the SP Video CPE Business is no longer
part of Cisco and will not be part of Cisco on a go forward basis. Cisco's management also uses the financial measures excluding the SP Video CPE
Business in reviewing the financial results of Cisco.

About Cisco
Cisco (NASDAQ: CSCO) is the worldwide technology leader that has been making the Internet work since 1984. Our people, products and partners help
society securely connect and seize tomorrow's digital opportunity today. Discover more at thenetwork.cisco.com and follow us on Twitter at @Cisco.
Copyright © 2017 Cisco and/or its affiliates. All rights reserved. Cisco and the Cisco logo are trademarks or registered trademarks of Cisco and/or its
affiliates in the U.S. and other countries. To view a list of Cisco trademarks, go to: www.cisco.com/go/trademarks. Third-party trademarks mentioned in
this document are the property of their respective owners. The use of the word partner does not imply a partnership relationship between Cisco and any
other company. This document is Cisco Public Information.
CONTACT INFORMATION
• Press Contact:
Andrea Duffy
Cisco
1 (646) 295-5241
Email Contact
Investor Relations Contact:
Marilyn Mora
Cisco
1 (408) 527-7452
Email Contact
(Unencrypted Contact)

Press Contact:
Andrea Duffy
Cisco
1 (646) 295-5241
Investor Relations Contact:
Marilyn Mora
Cisco
1 (408) 527-7452