Embed Size (px)
Citation preview

9978 Phys. Chem. Chem. Phys., 2011, 13, 9978–9981 This journal is c the Owner Societies 2011
Cite this: Phys. Chem. Chem. Phys., 2011, 13, 9978–9981
Nanoscale chemical imaging of segregated lipid domains usingtip-enhanced Raman spectroscopyw
Lothar Opilik,a Thomas Bauer,zb Thomas Schmid,za Johannes Stadlera and Renato Zenobi*a
Received 9th December 2010, Accepted 9th March 2011
DOI: 10.1039/c0cp02832k
Lipid domains in supported lipid layers serve as a popular modelto gain insight into the processes associated with the compart-mentalization of biological membranes into so-called lipid rafts.In this paper, we present reproducible tip-enhanced Ramanspectra originating from a very small number of molecules in alipid monolayer on a gold surface, probed by the apex of ananometer-sized silver tip. For the first time, we show large (128 !128 pixels), high-resolution (o 50 nm) tip-enhanced Raman imagesof binary lipid mixtures with full spectral information at each pixel.
According to the lipid raft concept, phase segregation intolipid domains is involved in processes like protein sorting andsignaling in biological membranes.1 Direct visualization ofthese small and highly dynamic domains in the complexenvironment of a cellular membrane is a very challenging task.Phase segregated giant vesicles2,3 as well as supported lipidmono- and bilayers4 with known chemical composition havetherefore often been used as model systems. The size of thesegregated phase domains ranges from tens of nanometers toseveral microns.
Fluorescence microscopy is a common technique for thevisualization of coexisting domains in model membranes aswell as cellular membranes.2,3,5 However, epifluorescence andconfocal fluorescence microscopy are di!raction limited andcannot be used to visualize domains with a size below 200 nmusing light in the visible spectral range. The most commontechnique to visualize these very small lipid domains insupported membranes is atomic force microscopy (AFM).6–8
This is mainly achieved by measuring the di!erence in heightand friction force of coexisting phase domains in mixed mono-and bilayers. In contrast to spectroscopic methods, AFMyields no or very limited chemical information. For multi-component mixtures with complex morphology, the purelytopographic information is not su"cient to understand thedistribution of all constituents within membrane leaflets.
Di!erent attempts have been made to combine the highspatial resolution of scanning probe microscopy (SPM) withthe rich chemical information provided by spectroscopy. Onesuch technique called aperture scanning near-field opticalmicroscopy (SNOM) has already been used successfully toperform fluorescence microscopy on model4 and biologicalmembranes9 with a typical lateral resolution of 50–100 nm.The main idea of the technique is to excite fluorophores with aconfined light source at the end of a small-aperture opticalprobe, which can be scanned across the sample surface.However, in order to gain insight into the compartmentali-
zation of biological membranes based on fluorescencemicroscopy,fluorescent probes with known partitioning preference for oneof the coexisting phases are required. The phase preference fora given fluorescent probe can be di!erent for di!erent lipidsystems and therefore has to be evaluated for each modelsystem. Moreover, some of these fluorescent lipid analoguesare known to perturb the phase behavior of lipid mixtures.10
This also limits the application of other fluorescence-basedhigh-resolution imaging techniques, such as STED, STORMand PALM.11
Methods based on Raman spectroscopy give the possibilityfor label-free chemical identification of coexisting lipid phasesin membrane model systems under physiological conditions.The main challenge when working with spontaneous Ramanscattering is the intrinsic weakness of the Raman scatteringprocess. To counteract this, methods for enhanced Ramanscattering have been developed. It has, for example, beenshown that coherent anti-Stokes Raman scattering (CARS)is sensitive enough to acquire lipid spectra from single mono-and bilayers12,13 to allow for quantitative imaging on mixedlipid bilayers with a lateral resolution of 250 nm.14 Anothermethod resulting in an enhanced Raman scattering intensity istip-enhanced Raman spectroscopy (TERS).15 It is an aper-tureless near-field technique, where a metallic or metallizedSPM tip is used to confine and enhance an electromagneticfield in close proximity to the sample surface. The mainadvantages compared to CARS are the better lateral resolution(15–40 nm)16,17 and the fact that TERS allows for the collectionof a full spectrum at each point, whereas CARS is restrictedto one selected Raman band. Tip-enhanced Raman spectra inthe fingerprint region (o1800 cm"1) collected on a singlespot on a mixed supported lipid bilayer have been recentlyshown.18
aDepartment of Chemistry and Applied Biosciences, ETH Zurich,CH-8093 Zurich, Switzerland. E-mail: [email protected];Fax: +41 44 6321292; Tel: +41 44 6324377
bDepartment of Materials, ETH Zurich, CH-8093 Zurich,Switzerland
w Electronic supplementary information (ESI) available: Experimentaland data processing details, and additional figures. See DOI: 10.1039/c0cp02832kz These authors contributed equally to the work.
PCCP Dynamic Article Links
www.rsc.org/pccp COMMUNICATION
Dow
nloa
ded
by E
TH-Z
uric
h on
10
June
201
1Pu
blish
ed o
n 23
Mar
ch 2
011
on h
ttp://
pubs
.rsc.
org
| doi
:10.
1039
/C0C
P028
32K
View Online
This journal is c the Owner Societies 2011 Phys. Chem. Chem. Phys., 2011, 13, 9978–9981 9979
In this paper, we demonstrate that it is possible to collectreproducible and strongly enhanced tip-enhanced Ramanspectra from lipid monolayers in the gap between a silvertip and a flat gold surface using top-illumination and STMfeedback control.16 This configuration can be employed toimage the lateral distribution of the individual components ina monolayer composed of a binary mixture of phospholipidswith chemical selectivity.
The experiments were performed using a combined AFM/STM/Raman microscope (NT-MDT, Russia, NTEGRASpectra Upright) described in more detail elsewhere.16 AHeNe laser with a wavelength of 632.8 nm was used asexcitation source. AFM was done using nose-type silicon tips(ATEC-NC from Nanosensors) in semi-contact mode. AsSTM tips electrochemically etched silver wires (diameter of0.25 mm, 99.99% purity, Aldrich) were used.16
Template-stripped (TS) gold surfaces were used as sub-strates. The preparation procedure is described elsewhere.19
After mechanical cleavage, the substrates were air–plasmatreated for one minute to render the Au surface hydrophilic.Subsequently, they were directly immersed in Milli-Qwater. 1,2-Dioleoyl-sn-glycero-3-phosphocholine (DOPC),1,2-dipalmitoyl-sn-glycero-3-phosphocholine (DPPC) and1,2-dipalmitoyl(d62)-sn-glycero-3-phosphocholine (d62-DPPC)were purchased from Avanti Polar Lipids (Alabaster, AL)and used without further purification. Binary lipid mixtureswere prepared with a molar ratio of 1 : 1. Monolayers wereprepared on a Langmuir–Blodgett (LB) trough (Minitrough,KSV, Finland) placed on an anti-vibration table in a dust-reduced environment, using Milli-Q water as the liquid phase.For every experiment, the deposition of the compounds was asfollows: a 1 mg mL"1 CHCl3 solution was spread onto thewater and the solvent was allowed to evaporate for 10 min.The total amount of the used CHCl3 solution was 25 mL forDPPC, DOPC and d62-DPPC, whereas 20 mL were used forthe DPPC/DOPC and the d62-DPPC/DOPC mixtures. Thecompression rate was set to 2 mm min"1. The surface pressurewas measured with a Wilhelmy balance with a precision of0.01 mN m"1. Structural annealing was performed by twocompression/expansion cycles between the final pressure(10 mN m"1 for DPPC, DOPC, the DPPC/DOPC mixtureand 20 mN m"1 for the d62-DPPC/DOPC mixture) and2 mNm"1. Subsequently, the monolayers were transferred ontoTS gold and mica via vertical Langmuir–Blodgett techniquewith 2 mm min"1. All monolayer transfers were done atroom temperature. DPPC (saturated fatty acid chains) andDOPC (unsaturated fatty acid chains) are immiscible at roomtemperature and at a surface pressure of 10 mN m"1, DPPC ispredominantly present in condensed phase domains protrudingfrom a surrounding fluid phase that consists mainly of DOPC.20
A representative AFM topography image of a mixed LBmonolayer of DPPC and DOPC deposited on freshly cleavedmica is shown in Fig. 1a. The step height of approx. 1 nm at thedomain edges (see the corresponding line cross-section) isconsistent with the literature value.20 The array of parallel stripedomains is most likely formed by shear force-induced alignmentand coalescence during vertical transfer or substrate-mediatedcondensation.21,22 Fig. 1b shows the AFM topography of thesame mixed monolayer transferred onto TS gold. In this case,
the domains are not ordered, presumably due to the di!erentsurface properties compared to mica. The increased step heightseen in the line cross-section could be the result of a highersti!ness di!erence between the two coexisting lipid phasesresulting in a higher di!erence in penetration of the AFMtip at high oscillation damping (50%) in semi-contact mode.Such artifacts in AFM semi-contact imaging of lipid layersresulting in apparent topography di!erences that are a!ectedby mechanical properties of the lipid agglomerate and tappingforce are already described in the literature.23 Monolayer
Fig. 1 Semi-contact mode AFM topography images of a DPPC/
DOPC mixed monolayer (molar ratio of 1 : 1) transferred to mica
(a) and TS gold (b) by Langmuir–Blodgett technique at room
temperature. Cross-sections along the indicated lines are shown below
the images.
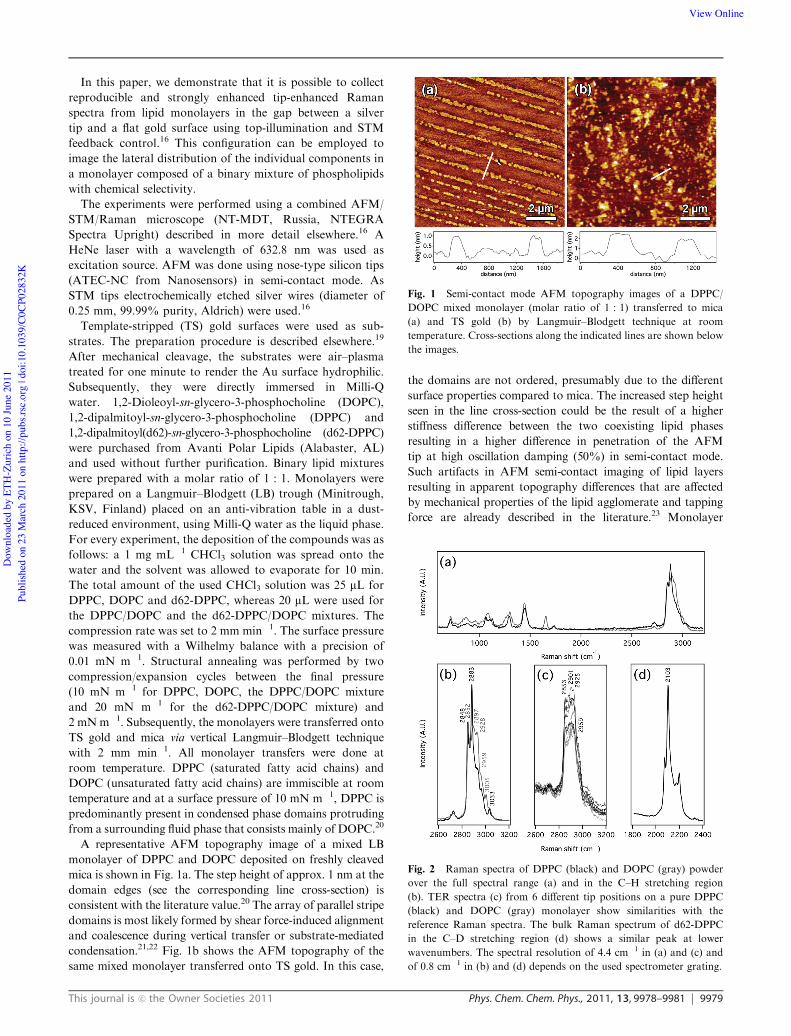
Fig. 2 Raman spectra of DPPC (black) and DOPC (gray) powder
over the full spectral range (a) and in the C–H stretching region
(b). TER spectra (c) from 6 di!erent tip positions on a pure DPPC
(black) and DOPC (gray) monolayer show similarities with the
reference Raman spectra. The bulk Raman spectrum of d62-DPPC
in the C–D stretching region (d) shows a similar peak at lower
wavenumbers. The spectral resolution of 4.4 cm"1 in (a) and (c) and
of 0.8 cm"1 in (b) and (d) depends on the used spectrometer grating.
Dow
nloa
ded
by E
TH-Z
uric
h on
10
June
201
1Pu
blish
ed o
n 23
Mar
ch 2
011
on h
ttp://
pubs
.rsc.
org
| doi
:10.
1039
/C0C
P028
32K
View Online
9980 Phys. Chem. Chem. Phys., 2011, 13, 9978–9981 This journal is c the Owner Societies 2011
deposition was only possible after air–plasma treatment of theTS gold surface, which shows the importance of removingresidual organic impurities to ensure su"cient hydrophilicityof the gold surface.
Raman spectra of lipids show a strong band close to2900 cm"1 corresponding to the methylene stretching vibrationsof the long acyl chains which can be used as a marker band tovisualize their distribution within a biological system.24 Fig. 2shows Raman spectra of DPPC and DOPC powders over thefull spectral range (a) and in the C–H stretching region (b).The C–H stretching region of DPPC is dominated by thesymmetric and antisymmetric methylene stretching vibrationsat 2848 cm"1 and 2883 cm"1. The lower chain order ofthe DOPC molecules results in reduced signal intensity forthe antisymmetric methylene stretching vibration (in directcomparison to the symmetric stretching vibration) and a shiftof both peaks to higher wavenumbers.12 The weak signal at3005 cm"1 that is only observed in the spectrum of DOPC isassigned to the vinylic C–H vibrations. At a slightly higherRaman shift of 3033 cm"1 both spectra exhibit a bandassociated with the antisymmetric methyl stretch of the cholinehead group.25
Fig. 2c shows tip-enhanced Raman spectra in the C–Hstretching region collected at random tip positions on apure DPPC and DOPC monolayer, respectively, depositedon TS gold. An acquisition time of 40 ! 0.5 s was used foreach spectrum, with an illumination laser power of 650 mWreaching the sample. The Raman bands at 2853 cm"1,2901 cm"1, 2925 cm"1 and 2959 cm"1 are consistent withthe bands from reference spectra. However, it is not possible todistinguish the two lipid compounds based on their C–Hstretching vibrations.
To improve spectroscopic contrast, DPPC was substitutedby d62-DPPC with fully deuterated lipid chains, whichresults in a C–D Raman band at 2100 cm"1 (see Fig. 2d),which is separated from any other lipid band. Due to the highdegree of deuteration, the phase transition temperature ofd62-DPPC is lowered by 5 1C compared to the protiatedDPPC.26 This alteration was taken into account by increasingthe surface pressure in the LB experiment (see above and theESIw).
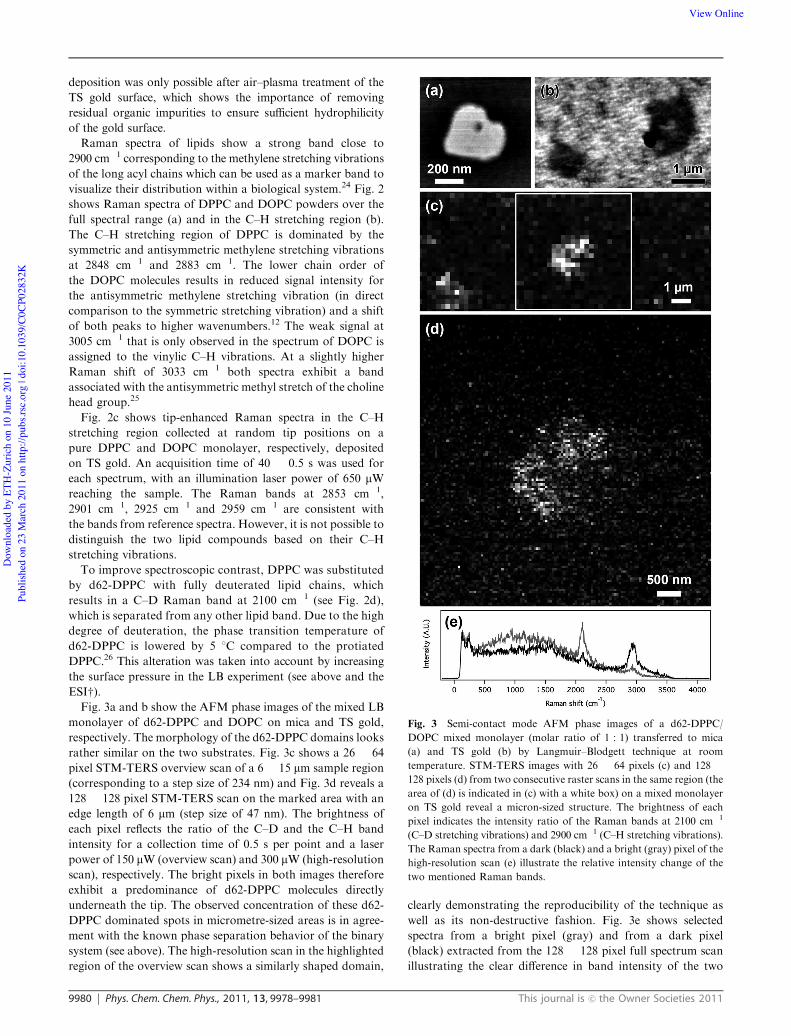
Fig. 3a and b show the AFM phase images of the mixed LBmonolayer of d62-DPPC and DOPC on mica and TS gold,respectively. The morphology of the d62-DPPC domains looksrather similar on the two substrates. Fig. 3c shows a 26 ! 64pixel STM-TERS overview scan of a 6 ! 15 mm sample region(corresponding to a step size of 234 nm) and Fig. 3d reveals a128 ! 128 pixel STM-TERS scan on the marked area with anedge length of 6 mm (step size of 47 nm). The brightness ofeach pixel reflects the ratio of the C–D and the C–H bandintensity for a collection time of 0.5 s per point and a laserpower of 150 mW (overview scan) and 300 mW (high-resolutionscan), respectively. The bright pixels in both images thereforeexhibit a predominance of d62-DPPC molecules directlyunderneath the tip. The observed concentration of these d62-DPPC dominated spots in micrometre-sized areas is in agree-ment with the known phase separation behavior of the binarysystem (see above). The high-resolution scan in the highlightedregion of the overview scan shows a similarly shaped domain,
clearly demonstrating the reproducibility of the technique aswell as its non-destructive fashion. Fig. 3e shows selectedspectra from a bright pixel (gray) and from a dark pixel(black) extracted from the 128 ! 128 pixel full spectrum scanillustrating the clear di!erence in band intensity of the two
Fig. 3 Semi-contact mode AFM phase images of a d62-DPPC/
DOPC mixed monolayer (molar ratio of 1 : 1) transferred to mica
(a) and TS gold (b) by Langmuir–Blodgett technique at room
temperature. STM-TERS images with 26 ! 64 pixels (c) and 128 !128 pixels (d) from two consecutive raster scans in the same region (the
area of (d) is indicated in (c) with a white box) on a mixed monolayer
on TS gold reveal a micron-sized structure. The brightness of each
pixel indicates the intensity ratio of the Raman bands at 2100 cm"1
(C–D stretching vibrations) and 2900 cm"1 (C–H stretching vibrations).
The Raman spectra from a dark (black) and a bright (gray) pixel of the
high-resolution scan (e) illustrate the relative intensity change of the
two mentioned Raman bands.
Dow
nloa
ded
by E
TH-Z
uric
h on
10
June
201
1Pu
blish
ed o
n 23
Mar
ch 2
011
on h
ttp://
pubs
.rsc.
org
| doi
:10.
1039
/C0C
P028
32K
View Online
This journal is c the Owner Societies 2011 Phys. Chem. Chem. Phys., 2011, 13, 9978–9981 9981
marker bands. Both marker bands are observed in almostevery spectrum of the TERS map with a su"cient signal-to-noise ratio: in 95% of the cases the peak values of the bandsare larger than six times the standard deviation of the observednoise level. By plotting the intensity ratio of the two Ramanbands instead of individual signal intensities, local and temporalfluctuations in the TERS enhancement are eliminated. It cantherefore be assumed that pixel-to-pixel intensity variationsreflect true concentration di!erences of the two lipid compoundsin the corresponding sample volume.
Previous experiments with the same experimental setup16
show that the used step size of 47 nm is well above the actuallateral resolution (r15 nm), which is given by the tip geometryand the gap size. From the surface pressure–area isotherm ofthe d62-DPPC/DOPC mixed monolayer at room temperature(see the ESIw) it has been derived that at a transfer pressure of20 mN m"1, each molecule occupies an area of approx. 71 A2
on average. When we consider a lateral resolution of 15 nm wecan estimate an average of 250 molecules contributing to eachRaman spectrum. No reliable estimation for the achievedsignal enhancement was possible, because no Raman bandscould be obtained from a single lipid monolayer in the absenceof the enhancing silver tip.
Conclusions
In this work, we used TER spectra in the C–H stretchingregion for the first time to demonstrate that it is possible toobtain reproducible Raman bands from a very small numberof lipid molecules. Moreover, the lipid distribution in a mixedsupported lipid monolayer was directly measured with highlateral resolution resulting in the first full-spectral images onphase separated lipid domains. By plotting the ratio of themarker bands, we significantly improve image contrast byreducing variations in signal enhancement during TERS rasterscanning. This evaluation method could be potentially appliedto any other TERS mapping experiment. Future investigationscould focus on TERS imaging using AFM feedback control,which would significantly widen the scope of possible lipidmodel systems because non-conducting substrates and thickerlayers could be used. Scans with a step size of 15 nm or lesscould be carried out to confirm the lateral resolution limit ofthe method. Furthermore, we target similar experiments underphysiological conditions supported by previous work from ourgroup demonstrating the feasibility of AFM-TERS experimentsin aqueous environments.27
Acknowledgements
The authors thank Jia Pei from the Laboratory for SurfaceScience and Technology at the ETH Zurich for air–plasmatreatment of the gold substrates and the ETH for funding thiswork via an Independent Investigators’ Research Award(grant no. ETH-09 10-1).
References
1 K. Simons and E. Ikonen, Nature, 1997, 387, 569.2 J. Korlach, P. Schwille, W. W. Webb and G. W. Feigenson,Proc. Natl. Acad. Sci. U. S. A., 1999, 96, 8461.
3 S. L. Veatch and S. L. Keller, Biophys. J., 2003, 85, 3074.4 L. J. Johnston, Langmuir, 2007, 23, 5886.5 K. Gaus, E. Gratton, E. P. W. Kable, A. S. Jones, I. Gelissen,L. Kritharides andW. Jessup, Proc. Natl. Acad. Sci. U. S. A., 2003,100, 15554.
6 Y. F. Dufrene, W. R. Barger, J.-B. D. Green and G. U. Lee,Langmuir, 1997, 13, 4779.
7 F. Tokumasu, A. J. Jin, G. W. Feigenson and J. A. Dvorak,Biophys. J., 2003, 84, 2609.
8 M.-C. Giocondi, D. Yamamoto, E. Lesniewska, P.-E. Milhiet,T. Ando and C. Le Grimellec, Biochim. Biophys. Acta, Biomembr.,2010, 1798, 703.
9 T. S. van Zanten, J. Gomez, C. Manzo, A. Cambi, J. Buceta,R. Reigada and M. F. Garcıa-Parajo, Proc. Natl. Acad. Sci. U. S. A.,2010, 107, 15437.
10 S. L. Veatch, S. S. W. Leung, R. E. W. Hancock and J. L. Thewalt,J. Phys. Chem. B, 2007, 111, 502.
11 S. W. Hell, Science, 2007, 316, 1153.12 G. W. H. Wurpel, J. M. Schins and M. Muller, J. Phys. Chem. B,
2004, 108, 3400.13 E. O. Potma and X. S. Xie, ChemPhysChem, 2005, 6, 77.14 L. Li, H. Wang and J.-X. Cheng, Biophys. J., 2005, 89, 3480.15 B.-S. Yeo, J. Stadler, T. Schmid, R. Zenobi and W. Zhang,
Chem. Phys. Lett., 2009, 472, 1.16 J. Stadler, T. Schmid and R. Zenobi, Nano Lett., 2010, 10, 4514.17 N. Anderson, A. Hartschuh and L. Novotny, Nano Lett., 2007, 7,
577.18 R. Bohme, M. Richter, D. Cialla, P. Rosch, V. Deckert and
J. Popp, J. Raman Spectrosc., 2009, 40, 1452.19 E. A. Weiss, G. K. Kaufman, J. K. Kriebel, Z. Li, R. Schalek and
G. M. Whitesides, Langmuir, 2007, 23, 9686.20 O. Coban, J. Popov, M. Burger, D. Vobornik and L. J. Johnston,
Biophys. J., 2007, 92, 2842.21 P. Moraille and A. Badia, Langmuir, 2002, 18, 4414.22 X. Chen, N. Lu, H. Zhang, M. Hirtz, L. Wu, H. Fuchs and L. Chi,
J. Phys. Chem. B, 2006, 110, 8039.23 P. Moraille and A. Badia, Angew. Chem., Int. Ed., 2002, 41, 4303.24 C. W. Freudiger, W. Min, B. G. Saar, S. Lu, G. R. Holtom, C. He,
J. C. Tsai, J. X. Kang and X. S. Xie, Science, 2008, 322, 1857.25 F. Lhert, D. Blaudez, C. Heywang and J.-M. Turlet, Langmuir,
2002, 18, 512.26 D. D. Baldyga and R. A. Dluhy, Chem. Phys. Lipids, 1998, 96, 81.27 T. Schmid, B.-S. Yeo, G. Leong, J. Stadler and R. Zenobi,
J. Raman Spectrosc., 2009, 40, 1392.
Dow
nloa
ded
by E
TH-Z
uric
h on
10
June
201
1Pu
blish
ed o
n 23
Mar
ch 2
011
on h
ttp://
pubs
.rsc.
org
| doi
:10.
1039
/C0C
P028
32K
View Online