Embed Size (px)
Citation preview
Citizens’ Digital Participation Research Report
Research Document
Publication date: 20 March 2009

Citizens’ Digital Participation
Contents
Section Page 1 Executive summary 1
2 Introduction 5
3 Types of digital participation 9 4 Who is participating? 19 5 Channels of digital participation 27 6 Digital participation – awareness and attitudes 37 7 Motivators and barriers 49
Citizens’ Digital Participation
1
Section 1
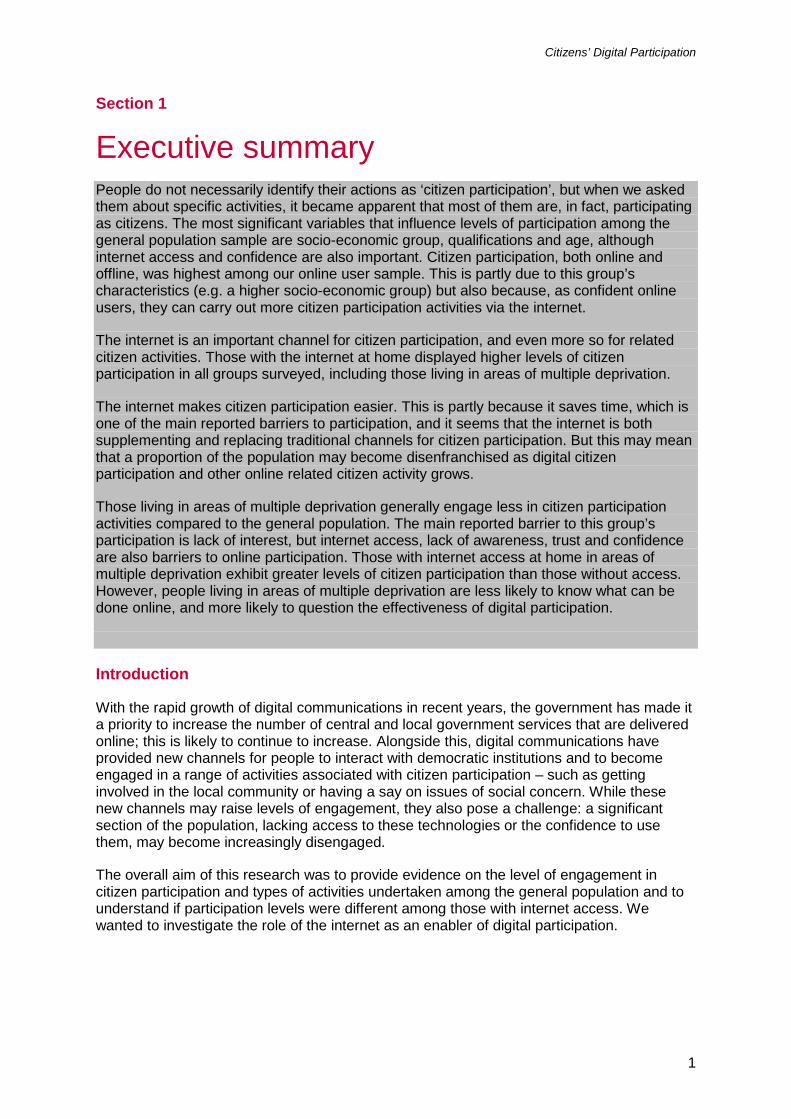
Executive summary People do not necessarily identify their actions as ‘citizen participation’, but when we asked them about specific activities, it became apparent that most of them are, in fact, participating as citizens. The most significant variables that influence levels of participation among the general population sample are socio-economic group, qualifications and age, although internet access and confidence are also important. Citizen participation, both online and offline, was highest among our online user sample. This is partly due to this group’s characteristics (e.g. a higher socio-economic group) but also because, as confident online users, they can carry out more citizen participation activities via the internet.
The internet is an important channel for citizen participation, and even more so for related citizen activities. Those with the internet at home displayed higher levels of citizen participation in all groups surveyed, including those living in areas of multiple deprivation.
The internet makes citizen participation easier. This is partly because it saves time, which is one of the main reported barriers to participation, and it seems that the internet is both supplementing and replacing traditional channels for citizen participation. But this may mean that a proportion of the population may become disenfranchised as digital citizen participation and other online related citizen activity grows.
Those living in areas of multiple deprivation generally engage less in citizen participation activities compared to the general population. The main reported barrier to this group’s participation is lack of interest, but internet access, lack of awareness, trust and confidence are also barriers to online participation. Those with internet access at home in areas of multiple deprivation exhibit greater levels of citizen participation than those without access. However, people living in areas of multiple deprivation are less likely to know what can be done online, and more likely to question the effectiveness of digital participation.
Introduction
With the rapid growth of digital communications in recent years, the government has made it a priority to increase the number of central and local government services that are delivered online; this is likely to continue to increase. Alongside this, digital communications have provided new channels for people to interact with democratic institutions and to become engaged in a range of activities associated with citizen participation – such as getting involved in the local community or having a say on issues of social concern. While these new channels may raise levels of engagement, they also pose a challenge: a significant section of the population, lacking access to these technologies or the confidence to use them, may become increasingly disengaged.
The overall aim of this research was to provide evidence on the level of engagement in citizen participation and types of activities undertaken among the general population and to understand if participation levels were different among those with internet access. We wanted to investigate the role of the internet as an enabler of digital participation.
Citizens’ Digital Participation
2
We defined citizen participation as taking part in:
• activities to do with interacting with democratic institutions (including registering to vote in elections and voting; joining or donating money to a political party; contacting an elected representative or government department or local authority; taking part in a government survey or consultation);
• activities to do with campaigning more generally (including signing a petition, joining or donating to a campaigning organisation; boycotting a product or service; taking part in a protest or demonstration); and
• activities to do with community involvement (including volunteering or doing unpaid work; giving views on issues to people outside one’s immediate circle).
We also asked about ‘related’ citizen activity (e.g. finding out information about local government or council services, or completing a tax return/registering for child tax credits).
The research agency Opinion Leader was commissioned to conduct a quantitative study among three different population groups:
• the UK general population, to identify those engaging in citizen participation;
• online users, to explore online citizen participation; and
• residents of areas of multi-deprivation1
In addition, a small number of ‘vox pop’ interviews were conducted to provide pen portraits and quotes to illustrate the views expressed.
Summary of core findings
The majority of people are engaging in citizen participation
The great majority of the general population have taken part in some type of citizen participation (90% ever, 75% in the last year), with a substantial proportion taking part in multiple activities.
People are participating in a wide range of citizen participation activities
to ensure that their attitudes and behaviours regarding citizen participation were sufficiently represented in this research.
Registering to vote in elections2
1 Based on the latest Index of Multiple Deprivation. The Index of Multiple Deprivation combines a number of indicators, chosen to cover a range of economic, social and housing issues, into a single deprivation score. Specific locations included Townhill in Wales, the BT17 area of Belfast in Northern Ireland, Paisley in Scotland, the OL11 postcode in Rochdale in England and Hackney in London
2 The electoral register is based on registration forms which are sent by local councils to homes every year. There is a legal requirement to return this form. In some local authorities, if household details haven't changed, it is possible to renew your registration online or by telephone. The registration form is also available online.
, voting in elections and signing petitions are the activities that register the highest levels of participation. However, people are also participating in a wide range of other citizen participation activities. Throughout the research we found that people’s actual levels of participation (when prompted) exceeded their unprompted initial awareness of engaging in citizen participation.
Citizens’ Digital Participation
3
There are demographic differences in participation
Within the general population, the middle aged, those in higher socio-economic groups and with higher levels of education report higher levels of participation, as do those with internet access at home. Conversely, younger people, those in lower socio-economic groups and with lower education levels, and those without access to the internet at home, are less likely to take part in any type of citizen participation.
Those with internet access participate more
In addition to demographic and socio-economic variations, having access to the internet emerges as a key differentiating factor for engaging in citizen participation. The findings also indicate that internet access aids participation. This was also evident in the areas of multiple deprivation - those with the internet at home are more likely to participate in citizen activities than those without.
The internet is an important channel for citizen participation and related activities
The internet is used for citizen participation by 13% of the general population. Forty-two per cent have used the internet for a related citizen activity (e.g. completing a government form or process). Seventeen per cent of the general population sample with the internet at home have used it for citizen participation activities and 55% have used the internet for a related citizen activity. In areas of multiple deprivation, 10% of people have used the internet for citizen participation – a slightly lower level than in the general population but not statistically significant. However only 15% have used the internet for a related citizen activity.
Use of the internet for citizen participation was particularly extensive among the online user sample (50% had used it for citizen participation and 84% had completed a related citizen activity online), reflecting their heavy internet use and greater confidence with the internet.
The internet as a channel for citizen participation is most popular for giving views, getting in touch with elected representatives, joining organisations and taking part in surveys and consultations.
However, there is a lack of awareness of possible uses, and issues concerning trust and confidence. There remains a need for complementary offline channels of communication There is a general consensus among respondents that the internet has made it easier to engage in citizen participation activities. However, even among the online user sample, a significant minority (31%) are unaware of online citizen participation opportunities. In areas of multiple deprivation this rises to 72%, suggesting that increased awareness would lead to more people engaging in digital participation. Building awareness of what it is possible to do quickly and easily online could encourage greater participation.
Those in the online user sample were the most favourably disposed to digital participation. Those in areas of multiple deprivation expressed more polarised views, and there was evidence of access, trust and confidence issues. A third of the online user sample (33%) felt that engaging in these activities online was less effective than via other channels. Half of those in areas of multiple deprivation expressed this opinion (51%). A minority of those in the online user sample (9%) said that they did not sufficiently trust using the internet for citizen participation purposes. This rose to almost half (46%) of those from areas of multiple deprivation. Around one in ten (9%) of the online user sample said that they lacked the confidence to engage in citizen-focused digital participation online. This rose to four in ten (40%) among those living in areas of multiple deprivation.
Citizens’ Digital Participation
4
A recurring theme throughout this research was a desire for traditional channels to be preserved, particularly for those without access to, or confidence to use, the internet. Even those who are most favourable about using the internet for citizen participation see a continuing role for traditional channels.
Although lack of access, time, interest, trust and confidence are barriers to participation overall, invitations to participate can trigger action
Lack of time and interest are the main reported barriers to participation (both offline and online), but as mentioned earlier, there is also evidence of lack of trust in the internet for citizen participation activities. For those living in areas of multiple deprivation, barriers to participation include a lack of confidence in speaking up or knowledge about an issue or how to get involved, and for online participation specifically barriers included a lack of internet access/confidence, as well as a feeling amongst some that citizen participation activity on the internet won’t have much effect.
The main motivations for participating are “feeling strongly about the issue” or “feeling duty-bound to participate”. However, being invited to participate can also trigger action.
Citizens’ Digital Participation
5
Section 2
Introduction Background
Society is becoming increasingly reliant on digital communications technology. The world around us is changing rapidly; the various media and communications technologies are becoming an integral part of everyday life. Knowledge of their use is increasingly a prerequisite to effective participation in society and in the economy.
With the rapid growth of digital communications in recent years, it has been a government priority to increase the number of central and local government services that are delivered online, and this trend is likely to continue. Alongside this, digital communications have provided new channels for people to interact with democratic institutions and to become engaged in a range of citizen participation activities, such as getting involved in the local community or having a say on issues of social concern. While these new channels may facilitate increased levels of engagement in civic/community participation, they also pose a challenge: a significant section of the population, lacking access to these technologies or the confidence to use them, may become increasingly disengaged.
Citizens’ digital participation is of interest to Ofcom, the regulator of the UK communications industry, from a media literacy standpoint. Section 11 of the Communications Act 2003 requires Ofcom to promote media literacy. We define media literacy as “the ability to access3
• to give people the opportunity and motivation to develop competence and confidence to participate in digital society; and
, understand and create communications in a variety of contexts.” Our work to promote media literacy is intended:
• to inform and empower people to manage their own media activity (both consumption and creation).
Ofcom is an evidence-based regulator, and we use our portfolio of research to define priorities for action, both for Ofcom and for our stakeholders. Research helps us identify the skills gaps and issues, directs our activity and measures our progress towards achieving our goals.
The overall aim of this research was to provide evidence on the level and type of engagement in citizen participation activities among the general population and to understand if participation levels were different among those with internet access. We wanted to investigate the role of the internet as an enabler of digital participation.
Objectives
The detailed objectives were to:
• identify who is engaging in citizen participation activities;
• explore what types of citizen participation activities people are involved in, including central government, local government and wider citizen issues;
3 ‘Access’ in this context refers to the ability to use, navigate and manage equipment, content and services rather than to the availability of services.
Citizens’ Digital Participation
6
• explore how participation online compares to traditional methods of citizen participation; and
• identify barriers to participation and what might encourage/motivate participation.
Defining and measuring citizen participation
It is difficult to define citizen participation in a way that is meaningful for lay audiences and can enable accurate measurement of the level and type of citizen participation. The issues considered when scoping the definition included:
• Is citizen participation more than just strictly political activities?
• What sort of involvement is required?
• Does citizen participation include compulsory activities like registering to vote?
We defined citizen participation activities as:
• activities that are to do with interacting with democratic institutions (including registering to vote and voting in elections; joining or donating money to a political party; contacting an elected representative or government department or local authority; taking part in a government survey or consultation);
• activities that are to do with campaigning more generally (including signing a petition, joining or donating to a campaigning organisation; boycotting a product or service; taking part in a protest or demonstration); and
• activities that are to do with community involvement (including volunteering or doing unpaid work; giving views on issues to people outside one’s immediate circle).
We also asked about ‘related’ citizen activity (e.g. finding out information about local government or council services or completing a tax return/registering for child tax credits).
Methodology
Opinion Leader was commissioned to conduct a quantitative study to meet the above objectives. The research was undertaken in two phases among three different population groups:
Phase 1
• Research among the UK general population to identify those engaging in citizen participation
o Nationally representative sample of 2069 adults aged 16+ years.
o Face-to-face interviews across the UK via a random location omnibus survey4
4 An omnibus survey is survey conducted weekly in which a multiple number of clients can ask questions.
between 13th and 18th November 2008.
Citizens’ Digital Participation
7
Phase 2
• Online user survey in order to explore further digital participation among online users.
o Representative sample of 2003 adults in the UK who have internet access.
o Interviews conducted online via an online user panel5
• Multiple deprivation areas
between 3rd and 11th December 2008.
6
o Sample of 100 adults living in selected areas of multiple deprivation across the UK and demographically representative of these areas.
boost: Research among residents of areas of multiple deprivation to ensure that their attitudes and behaviours regarding citizen participation were sufficiently represented in this research.
o Face-to-face interviews via a bespoke survey in five areas of multiple deprivation between 3rd and 11th December 2008.
In addition, 12 filmed ‘vox pop’ interviews7
• the general UK population;
about digital participation were conducted. Some of the participants who were interviewed had previously completed the online survey, while others were recruited specifically for the ‘vox pops’. The interviews were conducted and filmed by Opinion Leader’s sister company, Naked Eye, which specialises in ethnographic research. Although this report is based primarily on the findings from quantitative research, ‘vox pop’ interviews have also been used to develop pen portraits (i.e. short summaries to give a background to a particular person’s situation) and to provide quotes to illustrate the views expressed.
A note on sub-group analysis
As previously mentioned, the findings in this report draw on three different samples:
• online users; and
• those living in areas of multiple deprivation.
The online user analysis is based on the online sample, which shows statistically significant differences8
5 To gain the required response rates most online research requires potential participants to be sent emails with a link to the survey. Online panels use digital and non-digital advertising to build up lists of large numbers of consumer email addresses, along with basic demographic information, of people who are willing to take part in online surveys. Participants receive a small incentive for taking part in surveys, such as entry into a prize draw or points which they can collect and ‘spend’ on particular goods. As there is a risk that such panel members may not be representative of the online community or that they may respond to surveys very regularly, most online panels (including the one used in this research) build up a very large number of members and prevent people from completing surveys more than once every three to six months. 6 The locations were chosen based on the latest Index of Multiple Deprivation. The Index of Multiple Deprivation combines a number of indicators, chosen to cover a range of economic, social and housing issues, into a single deprivation score. Specific locations included Townhill in Wales, the BT17 are of Belfast in Northern Ireland, Paisley in Scotland, the OL11 postcode in Rochdale in England and Hackney in London. 7 Vox pop interviews were filmed qualitative depth interviews in which participants were asked to describe their participation, how they use the internet to participate, what motivates them to participate and what stops them from participating. 8 Significance testing at the 95% confidence interval was carried out on the quantitative results reported here. This means that where findings are reported as ‘significant’ there is only a 5% or less probability that the differences between the samples is by chance, and is different from the general population.
to the general population on a number of key questions. The sub-group within
Citizens’ Digital Participation
8
the general population who have internet access at home also shows some differences on some measures but to a less pronounced degree. Any significant differences between those with internet access at home and those without in the general population have also been highlighted throughout this report, where relevant.
The data indicate that the reason for the differences between the online user sample and the general population with the internet at home sample is due to the online user sample being comparatively younger and of a higher socio-economic grade compared to the population overall. This is because the online sample is representative of the online population rather than the general population in terms of demographics. In addition, there are more heavy and confident online users in the online user sample. The online user sample is therefore also likely to show some attitudinal differences compared to the general population with internet access. There may also be a research effect at play - the fact that these respondents have enlisted to be members of an online user survey may also indicate that they are more participatory by nature. This may also influence their levels of citizen participation. We have therefore been careful to consider both the online sample and those in the general population with the internet at home in all the analysis on digital participation.
The sample of residents of multiple deprivation areas also shows some key differences to the general population, which have been highlighted throughout this report. People living in areas of multiple deprivation are in a lower socio-economic group (mainly D and E) and are less likely to have internet access at home than are the general population. They are also less likely to have higher education or qualifications and more likely to be unemployed. Within this sample, some variations also exist between those with the internet at home and those without – these differences have been identified where they occur.
A note on base sizes
Due to the small nature of some of the subgroups within different samples any subgroup analysis with a base size under 50 has not been referenced.9
9 However in the area of multiple deprivation sample there is one subgroup with a base size of just less than 50 that show statistically significant differences compared to the total so have been included as indicative. This is internet used at home (48);
Any bases sizes between 50 and 100 have been marked in the main body of the report with an asterisk (*) to show that the findings are indicative only.
See annexes 1-3 for details on sample, further demographic analysis and questionnaires. The annexes are available online at: www.ofcom.org.uk/advice/media_literacy/
Citizens’ Digital Participation
9
Section 3
Types of citizen participation This section of the report analyses:
• which citizen participation activities our survey participants have engaged in; ‘ever’ and ‘in the last year’;
• their awareness of what constitutes civic/community activities.
Summary
The distribution of citizen participation activities in which participants engage was similar across the three samples of the UK general population, among online users and those living in areas of multiple deprivation:
• The highest levels of participation were recorded for registering to vote10
• The lowest levels of participation were recorded for joining, or donating money to, a political party.
, voting in an election, and signing a petition.
Participation in community activities, particularly community campaigning (e.g. signing a petition or donating to a campaigning organisation), exceeds most political activities.
The online user sample showed a higher level of participation in all activities, both online and offline. Those from the general UK population with the internet at home were also more likely to participate, but the difference was less pronounced compared to the online user sample. This higher level of participation is likely to be related to differences in the profile of the two audiences (see Section 2).
Those in areas of multiple deprivation report lower levels of citizen participation. However, as with the general population sample, those living in areas of multiple deprivation who have the internet at home participate in citizen activities more than those without. This is true both for online and offline activities, indicating that the difference is likely to be related to the type of people who have the internet at home and to the activities that internet access allows them to do.
Frequency of citizen participation in each pre-defined activity
Participants in all three surveys were provided with a list of specific citizen participation activities and asked to indicate which of these activities they had undertaken ‘ever’ and ‘in the past year’. Figure 1 shows data for participation in respondents’ lifetimes; Figure 2 shows the responses for participation in the past year.
10 The electoral register is based on registration forms which are sent by local councils to homes every year. There is a legal requirement to return this form. In some local authorities, if household details haven't changed, it is possible to renew your registration online or by telephone. The registration form is also available online.
Citizens’ Digital Participation
10
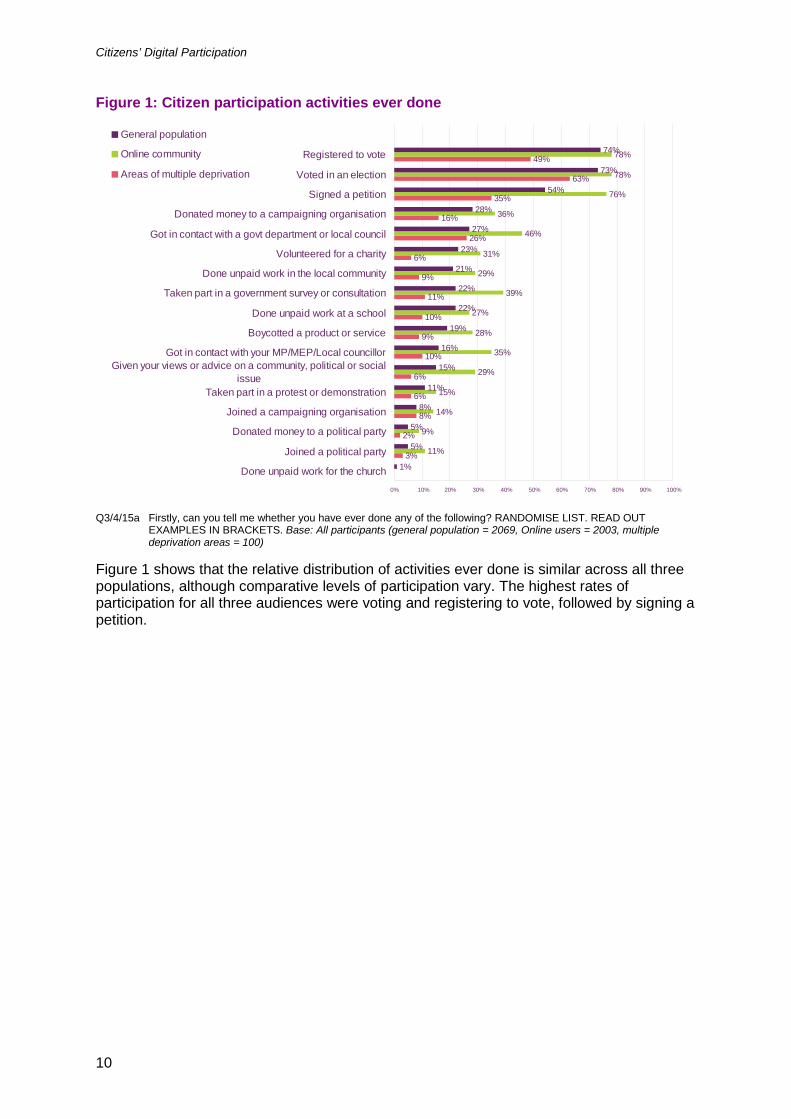
Figure 1: Citizen participation activities ever done
3%
2%
8%
6%
6%
10%
9%
10%
11%
9%
6%
26%
16%
35%
63%
49%
11%
9%
14%
15%
29%
35%
28%
27%
39%
29%
31%
46%
36%
76%
78%
78%
1%
5%
5%
8%
11%
15%
16%
19%
22%
22%
21%
23%
27%
28%
54%
73%
74%
0% 10% 20% 30% 40% 50% 60% 70% 80% 90% 100%
Done unpaid work for the church
Joined a political party
Donated money to a political party
Joined a campaigning organisation
Taken part in a protest or demonstration
Given your views or advice on a community, political or socialissue
Got in contact with your MP/MEP/Local councillor
Boycotted a product or service
Done unpaid work at a school
Taken part in a government survey or consultation
Done unpaid work in the local community
Volunteered for a charity
Got in contact with a govt department or local council
Donated money to a campaigning organisation
Signed a petition
Voted in an election
Registered to vote
General population
Online community
Areas of multiple deprivation
Q3/4/15a Firstly, can you tell me whether you have ever done any of the following? RANDOMISE LIST. READ OUT
EXAMPLES IN BRACKETS. Base: All participants (general population = 2069, Online users = 2003, multiple deprivation areas = 100)
Figure 1 shows that the relative distribution of activities ever done is similar across all three populations, although comparative levels of participation vary. The highest rates of participation for all three audiences were voting and registering to vote, followed by signing a petition.
Citizens’ Digital Participation
11
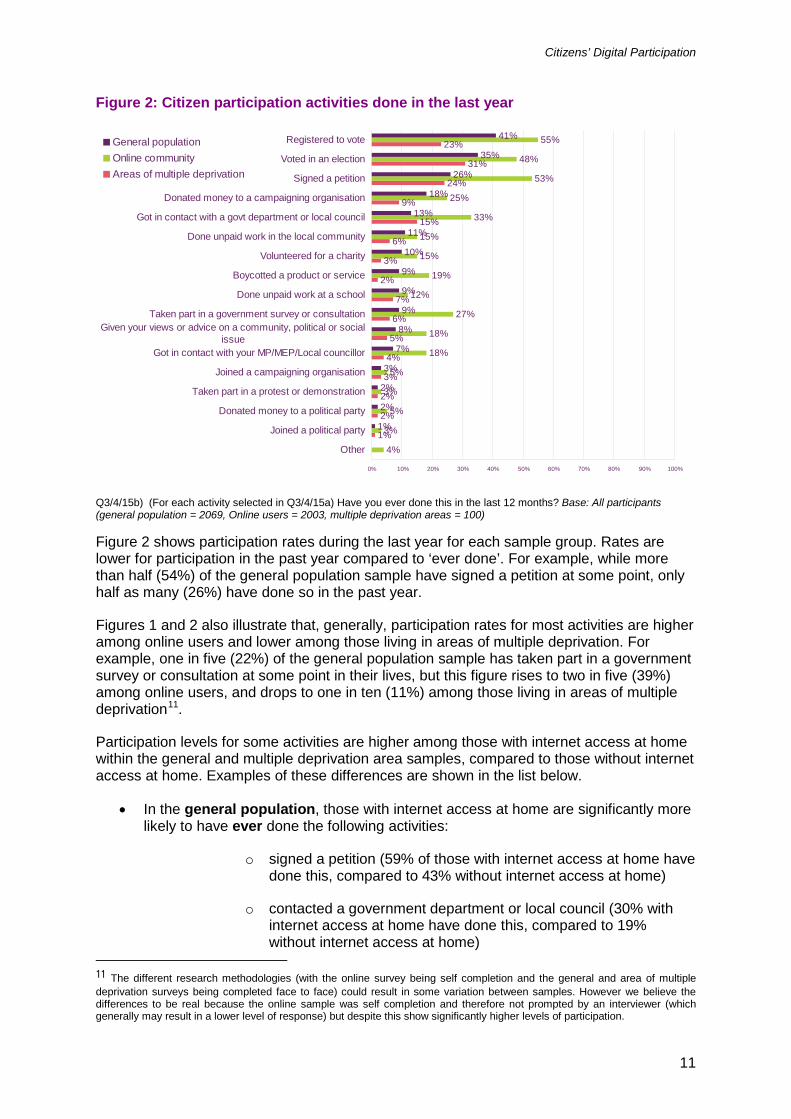
Figure 2: Citizen participation activities done in the last year
1%
2%
2%
3%
4%
5%
6%
7%
2%
3%
6%
15%
9%
24%
31%
23%
4%
3%
5%
3%
5%
18%
18%
27%
12%
19%
15%
15%
33%
25%
53%
48%
55%
1%
2%
2%
3%
7%
8%
9%
9%
9%
10%
11%
13%
18%
26%
35%
41%
0% 10% 20% 30% 40% 50% 60% 70% 80% 90% 100%
Other
Joined a political party
Donated money to a political party
Taken part in a protest or demonstration
Joined a campaigning organisation
Got in contact with your MP/MEP/Local councillor
Given your views or advice on a community, political or socialissue
Taken part in a government survey or consultation
Done unpaid work at a school
Boycotted a product or service
Volunteered for a charity
Done unpaid work in the local community
Got in contact with a govt department or local council
Donated money to a campaigning organisation
Signed a petition
Voted in an election
Registered to voteGeneral populationOnline communityAreas of multiple deprivation
Q3/4/15b) (For each activity selected in Q3/4/15a) Have you ever done this in the last 12 months? Base: All participants (general population = 2069, Online users = 2003, multiple deprivation areas = 100) Figure 2 shows participation rates during the last year for each sample group. Rates are lower for participation in the past year compared to ‘ever done’. For example, while more than half (54%) of the general population sample have signed a petition at some point, only half as many (26%) have done so in the past year.
Figures 1 and 2 also illustrate that, generally, participation rates for most activities are higher among online users and lower among those living in areas of multiple deprivation. For example, one in five (22%) of the general population sample has taken part in a government survey or consultation at some point in their lives, but this figure rises to two in five (39%) among online users, and drops to one in ten (11%) among those living in areas of multiple deprivation11
• In the general population, those with internet access at home are significantly more likely to have ever done the following activities:
.
Participation levels for some activities are higher among those with internet access at home within the general and multiple deprivation area samples, compared to those without internet access at home. Examples of these differences are shown in the list below.
o signed a petition (59% of those with internet access at home have done this, compared to 43% without internet access at home)
o contacted a government department or local council (30% with internet access at home have done this, compared to 19% without internet access at home)
11 The different research methodologies (with the online survey being self completion and the general and area of multiple deprivation surveys being completed face to face) could result in some variation between samples. However we believe the differences to be real because the online sample was self completion and therefore not prompted by an interviewer (which generally may result in a lower level of response) but despite this show significantly higher levels of participation.
Citizens’ Digital Participation
12
o done unpaid work at a school (26% with internet access at home have done this, compared to 9% without internet access at home)
o taken part in a government survey or consultation (25% with internet access at home have done this, compared 12% without internet access at home).
• In the general population, those with internet access at home are significantly more likely to have done the following activities in the past year:
o signed a petition (30% of those with internet access at home have done this, compared to 17% without internet access at home)
o done unpaid work at a school (11% with internet access at home have done this, compared to 3% without internet access at home).
• In the multiple deprivation area sample, those with internet access at home are significantly more likely to have ever done the following activities compared to those without access12
o done unpaid work at a school
:
o taken part in a protest or demonstration
o volunteered for a charity
o given their views or advice on a community, political or social issue to people outside their immediate circle
• In the multiple deprivation area population, those with internet access at home are significantly more likely to have done the following activities in the past year:
o signed a petition
o done unpaid work at a school
12 This is indicative only, treat with caution due to small base size.
Citizens’ Digital Participation
13
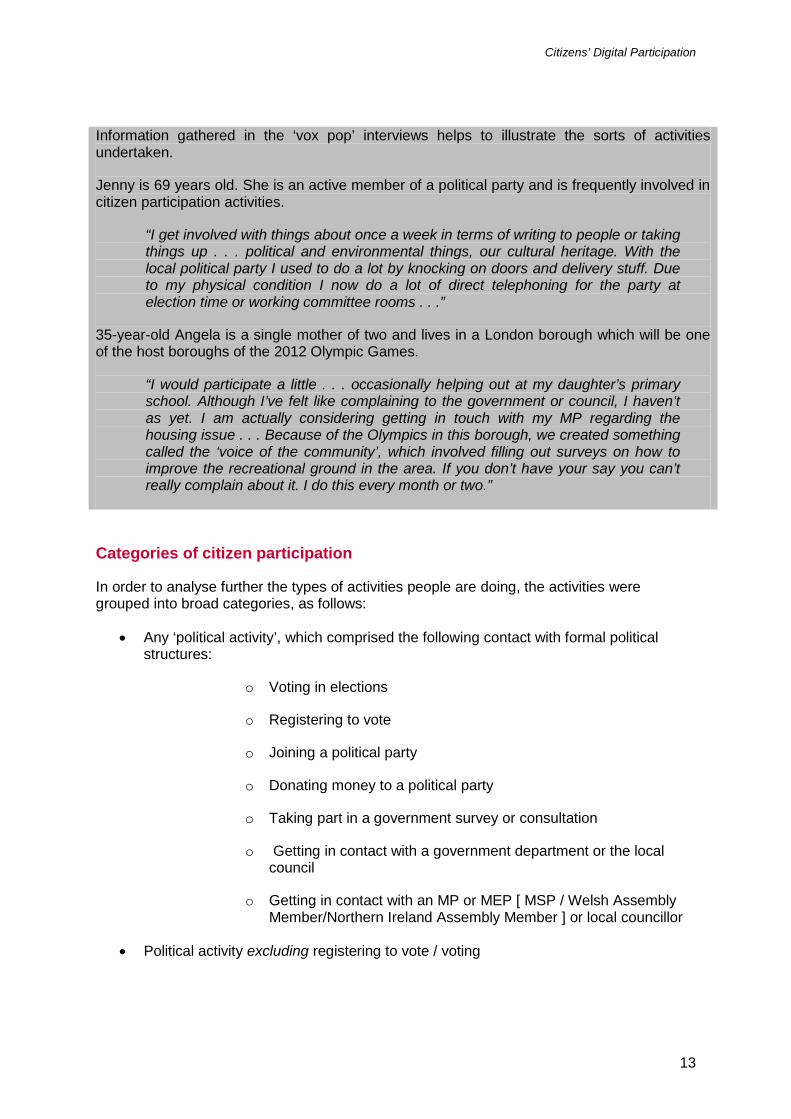
Information gathered in the ‘vox pop’ interviews helps to illustrate the sorts of activities undertaken.
Jenny is 69 years old. She is an active member of a political party and is frequently involved in citizen participation activities.
“I get involved with things about once a week in terms of writing to people or taking things up . . . political and environmental things, our cultural heritage. With the local political party I used to do a lot by knocking on doors and delivery stuff. Due to my physical condition I now do a lot of direct telephoning for the party at election time or working committee rooms . . .”
35-year-old Angela is a single mother of two and lives in a London borough which will be one of the host boroughs of the 2012 Olympic Games.
“I would participate a little . . . occasionally helping out at my daughter’s primary school. Although I’ve felt like complaining to the government or council, I haven’t as yet. I am actually considering getting in touch with my MP regarding the housing issue . . . Because of the Olympics in this borough, we created something called the ‘voice of the community’, which involved filling out surveys on how to improve the recreational ground in the area. If you don’t have your say you can’t really complain about it. I do this every month or two.”
Categories of citizen participation
In order to analyse further the types of activities people are doing, the activities were grouped into broad categories, as follows:
• Any ‘political activity’, which comprised the following contact with formal political structures:
o Voting in elections
o Registering to vote
o Joining a political party
o Donating money to a political party
o Taking part in a government survey or consultation
o Getting in contact with a government department or the local council
o Getting in contact with an MP or MEP [ MSP / Welsh Assembly Member/Northern Ireland Assembly Member ] or local councillor
• Political activity excluding registering to vote / voting
Citizens’ Digital Participation
14
• Any ‘community activity’ – essentially activity outside formal political structures - comprising:
o Taking part in a protest or demonstration
o Joining a campaigning organisation
o Donating money to a campaigning organisation
o Signing a petition
o Boycotting a product or service
o Volunteering for a charity
o Doing unpaid work at a school
o Doing unpaid work in the local community
o Giving views or advice on a community, political or social issue to people outside one’s immediate circle
• Community campaigning activity, comprising:
o Taking part in a protest or demonstration
o Joining a campaigning organisation
o Donating money to a campaigning organisation
o Signing a petition
o Boycotting a product or service
• Community non-campaigning activity, comprising:
o Volunteering for a charity
o Doing unpaid work at a school
o Doing unpaid work in the local community
o Giving views or advice on a community, political or social issue to people outside one’s immediate circle
Figure 3 shows participation levels in these grouped activities ‘ever’ and Figure 4 shows participation in these grouped activities within the past year.
Citizens’ Digital Participation
15
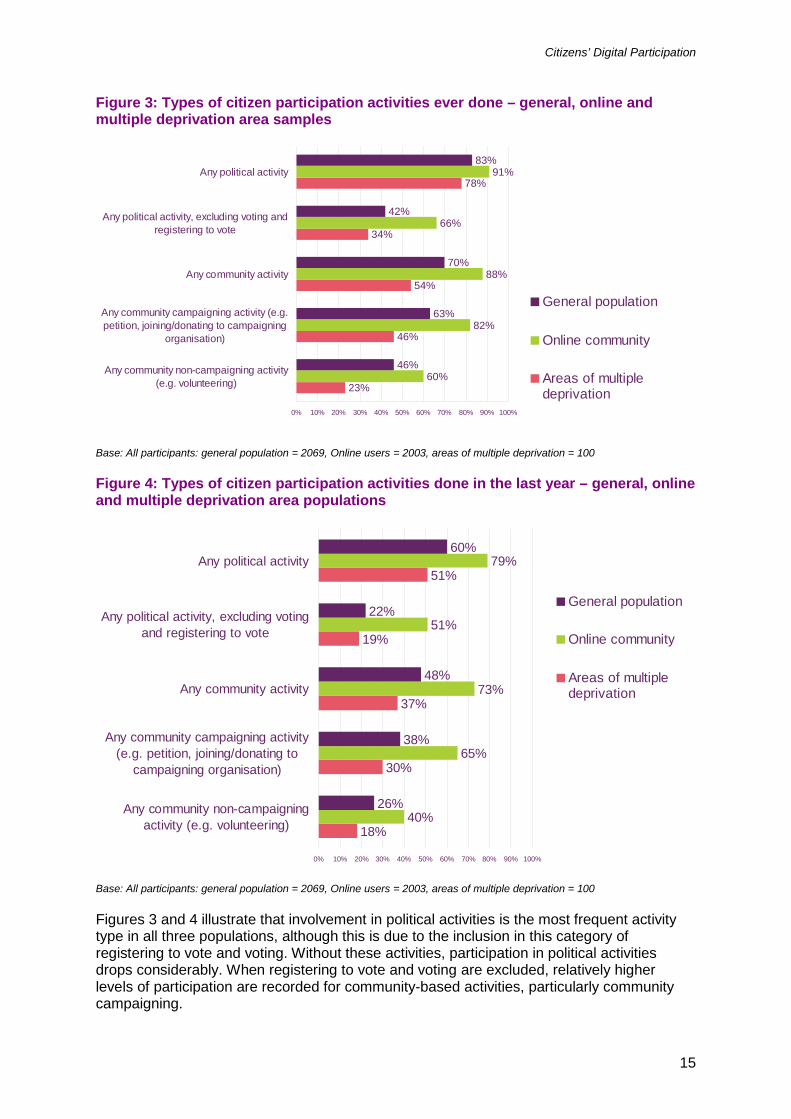
Figure 3: Types of citizen participation activities ever done – general, online and multiple deprivation area samples
23%
46%
54%
34%
78%
60%
82%
88%
66%
91%
46%
63%
70%
42%
83%
0% 10% 20% 30% 40% 50% 60% 70% 80% 90% 100%
Any community non-campaigning activity(e.g. volunteering)
Any community campaigning activity (e.g.petition, joining/donating to campaigning
organisation)
Any community activity
Any political activity, excluding voting andregistering to vote
Any political activity
General population
Online community
Areas of multipledeprivation
Base: All participants: general population = 2069, Online users = 2003, areas of multiple deprivation = 100
Figure 4: Types of citizen participation activities done in the last year – general, online and multiple deprivation area populations
18%
30%
37%
19%
51%
40%
65%
73%
51%
79%
26%
38%
48%
22%
60%
0% 10% 20% 30% 40% 50% 60% 70% 80% 90% 100%
Any community non-campaigningactivity (e.g. volunteering)
Any community campaigning activity(e.g. petition, joining/donating to
campaigning organisation)
Any community activity
Any political activity, excluding votingand registering to vote
Any political activity
General population
Online community
Areas of multipledeprivation
Base: All participants: general population = 2069, Online users = 2003, areas of multiple deprivation = 100
Figures 3 and 4 illustrate that involvement in political activities is the most frequent activity type in all three populations, although this is due to the inclusion in this category of registering to vote and voting. Without these activities, participation in political activities drops considerably. When registering to vote and voting are excluded, relatively higher levels of participation are recorded for community-based activities, particularly community campaigning.
Citizens’ Digital Participation
16
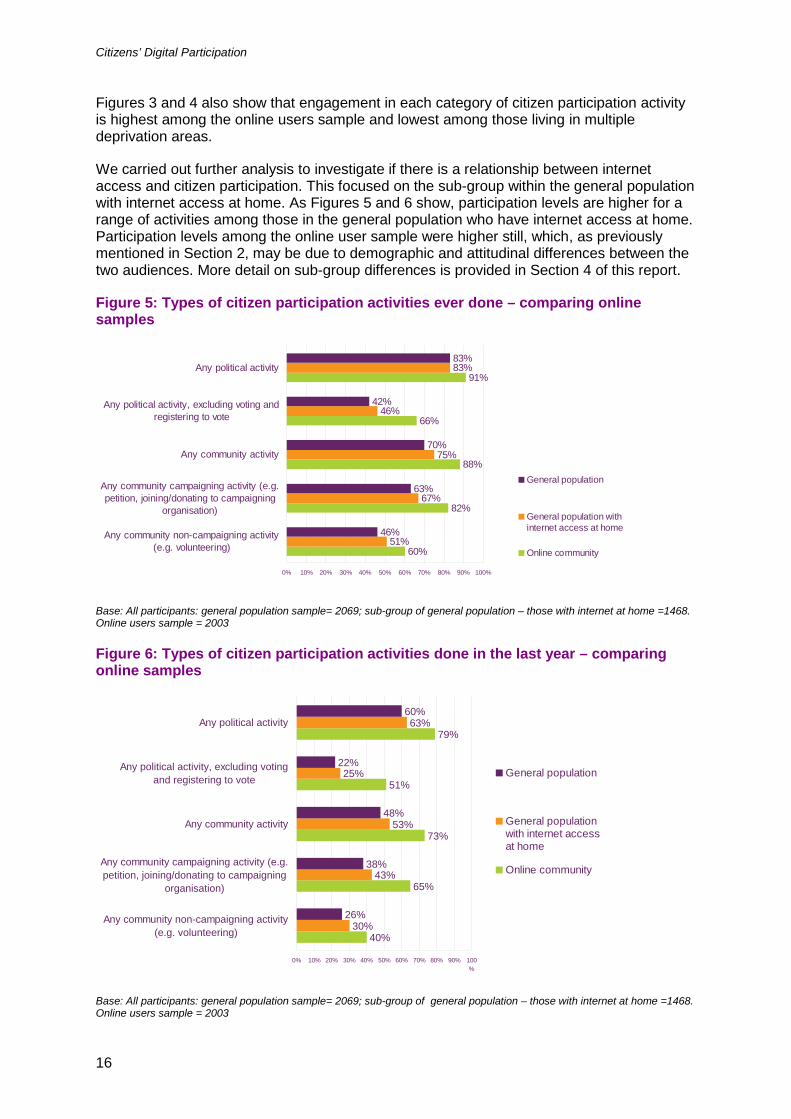
Figures 3 and 4 also show that engagement in each category of citizen participation activity is highest among the online users sample and lowest among those living in multiple deprivation areas.
We carried out further analysis to investigate if there is a relationship between internet access and citizen participation. This focused on the sub-group within the general population with internet access at home. As Figures 5 and 6 show, participation levels are higher for a range of activities among those in the general population who have internet access at home. Participation levels among the online user sample were higher still, which, as previously mentioned in Section 2, may be due to demographic and attitudinal differences between the two audiences. More detail on sub-group differences is provided in Section 4 of this report.
Figure 5: Types of citizen participation activities ever done – comparing online samples
60%
82%
88%
66%
91%
51%
67%
75%
46%
83%
46%
63%
70%
42%
83%
0% 10% 20% 30% 40% 50% 60% 70% 80% 90% 100%
Any community non-campaigning activity(e.g. volunteering)
Any community campaigning activity (e.g.petition, joining/donating to campaigning
organisation)
Any community activity
Any political activity, excluding voting andregistering to vote
Any political activity
General population
General population withinternet access at home
Online community
Base: All participants: general population sample= 2069; sub-group of general population – those with internet at home =1468. Online users sample = 2003
Figure 6: Types of citizen participation activities done in the last year – comparing online samples
40%
65%
73%
51%
79%
30%
43%
53%
25%
63%
26%
38%
48%
22%
60%
0% 10% 20% 30% 40% 50% 60% 70% 80% 90% 100%
Any community non-campaigning activity(e.g. volunteering)
Any community campaigning activity (e.g.petition, joining/donating to campaigning
organisation)
Any community activity
Any political activity, excluding votingand registering to vote
Any political activity
General population
General populationwith internet accessat home
Online community
Base: All participants: general population sample= 2069; sub-group of general population – those with internet at home =1468. Online users sample = 2003
Citizens’ Digital Participation
17
Awareness of how to participate
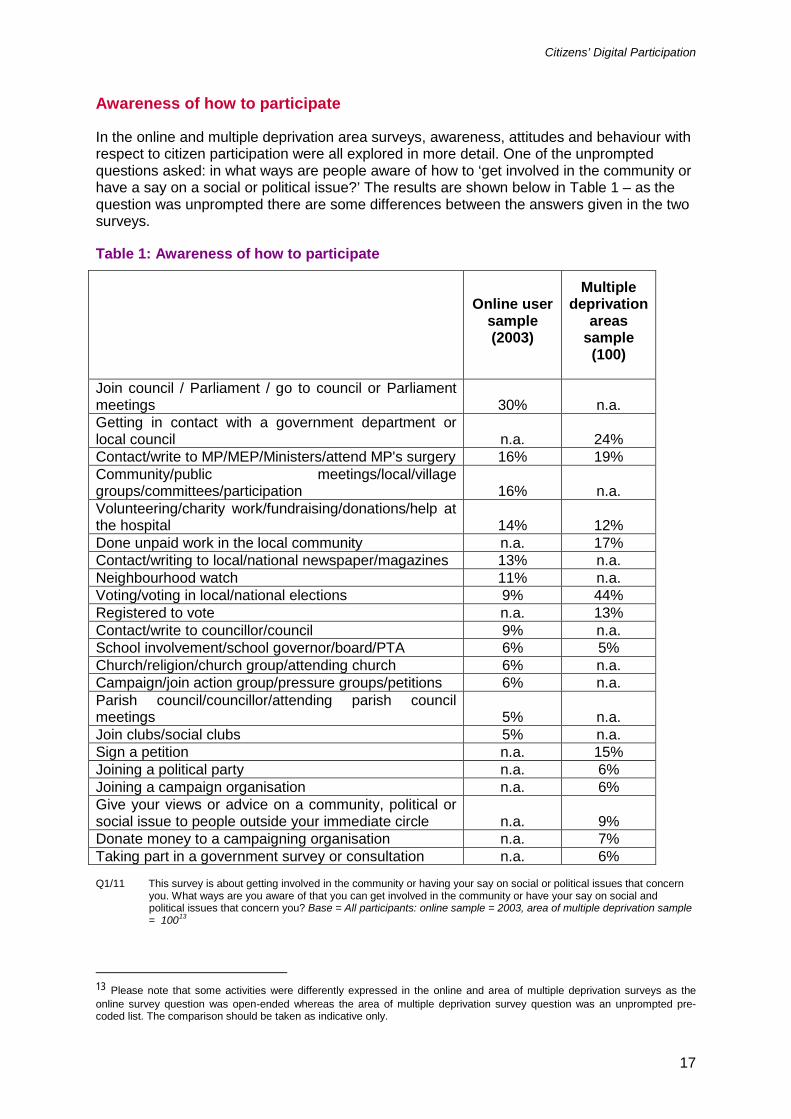
In the online and multiple deprivation area surveys, awareness, attitudes and behaviour with respect to citizen participation were all explored in more detail. One of the unprompted questions asked: in what ways are people aware of how to ‘get involved in the community or have a say on a social or political issue?’ The results are shown below in Table 1 – as the question was unprompted there are some differences between the answers given in the two surveys.
Table 1: Awareness of how to participate
Online user
sample (2003)
Multiple deprivation
areas sample (100)
Join council / Parliament / go to council or Parliament meetings 30% n.a. Getting in contact with a government department or local council n.a. 24% Contact/write to MP/MEP/Ministers/attend MP's surgery 16% 19% Community/public meetings/local/village groups/committees/participation 16% n.a. Volunteering/charity work/fundraising/donations/help at the hospital 14% 12% Done unpaid work in the local community n.a. 17% Contact/writing to local/national newspaper/magazines 13% n.a. Neighbourhood watch 11% n.a. Voting/voting in local/national elections 9% 44% Registered to vote n.a. 13% Contact/write to councillor/council 9% n.a. School involvement/school governor/board/PTA 6% 5% Church/religion/church group/attending church 6% n.a. Campaign/join action group/pressure groups/petitions 6% n.a. Parish council/councillor/attending parish council meetings 5% n.a. Join clubs/social clubs 5% n.a. Sign a petition n.a. 15% Joining a political party n.a. 6% Joining a campaign organisation n.a. 6% Give your views or advice on a community, political or social issue to people outside your immediate circle n.a. 9% Donate money to a campaigning organisation n.a. 7% Taking part in a government survey or consultation n.a. 6% Q1/11 This survey is about getting involved in the community or having your say on social or political issues that concern
you. What ways are you aware of that you can get involved in the community or have your say on social and political issues that concern you? Base = All participants: online sample = 2003, area of multiple deprivation sample = 10013
13 Please note that some activities were differently expressed in the online and area of multiple deprivation surveys as the online survey question was open-ended whereas the area of multiple deprivation survey question was an unprompted pre-coded list. The comparison should be taken as indicative only.
Citizens’ Digital Participation
18
Table 1 shows that levels of (unprompted) awareness about how people can engage in citizen participation activities are generally lower than the actual activities mentioned by respondents when prompted (reported earlier and highlighted in Figures 1 and 2). For example, while four in five (78%) of those in the online user sample had voted in an election, less than one in ten (9%) spontaneously mentioned this as a method of citizen participation.
Interestingly, although reported citizen participation rates are lower among the population in areas of multiple deprivation compared to the online user sample, awareness levels are similar. This may be related to the methodology of the survey. The online user sample was researched using an internet survey, which is not administered by an interviewer, while those in areas of multiple deprivation were researched using a face-to-face questionnaire, which is mediated and provides greater opportunity for probing. It is possible that a lack of awareness as well as other potential barriers prevent participation. These potential barriers are explored in more detail in Section 7 of this report.
Citizens’ Digital Participation
19
Section 4
Who is participating? This section of the report analyses:
• who is more, and less, likely to have engaged in citizen participation activities;
• the numbers of different citizen participation activities in which people are engaging;
• how people classify themselves in terms of their level of citizen participation; and
• changes in levels of citizen participation over the past year.
Summary
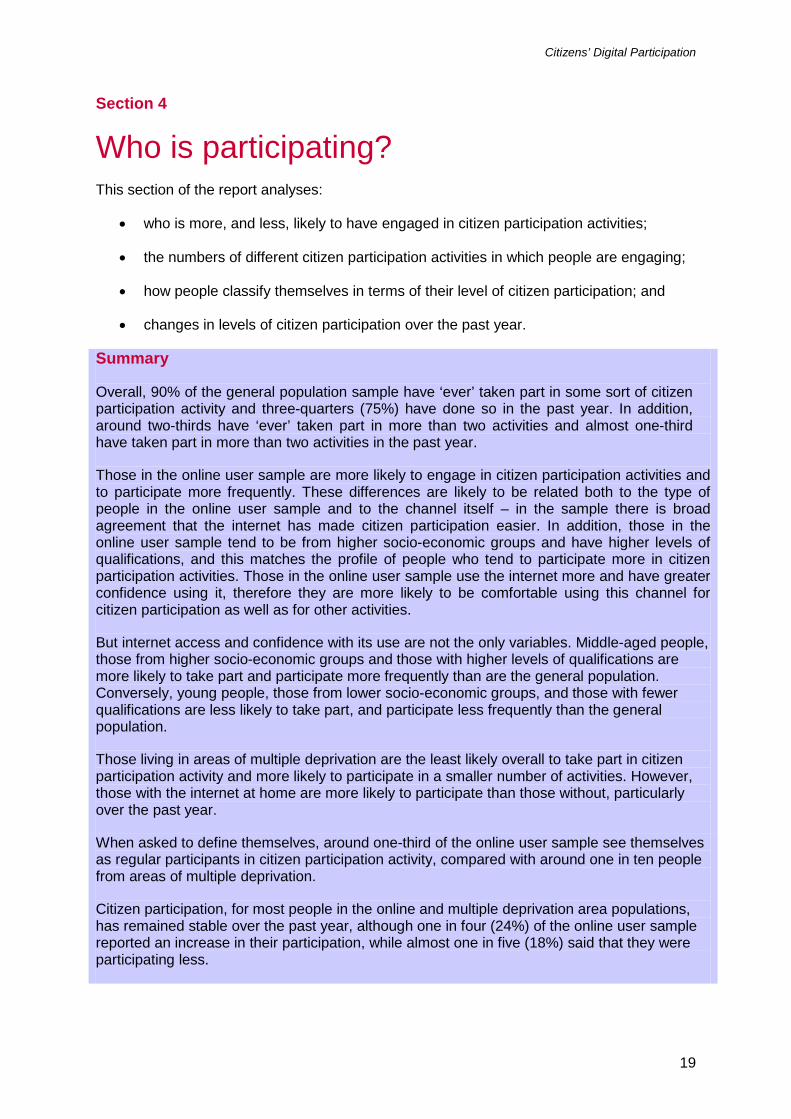
Overall, 90% of the general population sample have ‘ever’ taken part in some sort of citizen participation activity and three-quarters (75%) have done so in the past year. In addition, around two-thirds have ‘ever’ taken part in more than two activities and almost one-third have taken part in more than two activities in the past year.
Those in the online user sample are more likely to engage in citizen participation activities and to participate more frequently. These differences are likely to be related both to the type of people in the online user sample and to the channel itself – in the sample there is broad agreement that the internet has made citizen participation easier. In addition, those in the online user sample tend to be from higher socio-economic groups and have higher levels of qualifications, and this matches the profile of people who tend to participate more in citizen participation activities. Those in the online user sample use the internet more and have greater confidence using it, therefore they are more likely to be comfortable using this channel for citizen participation as well as for other activities.
But internet access and confidence with its use are not the only variables. Middle-aged people, those from higher socio-economic groups and those with higher levels of qualifications are more likely to take part and participate more frequently than are the general population. Conversely, young people, those from lower socio-economic groups, and those with fewer qualifications are less likely to take part, and participate less frequently than the general population.
Those living in areas of multiple deprivation are the least likely overall to take part in citizen participation activity and more likely to participate in a smaller number of activities. However, those with the internet at home are more likely to participate than those without, particularly over the past year.
When asked to define themselves, around one-third of the online user sample see themselves as regular participants in citizen participation activity, compared with around one in ten people from areas of multiple deprivation.
Citizen participation, for most people in the online and multiple deprivation area populations, has remained stable over the past year, although one in four (24%) of the online user sample reported an increase in their participation, while almost one in five (18%) said that they were participating less.
Citizens’ Digital Participation
20
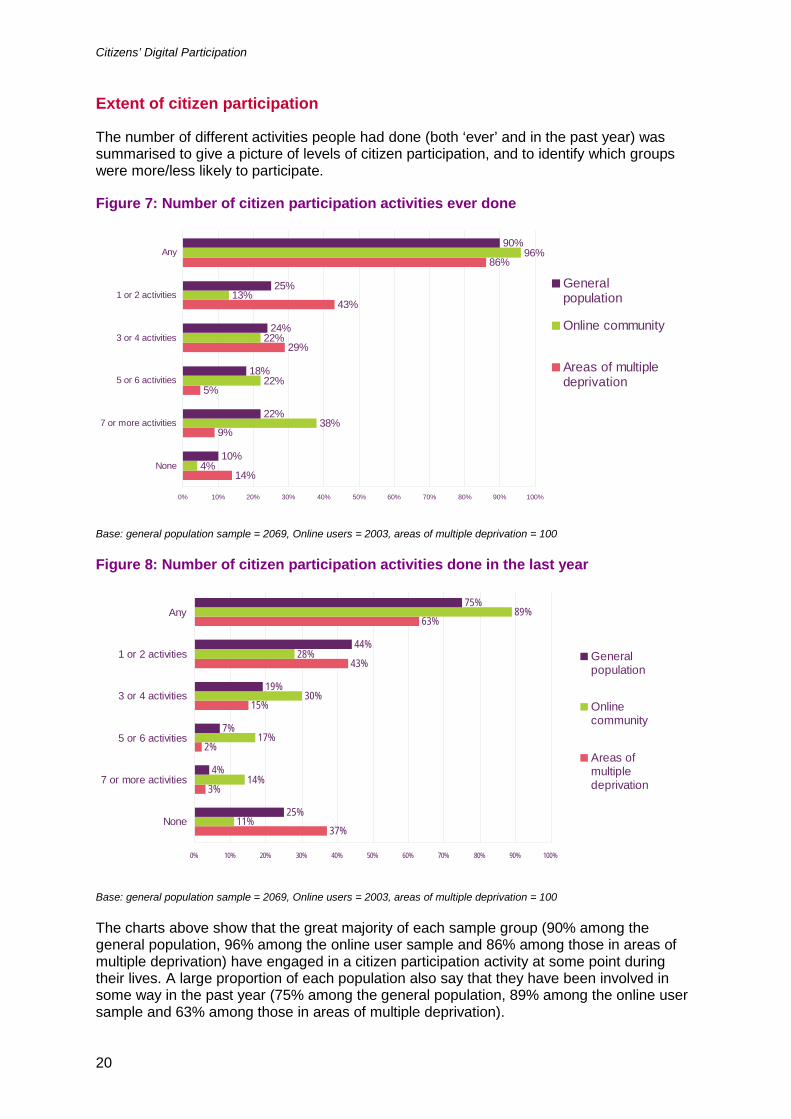
Extent of citizen participation
The number of different activities people had done (both ‘ever’ and in the past year) was summarised to give a picture of levels of citizen participation, and to identify which groups were more/less likely to participate.
Figure 7: Number of citizen participation activities ever done
14%
9%
5%
29%
43%
86%
4%
38%
22%
22%
13%
96%
10%
22%
18%
24%
25%
90%
0% 10% 20% 30% 40% 50% 60% 70% 80% 90% 100%
None
7 or more activities
5 or 6 activities
3 or 4 activities
1 or 2 activities
Any
Generalpopulation
Online community
Areas of multipledeprivation
Base: general population sample = 2069, Online users = 2003, areas of multiple deprivation = 100
Figure 8: Number of citizen participation activities done in the last year
37%
3%
2%
15%
43%
63%
11%
14%
17%
30%
28%
89%
25%
4%
7%
19%
44%
75%
0% 10% 20% 30% 40% 50% 60% 70% 80% 90% 100%
None
7 or more activities
5 or 6 activities
3 or 4 activities
1 or 2 activities
Any
Generalpopulation
Onlinecommunity
Areas ofmultipledeprivation
Base: general population sample = 2069, Online users = 2003, areas of multiple deprivation = 100
The charts above show that the great majority of each sample group (90% among the general population, 96% among the online user sample and 86% among those in areas of multiple deprivation) have engaged in a citizen participation activity at some point during their lives. A large proportion of each population also say that they have been involved in some way in the past year (75% among the general population, 89% among the online user sample and 63% among those in areas of multiple deprivation).
Citizens’ Digital Participation
21
Analysing the number of activities in which people have been involved shows that almost two-thirds (64%) of the general population have undertaken more than two different citizen participation activities in their lifetimes, with more than one in five (22%) having been involved in seven or more activities. Over the past year, people are more likely to have undertaken just one or two activities (44%), although three in ten (31%) have been involved in more than this.
Compared to the general population sample, those in the online user sample are more likely to engage in citizen participation activities, while those living in areas of multiple deprivation are less likely to do so. For example, almost nine in ten (89%) of those in the online user sample report having undertaken citizen participation activities in the past year, compared to less than two-thirds (63%) of those living in areas of multiple deprivation. Those in the online user sample are also more likely to have taken part in a greater number of activities – one in six (14%) of the online sample report taking part in seven or more activities in the past year, whereas only a very small proportion (3%) of those living in areas of multiple deprivation have been involved to this extent.
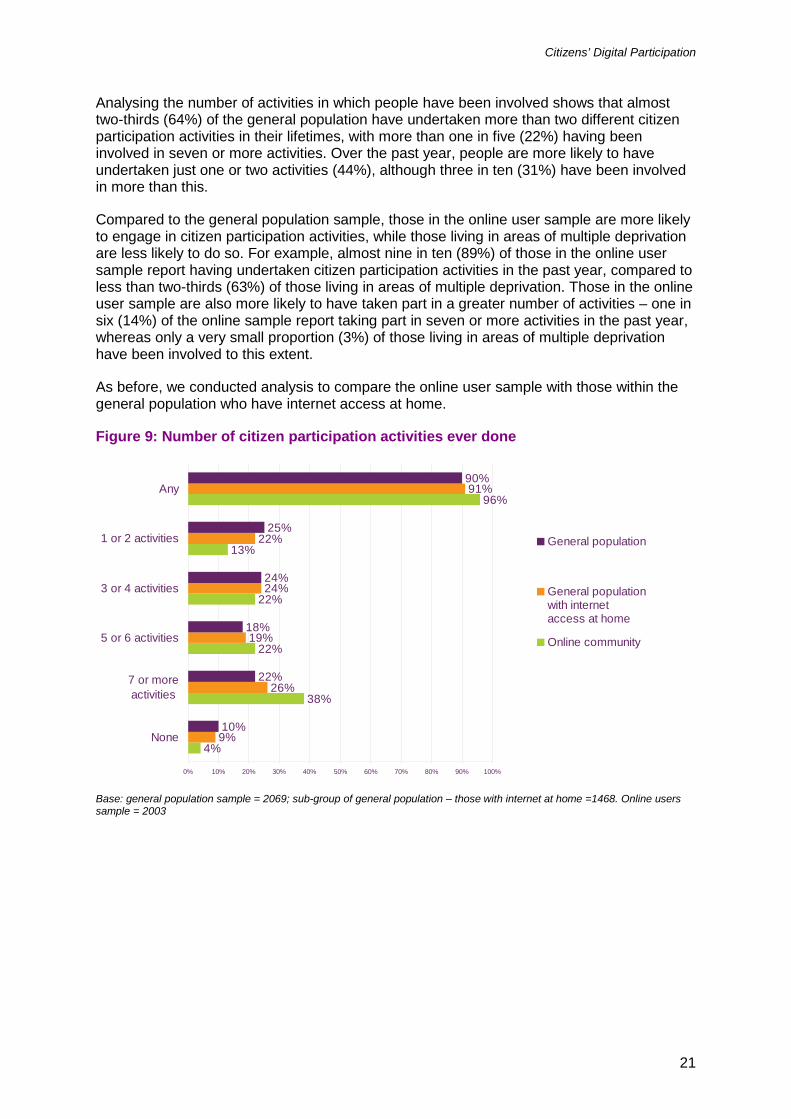
As before, we conducted analysis to compare the online user sample with those within the general population who have internet access at home.
Figure 9: Number of citizen participation activities ever done
4%
38%
22%
22%
13%
96%
9%
26%
19%
24%
22%
91%
10%
22%
18%
24%
25%
90%
0% 10% 20% 30% 40% 50% 60% 70% 80% 90% 100%
None
7 or moreactivities
5 or 6 activities
3 or 4 activities
1 or 2 activities
Any
General population
General populationwith internetaccess at home
Online community
Base: general population sample = 2069; sub-group of general population – those with internet at home =1468. Online users sample = 2003
Citizens’ Digital Participation
22
Figure 10: Number of citizen participation activities done in the last year
11%
14%
17%
30%
28%
89%
21%
6%
9%
21%
43%
79%
25%
4%
7%
19%
44%
75%
0% 10% 20% 30% 40% 50% 60% 70% 80% 90% 100%
None
7 or more activities
5 or 6 activities
3 or 4 activities
1 or 2 activities
Any
Generalpopulation
Generalpopulation withinternet access
Online community
Base: general population sample = 2069; sub-group of general population – those with internet at home =1468. Online users sample = 2003
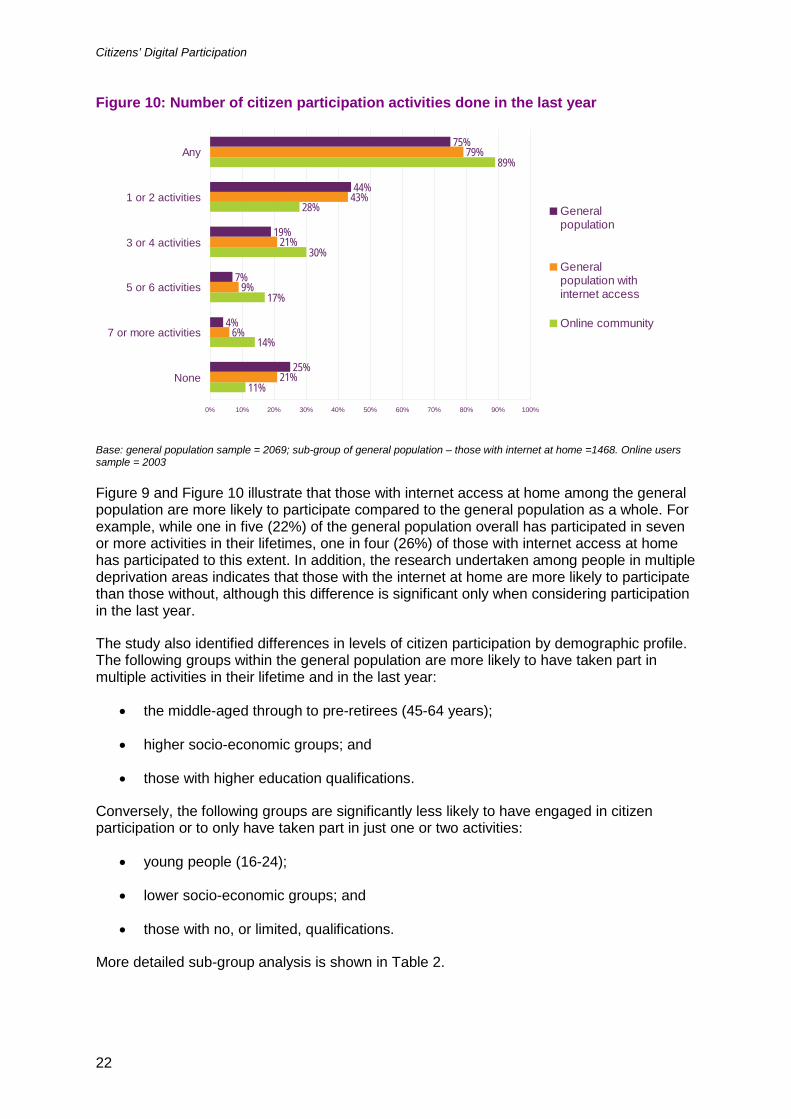
Figure 9 and Figure 10 illustrate that those with internet access at home among the general population are more likely to participate compared to the general population as a whole. For example, while one in five (22%) of the general population overall has participated in seven or more activities in their lifetimes, one in four (26%) of those with internet access at home has participated to this extent. In addition, the research undertaken among people in multiple deprivation areas indicates that those with the internet at home are more likely to participate than those without, although this difference is significant only when considering participation in the last year.
The study also identified differences in levels of citizen participation by demographic profile. The following groups within the general population are more likely to have taken part in multiple activities in their lifetime and in the last year:
• the middle-aged through to pre-retirees (45-64 years);
• higher socio-economic groups; and
• those with higher education qualifications.
Conversely, the following groups are significantly less likely to have engaged in citizen participation or to only have taken part in just one or two activities:
• young people (16-24);
• lower socio-economic groups; and
• those with no, or limited, qualifications.
More detailed sub-group analysis is shown in Table 2.
Citizens’ Digital Participation
23
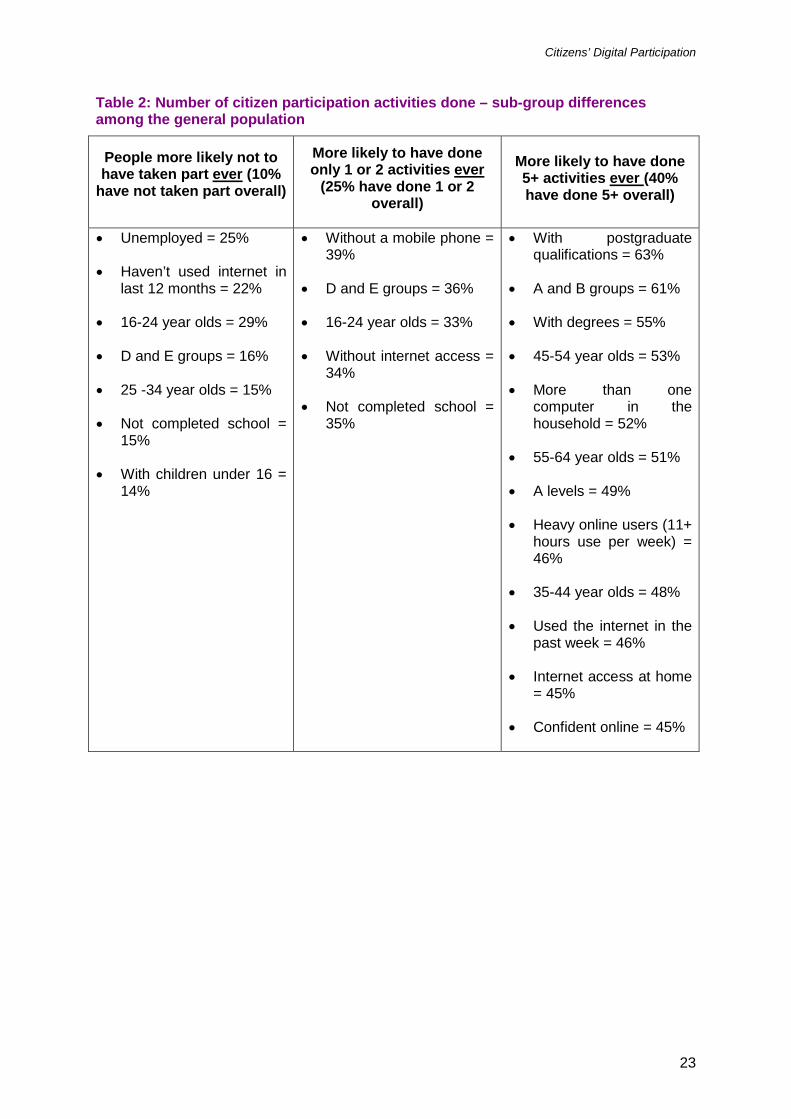
Table 2: Number of citizen participation activities done – sub-group differences among the general population
People more likely not to have taken part ever
More likely to have done only 1 or 2 activities (10%
have not taken part overall) ever More likely to have done
5+ activities (25% have done 1 or 2 overall)
ever (40% have done 5+ overall)
• Unemployed = 25%
• Haven’t used internet in last 12 months = 22%
• 16-24 year olds = 29%
• D and E groups = 16%
• 25 -34 year olds = 15%
• Not completed school = 15%
• With children under 16 = 14%
• Without a mobile phone = 39%
• D and E groups = 36%
• 16-24 year olds = 33%
• Without internet access = 34%
• Not completed school = 35%
• With postgraduate qualifications = 63%
• A and B groups = 61%
• With degrees = 55%
• 45-54 year olds = 53%
• More than one computer in the household = 52%
• 55-64 year olds = 51%
• A levels = 49%
• Heavy online users (11+ hours use per week) = 46%
• 35-44 year olds = 48%
• Used the internet in the past week = 46%
• Internet access at home = 45%
• Confident online = 45%
Citizens’ Digital Participation
24
People more likely not to have taken part
in past year More likely to have done 5+ activities in (25% have not taken part overall) past year (12% have done 5+ overall)
• Unemployed = 50%
• D and E groups = 38%
• Not completed school = 38%
• No mobile phone = 36%
• No internet access = 35%
• No computer at home = 35%
• With postgraduate qualifications = 31%
• A and B groups = 27%
• With degrees = 21%
• Aged 45-54 = 19%
• Heavy online users (11+ hours use per week) = 18%
• Confident online = 16%
• Used the internet in the past week = 15%
• More than one computer in the household = 15%
• Internet access at home = 14%
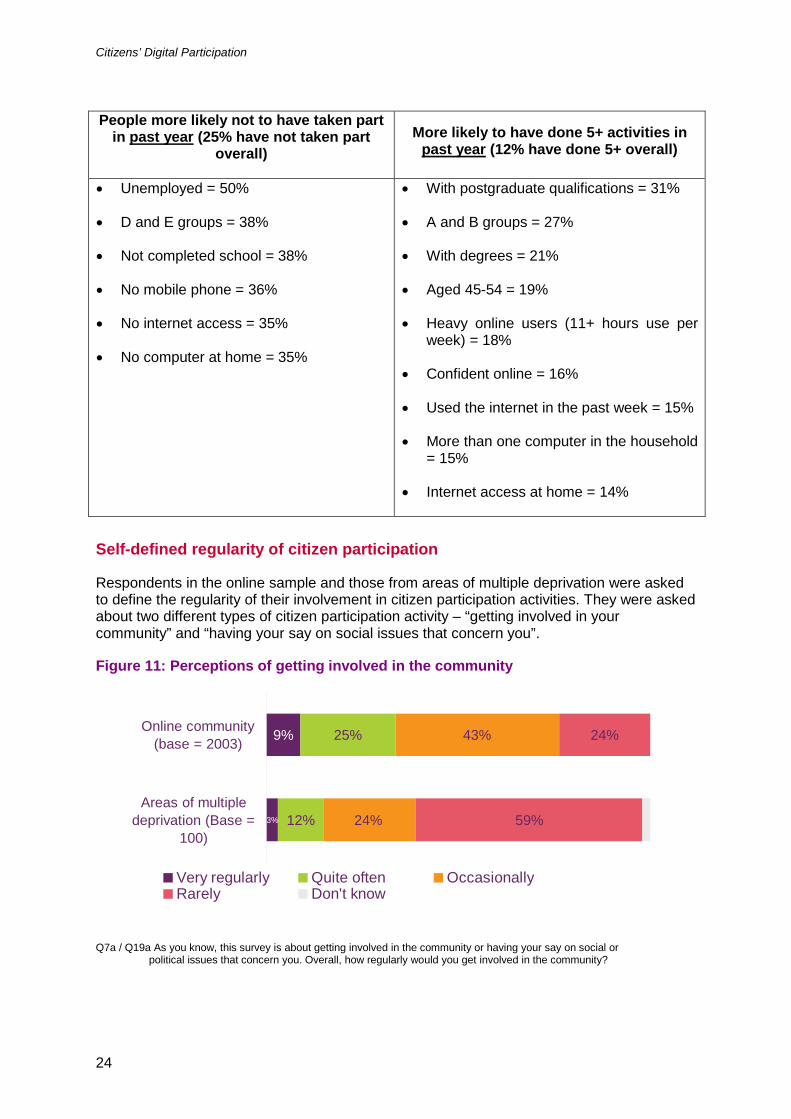
Self-defined regularity of citizen participation
Respondents in the online sample and those from areas of multiple deprivation were asked to define the regularity of their involvement in citizen participation activities. They were asked about two different types of citizen participation activity – “getting involved in your community” and “having your say on social issues that concern you”.
Figure 11: Perceptions of getting involved in the community
9% 25% 43% 24%
3% 12% 24% 59%Areas of multiple
deprivation (Base =100)
Online community(base = 2003)
Very regularly Quite often OccasionallyRarely Don't know
Q7a / Q19a As you know, this survey is about getting involved in the community or having your say on social or political issues that concern you. Overall, how regularly would you get involved in the community?
Citizens’ Digital Participation
25
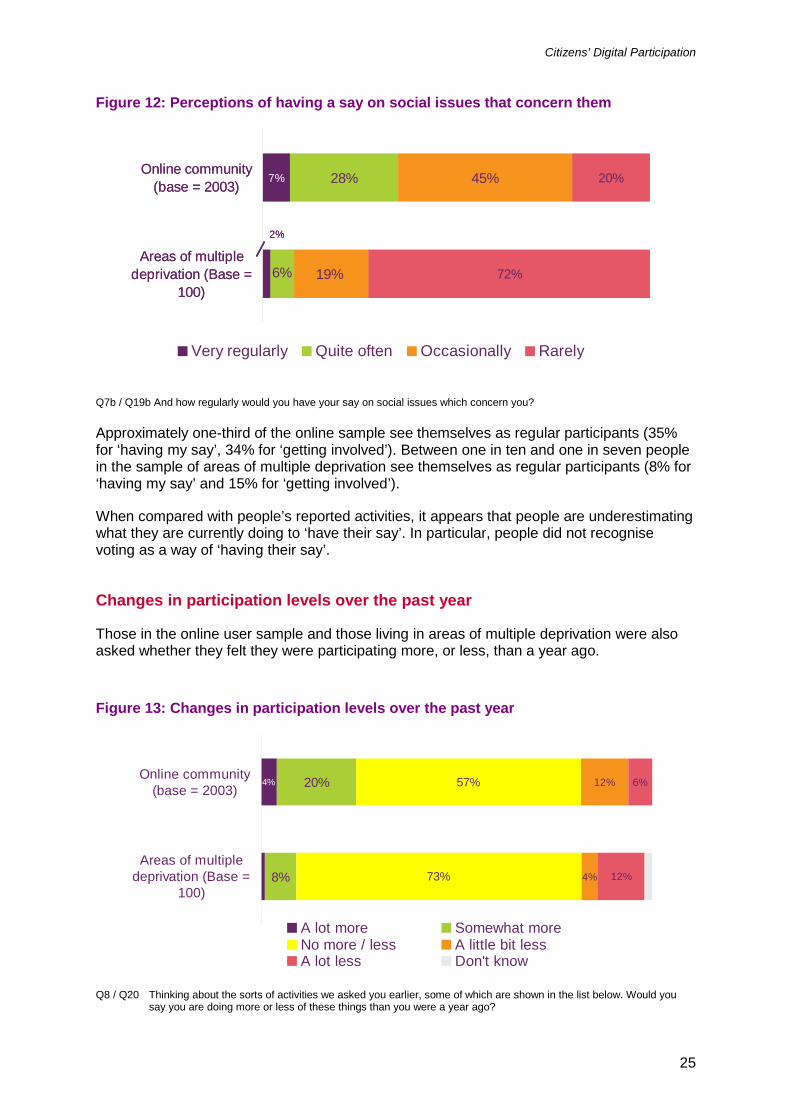
Figure 12: Perceptions of having a say on social issues that concern them
28% 45% 20%7%
2%
6% 19% 72%Areas of multiple
deprivation (Base =100)
Online community(base = 2003)
Very regularly Quite often Occasionally Rarely
28% 45% 20%7%
2%
6% 19% 72%Areas of multiple
deprivation (Base =100)
Online community(base = 2003)
Very regularly Quite often Occasionally Rarely
Q7b / Q19b And how regularly would you have your say on social issues which concern you?
Approximately one-third of the online sample see themselves as regular participants (35% for ‘having my say’, 34% for ‘getting involved’). Between one in ten and one in seven people in the sample of areas of multiple deprivation see themselves as regular participants (8% for ‘having my say’ and 15% for ‘getting involved’).
When compared with people’s reported activities, it appears that people are underestimating what they are currently doing to ‘have their say’. In particular, people did not recognise voting as a way of ‘having their say’.
Changes in participation levels over the past year
Those in the online user sample and those living in areas of multiple deprivation were also asked whether they felt they were participating more, or less, than a year ago.
Figure 13: Changes in participation levels over the past year
4% 20%
73%
57% 12% 6%
8% 4% 12%Areas of multiple
deprivation (Base =100)
Online community(base = 2003)
A lot more Somewhat moreNo more / less A little bit lessA lot less Don't know
Q8 / Q20 Thinking about the sorts of activities we asked you earlier, some of which are shown in the list below. Would you say you are doing more or less of these things than you were a year ago?
Citizens’ Digital Participation
26
Most reported that their level of involvement in citizen participation activities had remained stable over the past year, with those living in areas of multiple deprivation particularly likely to report no change.
One quarter of respondents (24%) in the online user sample perceived that they spend more time participating and just under one in five (18%) stated that they spend less time on these activities. Less than 10% of people in the multiple deprivation areas sample said they spend more time participating compared to 16% saying they spent less time. Reasons for increased and decreased participation are discussed further in Section 7, but in summary, having greater interest and/or more time available are the main reasons for participating more, while a lack of time is the main factor in participating less.
Within the online user sample, there are also some sub-group differences. The following groups are more likely to say they are participating more: those aged between 18-34 (33%), those with children (33%), those who also use the internet at work (31%) and those in AB socio-economic groups (30%). The following groups are more likely to report participating less: those in the C2 socio-economic group (23%), those aged 45-54 (24%) and retired people (23%).
Citizens’ Digital Participation
27
Section 5
Channels of citizen participation This section of the report examines:
• which channels are used for citizen participation activities;
• what sorts of people are more likely to participate online; and
• how people use the internet for citizen participation.
Summary
The internet represents an important channel for a number of citizen participation activities. It is used by 10% of those living in areas of multiple deprivation and by just over one in ten (13%) in the general population overall. This rises (to 17%) among those in the general population who have the internet at home.
In addition, use of the internet as a channel is considerably higher (50%) among those in the online user sample, where it ranks alongside face-to-face and writing as a chosen communication method.
The internet is more likely to be used by those from higher socio-economic groups and with higher qualifications in the general population (who are also more likely to be online users).
As a citizen participation channel, the internet is most popular for giving views, getting in contact with MP/MEP/councillor, joining a campaigning organisation, and taking part in a government consultation or survey. The main methods for doing these are by filling out a form or poll on a website, followed by emailing.
While 13% of the general population use the internet for citizen participation, more than two-fifths (42%) use it for a related citizen activity (e.g. completing a government form). However, it is interesting that although 10% of the sample in areas of multiple deprivation use the internet for citizen participation activity, 15% are using the internet for related citizen activities.
Channels used for citizen participation
Participants in all three surveys (general population, online and areas of multiple deprivation) were asked which channels they had used for citizen participation activities during the past 12 months, where more than one channel was possible14
• registering to vote;
. This meant that participants who had taken part in the following activities were asked to specify the channel they used for:
• joining a political party;
• donating money to a political party;
14 For example, as volunteering at a school requires the channel to be face to face participants who had done this were not asked how.
Citizens’ Digital Participation
28
• taking part in a government survey or consultation;
• getting in contact with a government department or local council;
• getting in contact with an elected representative;
• joining a campaigning organisation;
• donating money to a campaigning organisation;
• signing a petition; or
• giving their views or advice on a community, political or social issue to people outside their immediate circle.
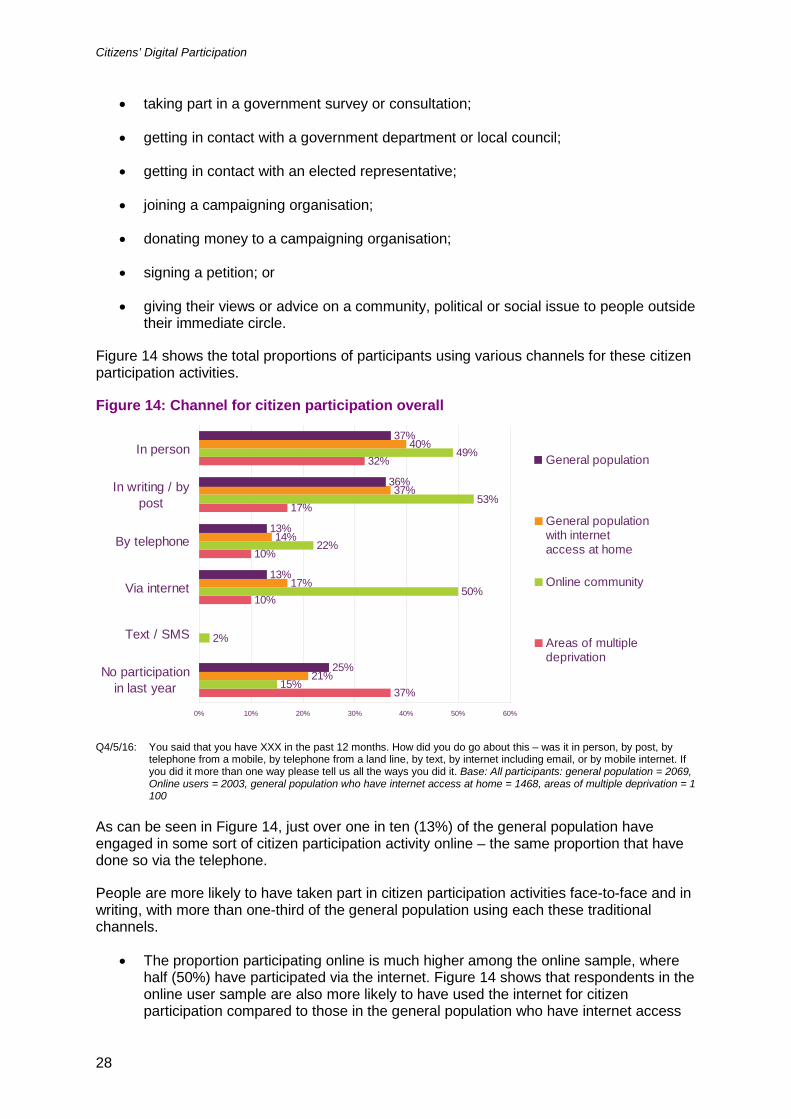
Figure 14 shows the total proportions of participants using various channels for these citizen participation activities.
Figure 14: Channel for citizen participation overall
37%
10%
10%
17%
32%
15%
2%
50%
22%
53%
49%
21%
17%
14%
37%
40%
25%
13%
13%
36%
37%
0% 10% 20% 30% 40% 50% 60%
No participationin last year
Text / SMS
Via internet
By telephone
In writing / bypost
In personGeneral population
General populationwith internetaccess at home
Online community
Areas of multipledeprivation
Q4/5/16: You said that you have XXX in the past 12 months. How did you do go about this – was it in person, by post, by telephone from a mobile, by telephone from a land line, by text, by internet including email, or by mobile internet. If you did it more than one way please tell us all the ways you did it. Base: All participants: general population = 2069, Online users = 2003, general population who have internet access at home = 1468, areas of multiple deprivation = 1 100
As can be seen in Figure 14, just over one in ten (13%) of the general population have engaged in some sort of citizen participation activity online – the same proportion that have done so via the telephone.
People are more likely to have taken part in citizen participation activities face-to-face and in writing, with more than one-third of the general population using each these traditional channels.
• The proportion participating online is much higher among the online sample, where half (50%) have participated via the internet. Figure 14 shows that respondents in the online user sample are also more likely to have used the internet for citizen participation compared to those in the general population who have internet access
Citizens’ Digital Participation
29
at home (17% of this latter group have participated this way). This difference may be due to demographic and attitudinal factors previously discussed.
Figure 14 shows that people in areas of multiple deprivation are slightly less likely to participate in citizen participation activities via the internet (10%) than are the general population (13%), although this difference is not statistically significant.
Who is more likely to participate online
Among all groups there is a considerable overlap between those who are more likely to participate in citizen participation activities generally, and those who are more likely to participate online. This suggests that although the internet may be raising participation levels, other demographic factors also play a role – e.g. those from higher socio-economic groups are more likely to participate generally and also more likely to have access to the internet and to participate online.
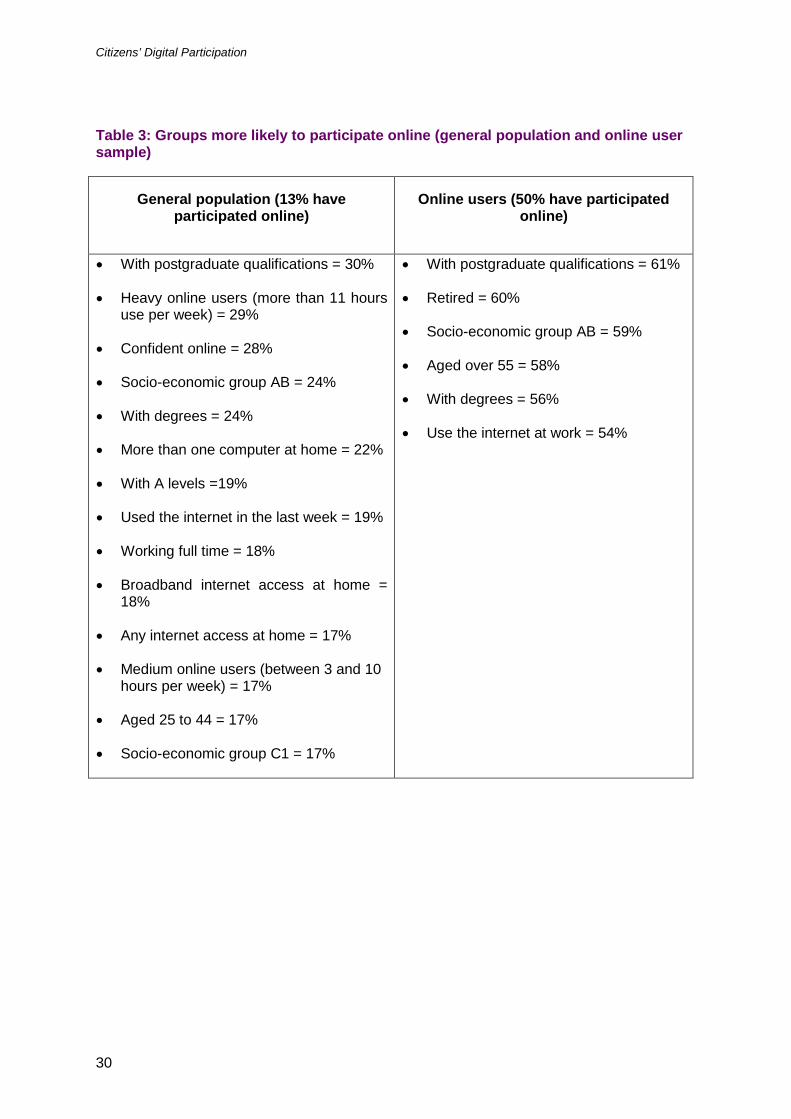
Table 3 illustrates the groups which are significantly more likely to participate online. Table 4 illustrates the groups which are significantly less likely to participate online, among the general population and the online user sample. Among the multiple deprivation area sample there is only one significant difference: as might be expected, those with internet access at home are more likely to have participated online than those without15
15 Note: Small base size, treat with caution as indicative only.
.
Citizens’ Digital Participation
30
Table 3: Groups more likely to participate online (general population and online user sample)
General population (13% have participated online)
Online users (50% have participated online)
• With postgraduate qualifications = 30%
• Heavy online users (more than 11 hours use per week) = 29%
• Confident online = 28%
• Socio-economic group AB = 24%
• With degrees = 24%
• More than one computer at home = 22%
• With A levels =19%
• Used the internet in the last week = 19%
• Working full time = 18%
• Broadband internet access at home = 18%
• Any internet access at home = 17%
• Medium online users (between 3 and 10 hours per week) = 17%
• Aged 25 to 44 = 17%
• Socio-economic group C1 = 17%
• With postgraduate qualifications = 61%
• Retired = 60%
• Socio-economic group AB = 59%
• Aged over 55 = 58%
• With degrees = 56%
• Use the internet at work = 54%
Citizens’ Digital Participation
31
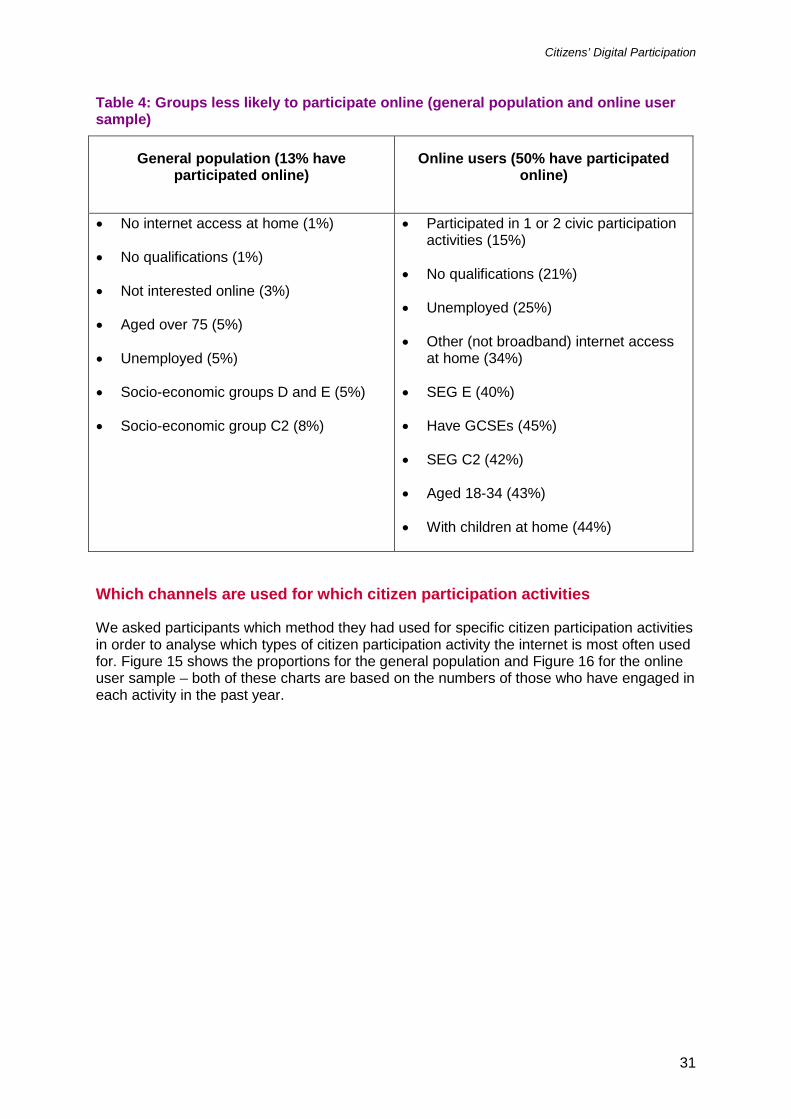
Table 4: Groups less likely to participate online (general population and online user sample)
General population (13% have participated online)
Online users (50% have participated online)
• No internet access at home (1%)
• No qualifications (1%)
• Not interested online (3%)
• Aged over 75 (5%)
• Unemployed (5%)
• Socio-economic groups D and E (5%)
• Socio-economic group C2 (8%)
• Participated in 1 or 2 civic participation activities (15%)
• No qualifications (21%)
• Unemployed (25%)
• Other (not broadband) internet access at home (34%)
• SEG E (40%)
• Have GCSEs (45%)
• SEG C2 (42%)
• Aged 18-34 (43%)
• With children at home (44%)
Which channels are used for which citizen participation activities
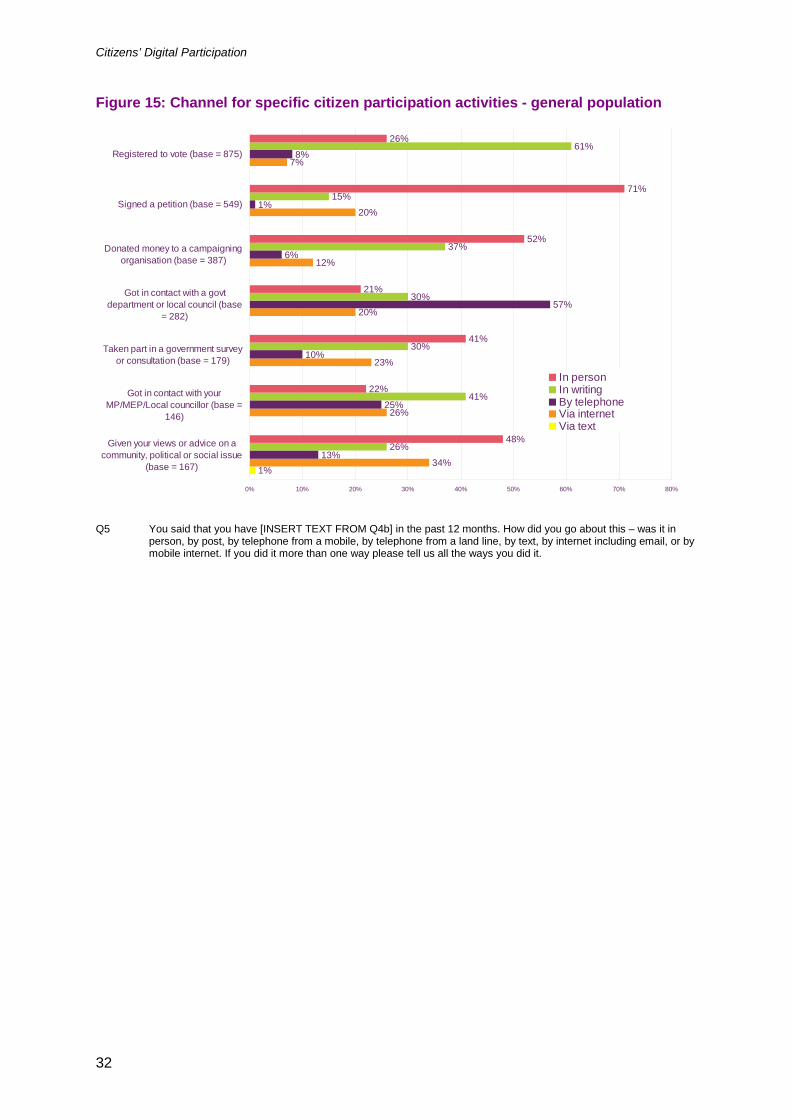
We asked participants which method they had used for specific citizen participation activities in order to analyse which types of citizen participation activity the internet is most often used for. Figure 15 shows the proportions for the general population and Figure 16 for the online user sample – both of these charts are based on the numbers of those who have engaged in each activity in the past year.
Citizens’ Digital Participation
32
Figure 15: Channel for specific citizen participation activities - general population
1%34%
26%
23%
20%
12%
20%
7%
13%
25%
10%
57%
6%
1%
8%
26%
41%
30%
30%
37%
15%
61%
48%
22%
41%
21%
52%
71%
26%
0% 10% 20% 30% 40% 50% 60% 70% 80%
Given your views or advice on acommunity, political or social issue
(base = 167)
Got in contact with yourMP/MEP/Local councillor (base =
146)
Taken part in a government surveyor consultation (base = 179)
Got in contact with a govtdepartment or local council (base
= 282)
Donated money to a campaigningorganisation (base = 387)
Signed a petition (base = 549)
Registered to vote (base = 875)
In personIn writingBy telephoneVia internetVia text
Q5 You said that you have [INSERT TEXT FROM Q4b] in the past 12 months. How did you go about this – was it in person, by post, by telephone from a mobile, by telephone from a land line, by text, by internet including email, or by mobile internet. If you did it more than one way please tell us all the ways you did it.
Citizens’ Digital Participation
33
Figure 16: Channel for specific citizen participation activities - Online users*
4%
3%
2%
2%
1%
1%
1%
1%
1%
20%
35%
43%
59%
20%
61%
35%
45%
22%
11%
15%
13%
5%
7%
5%
46%
1%
8%
55%
32%
44%
41%
27%
31%
31%
15%
62%
41%
34%
26%
25%
56%
14%
17%
58%
13%
0% 10% 20% 30% 40% 50% 60% 70% 80%
Donated money to a politicalparty (base = 91)*
Joined a campaigningorganisation (base = 101)
Got in contact with yourMP/MEP/Local councillor
(base = 354)
Given your views or adviceon a community, political orsocial issue (base = 355)
Donated money to acampaigning organisation
(base = 516)
Taken part in a governmentsurvey or consultation (base
= 546)
Got in contact with a govtdepartment or local council
(base = 654)
Signed a petition (base =1072)
Registered to vote (base =1102)
In personIn writingBy telephoneVia internetVia text
Q4a You said that you have [INSERT TEXT FROM Q4b] in the past 12 months. How did you go about this – was it in person, by post, by telephone from a mobile, by telephone from a land line, by text, by internet including email, or by mobile internet. If you did it more than one way please tell us all the ways you did it.
Figure 15 shows that the internet is most likely to be used to give views or advice on a community, social or political issue to people outside respondents’ immediate social circle. One-third (34%) of the general population who have done this did so online. In addition, around a quarter of those who had got in contact with their elected representative (26%), joined a campaigning organisation (24%) or taken part in a government survey or consultation (23%) had done so online. Other activities where the online channel was popular included signing a petition (20%) and getting in contact with a government department or local council (20%).
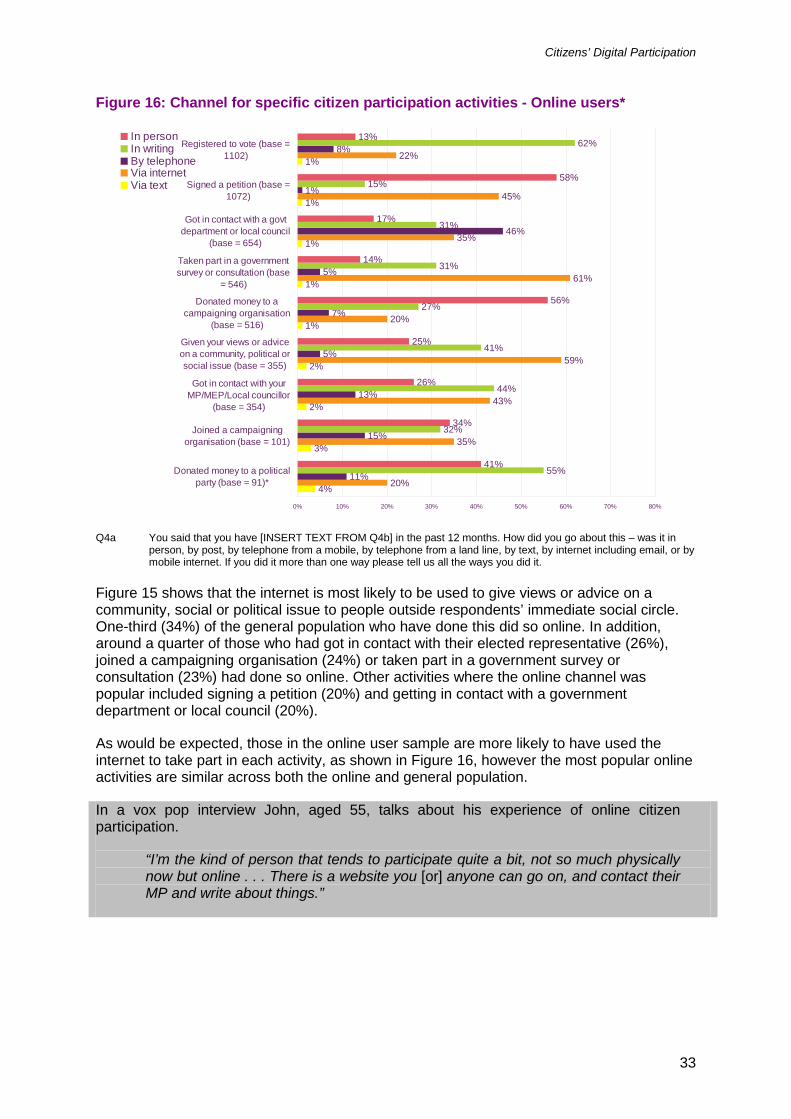
As would be expected, those in the online user sample are more likely to have used the internet to take part in each activity, as shown in Figure 16, however the most popular online activities are similar across both the online and general population.
In a vox pop interview John, aged 55, talks about his experience of online citizen participation.
“I’m the kind of person that tends to participate quite a bit, not so much physically now but online . . . There is a website you [or] anyone can go on, and contact their MP and write about things.”
Citizens’ Digital Participation
34
How people participate online
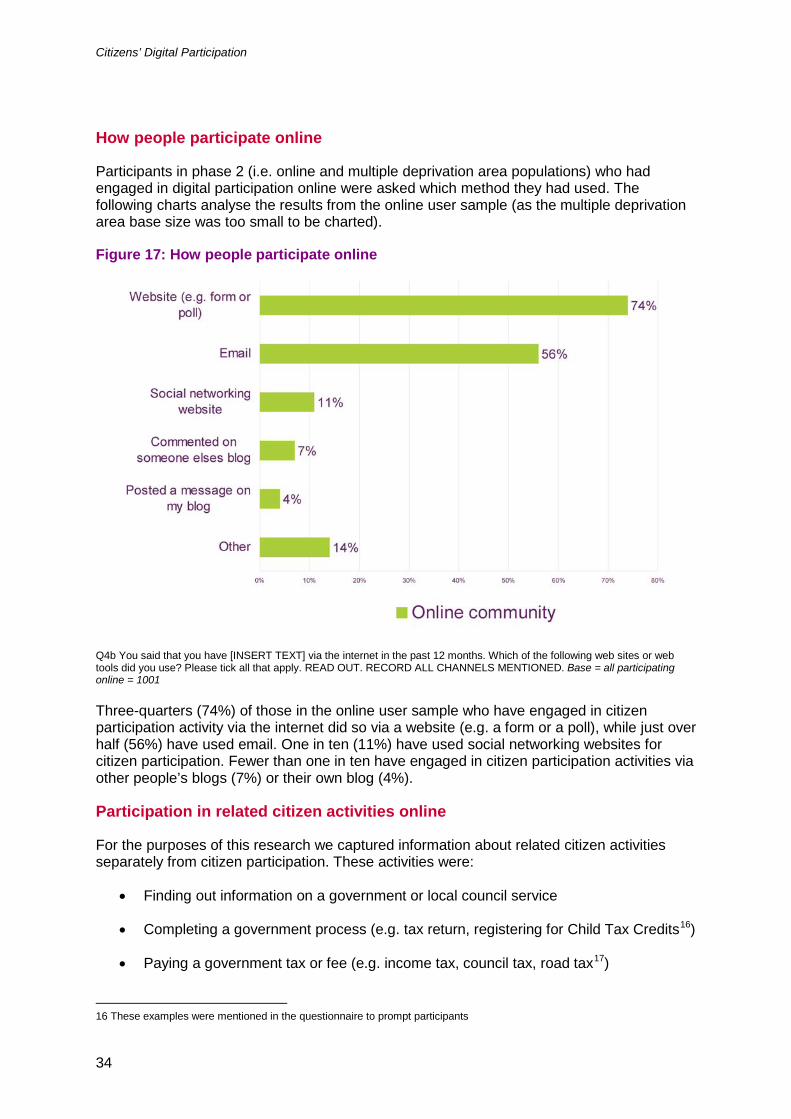
Participants in phase 2 (i.e. online and multiple deprivation area populations) who had engaged in digital participation online were asked which method they had used. The following charts analyse the results from the online user sample (as the multiple deprivation area base size was too small to be charted).
Figure 17: How people participate online
Q4b You said that you have [INSERT TEXT] via the internet in the past 12 months. Which of the following web sites or web tools did you use? Please tick all that apply. READ OUT. RECORD ALL CHANNELS MENTIONED. Base = all participating online = 1001
Three-quarters (74%) of those in the online user sample who have engaged in citizen participation activity via the internet did so via a website (e.g. a form or a poll), while just over half (56%) have used email. One in ten (11%) have used social networking websites for citizen participation. Fewer than one in ten have engaged in citizen participation activities via other people’s blogs (7%) or their own blog (4%).
Participation in related citizen activities online
For the purposes of this research we captured information about related citizen activities separately from citizen participation. These activities were:
• Finding out information on a government or local council service
• Completing a government process (e.g. tax return, registering for Child Tax Credits16
• Paying a government tax or fee (e.g. income tax, council tax, road tax
)
17
16 These examples were mentioned in the questionnaire to prompt participants
)
Citizens’ Digital Participation
35
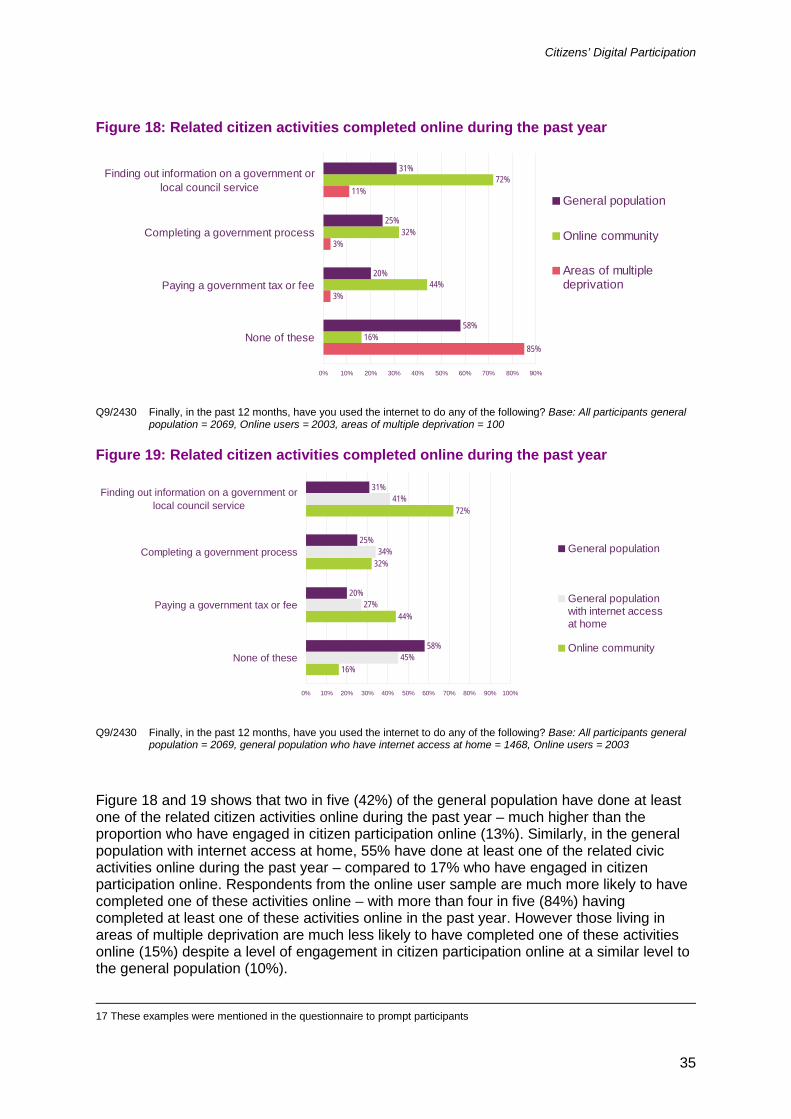
Figure 18: Related citizen activities completed online during the past year
85%
3%
3%
11%
16%
44%
32%
72%
58%
20%
25%
31%
0% 10% 20% 30% 40% 50% 60% 70% 80% 90%
None of these
Paying a government tax or fee
Completing a government process
Finding out information on a government orlocal council service
General population
Online community
Areas of multipledeprivation
Q9/2430 Finally, in the past 12 months, have you used the internet to do any of the following? Base: All participants general population = 2069, Online users = 2003, areas of multiple deprivation = 100
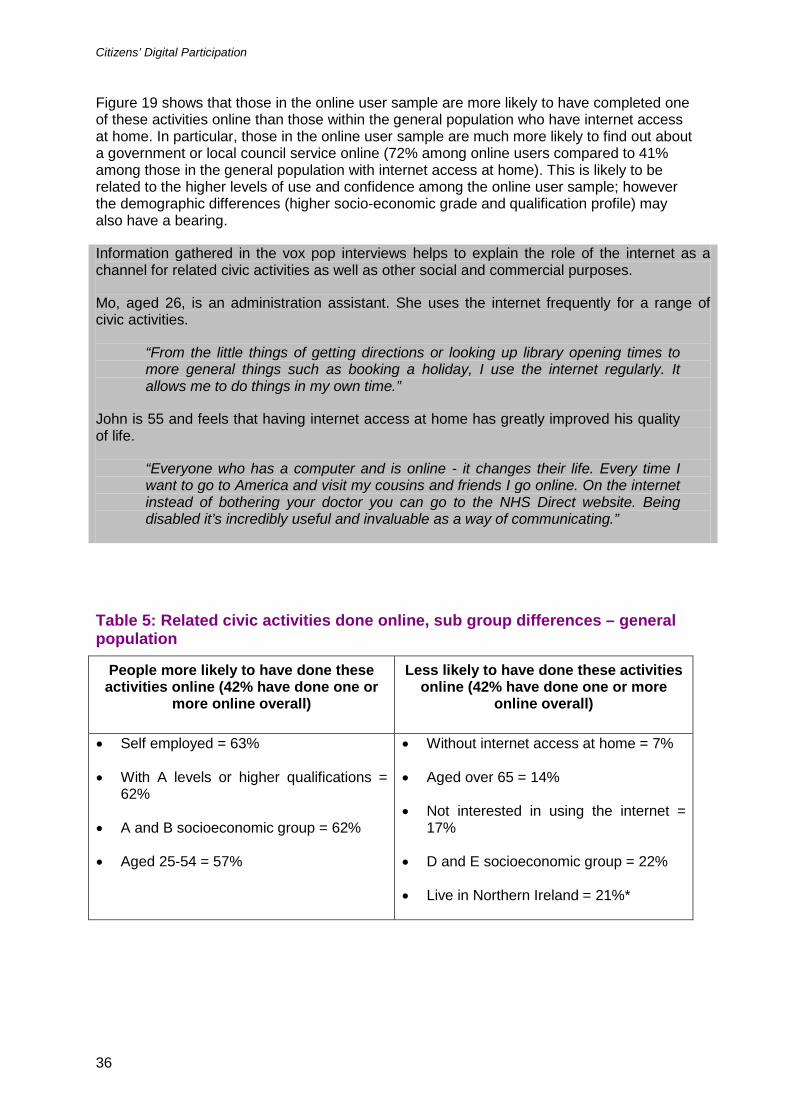
Figure 19: Related citizen activities completed online during the past year
16%
44%
32%
72%
45%
27%
34%
41%
58%
20%
25%
31%
0% 10% 20% 30% 40% 50% 60% 70% 80% 90% 100%
None of these
Paying a government tax or fee
Completing a government process
Finding out information on a government orlocal council service
General population
General populationwith internet accessat home
Online community
Q9/2430 Finally, in the past 12 months, have you used the internet to do any of the following? Base: All participants general population = 2069, general population who have internet access at home = 1468, Online users = 2003
Figure 18 and 19 shows that two in five (42%) of the general population have done at least one of the related citizen activities online during the past year – much higher than the proportion who have engaged in citizen participation online (13%). Similarly, in the general population with internet access at home, 55% have done at least one of the related civic activities online during the past year – compared to 17% who have engaged in citizen participation online. Respondents from the online user sample are much more likely to have completed one of these activities online – with more than four in five (84%) having completed at least one of these activities online in the past year. However those living in areas of multiple deprivation are much less likely to have completed one of these activities online (15%) despite a level of engagement in citizen participation online at a similar level to the general population (10%).
17 These examples were mentioned in the questionnaire to prompt participants
Citizens’ Digital Participation
36
Figure 19 shows that those in the online user sample are more likely to have completed one of these activities online than those within the general population who have internet access at home. In particular, those in the online user sample are much more likely to find out about a government or local council service online (72% among online users compared to 41% among those in the general population with internet access at home). This is likely to be related to the higher levels of use and confidence among the online user sample; however the demographic differences (higher socio-economic grade and qualification profile) may also have a bearing.
Information gathered in the vox pop interviews helps to explain the role of the internet as a channel for related civic activities as well as other social and commercial purposes.
Mo, aged 26, is an administration assistant. She uses the internet frequently for a range of civic activities.
“From the little things of getting directions or looking up library opening times to more general things such as booking a holiday, I use the internet regularly. It allows me to do things in my own time.”
John is 55 and feels that having internet access at home has greatly improved his quality of life.
“Everyone who has a computer and is online - it changes their life. Every time I want to go to America and visit my cousins and friends I go online. On the internet instead of bothering your doctor you can go to the NHS Direct website. Being disabled it’s incredibly useful and invaluable as a way of communicating.”
Table 5: Related civic activities done online, sub group differences – general population
People more likely to have done these activities online (42% have done one or
more online overall)
Less likely to have done these activities online (42% have done one or more
online overall)
• Self employed = 63%
• With A levels or higher qualifications = 62%
• A and B socioeconomic group = 62%
• Aged 25-54 = 57%
• Without internet access at home = 7%
• Aged over 65 = 14%
• Not interested in using the internet = 17%
• D and E socioeconomic group = 22%
• Live in Northern Ireland = 21%*
Citizens’ Digital Participation
37
Section 6
Digital participation – awareness and attitudes This section of the report analyses:
• Awareness of which citizen participation activities can be done online
• Attitudes towards digital participation:
– whether digital channels are perceived to make participation easier;
- whether the internet is replacing or supplementing traditional citizen participation channels;
- the extent to which access, trust and confidence issues affect the use of digital channels; and
- whether people perceive a continued role for face-to-face channels
Summary
While more than two-thirds (68%) of those in the online user sample are aware of at least one citizen participation activity that can be completed online, 28% of those living in areas of multiple deprivation can name a digital participation activity that can be done online.
Not surprisingly, the online user sample is more favourable towards using digital channels for citizen participation, while those in areas of multiple deprivation express more polarised views. In addition to lack of access, we found concern about levels of confidence and trust in using the internet for these purposes. There is agreement that the internet has made citizen participation easier, however even those in the online user sample see a continued role for face-to-face participation.
The data suggest that digital participation is supplementing and replacing traditional participation in equal measure among the online and multiple deprivation area populations.
Awareness of what can be done online
After asking what citizen participation activities respondents are aware of, respondents in phase 2 (online and multiple deprivation area samples only) were asked which of these activities can be carried out online.
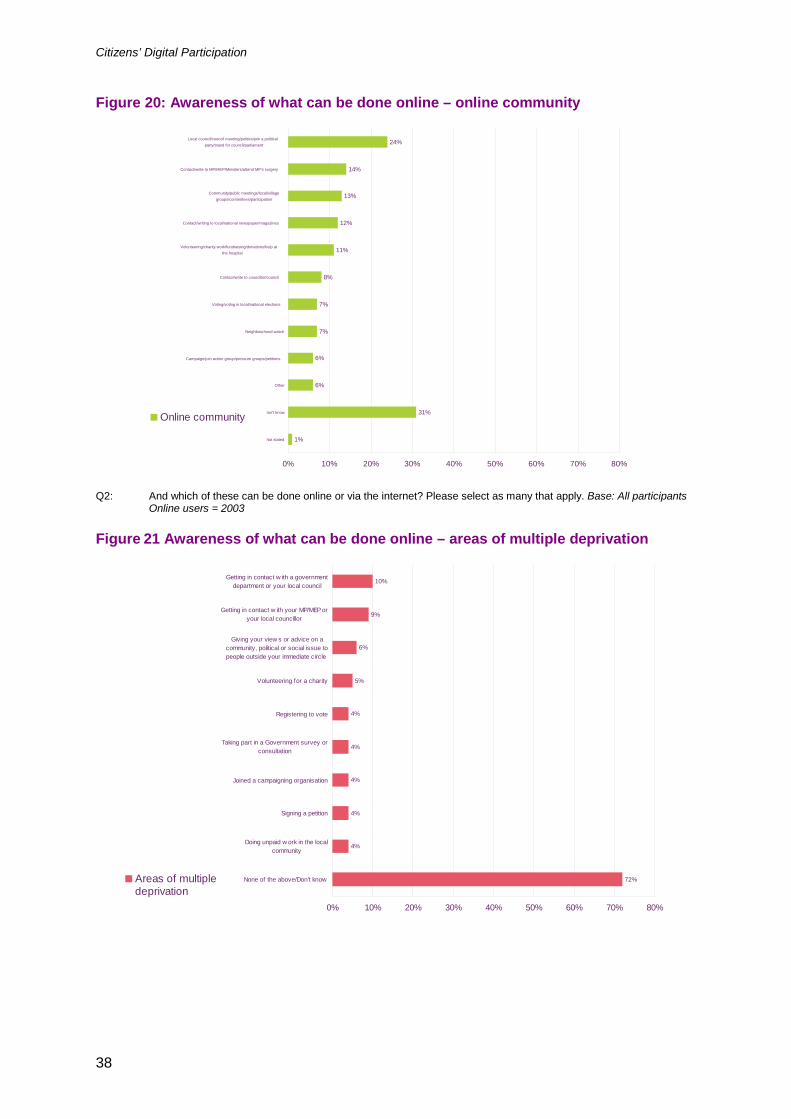
Citizens’ Digital Participation
38
Figure 20: Awareness of what can be done online – online community
1%
31%
6%
6%
7%
7%
8%
11%
12%
13%
14%
24%
0% 10% 20% 30% 40% 50% 60% 70% 80%
Not stated
Don't know
Other
Campaign/join action group/pressure groups/petitions
Neighbourhood watch
Voting/voting in local/national elections
Contact/write to councillor/council
Volunteering/charity work/fundraising/donations/help atthe hospital
Contact/writing to local/national newspaper/magazines
Community/public meetings/local/villagegroups/committees/participation
Contact/write to MP/MEP/Ministers/attend MP's surgery
Local council/council meeting/politics/join a politicalparty/stand for council/parliament
Online community
Q2: And which of these can be done online or via the internet? Please select as many that apply. Base: All participants Online users = 2003
Figure 21 Awareness of what can be done online – areas of multiple deprivation
72%
4%
4%
4%
4%
4%
5%
6%
9%
10%
0% 10% 20% 30% 40% 50% 60% 70% 80%
None of the above/Don't know
Doing unpaid w ork in the localcommunity
Signing a petition
Joined a campaigning organisation
Taking part in a Government survey orconsultation
Registering to vote
Volunteering for a charity
Giving your view s or advice on acommunity, political or social issue topeople outside your immediate circle
Getting in contact w ith your MP/MEP oryour local councillor
Getting in contact w ith a governmentdepartment or your local council
Areas of multipledeprivation
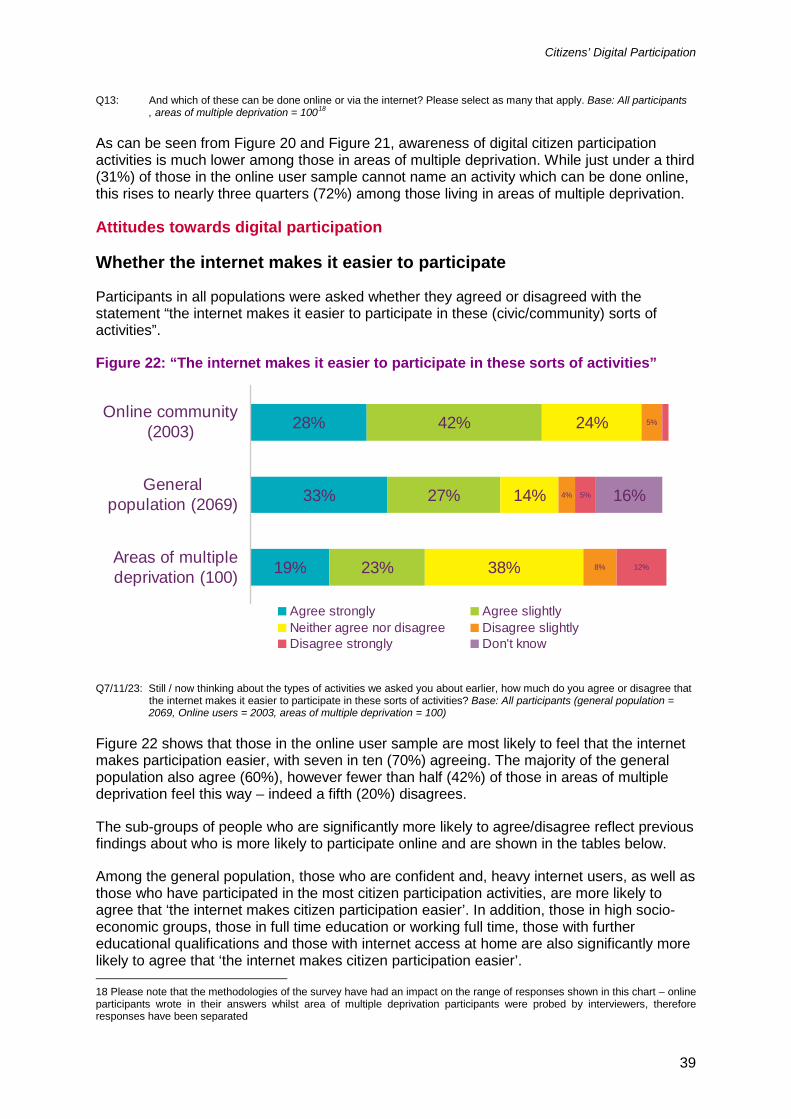
Citizens’ Digital Participation
39
Q13: And which of these can be done online or via the internet? Please select as many that apply. Base: All participants , areas of multiple deprivation = 10018
As can be seen from
Figure 20 and Figure 21, awareness of digital citizen participation activities is much lower among those in areas of multiple deprivation. While just under a third (31%) of those in the online user sample cannot name an activity which can be done online, this rises to nearly three quarters (72%) among those living in areas of multiple deprivation.
Attitudes towards digital participation
Whether the internet makes it easier to participate
Participants in all populations were asked whether they agreed or disagreed with the statement “the internet makes it easier to participate in these (civic/community) sorts of activities”.
Figure 22: “The internet makes it easier to participate in these sorts of activities”
19%
33%
28%
23%
27%
42%
38%
14%
24%
8%
4%
5%
12%
5% 16%
Areas of multipledeprivation (100)
Generalpopulation (2069)
Online community(2003)
Agree strongly Agree slightlyNeither agree nor disagree Disagree slightlyDisagree strongly Don't know
Q7/11/23: Still / now thinking about the types of activities we asked you about earlier, how much do you agree or disagree that the internet makes it easier to participate in these sorts of activities? Base: All participants (general population = 2069, Online users = 2003, areas of multiple deprivation = 100)
Figure 22 shows that those in the online user sample are most likely to feel that the internet makes participation easier, with seven in ten (70%) agreeing. The majority of the general population also agree (60%), however fewer than half (42%) of those in areas of multiple deprivation feel this way – indeed a fifth (20%) disagrees.
The sub-groups of people who are significantly more likely to agree/disagree reflect previous findings about who is more likely to participate online and are shown in the tables below.
Among the general population, those who are confident and, heavy internet users, as well as those who have participated in the most citizen participation activities, are more likely to agree that ‘the internet makes citizen participation easier’. In addition, those in high socio-economic groups, those in full time education or working full time, those with further educational qualifications and those with internet access at home are also significantly more likely to agree that ‘the internet makes citizen participation easier’. 18 Please note that the methodologies of the survey have had an impact on the range of responses shown in this chart – online participants wrote in their answers whilst area of multiple deprivation participants were probed by interviewers, therefore responses have been separated
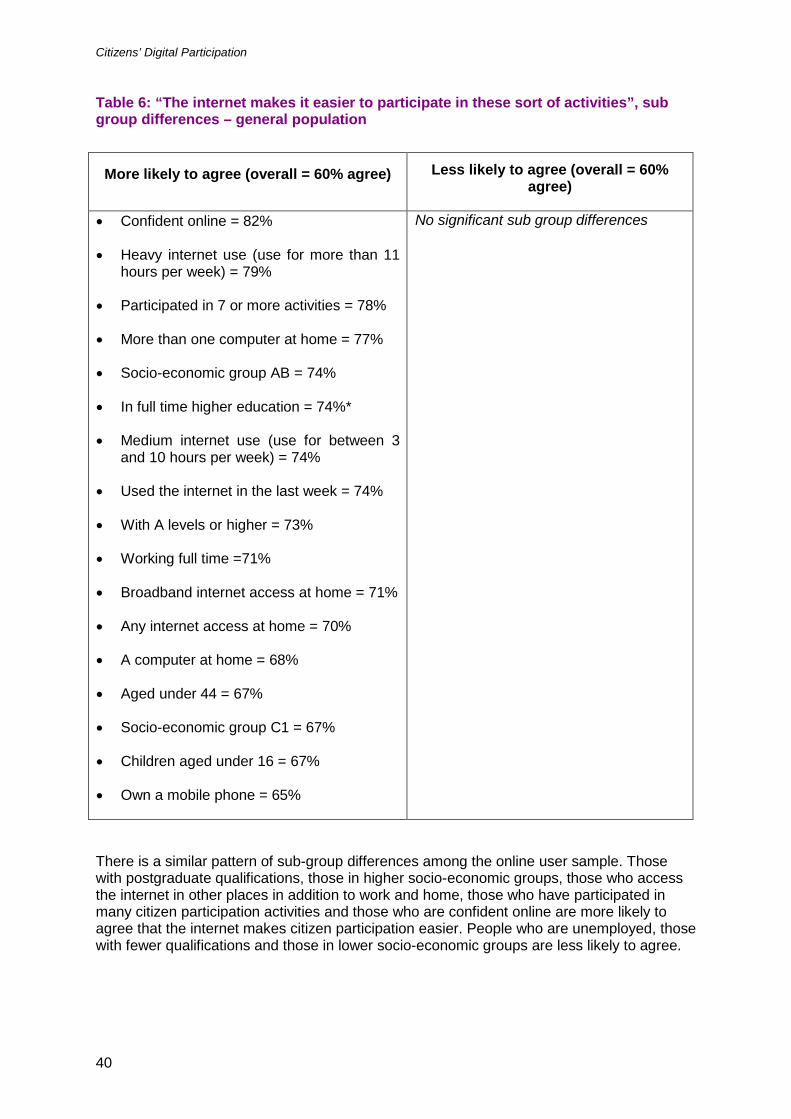
Citizens’ Digital Participation
40
Table 6: “The internet makes it easier to participate in these sort of activities”, sub group differences – general population
More likely to agree (overall = 60% agree) Less likely to agree (overall = 60% agree)
• Confident online = 82%
• Heavy internet use (use for more than 11 hours per week) = 79%
• Participated in 7 or more activities = 78%
• More than one computer at home = 77%
• Socio-economic group AB = 74%
• In full time higher education = 74%*
• Medium internet use (use for between 3 and 10 hours per week) = 74%
• Used the internet in the last week = 74%
• With A levels or higher = 73%
• Working full time =71%
• Broadband internet access at home = 71%
• Any internet access at home = 70%
• A computer at home = 68%
• Aged under 44 = 67%
• Socio-economic group C1 = 67%
• Children aged under 16 = 67%
• Own a mobile phone = 65%
No significant sub group differences
There is a similar pattern of sub-group differences among the online user sample. Those with postgraduate qualifications, those in higher socio-economic groups, those who access the internet in other places in addition to work and home, those who have participated in many citizen participation activities and those who are confident online are more likely to agree that the internet makes citizen participation easier. People who are unemployed, those with fewer qualifications and those in lower socio-economic groups are less likely to agree.
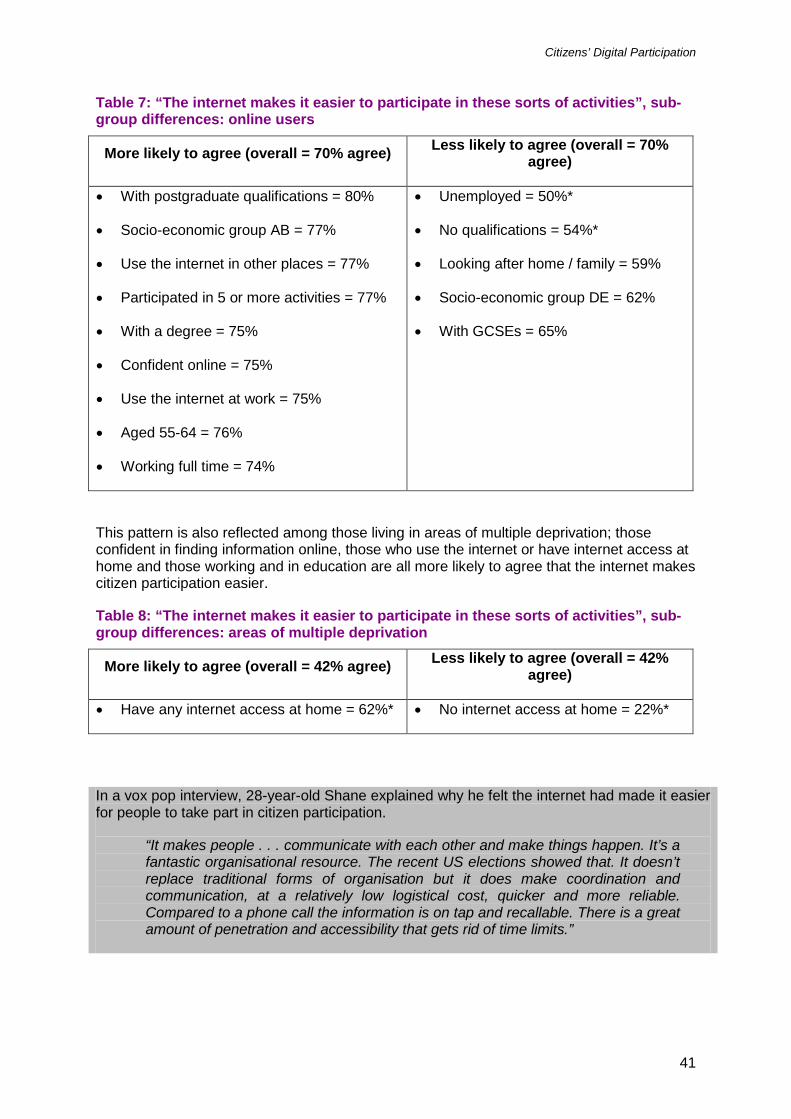
Citizens’ Digital Participation
41
Table 7: “The internet makes it easier to participate in these sorts of activities”, sub-group differences: online users
More likely to agree (overall = 70% agree) Less likely to agree (overall = 70% agree)
• With postgraduate qualifications = 80%
• Socio-economic group AB = 77%
• Use the internet in other places = 77%
• Participated in 5 or more activities = 77%
• With a degree = 75%
• Confident online = 75%
• Use the internet at work = 75%
• Aged 55-64 = 76%
• Working full time = 74%
• Unemployed = 50%*
• No qualifications = 54%*
• Looking after home / family = 59%
• Socio-economic group DE = 62%
• With GCSEs = 65%
This pattern is also reflected among those living in areas of multiple deprivation; those confident in finding information online, those who use the internet or have internet access at home and those working and in education are all more likely to agree that the internet makes citizen participation easier.
Table 8: “The internet makes it easier to participate in these sorts of activities”, sub-group differences: areas of multiple deprivation
More likely to agree (overall = 42% agree) Less likely to agree (overall = 42% agree)
• Have any internet access at home = 62%* • No internet access at home = 22%*
In a vox pop interview, 28-year-old Shane explained why he felt the internet had made it easier for people to take part in citizen participation.
“It makes people . . . communicate with each other and make things happen. It’s a fantastic organisational resource. The recent US elections showed that. It doesn’t replace traditional forms of organisation but it does make coordination and communication, at a relatively low logistical cost, quicker and more reliable. Compared to a phone call the information is on tap and recallable. There is a great amount of penetration and accessibility that gets rid of time limits.”
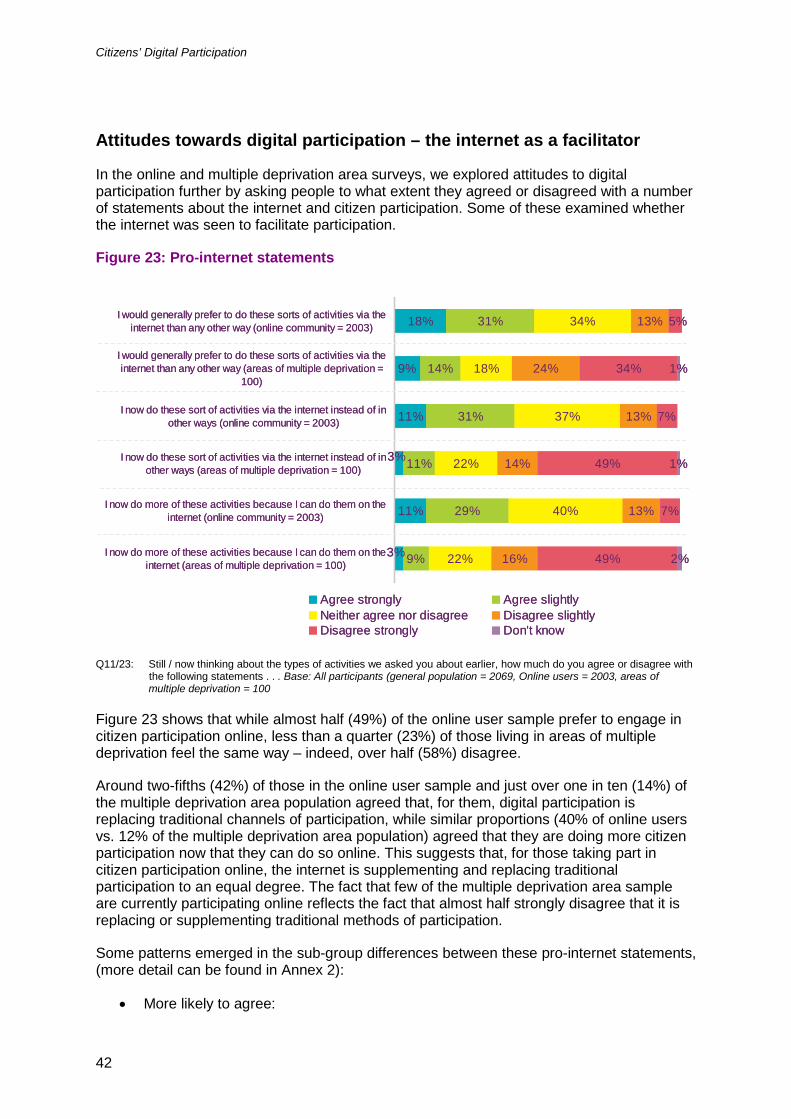
Citizens’ Digital Participation
42
Attitudes towards digital participation – the internet as a facilitator
In the online and multiple deprivation area surveys, we explored attitudes to digital participation further by asking people to what extent they agreed or disagreed with a number of statements about the internet and citizen participation. Some of these examined whether the internet was seen to facilitate participation.
Figure 23: Pro-internet statements
11%
11%
9%
18%
9%
29%
11%
31%
14%
31%
22%
40%
22%
37%
18%
34%
16%
13%
14%
13%
24%
13%
49%
7%
7%
34%
3%
3%
5%
49%
2%
1%
1%
I now do more of these activities because I can do them on theinternet (areas of multiple deprivation = 100)
I now do more of these activities because I can do them on theinternet (online community = 2003)
I now do these sort of activities via the internet instead of inother ways (areas of multiple deprivation = 100)
I now do these sort of activities via the internet instead of inother ways (online community = 2003)
I would generally prefer to do these sorts of activities via theinternet than any other way (areas of multiple deprivation =
100)
I would generally prefer to do these sorts of activities via theinternet than any other way (online community = 2003)
Agree strongly Agree slightlyNeither agree nor disagree Disagree slightlyDisagree strongly Don't know
11%
11%
9%
18%
9%
29%
11%
31%
14%
31%
22%
40%
22%
37%
18%
34%
16%
13%
14%
13%
24%
13%
49%
7%
7%
34%
3%
3%
5%
49%
2%
1%
1%
I now do more of these activities because I can do them on theinternet (areas of multiple deprivation = 100)
I now do more of these activities because I can do them on theinternet (online community = 2003)
I now do these sort of activities via the internet instead of inother ways (areas of multiple deprivation = 100)
I now do these sort of activities via the internet instead of inother ways (online community = 2003)
I would generally prefer to do these sorts of activities via theinternet than any other way (areas of multiple deprivation =
100)
I would generally prefer to do these sorts of activities via theinternet than any other way (online community = 2003)
Agree strongly Agree slightlyNeither agree nor disagree Disagree slightlyDisagree strongly Don't know
Q11/23: Still / now thinking about the types of activities we asked you about earlier, how much do you agree or disagree with the following statements . . . Base: All participants (general population = 2069, Online users = 2003, areas of multiple deprivation = 100
Figure 23 shows that while almost half (49%) of the online user sample prefer to engage in citizen participation online, less than a quarter (23%) of those living in areas of multiple deprivation feel the same way – indeed, over half (58%) disagree.
Around two-fifths (42%) of those in the online user sample and just over one in ten (14%) of the multiple deprivation area population agreed that, for them, digital participation is replacing traditional channels of participation, while similar proportions (40% of online users vs. 12% of the multiple deprivation area population) agreed that they are doing more citizen participation now that they can do so online. This suggests that, for those taking part in citizen participation online, the internet is supplementing and replacing traditional participation to an equal degree. The fact that few of the multiple deprivation area sample are currently participating online reflects the fact that almost half strongly disagree that it is replacing or supplementing traditional methods of participation.
Some patterns emerged in the sub-group differences between these pro-internet statements, (more detail can be found in Annex 2):
• More likely to agree:
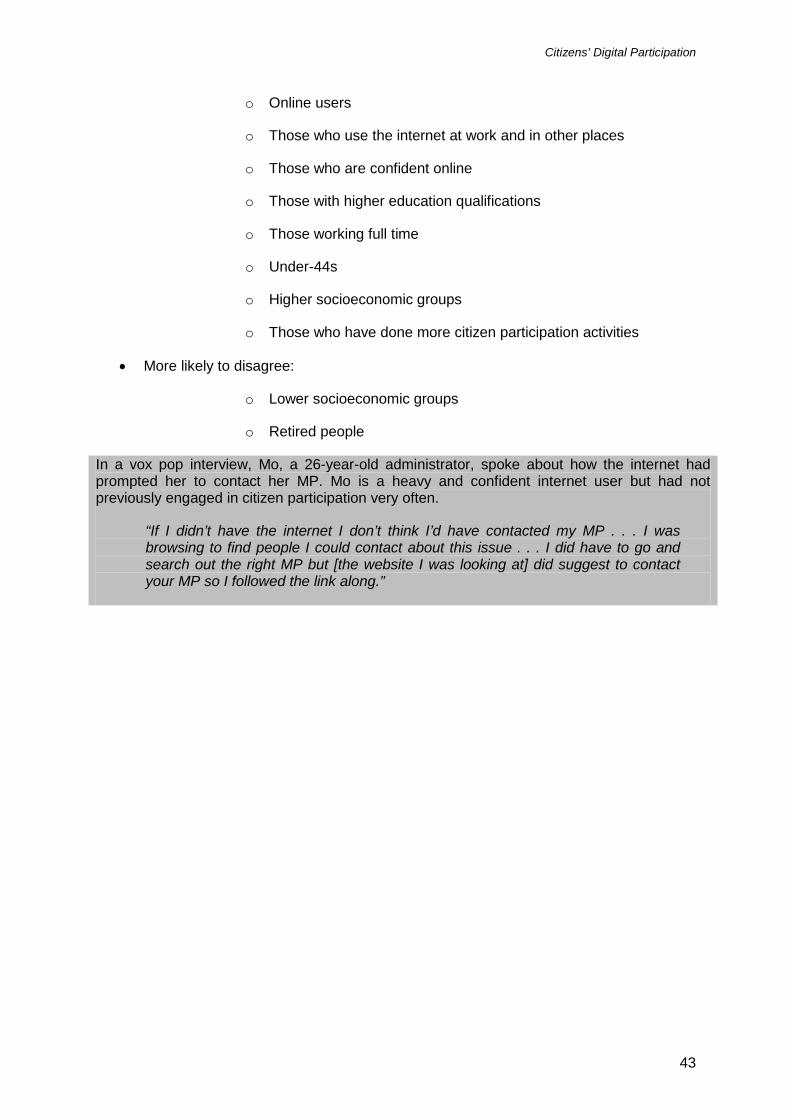
Citizens’ Digital Participation
43
o Online users
o Those who use the internet at work and in other places
o Those who are confident online
o Those with higher education qualifications
o Those working full time
o Under-44s
o Higher socioeconomic groups
o Those who have done more citizen participation activities
• More likely to disagree:
o Lower socioeconomic groups
o Retired people
In a vox pop interview, Mo, a 26-year-old administrator, spoke about how the internet had prompted her to contact her MP. Mo is a heavy and confident internet user but had not previously engaged in citizen participation very often.
“If I didn’t have the internet I don’t think I’d have contacted my MP . . . I was browsing to find people I could contact about this issue . . . I did have to go and search out the right MP but [the website I was looking at] did suggest to contact your MP so I followed the link along.”
Citizens’ Digital Participation
44
Attitudes towards digital participation – ‘the internet as a facilitator’: oppositional statements
Responses to oppositional statements concerning the internet as a facilitator are detailed below.
Figure 24: Anti-internet statements
Q11/23: Still / now thinking about the types of activities we asked you about earlier, how much do you agree or disagree with the following statements . . . Base: All participants (general population = 2069, Online users = 2003, areas of multiple deprivation = 100
Figure 24 shows that a significant minority (33%) of the online user sample would rather engage in citizen participation activities face-to-face; almost two-thirds (63%) of the multiple deprivation area population feel this way. This shows that while even confident and heavy online users recognise the value of traditional citizen participation channels, these are particularly important in areas of multiple deprivation. Further more a third (33%) of the online user sample feel that engaging in citizen participation activities online is less effective than doing it through other channels, while half (51%) of those in areas of multiple deprivation areas feel this way.
Those who have engaged in more citizen participation activities, as well as those from higher socio-economic groups and those who have volunteered in the past 12 months, are more likely to express a preference to engage in citizen participation face-to-face and to regard online participation as less effective.
Citizens’ Digital Participation
45
Interestingly, just under one in ten (9%) respondents in the online user sample agree that they do not sufficiently trust the internet for citizen participation activities – and this rises to almost half (46%) among the multiple deprivation area population.
Just under one in ten (9%) respondents in the online user sample feel that they lack the confidence to engage in citizen participation online. Those living in areas of multiple deprivation are far more likely to say that they lack confidence (40%). One in ten (11%) in the online user sample say that they are not online enough to be able use it for citizen participation activities, while over two-fifths (42%) of those in areas of multiple deprivation say that access issues prevent them from using the internet for citizen participation.
Detailed sub-group differences are shown in Table 9 to Table 12 below, and more information can be found in Annex 2. The tables show that the following groups are more likely to agree with these statements:
• those with fewer qualifications; and
• those from lower socio-economic groups.
Table 9: “I would rather do these sorts of activities face-to-face than via the internet”, sub-group differences
More likely to agree, online users (overall = 32% agree)
More likely to disagree, online users (overall = 29% disagree)
• Aged over 75 = 45%*
• Not interested in finding information online = 40%
• Socio-economic group A = 39%
• Aged 65-74 = 38%
• Participated in community campaigning activities = 37% (in the last year = 41%)
• Participated in five or more citizen participation activities in the last year = 37%
• Have not done any citizen participation activities in the past year = 36%
• Socio-economic group C1 = 34%
More likely to agree, areas of multiple deprivation (overall =63% agree)
Less likely to agree, areas of multiple deprivation (overall = 63% agree)
No significant differences No significant differences
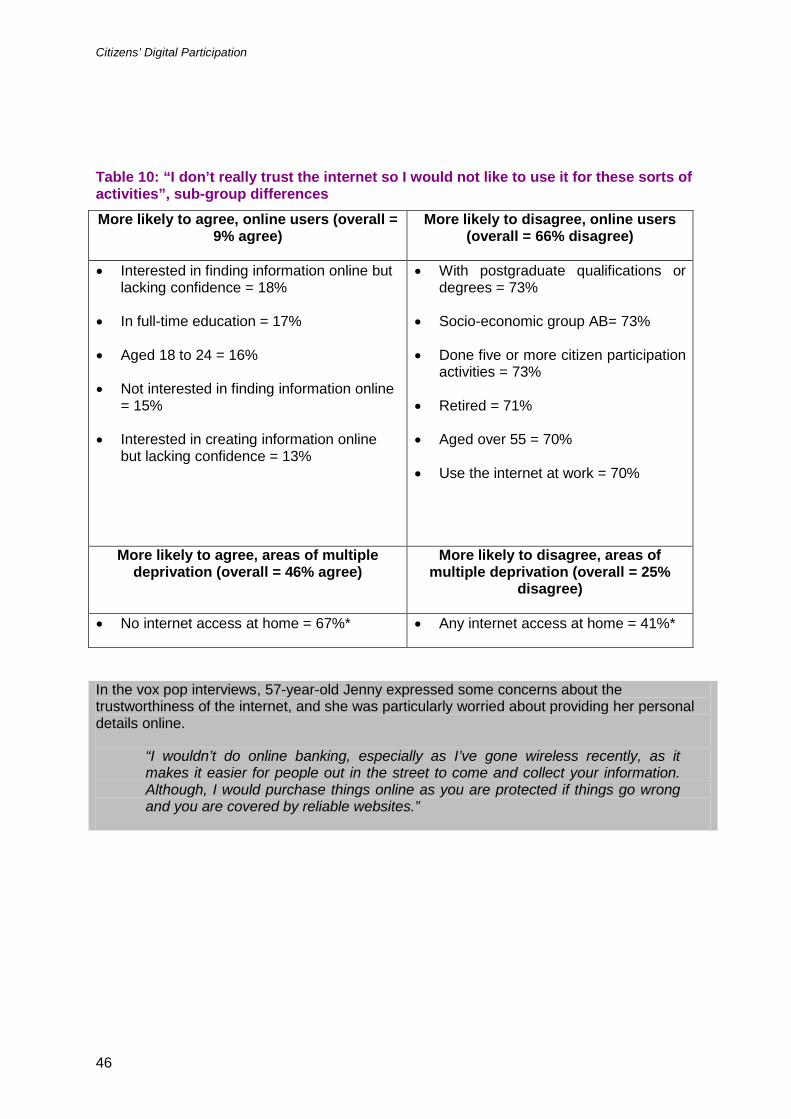
Citizens’ Digital Participation
46
Table 10: “I don’t really trust the internet so I would not like to use it for these sorts of activities”, sub-group differences More likely to agree, online users (overall =
9% agree) More likely to disagree, online users
(overall = 66% disagree)
• Interested in finding information online but lacking confidence = 18%
• In full-time education = 17%
• Aged 18 to 24 = 16%
• Not interested in finding information online = 15%
• Interested in creating information online but lacking confidence = 13%
• With postgraduate qualifications or degrees = 73%
• Socio-economic group AB= 73%
• Done five or more citizen participation activities = 73%
• Retired = 71%
• Aged over 55 = 70%
• Use the internet at work = 70%
More likely to agree, areas of multiple deprivation (overall = 46% agree)
More likely to disagree, areas of multiple deprivation (overall = 25%
disagree)
• No internet access at home = 67%* • Any internet access at home = 41%*
In the vox pop interviews, 57-year-old Jenny expressed some concerns about the trustworthiness of the internet, and she was particularly worried about providing her personal details online.
“I wouldn’t do online banking, especially as I’ve gone wireless recently, as it makes it easier for people out in the street to come and collect your information. Although, I would purchase things online as you are protected if things go wrong and you are covered by reliable websites.”
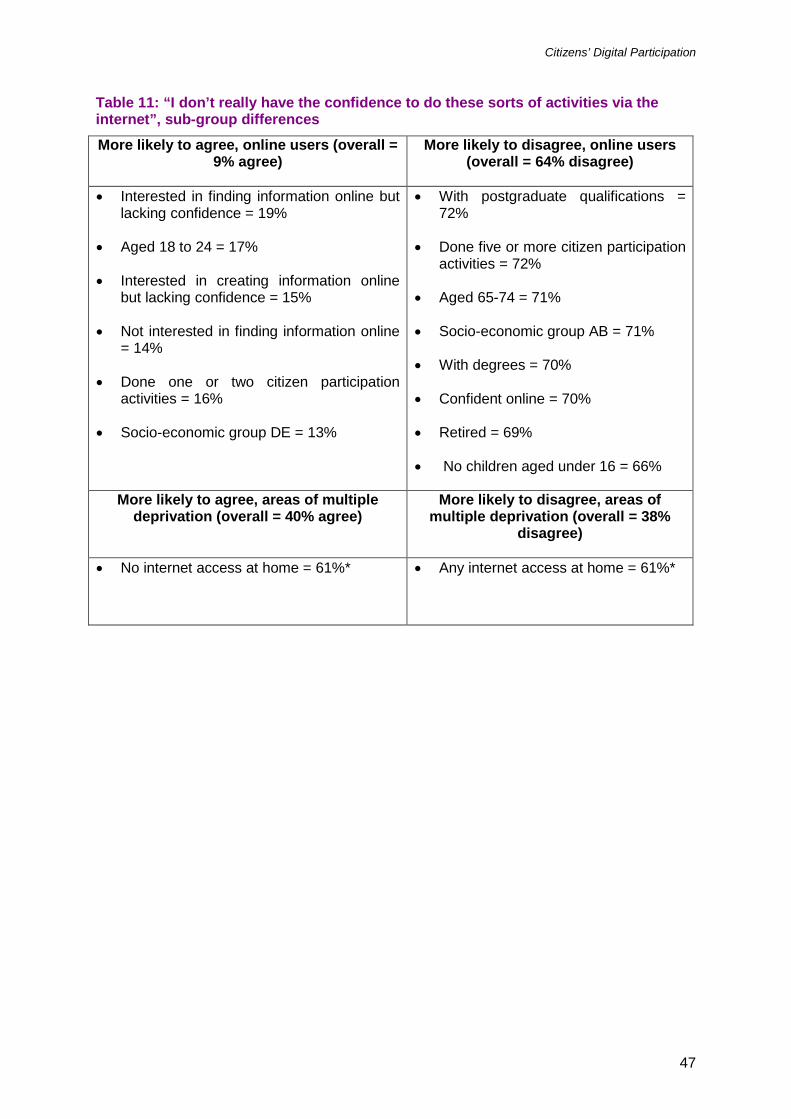
Citizens’ Digital Participation
47
Table 11: “I don’t really have the confidence to do these sorts of activities via the internet”, sub-group differences
More likely to agree, online users (overall = 9% agree)
More likely to disagree, online users (overall = 64% disagree)
• Interested in finding information online but lacking confidence = 19%
• Aged 18 to 24 = 17%
• Interested in creating information online but lacking confidence = 15%
• Not interested in finding information online = 14%
• Done one or two citizen participation activities = 16%
• Socio-economic group DE = 13%
• With postgraduate qualifications = 72%
• Done five or more citizen participation activities = 72%
• Aged 65-74 = 71%
• Socio-economic group AB = 71%
• With degrees = 70%
• Confident online = 70%
• Retired = 69%
• No children aged under 16 = 66%
More likely to agree, areas of multiple deprivation (overall = 40% agree)
More likely to disagree, areas of multiple deprivation (overall = 38%
disagree)
• No internet access at home = 61%*
• Any internet access at home = 61%*
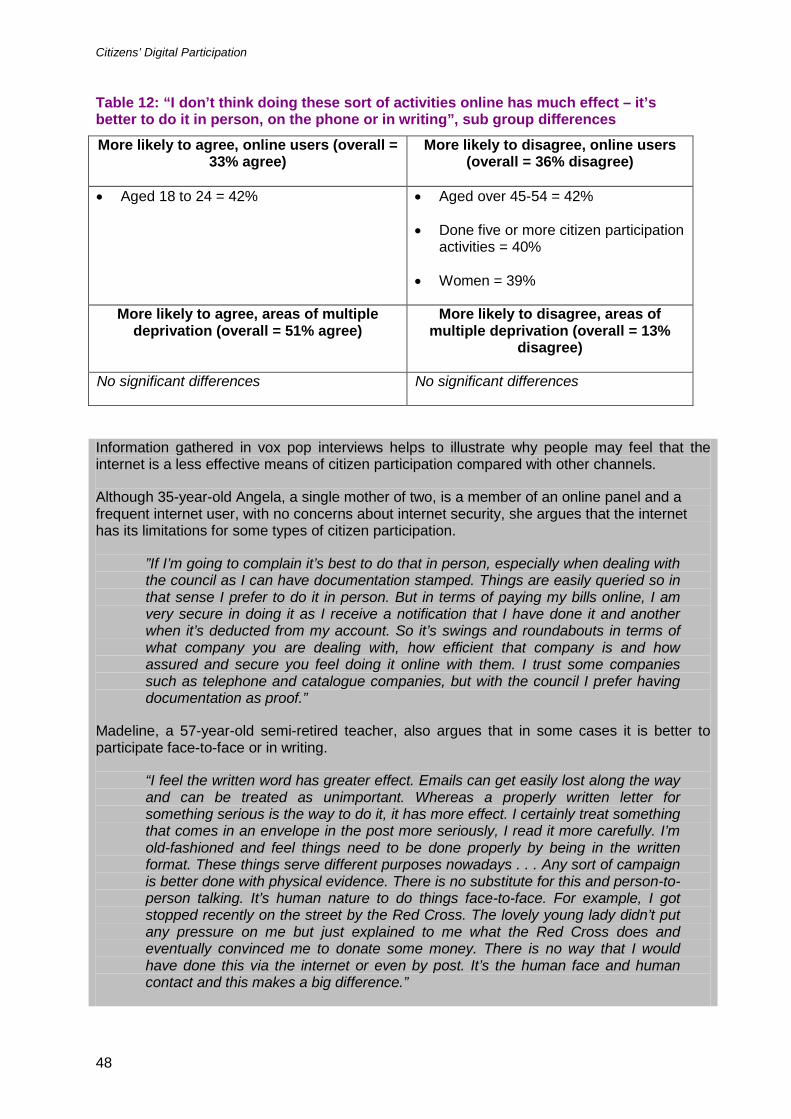
Citizens’ Digital Participation
48
Table 12: “I don’t think doing these sort of activities online has much effect – it’s better to do it in person, on the phone or in writing”, sub group differences
More likely to agree, online users (overall = 33% agree)
More likely to disagree, online users (overall = 36% disagree)
• Aged 18 to 24 = 42%
• Aged over 45-54 = 42%
• Done five or more citizen participation activities = 40%
• Women = 39%
More likely to agree, areas of multiple deprivation (overall = 51% agree)
More likely to disagree, areas of multiple deprivation (overall = 13%
disagree)
No significant differences No significant differences
Information gathered in vox pop interviews helps to illustrate why people may feel that the internet is a less effective means of citizen participation compared with other channels.
Although 35-year-old Angela, a single mother of two, is a member of an online panel and a frequent internet user, with no concerns about internet security, she argues that the internet has its limitations for some types of citizen participation.
”If I’m going to complain it’s best to do that in person, especially when dealing with the council as I can have documentation stamped. Things are easily queried so in that sense I prefer to do it in person. But in terms of paying my bills online, I am very secure in doing it as I receive a notification that I have done it and another when it’s deducted from my account. So it’s swings and roundabouts in terms of what company you are dealing with, how efficient that company is and how assured and secure you feel doing it online with them. I trust some companies such as telephone and catalogue companies, but with the council I prefer having documentation as proof.”
Madeline, a 57-year-old semi-retired teacher, also argues that in some cases it is better to participate face-to-face or in writing.
“I feel the written word has greater effect. Emails can get easily lost along the way and can be treated as unimportant. Whereas a properly written letter for something serious is the way to do it, it has more effect. I certainly treat something that comes in an envelope in the post more seriously, I read it more carefully. I’m old-fashioned and feel things need to be done properly by being in the written format. These things serve different purposes nowadays . . . Any sort of campaign is better done with physical evidence. There is no substitute for this and person-to-person talking. It’s human nature to do things face-to-face. For example, I got stopped recently on the street by the Red Cross. The lovely young lady didn’t put any pressure on me but just explained to me what the Red Cross does and eventually convinced me to donate some money. There is no way that I would have done this via the internet or even by post. It’s the human face and human contact and this makes a big difference.”
Citizens’ Digital Participation
49
Section 7
1 Motivators and barriers Summary
Feeling strongly about an issue or cause is the most important motivator for engagement in citizen participation among both the online and multiple deprivation area populations. Feeling duty-bound is also a strong motivator, and being invited to take part can be an important influencer.
Among the general population and the online user sample, lack of time is the biggest reported barrier to participation. Participants give this as the main reason why they participate less frequently than in the past. Lack of interest is a significant barrier, particularly for those who currently do not participate.
Findings also indicate that:
• Lack of trust in using the internet for citizen participation activities is a barrier, even for some among the online user sample
• Lack of access to, and confidence in, the internet are barriers for those living in areas of multiple deprivation, along with a feeling of disempowerment (‘my actions won’t have any effect’)
Motivators for participation
In the online and multiple deprivation area surveys, participants were asked about what encouraged them to take part in one of the citizen participation activities they had done. Those who had taken part in citizen participation in the past year were asked about a randomly selected activity, while those who had not taken part in citizen participation in the last year were asked about the activity they had carried out most recently. Figure 25 compares the motivations for the online and multiple deprivation area populations.
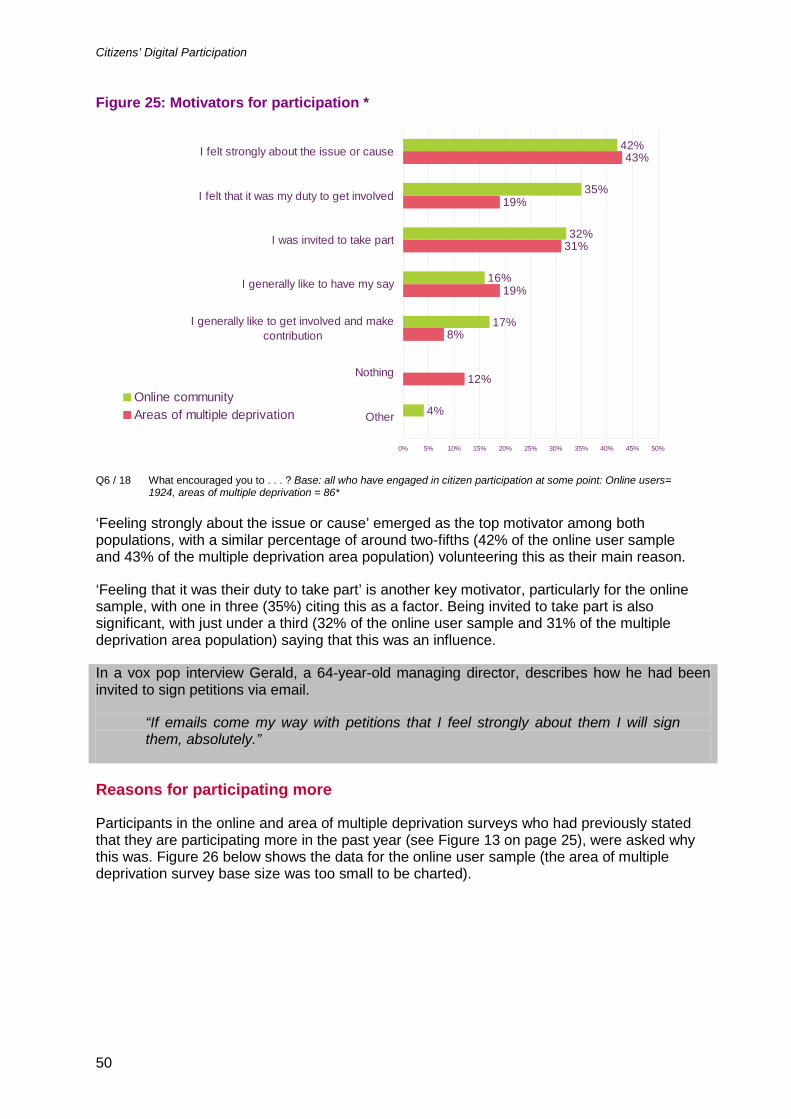
Citizens’ Digital Participation
50
Figure 25: Motivators for participation *
12%
8%
19%
31%
19%
43%
4%
17%
16%
32%
35%
42%
0% 5% 10% 15% 20% 25% 30% 35% 40% 45% 50%
Other
Nothing
I generally like to get involved and makecontribution
I generally like to have my say
I was invited to take part
I felt that it was my duty to get involved
I felt strongly about the issue or cause
Online communityAreas of multiple deprivation
Q6 / 18 What encouraged you to . . . ? Base: all who have engaged in citizen participation at some point: Online users=
1924, areas of multiple deprivation = 86*
‘Feeling strongly about the issue or cause’ emerged as the top motivator among both populations, with a similar percentage of around two-fifths (42% of the online user sample and 43% of the multiple deprivation area population) volunteering this as their main reason.
‘Feeling that it was their duty to take part’ is another key motivator, particularly for the online sample, with one in three (35%) citing this as a factor. Being invited to take part is also significant, with just under a third (32% of the online user sample and 31% of the multiple deprivation area population) saying that this was an influence.
In a vox pop interview Gerald, a 64-year-old managing director, describes how he had been invited to sign petitions via email.
“If emails come my way with petitions that I feel strongly about them I will sign them, absolutely.”
Reasons for participating more
Participants in the online and area of multiple deprivation surveys who had previously stated that they are participating more in the past year (see Figure 13 on page 25), were asked why this was. Figure 26 below shows the data for the online user sample (the area of multiple deprivation survey base size was too small to be charted).
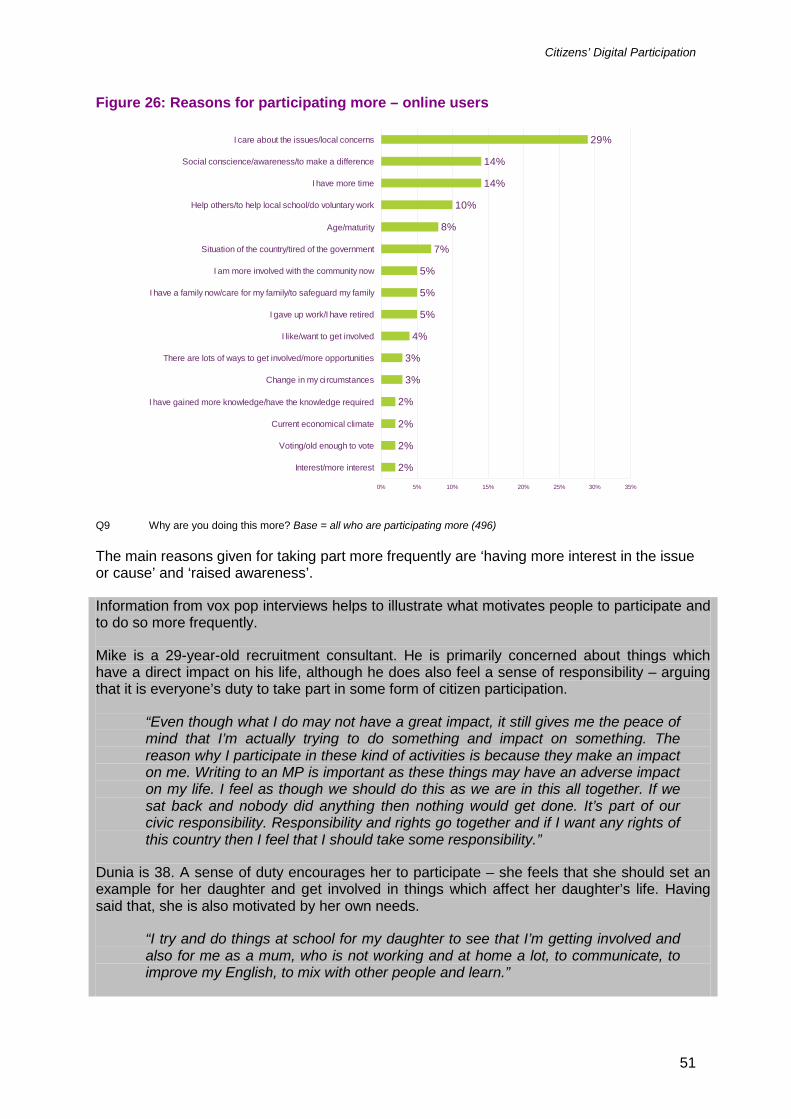
Citizens’ Digital Participation
51
Figure 26: Reasons for participating more – online users
2%
2%
2%
2%
3%
3%
4%
5%
5%
5%
7%
8%
10%
14%
14%
29%
0% 5% 10% 15% 20% 25% 30% 35%
Interest/more interest
Voting/old enough to vote
Current economical climate
I have gained more knowledge/have the knowledge required
Change in my circumstances
There are lots of ways to get involved/more opportunities
I like/want to get involved
I gave up work/I have retired
I have a family now/care for my family/to safeguard my family
I am more involved with the community now
Situation of the country/tired of the government
Age/maturity
Help others/to help local school/do voluntary work
I have more time
Social conscience/awareness/to make a difference
I care about the issues/local concerns
Q9 Why are you doing this more? Base = all who are participating more (496)
The main reasons given for taking part more frequently are ‘having more interest in the issue or cause’ and ‘raised awareness’.
Information from vox pop interviews helps to illustrate what motivates people to participate and to do so more frequently.
Mike is a 29-year-old recruitment consultant. He is primarily concerned about things which have a direct impact on his life, although he does also feel a sense of responsibility – arguing that it is everyone’s duty to take part in some form of citizen participation.
“Even though what I do may not have a great impact, it still gives me the peace of mind that I’m actually trying to do something and impact on something. The reason why I participate in these kind of activities is because they make an impact on me. Writing to an MP is important as these things may have an adverse impact on my life. I feel as though we should do this as we are in this all together. If we sat back and nobody did anything then nothing would get done. It’s part of our civic responsibility. Responsibility and rights go together and if I want any rights of this country then I feel that I should take some responsibility.”
Dunia is 38. A sense of duty encourages her to participate – she feels that she should set an example for her daughter and get involved in things which affect her daughter’s life. Having said that, she is also motivated by her own needs.
“I try and do things at school for my daughter to see that I’m getting involved and also for me as a mum, who is not working and at home a lot, to communicate, to improve my English, to mix with other people and learn.”
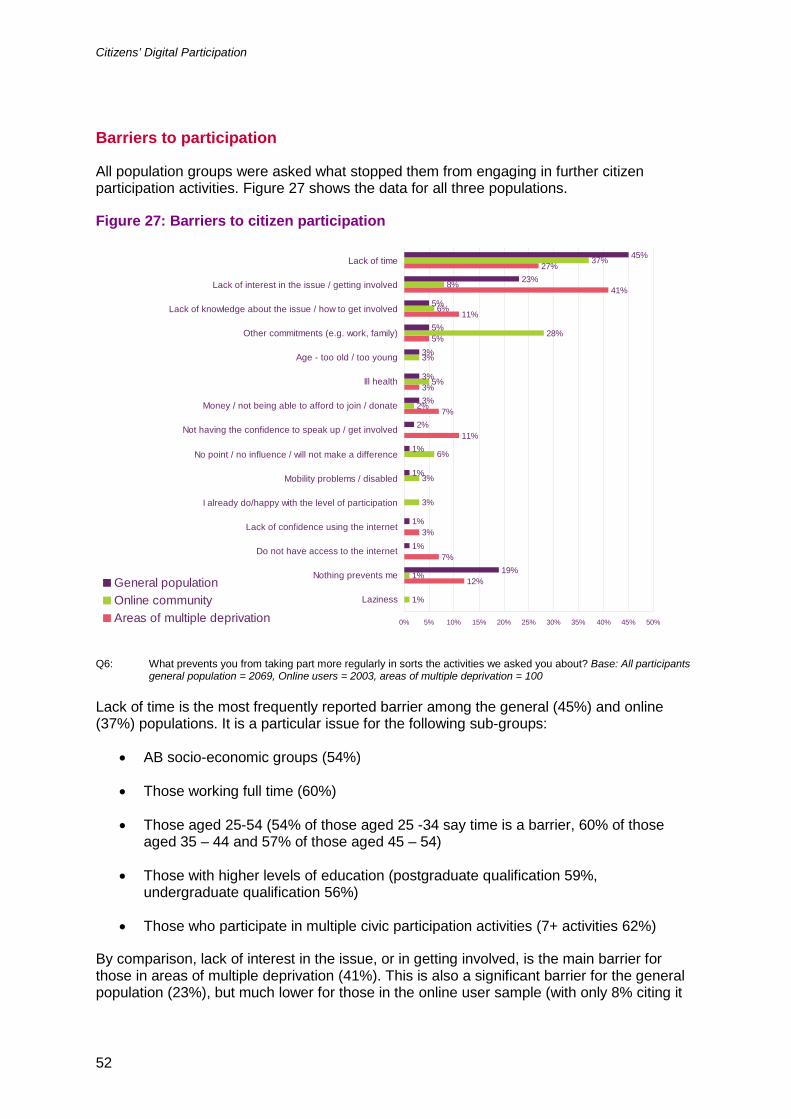
Citizens’ Digital Participation
52
Barriers to participation
All population groups were asked what stopped them from engaging in further citizen participation activities. Figure 27 shows the data for all three populations.
Figure 27: Barriers to citizen participation
12%
7%
3%
11%
7%
3%
5%
11%
41%
27%
1%
1%
3%
3%
6%
2%
5%
3%
28%
6%
8%
37%
19%
1%
1%
1%
1%
2%
3%
3%
3%
5%
5%
23%
45%
0% 5% 10% 15% 20% 25% 30% 35% 40% 45% 50%
Laziness
Nothing prevents me
Do not have access to the internet
Lack of confidence using the internet
I already do/happy with the level of participation
Mobility problems / disabled
No point / no influence / will not make a difference
Not having the confidence to speak up / get involved
Money / not being able to afford to join / donate
Ill health
Age - too old / too young
Other commitments (e.g. work, family)
Lack of knowledge about the issue / how to get involved
Lack of interest in the issue / getting involved
Lack of time
General populationOnline communityAreas of multiple deprivation
Q6: What prevents you from taking part more regularly in sorts the activities we asked you about? Base: All participants general population = 2069, Online users = 2003, areas of multiple deprivation = 100
Lack of time is the most frequently reported barrier among the general (45%) and online (37%) populations. It is a particular issue for the following sub-groups:
• AB socio-economic groups (54%)
• Those working full time (60%)
• Those aged 25-54 (54% of those aged 25 -34 say time is a barrier, 60% of those aged 35 – 44 and 57% of those aged 45 – 54)
• Those with higher levels of education (postgraduate qualification 59%, undergraduate qualification 56%)
• Those who participate in multiple civic participation activities (7+ activities 62%)
By comparison, lack of interest in the issue, or in getting involved, is the main barrier for those in areas of multiple deprivation (41%). This is also a significant barrier for the general population (23%), but much lower for those in the online user sample (with only 8% citing it
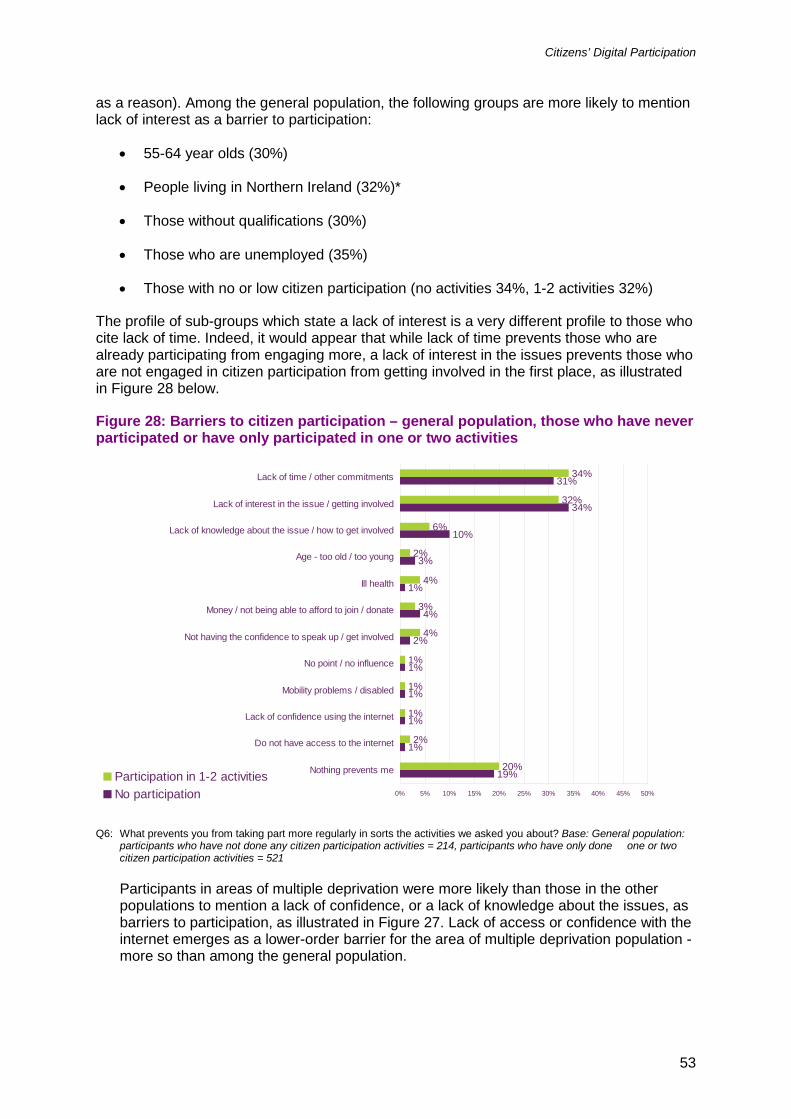
Citizens’ Digital Participation
53
as a reason). Among the general population, the following groups are more likely to mention lack of interest as a barrier to participation:
• 55-64 year olds (30%)
• People living in Northern Ireland (32%)*
• Those without qualifications (30%)
• Those who are unemployed (35%)
• Those with no or low citizen participation (no activities 34%, 1-2 activities 32%)
The profile of sub-groups which state a lack of interest is a very different profile to those who cite lack of time. Indeed, it would appear that while lack of time prevents those who are already participating from engaging more, a lack of interest in the issues prevents those who are not engaged in citizen participation from getting involved in the first place, as illustrated in Figure 28 below.
Figure 28: Barriers to citizen participation – general population, those who have never participated or have only participated in one or two activities
19%
1%
1%
1%
1%
2%
4%
1%
3%
10%
34%
31%
20%
2%
1%
1%
1%
4%
3%
4%
2%
6%
32%
34%
0% 5% 10% 15% 20% 25% 30% 35% 40% 45% 50%
Nothing prevents me
Do not have access to the internet
Lack of confidence using the internet
Mobility problems / disabled
No point / no influence
Not having the confidence to speak up / get involved
Money / not being able to afford to join / donate
Ill health
Age - too old / too young
Lack of knowledge about the issue / how to get involved
Lack of interest in the issue / getting involved
Lack of time / other commitments
Participation in 1-2 activitiesNo participation
Q6: What prevents you from taking part more regularly in sorts the activities we asked you about? Base: General population: participants who have not done any citizen participation activities = 214, participants who have only done one or two citizen participation activities = 521
Participants in areas of multiple deprivation were more likely than those in the other populations to mention a lack of confidence, or a lack of knowledge about the issues, as barriers to participation, as illustrated in Figure 27. Lack of access or confidence with the internet emerges as a lower-order barrier for the area of multiple deprivation population - more so than among the general population.
Citizens’ Digital Participation
54
Information gathered in vox pop interviews illustrates that a lack of time is a barrier to participating more frequently for a person who already participates extensively, while a lack of interest and knowledge are barriers people who participate less.
37-year-old Mark is concerned about a lack of community involvement among young single people living in London and as a gay man, feels that more could be done to encourage the gay and lesbian community to participate.
“Work commitments limit my participation. I would like to do some charity work in the future for Samaritans and the police but it’s actually getting the time away from work to do that which is hard. In London, the community doesn’t exist compared to living up north. Too many people are focused on doing their own thing, so there’s no sense of community. The unknown of joining one of these clubs is. . . what I would have to do to participate and how it would impact on my time? I think a lot more could be done to include gay or lesbian people into society. There is a minority of gay people that are not represented and the media is based on a straight society.”
Dawn, aged 30, works as a team leader. Dawn does not engage in citizen participation very often; indeed, she has not voted in recent local or general elections and admitted that this had particularly disappointed her mother who had always encouraged her to vote. It is clear from what Dawn says that a lack of awareness of the issues, as well as a lack of interest, act as barriers to her engaging in citizen participation.
“A lack of interest and information stops me voting. I’m not sure what each party represents, so don’t know which way to go. Maybe I should go and find out more about it. My honest answer is that if there was an election next month, I wouldn’t vote because of time and interest. It is mainly time and it being so busy at work to browse and socialise on the internet. If I do go on the internet it’s for a specific purpose after which I don’t explore any further. Spending the whole day at work on the computer, when I get home I want to stay away from the computer. Petitions are something that I haven’t ever been asked to sign.”
Some participants in the vox pop interviews suggested ways to encourage more participation. Their suggestions reflect the quantitative findings that lack of interest in the issues is a major barrier for those who do not participate or only participate infrequently.
22-year-old Sam, a female British Asian, argued that a lack of information and lack of confidence are key barriers to participation among those who do not currently participate. A former politics student, Sam frequently takes part in citizen participation activities and feels that more could be done to encourage those who are less engaged than she is.
“Apart from the lack of time there is a lack of information. E-petitions are easy to find online but if you actually want to get involved in something on a grassroots level it can be quite daunting for those who haven’t used the internet, people who are outside the 16-34 bracket and those who have a family to take care of. People with linguistic and cultural problems also have issues . . . There should be a drive for more information and to break the barriers that create myths in using the internet. People need more relevant education and not just literature that would make people comfortable about talking about their feelings and not feel vilified and not listened to. People feel like they are not being heard. It is a slow process but it does happen. MPs are approachable and they are not horrible or nasty people and if they are they can be held to account for it. If you write an email to them and they reply it can provide a real confidence boost. There is an issue with public confidence. . . There is a huge silent minority that have linguistic issues; a huge
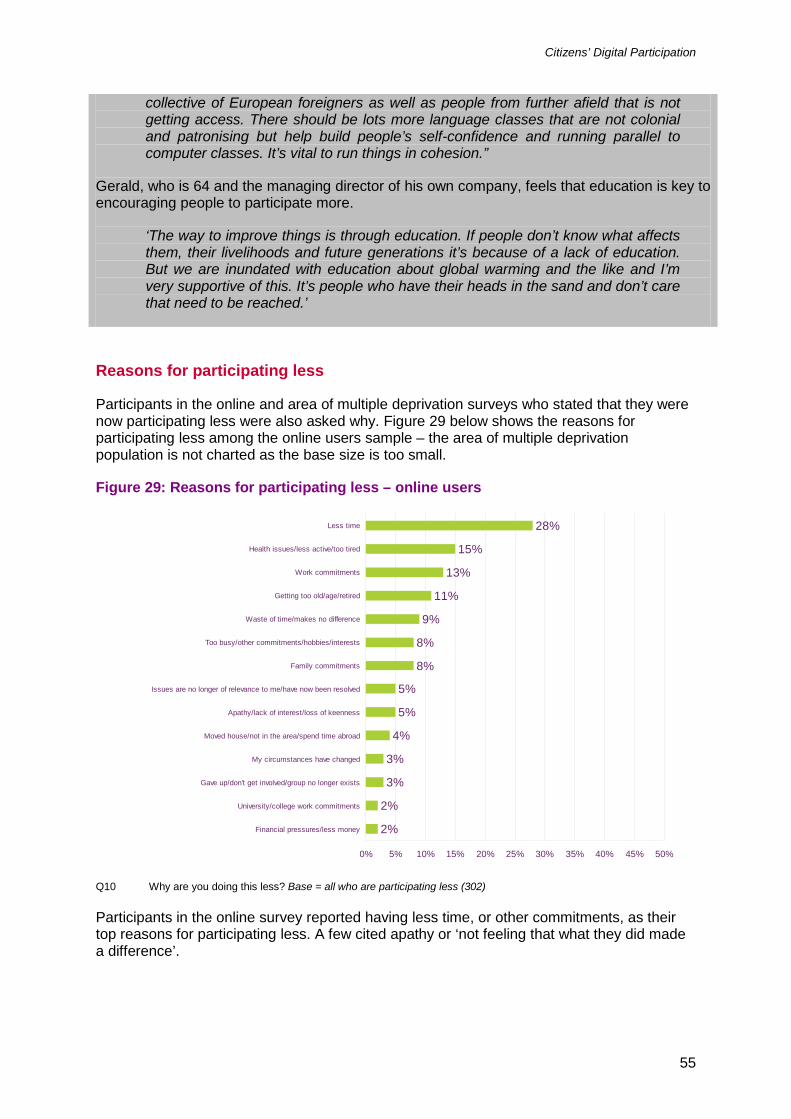
Citizens’ Digital Participation
55
collective of European foreigners as well as people from further afield that is not getting access. There should be lots more language classes that are not colonial and patronising but help build people’s self-confidence and running parallel to computer classes. It’s vital to run things in cohesion.”
Gerald, who is 64 and the managing director of his own company, feels that education is key to encouraging people to participate more.
‘The way to improve things is through education. If people don’t know what affects them, their livelihoods and future generations it’s because of a lack of education. But we are inundated with education about global warming and the like and I’m very supportive of this. It’s people who have their heads in the sand and don’t care that need to be reached.’
Reasons for participating less
Participants in the online and area of multiple deprivation surveys who stated that they were now participating less were also asked why. Figure 29 below shows the reasons for participating less among the online users sample – the area of multiple deprivation population is not charted as the base size is too small.
Figure 29: Reasons for participating less – online users
2%
2%
3%
3%
4%
5%
5%
8%
8%
9%
11%
13%
15%
28%
0% 5% 10% 15% 20% 25% 30% 35% 40% 45% 50%
Financial pressures/less money
University/college work commitments
Gave up/don't get involved/group no longer exists
My circumstances have changed
Moved house/not in the area/spend time abroad
Apathy/lack of interest/loss of keenness
Issues are no longer of relevance to me/have now been resolved
Family commitments
Too busy/other commitments/hobbies/interests
Waste of time/makes no difference
Getting too old/age/retired
Work commitments
Health issues/less active/too tired
Less time
Q10 Why are you doing this less? Base = all who are participating less (302)
Participants in the online survey reported having less time, or other commitments, as their top reasons for participating less. A few cited apathy or ‘not feeling that what they did made a difference’.