Embed Size (px)
Citation preview

Maricopa County Internal Audit
301 W. Jefferson, Suite 660
Phoenix, AZ 85003
(602) 506-1585
www.maricopa.gov/internal_audit
In This Issue
Message From County Auditor...... 2
Maricopa County Profile ................ 3
Economic Trends ........................... 4
General Fund Key Indicators ........ 5
Liquidity & Long Term Debt .......... 7
Revenues & Expenditures ............ 8
Property Taxes .............................. 11
Cash & Investments ...................... 12
County Wide Operations ………... 13
Retirement Plans …….. ............... 14
Population & Unemployment …… 16
Methodology & Sources .............. 17
PAFR Award ................................. 18
Maricopa County Shows Consistent
Fiscal Strength in FY 2011
Financial Highlights
Our Fiscal Year (FY) 2011 Citizens Financial Condition Report highlights the financial strength of the County‟s General Fund within the context of severe financial challenges currently facing the national and local economies.
Report highlights include:
FY 2011 governmental fund revenues fell below expenditures
The General Fund spendable (unrestricted) fund balance remained healthy
Key County financial indicators compared very favorably to national benchmarks
County net assets, an indicator of long term financial health, continued to increase
State retirement plans covering County employees saw funding deficits continue to increase, bringing funding levels to their lowest point in years
About the Financial Condition Report
The FY 2011 edition of the Maricopa County Citizens Financial Condition Report is based primarily on the County‟s FY 2011 Comprehensive Annual Financial Report issued December 2011 by the Department of Finance.
This work provides information, trends, and comparisons on County financial topics including:
Revenues and Expenditures
Cash and Investments
Liquidity and Long Term Debt
January XX, 2012
CITIZENS FINANCIAL
CONDITION REPORT MARICOPA COUNTY FISCAL YEAR END JUNE 30, 2011
February 14, 2012
MESSAGE FROM THE COUNTY AUDITOR
Maricopa County Internal Audit 2 FY 2011 Citizens Financial Condition Report
February 14, 2012 Max Wilson, Chairman, Board of Supervisors Fulton Brock, Supervisor, District I Don Stapley, Supervisor, District II Andrew Kunasek, Supervisor, District III Mary Rose Wilcox, Supervisor, District V We have completed the Fiscal Year (FY) 2011 edition of the Maricopa County Citizens Financial Condition Report based primarily on the County‟s FY 2011 Comprehensive Annual Financial Report issued in December 2011. This work, which is part of our Board-approved audit plan, provides important information on current and historical County financial trends. For FY 2011, we again highlight the financial strength of the County‟s General Fund. While national and local economies encountered severe financial challenges, the County (due to conservative fiscal policies) acted to maintain strong reserves. As a result, the General Fund‟s spendable fund balance exceeds the governmental experts‟ recommended reserve level. This reserve level allows the County to keep long-term debt low and utilize “pay-as-you-go” capital financing. Key financial indicators compare very favorably to national benchmarks. In addition, we provide updated information on the State pension plans covering County employees. Public pension funds are experiencing fiscal challenges due to recent investment losses, high benefit payments, actuarial methods used in longevity projections, and insufficient employee and employer contribution rates. We would like to commend the Board of Supervisors and County leadership for the conservative fiscal policies that have led to the strong financial condition highlighted throughout this report. Sincerely,
Ross L. Tate
County Auditor
The County Auditor reports directly to the Maricopa County Board of Supervisors, with an advisory reporting relationship to the Citizen‟s Audit Advisory Committee.
The Mission of the Internal Audit Department is to provide objective information on the County‟s system of internal controls to the Board of Supervisors so they can make informed decisions and
protect the interests of County citizens.
Project Team Members
Eve Murillo, CPA, MBA, CFE, ITIL, Deputy County Auditor
Stella Fusaro, CIA, CGAP, CFE, CLEA, Audit Supervisor
Scott Jarrett, CIA, CGAP, ITIL, CLEA, Senior Auditor
Stephanie M. Lopez, CPA, Senior Auditor

Board of Supervisors
MARICOPA COUNTY PROFILE
Population (Source: U.S. Census Bureau Reports)
Maricopa County is home to 3.8 million people,
the 4th largest population in the nation after Los
Angeles County (CA), Cook County (Chicago,
IL), and Harris County (Houston, TX).
The County‟s population grew by 735,174 from
July 2000 to July 2010, the biggest population
increase in the nation (2011 data unavailable).
Size (Source: Maricopa County FY11 CAFR & FY11 Adopted Budget)
At 9,224 square miles, Maricopa County is larger
than several states, including Connecticut,
Delaware, Hawaii, Massachusetts, New
Hampshire, New Jersey, Rhode Island, as well
as the District of Colombia.
Financial (Source: Maricopa County FY11 CAFR)
As of June 30, 2011, the County had $1.5 billion
in cash and investments.
The County received $1.8 billion in revenue
during FY 2011.
The General Fund spendable fund balance
was $409 million in FY 2011, down $80 million
from the previous year.
History (Source: Maricopa County website)
Established in 1871, Maricopa was the fifth
county to be formed in what was then the
Arizona Territory.
Maricopa County Internal Audit 3 FY 2011 Citizens Financial Condition Report
1
Fulton Brock
District
Don Stapley
District
Andrew Kunasek
District
Max Wilson
District
Mary Rose Wilcox
District
5 2 3 4
State of Arizona
Maricopa County
Maricopa County Maricopa County is located in the south-central
area of the State of Arizona. Approximately 60%
of the state‟s total population resides within the
County, which includes the cities of Phoenix,
Mesa, Tempe, Glendale, and Scottsdale.
Maricopa County operates under a five member
elected Board of Supervisors representing five
districts divided geographically and by
population to include a mix of urban and rural
constituencies.

3.63.7
3.8 3.8 3.8
14.715.1
14.8
13.6 13.7
12.0
13.0
14.0
15.0
16.0
3.0
3.2
3.4
3.6
3.8
4.0
FY07 FY08 FY09 FY10 FY11
County Population Staffing
$-
$10
$20
$30
$40
$50
$-
$200
$400
$600
FY07 FY08 FY09 FY10 FY11
Operating Levy Primary Assessed Value
$-
$300
$600
$900
FY08 FY09 FY10 FY11
ECONOMIC TRENDS
Maricopa County Internal Audit 4 FY 2011 Citizens Financial Condition Report
Conservative budget strategies kept the
County financially healthy despite Arizona‟s
economic challenges. The County maintained
a hiring freeze for non-critical positions, and
budgeted staffing levels remained steady from
the prior fiscal year. However, total budgeted
staffing levels have dropped approximately
nine percent from FY 2008.
The property taxes billed (levied) to finance general
County operations remained relatively level in FY
2011 compared to FY 2010.
Property tax levies are derived from a combination of
the tax rate and the assessed valuation of properties
in Maricopa County. Any change in these factors
has a direct impact on property tax revenue levels.
In FY 2011 the County saw an increase in two of
its major revenue sources (state shared sales tax
and jail excise tax). This uptick increased total
revenues over the prior year, but under levels
experienced in FY 2008 and FY 2009.
Jail Excise: $ 26 million 19%
Vehicle License: $ 27 million 18%
State Shared Sales: $ 76 million 16%
Total decline: $129 million
$461
$385 $395
$149
$122 $135
$138
$112 $117
$619
$748
$647
(in millions)
SOURCE: “Tax Revenues by Source” (Statistical Section Maricopa County CAFRs)
SOURCE: “Property Tax Levies and Collections” (Statistical Section Maricopa County CAFRs)
SOURCE: Maricopa County CAFRs & U.S. Census Bureau Reports
Dollar & Percentage Decline from FY 2008
$598
$107
$125
$366
(In millions)
No Change in Operating Property Taxes Billed (Levied) FY 2010—FY 2011
Ass
esse
d v
alu
e in
bill
ion
s
Gen
. pro
per
ty t
ax in
mill
ion
s
Sales Tax Begins to Trend Upwards
(In thousands)
Budgeted Staffing Levels Remain Flat

$249 $289
$316
$428
$540
$445
$512
$410
$489
$409
$-
$100
$200
$300
$400
$500
$600
GENERAL FUND KEY INDICATORS
Maricopa County Internal Audit 5 FY 2011 Citizens Financial Condition Report
General Fund Spendable Fund Balance
The spendable fund balance in the General Fund
represents funds available to meet current and future
needs. The $80 million (16%) decrease in spendable fund
balance in FY 2011 was the result of budgeting resources
for technology capital projects. The budgeting was part of
the County‟s „pay-as-you go‟ financing plan for large
technology projects.
Of the total spendable fund balance (available funds), a
significant portion (40%) is committed to stabilize the
budget (funds are reserved for times of drastic revenue
shortfalls or unforeseen significant expenditures). This was
authorized by the Board of Supervisors; any modifications
would require formal Board action. The remaining portions
of spendable fund balance are designated to general
government (55%) and unassigned (5%).
SOURCE: “Governmental Funds Balance Sheet” (Maricopa County CAFRs)
General Fund Spendable Fund Balance Decreased
Criminal Court Tower under construction during FY 2011
SOURCE: FY 12 Adopted Budget
(in millions)
The General Fund is the primary operating fund used to account for all
financial resources not required to be accounted for in other funds.

33%
37%
18%14%
5%
10%
15%
20%
25%
30%
35%
40%
45%
50%
Maricopa County Avg of Benchmark Counties
SOURCE: Maricopa County FY 11 CAFR
GENERAL FUND KEY INDICATORS
Maricopa County Internal Audit 6 FY 2011 Citizens Financial Condition Report
General Fund Spendable Fund Balance as a Percent of Revenues
For over ten years, Maricopa County‟s General Fund has maintained a healthy spendable fund balance (available funds) in relation to revenues, and surpassed the national benchmark average (see page 17 for a list of benchmark counties).
The graph below reflects the availability of financial reserves to meet unforeseen needs.
Fund Balance Compares Well to Benchmarks
SOURCE: “Balance Sheet and Statement of Revenues, Expenditures, and Changes in Fund Balances Governmental Funds” (Maricopa & Benchmark County CAFRs)
General Obligation Bonds (implied or issuer credit rating)
Fitch AAA April 2011
Standard & Poor‟s AAA March 2011
General Fund Operating Reserves
The Government Finance Officers Association recommends that governments have spendable fund
balance available to cover at least two months of regular general fund expenditures in the event of
drastic revenue shortfalls.
Maricopa County has reserves that exceed the recommended balance and the national benchmark
average of just under two months.
Credit rating agencies review the health of the spendable
fund balance when assessing credit worthiness. Maricopa
County‟s high percentage of General Fund spendable fund
balance, when compared to revenues, could lower the
County‟s cost of borrowing money.
$91
$352$399
$569 $580$668
$728$795
$871$941
$1,400
$0
$300
$600
$900
$1,200
$1,500
9.2
14.8
2.4 2.1
0.0
5.0
10.0
15.0
20.0
Maricopa Avg of Benchmark Counties
LIQUIDITY & LONG TERM DEBT
Maricopa County Internal Audit 7 FY 2011 Citizens Financial Condition Report
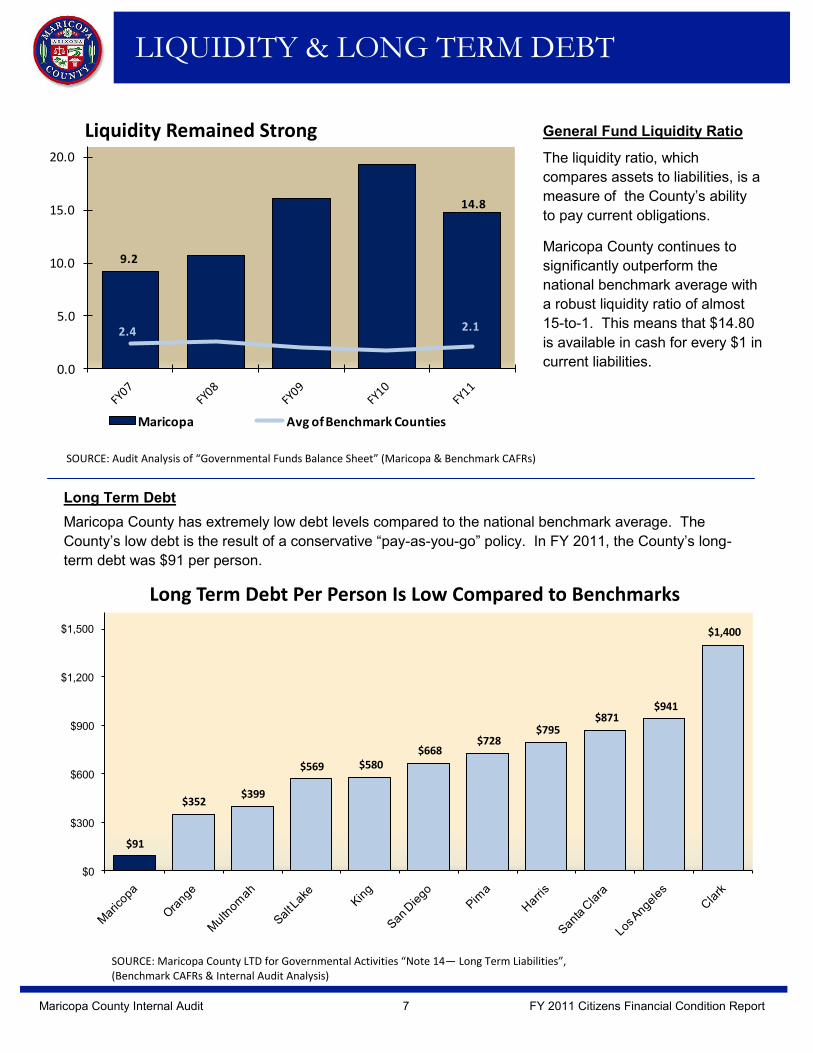
General Fund Liquidity Ratio
The liquidity ratio, which
compares assets to liabilities, is a
measure of the County‟s ability
to pay current obligations.
Maricopa County continues to
significantly outperform the
national benchmark average with
a robust liquidity ratio of almost
15-to-1. This means that $14.80
is available in cash for every $1 in
current liabilities.
Long Term Debt
Maricopa County has extremely low debt levels compared to the national benchmark average. The
County‟s low debt is the result of a conservative “pay-as-you-go” policy. In FY 2011, the County‟s long-
term debt was $91 per person.
SOURCE: Audit Analysis of “Governmental Funds Balance Sheet” (Maricopa & Benchmark CAFRs)
SOURCE: Maricopa County LTD for Governmental Activities “Note 14— Long Term Liabilities”, (Benchmark CAFRs & Internal Audit Analysis)
Long Term Debt Per Person Is Low Compared to Benchmarks
Liquidity Remained Strong

$2,015
$1,919$1,819
$1,781 $1,815$1,873
$1,841 $1,815
$1,687
$1,844
$1,000
$1,500
$2,000
FY07 FY08 FY09 FY10 FY 11
Revenues
Expenditures
SOURCE: “Statement of Revenues, Expenditures, & Changes in Fund Balances Governmental Funds” (Maricopa County FY11 CAFR)
REVENUES & EXPENDITURES
Maricopa County Internal Audit 8 FY 2011 Citizens Financial Condition Report
Sources of County Funds
The majority of the County‟s Governmental Fund
revenues come from intergovernmental sources
(44%) and taxes (40%).
Intergovernmental revenues are funds received from
federal, state, and other local government sources in
the form of shared revenues, grants, and payments
in lieu of taxes.
County-generated tax revenues such as property,
jail excise, and other small tax sources, accounted
for 40% of the County‟s total governmental revenue.
Intergovernmental (State Shared Sales Tax,
Vehicle License Tax, Grants)
$803
44% 40%
10%
County Generated Taxes (Property Tax, Jail Excise Tax, & other small tax sources)
$716
Fines, Forfeits, & Special Assessments $40 (2%)
Licenses & Permits $41 (2%)
$186 Charges for Service
$29 (2%) Miscellaneous
In FY 2011, governmental revenues increased by $33.9 million
to $1.82 billion; however, expenditures increased by $157.3
million to $1.84 billion, surpassing total revenues. The
expenditure increase was due to planned capital outlays. FY
2011 saw over $122 million spent for the new Criminal Court
Tower, a budgeted, multi-year project set to be completed in
FY 2012. The increase was also a result of an additional $27.3
million spent on ALTCS (Arizona Long Term Care System)
contributions, as a result of a reduction in Federal Medical
Assistance Percentage stimulus monies from the prior year.
SOURCE: “Statement of Revenues, Expenditures, & Changes in Fund Balances Governmental Funds” (Maricopa County CAFRs)
Expenditures Exceed Revenues As Planned
(in millions)
(in millions)
Due to the State budget crisis, the State
has been shifting costs and reducing
revenue streams to counties in order to
balance its own budget.
The most significant costs have been
mandatory cash contributions to the State.
Only two counties have been required to
contribute: Maricopa and Pima. In the last
two fiscal years alone, Maricopa County
has paid over $47 million in cash to the
State.
Additional revenue cuts and cost shifts have
come in the form of a diversion of highway
revenue funds, elimination of lottery funds,
additional expenditures for judicial salaries,
and inmate health costs, just to name a few.
The County is subsidizing State operations
and the trend is projected to continue into
FY 2012.
SOURCE: County Financial System & Annual Budget Strategies
State Budget Crisis Impacts County

$1,117 $1,053
$495 $482
$200
$600
$1,000
FY04 FY05 FY06 FY07 FY08 FY09 FY10 FY11
Benchmark Average Maricopa County
$0
$300
$600
$900
Public Safety Health, Welfare and Sanitation
Capital Outlay General Government Highway & Streets Other
FY09 FY10 FY11
REVENUE & EXPENDITURES
Maricopa County Internal Audit 9 FY 2011 Citizens Financial Condition Report
County Expenditures Increase (FY 2009—FY 2011)
SOURCE: “Statement of Revenues, Expenditures, and Changes in Fund Balances Governmental Funds” (Maricopa County CAFRs)
Expenditures Per Person
Expenditures per person increased in
FY 2011 due to critical capital outlay
expenditures and a reduction in total
population.
However, FY 2011 expenditures per
person of $482 were almost $24
dollars (5%) below the County‟s eight-
year average of $505 per person.
SOURCE: Audit Analysis of “Changes in Fund Balances, Governmental Funds” & “Population statistics” (Statistical Section Maricopa County & Benchmark CAFRs)
(in millions)
(adjusted for inflation)
Expenditures Per Person Remain Low
Changes in Expenditures by Category
FY 2011 was the first year since FY 2006 that total governmental expenditures increased. Expenditures
increased nine percent over the prior fiscal year, most notably in the health, welfare and sanitation, and
capital outlay functions. The increase in health, welfare and sanitation is primarily due to an expiration of
American Recovery and Reinvestment Act (ARRA) funding through the Federal Medical Assistance
Percentage (FMAP) Program. ARRA funding lowered their costs in the prior fiscal year. The funding
reduction resulted in an increase of over $27 million in County ALTCS contributions during FY 2011. In
addition, the County spent over $122 million during FY 2011 to build the Criminal Court Tower.
Governmental Funds are comprised of
general, special revenue (legally
restricted for specified purposes), debt
service (restricted for the repayment of
debt), and capital project funds
(restricted for capital activities).

White Tanks Library & Nature Center, partially funded through
governmental capital outlay expenditures
SOURCE: Library District Internal Audit Report
Debt Service, $6
REVENUE & EXPENDITURES
Maricopa County Internal Audit 10 FY 2011 Citizens Financial Condition Report
Uses of County Funds
Over 65% of FY 2011 Governmental Fund
expenditures were for public safety (45%)
and health and welfare (21%), with the
remaining amount for capital outlay
(17%), general government (11%),
highways (3%), and other uses (3%).
General government consists of a broad
range of legally mandated services
including elections, property assessment,
revenue and expenditure accountability,
and legal representation for the County.
Public Safety
$830
Health, Welfare, & Sanitation $384
21% 17%
45% 11%
Other
$63 (3%)
Highway & Streets
$53 (3%)
General Govt.
$193
SOURCE: “Statement of Revenues, Expenditures, & Changes in Fund Balances Governmental Funds” (Maricopa County FY11 CAFR)
Capital Outlay
$320
(in millions)
Public Safety,
$217
General Government,
$51
Capital Outlay,
$84
Education, $2
Culture & Recreation, $8
Health, Welfare &
Sanitation $100
Highways & Streets,
$14
Expenditures Per Citizen—By Function
In FY 2011, the County spent $482 per citizen for all
services. Approximately $217 per citizen was spent on
public safety, followed by health, welfare & sanitation at
$100. Capital outlay accounted for $84 and general
government just under $51. The remaining functions
accounted for $30.
$482 per
citizen
Animal Control Field Enforcement, funded through general
government expenditures
SOURCE: Animal Control Annual Report FY 2011

$33
$50
1.46%1.24%
1.0%
1.5%
2.0%
$-
$20
$40
$60
2006 2007 2008 2009 2010 2011
Total Secured and Unsecured Assessed Property
Values (in billions)
County Total Direct Property Tax Rate
$207.52 $182.75
$-
$50
$100
$150
$200
$250
$300
FY 10 FY 11
Most Property Tax Dollars Go to Schools
PROPERTY TAXES
Maricopa County Internal Audit 11 FY 2011 Citizens Financial Condition Report
Property taxes are a major source of revenue for local governments
in Maricopa County. The total FY 2011 allocation of property taxes
for Maricopa County, school districts, cities and towns, and special
districts, was $4.4 billion.
Cities/Towns/Special Districts
$794
Schools &
Education
$3,043
Maricopa County
$581
69%
13%
18% How the typical Maricopa County FY 2011 property tax dollar was spent:
Schools $ 0.69
Cities and Towns $ 0.13
County $ 0.13
Special Districts $ 0.05
Total $ 1.00
Average Homeowner Property Tax Bill Decreases
The Maricopa County Board of Supervisors
approved a property tax rate increase for
FY 2011 for the first time in over 10 years.
Assessed valuations had been projected to
fall as a result of the economy, and to help
mitigate the effects of a reduced revenue
base, the tax rate was increased.
SOURCE: Department of Finance Property Tax Levy Reports
SOURCE: “Assessed Value & Estimated Market Value of Taxable Property” (Statistical Section Maricopa County CAFRs)
Property Tax Rate Increased as
Assessed Values Declined
Despite the tax rate increase noted below, the average
homeowner property tax bill decreased almost 12% from
the prior fiscal year.
The decrease is due to the decline in assessed property
valuations in Maricopa County. From FY 2010 to FY
2011, the median residential value fell over $43,000 or
23%.
SOURCE: OMB FY 2011 Property Tax Adoption Presentation
For every $1 in property tax revenue, the County only received 13 cents
Median Residential Value:
FY 2010: $192,000
FY 2011: $148,800
(in millions)

4.69%
2.60%
1.71%
2.42%
3.13%
4.08%
4.45%
3.00%
1.18%1.05%
0%
2%
4%
6%
8%
FY02 FY03 FY04 FY05 FY06 FY07 FY08 FY09 FY10 FY11
$2.7
$3.1
$3.7 $3.9
$3.6 $3.7 $3.9
$-
$1.0
$2.0
$3.0
$4.0
FY05 FY06 FY07 FY08 FY09 FY10 FY 11
CASH & INVESTMENTS
Maricopa County Internal Audit 12 FY 2011 Citizens Financial Condition Report
Cash and Investments
The County Treasurer pools
deposits for the County,
school districts, and special
districts. Total cash and
investments held by the
Treasurer increased $188
million to $3.9 billion in FY
2011.
Non-County Funds: Arizona Statutes
require community colleges, school districts,
and other local governments to deposit certain
public monies with the County Treasurer.
These deposits represent 61% of the total
funds held with the Treasurer.
County Funds: $1.5 billion, or 39% of the $3.9
billion held by the Treasurer as of June 30,
2011, were County funds.
Investment Strategy and Returns
Cash is invested under a strategy giving highest priority to:
Safety of principal
Sufficient liquidity to meet County needs
Return on investment
Investment returns fell to 1.05% in FY 2011 due to poor bond market earnings. Bonds are one of the County‟s primary investments.
Non-County Funds
$2.4 Billion
61%
County General Fund
$343 Million
Other County Funds
$1.2 Billion
9%
30%
Cash and Investments Increased Slightly
SOURCE: “Deposit and Investments” Note (Maricopa County CAFRs)
SOURCE: “Balance Sheet”, “Note 7—Deposit and Investments” (Maricopa County FY11 CAFR), & Internal Audit Analysis
Investment Returns Remain Low
SOURCE: Maricopa County Treasurer
(in billions)
Most Cash is Non-County

11%
45%
0%
10%
20%
30%
40%
50%
Maricopa County Avg of Benchmarks
$3.3 $3.6
$3.8 $4.0
$4.3 $4.5
$0
$1
$2
$3
$4
$5
FY06 FY07 FY08 FY09 FY10 FY11
COUNTY WIDE OPERATIONS
Maricopa County Internal Audit 13 FY 2011 Citizens Financial Condition Report
Net Asset Composition
Net assets have three components:
(1) Invested in capital assets, net of related debt (such as land, building, machinery, and equipment)
(2) Restricted net assets (assets that are subject to external restrictions on how they may be used)
(3) Unrestricted net assets (assets not subject to external restrictions on how they may be used)
Over 69% of the County‟s FY 2011 net assets are invested in capital assets (net of related debt), 14% are
restricted (primarily for public safety and highways and streets functions), and 17% are unrestricted (can be
used to meet the County‟s ongoing obligations).
As of June 30, 2011, the County‟s assets exceeded
liabilities by almost $4.5 billion (net assets). The
increase in total net assets over time indicates the
County‟s financial condition improved. Total net assets
increased 35% from FY 2006 to FY 2011.
Composition of Net Assets (in millions)
Invested in Capital
Assets
$3,096.6
69%
17%
14%
Restricted
$627.5
Unrestricted
$766.4
SOURCE: “Statement of Net Assets” (Maricopa County CAFRs)
SOURCE: “Statement of Net Assets” (Maricopa County FY11 CAFR)
Total Net Assets Continued to Increase
(in billions)
Debt Used Sparingly at the County
FY 2011
Only 11% of the County‟s assets are purchased
using debt financing, significantly lower than the
benchmark average of 45% in FY 2011. The
County‟s “pay-as-you-go” capital financing policy
reduces the burden of future payments and helps
conservatively manage the County‟s resources.

120%
82%77% 76%
50.0%
60.0%
70.0%
80.0%
90.0%
100.0%
110.0%
120.0%
130.0%
RETIREMENT PLANS
Maricopa County Internal Audit 14 FY 2011 Citizens Financial Condition Report
The County contributes to four retirement plans, the Arizona State Retirement System (ASRS), the Public
Safety Personnel Retirement System (PSPRS), the Correction Officers Retirement Plan (CORP), and the
Elected Officials Retirement Plan (EORP). This section focuses on the financial health of these plans.
Funded Status Defined
A key measure of a retirement plan‟s health is its funding ratio, derived by comparing assets to liabilities. A
pension plan whose assets equal its liabilities is 100% funded, or fully funded. A plan with assets that are
less than its liabilities is considered to be underfunded or in a deficit position.
ASRS Retirement Funding Status
The ASRS is the largest retirement plan used by the County, with over 8,500 (70%) County employees
contributing.
Based on the FY 2011 ASRS actuarial report, the plan deficit grew over $590 million, or 6.8%, to $9.3 billion,
as of June 30, 2011.
This increase was largely due to delayed recognition of losses that occurred in FYs 2002, 2003, 2008, and
2009. As a result, the funded status of the total plan decreased from 76.7% in FY 2010 to 75.8% in FY 2011.
Retirement Plan Remains Underfunded
SURPLUS: FY00 $3.6 Billion
FULLY FUNDED
DEFICIT:
FY 2011 - $9.3 Billion
According to a 2008 U.S. Government Accountability Office report on government
pension plans, many experts believe an 80%
funding ratio is sufficient.
SOURCE: ASRS CAFRs and annual actuarial reports

68%
83%
71%
66%
80%
67%
62%
73%
62%50%
60%
70%
80%
90%
100%
Public Safety Correction Officers Elected Officials
FY 09
FY 10
FY 11
RETIREMENT PLANS
Maricopa County Internal Audit 15 FY 2011 Citizens Financial Condition Report
Retirement Plan Comparison FY 2011
Retirement Plan Funding
Status
Unfunded
Liability
County
Employees
Contribution Rates Employee Employer
Arizona State Retirement System 75.8% $9.3 Billion 8,530 9.85% 9.85%
Public Safety Personnel Retirement
System
61.9% $3.6 Billion 641 7.65% 20.89%
Correctional Officers Retirement
Plan
73.0% $541.8 Million 2,876 7.96% 8.57%
Elected Officials Retirement Plan 62.1% $223.9 Million 175 7.0% 29.79%
SOURCE: ASRS, PSPRS, CORP & EORP CAFRs and Actuarial Reports FY 11
PSPRS, CORP, EORP Retirement Funding Status
The CORP is the second largest retirement plan used by the County, with over 2,800 (24%) of County
employees contributing, followed by PSPRS with over 600 County participants (5%), and EORP with 175
County participants (1%).
Based on FY 2011 actuarial reports for each plan, the combined plan deficits grew to over $4.3 billion in
FY 2011, a $1.37 billion, or 46% increase over FY 2009.
This increase was largely due to the delayed recognition of losses that occurred in prior years, as well as
lower than expected pay increases and returns on fund assets. At year end, the three plans had over $962
million in unrecognized losses that are to be realized over a 7-year trend period. In the absence of other
gains, contribution rates will need to increase over the next several years to compensate for these losses.
Funding Status Weakens for All Plans
FULLY FUNDED
COMBINED DEFICIT:
FY 2011 - $4.3 Billion

735,174 696,532 644,347
560,351
360,739
Maricopa County, AZ
Harris County, TX
Riverside County, CA
Clark County, NV
Tarrant County, TX
2.0%
4.0%
6.0%
8.0%
10.0%
12.0%
2001 2002 2003 2004 2005 2006 2007 2008 2009 2010 2011
Maricopa County
State of Arizona
United States
9,830,420
5,200,9504,110,771 3,827,371
3,105,989
0
2,000,000
4,000,000
6,000,000
8,000,000
10,000,000
12,000,000
Los Angeles County, CA
Cook County, IL
Harris County, TX
Maricopa County, AZ
San Diego County, CA
POPULATION & UNEMPLOYMENT
Maricopa County Internal Audit 16 FY 2011 Citizens Financial Condition Report
Unemployment
Maricopa County‟s
unemployment rate
continues to remain below
national and Arizona
averages. Since 2007 the
national, Arizona, and
Maricopa County
unemployment rates have
increased significantly. In
2011, Maricopa County‟s
unemployment rate was
8.8%, a large increase
over 2007‟s rate of 3.1%.
Population Growth
In addition to adding
nearly 24,000 people from
July 2009 to July 2010,
Maricopa County gained
735,174 residents from
April 2000 to July 2010,
more than any other
county in the nation.
Maricopa County’s Population Growth is Fastest in Nation
SOURCE: 2010 Estimated U.S. Census Bureau Reports
Population
Maricopa County has
been ranked the fourth
most populous of all
3,143 counties in the
nation.
SOURCE: AZ Department of Administration and U.S. Labor Statistics
Maricopa County’s Population is 4th Largest in Nation
SOURCE: 2010 Estimated U.S. Census Bureau Reports
Unemployment Rates Drop Slightly FY 2010-FY 2011
FY 11 Rate—8.8%
FY 11 Rate—9.9%
FY 11 Rate—9.1%

METHODOLOGY & SOURCES
Maricopa County Internal Audit 17 FY 2011 Citizens Financial Condition Report
Definition
Financial Condition is defined as a local government‟s ability to finance services on a continuing basis. A county in good financial condition can sustain existing services to the public, withstand economic downturns, and meet the demands of changing service needs.
Objective, Scope, and Methodology
The objective of this report is to evaluate Maricopa County‟s financial condition using key financial indicators.
Indicators judged to be the most indicative of a county‟s overall financial health were selected from
authoritative sources.
Our primary information sources were the audited Comprehensive Annual Financial Reports (CAFR) issued
by ten national benchmark counties and Maricopa County. Our analysis did not include the non-major
governmental funds. Below are the benchmark counties that were used in this report.
Other sources included: the Arizona State Retirement System, the Public Safety Personnel Retirement
System, the Correction Officers Retirement Plan, and the Elected Official Retirement Plan CAFRs and
actuarial reports; U.S. Census Bureau; Governmental Accounting Standards Board; International City/County
Managers Association; Government Finance Officers Association; Maricopa County‟s Strategic Plans
(budgetary documents); and correspondence with internal and external staff.
Trend analyses are used in this report. Trend analysis involves examining historical data. Adjustments for
inflation were made according to the “U.S. Consumer Price Index—All Items.”
Maricopa County CAFR
Maricopa County‟s FY 2011 CAFR and prior year CAFRs are available by visiting the Maricopa County
Department of Finance website at: http://www.maricopa.gov/Finance/CAFR.aspx. These CAFRs will provide
additional detail on the content presented in this report.
National Benchmarks
County Population Major Metro Area
Clark 1,954,260 Las Vegas, Nevada
Harris 4,110,771 Houston, Texas
King 1,937,961 Seattle, Washington
Los Angeles 9,830,420 Los Angeles, California
Multnomah 737,902 Portland, Oregon
Orange 3,018,963 Santa Ana/Anaheim, California
Pima 982,154 Tucson, Arizona
Salt Lake 1,033,910 Salt Lake City, Utah
San Diego 3,105,989 San Diego, California
Santa Clara 1,787,694 San Jose, California
SOURCE: 2010 Estimated U.S. Census Bureau Reports

PAFR AWARD
Maricopa County Internal Audit 18 FY 2011 Citizens Financial Condition Report
Outstanding Achievement Award
The Government Finance Officers Association of the United States and Canada (GFOA) has given an Award for Outstanding Achievement in Popular Annual Financial Reporting to Maricopa County for its Popular Annual Financial Report (PAFR) for the fiscal year ended June, 30, 2010. The Award for Outstanding Achievement in Popular Annual Financial reporting is a prestigious national award recognizing conformance with the highest standards for preparation of state and local government popular reports.
In order to receive an Award for Outstanding Achievement in Popular Annual Financial Reporting, a government unit must publish a Popular Annual Financial Report, whose contents conform to program standards of creativity, presentation, understandability, and reader appeal.
An Award for Outstanding Achievement in Popular Annual Financial Reporting is valid for a period of one year only. We believe our current report continues to conform to the Popular Annual Financial reporting requirements, and we are submitting it to GFOA.
Report Photos
Cover: Mountain butte (top right) taken at Superstition Mountains, Lost Dutchman‟s State Park. Century bush (bottom left) taken at Four Peaks Foothills. Both locations are close to the borders of Maricopa and Gila Counties.
Mountain butte (left) taken at Superstition Mountains, Lost Dutchman‟s State Park.
All landscape photos taken by Marcus Reinkensmeyer.