Embed Size (px)
Citation preview

Office of Institutional Research
CITY COLLEGE OF NEW YORK

PREFACE CITY FACTS 2015 describes CCNY student demographics. It is an annual publication of the Institutional Research Office (IR). It has a decade of information for each of its twenty four tables except for the Fall 2012-2015 Undergraduates, Master & Doctoral Students by Gender, Full/Part-time Type & Ethnicity that use the IPEDS Multiple Ethnicity Categories. There is a link in Table 2 that will take you to City Facts Fall 2014 for the prior years. Student Data: The Past Decade Here are Fall semester enrollment trends and other student data. Total student data comes first followed by undergraduate, graduate - Masters and Engineering Ph.D. students; The CUNY Grad Center gets credit for our other PHD students. Notes Context-specific references are cited in each table and graph in CITY FACTS. Sources give details on how CUNY treats statistical enrollment and course data. Data Sources and Interpretation of Statistical Tables

ACKNOWLEDGMENTS Thanks to the people who helped with City Facts: Ariel Cohn, Manager of Information Systems in the CUNY Office of Institutional Research & Analysis [OIRA] and CUNYFIRST guru. Without her work on the CUNY Instructional Research Data Base [IRDB] no edition of City Facts would be possible. The CUNY Office of Institutional Research & Analysis [OIRA] staff for their help with my - far too many - questions. Rodel Sena for his help, patience and for guiding me through the CUNYFIRST SQL tables. Ed Silverman, Director Institutional Research Office March 2016

TABLE OF CONTENTS Preface Acknowledgments Table 1a: Fall 2006-2015 Total Undergraduate and Graduate Enrollment by Full/Part-time Status Table 1b: Fall 2006-2015 Total Undergraduate and Graduate Enrollment by Gender Table 1c: Fall 2006-2015 Total Undergraduate and Graduate Enrollment by Class Level Graph 1: Enrollment Fall 2006-2015 Full/Part-Time & All Women & Men Undergraduates, MA/MS & PHD students Table 2: Fall 2012-2015 Doctoral, Masters & Undergraduate Students by Gender uses IPEDS' Ethnicity. Graph 2a: Fall 2012-2015 Undergraduate Students' Ethnicity Graph 2b: Fall 2012-2015 Masters Students' Ethnicity Graph 2c: Fall 2012-2015 Doctoral Students' Ethnicity Table 3 Fall 2012-2015 Admitted Students by Type & IPEDS Ethnicity Table 4 Fall 2005-2015 Admitted and Registered Students Table 5: Fall 2006-2015 Students by Class Standing and Enrollment Level Table 6: Fall 2006-2015 SEEK Students by Enrollment Status Table 7: Fall 2006-2015 Full/Part-time Students by Enrollment Status Table 8a: Fall 2005 - 2015 Undergraduate FTEs by Department Table 8b: Fall 2005 - 2015 Undergraduate FTEs by School/Division Table 8c: Fall 2005 - 2015 Masters FTEs by Department Table 8d: Fall 2008 - 2015 DOCTORAL FTEs by Department Graph 8: Fall 2005-2015 Undergraduate and Graduate FTEs
DOCTORAL FTEs are included in the Graduate FTEs Table 9a: Degrees Awarded, 2005-06 through 2014-15

Table 9b: Degrees Awarded, 2005-06 through 2014-15 by Gender Table 9c: Degrees Awarded, 2005-06 through 2014-15 Ethnicity Graph 9: Degrees Awarded 2006 through 2015 – Table 10: Fall 2006-2015 All Students by Residence and Gender Table 11a: Fall 2006-2015 Students by Native Language and Gender Table 11b: Fall 2006-2015 Students by Country and Gender Table 12 Fall 2006-2015 Undergraduates Enrollment by Level Graph 12 Fall 2006-2015: Undergraduate Enrollment by Level Table 13: Fall 2006-2015 Enrollment by Lower/Upper & Graduate Divisions, Full/Part-time Graph 13 Fall 2005-2014 Undergraduates by Class Division Table 14: Fall 2006-2015 All Degree-Seeking Undergraduates by Division/School Table 15: Fall 2006-2015 Undergraduates by Major Table 16: Fall 2005-2014: Undergraduate Students Areas of Study by Division/School by Gender and Ethnicity Table 17: 2005-2007 through 2014-2015: Undergraduate Degrees Awarded by Division/School Table 18: Fall 2006-2015 Freshmen: High Schools of Origin Table 19a: Fall 2006-2015: First-time, Full-time Freshmen by Age and Gender Table 19b: Fall 2006-2015 All Undergraduates by Age and Gender Table 20: Fall 2006-2015 Undergraduates by Major Table 21: Fall 2006-2015: All Degree-Seeking Undergraduates by Division/School Table 22a: Degrees Awarded 2005-2006 through 2013-2014 by School/Division ADVANCED CERTIFICATE/ BACHELOR'S/ DOCTORAL/ MASTER'S

Table 22b: Degrees Awarded 2005-2006 through 2013-2014 by School/Division & Gender ADVANCED CERTIFICATE/ BACHELOR'S/ DOCTORAL/ MASTER'S Table 23a: Fall 2006-2015 Masters & Doctoral Enrollment by Full/Part-time DOCTORAL/ MASTER'S Table 23b: Fall 2006-2015 Graduate Enrollment by Full/Part-time & Gender DOCTORAL/ MASTER'S Table 23c: Fall 2006-2015 Graduate Enrollment by Full/Part-time & Degree/Nondegree DEGREE/ NONDEGREE Graph 23: Graduate Enrollment, 2006-2015 Full/Part-time, Women/Men includes DOCTORAL students as does the total Table 24: Fall 2006-2015 Graduate (Masters and Certificate) & PHDs by Major Table 25a: Graduate Degrees Awarded by Division/School 2006-07 through 2014-15 Table 25b: Graduate Degrees Awarded by Division/School by Ethnicity with Non-Residents 2006-07 through 2014-15

4Source: CUNY OIRA Institutional Research Data Base [IRDB]
3Total numbers include Permit Undergraduate, Masters students from other CUNY colleges, CUNY BA students and Senior Citizens Auditing a Course.
2Part-time, Graduate Education students in Westchester and Rockland are included in this table.
Other Ph.D. students are taught at CCNY, however the CUNY Graduate Center keeps their records and grants their degrees.
1Graduate students are in Masters or Advanced Certificate programs except for Engineering that has Ph.D.s.
Table 1a: Fall 2006-2015 Total Undergraduate and Graduate Enrollment by Full/Part-time Status 1-4
Full/Part-time
Term_Enrolled_Date
Fall 2006 Fall 2007 Fall 2008 Fall 2009 Fall 2010 Fall 2011 Fall 2012 Fall 2013 Fall 2014 Fall 2015
N % N % N % N % N % N % N % N % N % N %
FULL-TIME 7,654 57.6 8,411 57.9 9,199 59.7 10,014 61.4 9,767 62.8 10,001 62.2 9,998 61.9 9,721 62.9 9,846 62.5 10,111 63.5
PART-TIME 5,645 42.4 6,126 42.1 6,203 40.3 6,294 38.6 5,786 37.2 6,088 37.8 6,163 38.1 5,743 37.1 5,897 37.5 5,820 36.5
Total 13,299 100.0 14,537 100.0 15,402 100.0 16,308 100.0 15,553 100.0 16,089 100.0 16,161 100.0 15,464 100.0 15,743 100.0 15,931 100.0

4Source: CUNY OIRA Institutional Research Data Base [IRDB]
3Total numbers include Permit Undergraduate, Masters students from other CUNY colleges, CUNY BA students and Senior Citizens Auditing a Course.
2Part-time, Graduate Education students in Westchester and Rockland are included in this table.
Other Ph.D. students are taught at CCNY, however the CUNY Graduate Center keeps their records and grants their degrees.
1Graduate students are in Masters or Advanced Certificate programs except for Engineering that has Ph.D.s.
Table 1b: Fall 2006-2015 Total Undergraduate and Graduate Enrollment by Gender 1-4
Gender
Term_Enrolled_Date
Fall 2006 Fall 2007 Fall 2008 Fall 2009 Fall 2010 Fall 2011 Fall 2012 Fall 2013 Fall 2014 Fall 2015
N % N % N % N % N % N % N % N % N % N %
Women 6,833 51.4 7,521 51.7 8,170 53.0 8,673 53.2 8,182 52.6 8,473 52.7 8,610 53.3 8,163 52.8 8,191 52.0 8,214 51.6
Men 6,466 48.6 7,016 48.3 7,232 47.0 7,635 46.8 7,371 47.4 7,616 47.3 7,551 46.7 7,301 47.2 7,552 48.0 7,717 48.4
Total 13,299 100.0 14,537 100.0 15,402 100.0 16,308 100.0 15,553 100.0 16,089 100.0 16,161 100.0 15,464 100.0 15,743 100.0 15,931 100.0

4Source: CUNY OIRA Institutional Research Data Base [IRDB]
3Total numbers include Permit Undergraduate, Masters students from other CUNY colleges, CUNY BA students and Senior Citizens Auditing a Course.
2Part-time, Graduate Education students in Westchester and Rockland are included in this table.
Other Ph.D. students are taught at CCNY, however the CUNY Graduate Center keeps their records and grants their degrees.
1Graduate students are in Masters or Advanced Certificate programs except for Engineering that has Ph.D.s.
Table 1c: Fall 2006-2015 Total Undergraduate and Graduate Enrollment by Class Level 1-4
Level
Term_Enrolled_Date
Fall 2006 Fall 2007 Fall 2008 Fall 2009 Fall 2010 Fall 2011 Fall 2012 Fall 2013 Fall 2014 Fall 2015
N % N % N % N % N % N % N % N % N % N %
DOCTORAL 25 0.2 66 0.4 116 0.7 150 0.9 178 1.1 189 1.2 588 3.7 641 4.0
MASTERS 2,930 22.0 3,222 22.2 3,311 21.5 3,282 20.1 3,053 19.6 3,001 18.7 2,870 17.8 2,646 17.1 2,496 15.9 2,394 15.0
UNDERGRADUATE 10,369 78.0 11,315 77.8 12,066 78.3 12,960 79.5 12,384 79.6 12,938 80.4 13,113 81.1 12,629 81.7 12,659 80.4 12,896 80.9
Total 13,299 100.0 14,537 100.0 15,402 100.0 16,308 100.0 15,553 100.0 16,089 100.0 16,161 100.0 15,464 100.0 15,743 100.0 15,931 100.0

Enr
ollm
ent
1000
2000
3000
4000
5000
6000
7000
8000
9000
10000
11000
12000
13000
14000
15000
Years
2006 2007 2008 2009 2010 2011 2012 2013 2014 2015
Full-time Undergrads
Part-time Undergrads
Women Undergrads Men Undergrads
All Undergrads
MA/MS & PHDs
Graph 1: Enrollment Fall 2006-2015 Full/Part-Time & All Women & Men Undergraduates, MA/MS & PHD students

Click here for CUNY OIRA Ethnicity in City Facts 2014 Table 2
5Source: CUNY OIRA Institutional Research Data Base [IRDB]
4Total numbers include 'Permit' Undergraduate and Masters students from other CUNY colleges and 'CUNY BA' students.
3Part-time, Graduate Education students in Westchester and Rockland are included in this table.
2Other Ph.D. students are taught at CCNY, but CUNY's Graduate Center keeps their records and grants their degrees.
1Graduate students are in Masters or Advanced Certificate programs except for Engineering that has Ph.D.s - starting in Fall 2008.
Table 2: Fall 2012-2015 Doctoral, Masters & Undergraduate Students by Gender uses IPEDS' Ethnicity 1-5
In Fall 2012 CUNY OIRA Started Ethnicity Reporting Using the IPEDS Multiple Ethnicity Categories
Level=DOCTORAL
Level, Gender & IPEDS_ethnicFall 2012 Fall 2013 Fall 2014 Fall 2015
FULL-TIME PART-TIME FULL-TIME PART-TIME FULL-TIME PART-TIME FULL-TIME PART-TIME
DOCTORAL Men Asian 2 12 1 12 65 29 87 37
Black or African American 2 8 3 10 25 7 24 21
Hispanic/Latino 3 5 1 6 55 33 65 26
Native Hawaiian or Other 1 2
Nonresident alien 13 51 12 59 29 69 24 63
White 11 14 4 17 51 64 65 45
Women Asian 4 6 21 9 28 11
Black or African American 4 5 6 3 8 7
Hispanic/Latino 1 4 4 19 15 27 15
Nonresident alien 9 24 9 29 18 31 11 35
Two or more races 1 1 1
White 2 9 3 8 17 20 27 11
Total 43 135 33 156 307 281 369 272

Click here for CUNY OIRA Ethnicity in City Facts 2014 Table 2
5Source: CUNY OIRA Institutional Research Data Base [IRDB]
4Total numbers include 'Permit' Undergraduate and Masters students from other CUNY colleges and 'CUNY BA' students.
3Part-time, Graduate Education students in Westchester and Rockland are included in this table.
2Other Ph.D. students are taught at CCNY, but CUNY's Graduate Center keeps their records and grants their degrees.
1Graduate students are in Masters or Advanced Certificate programs except for Engineering that has Ph.D.s - starting in Fall 2008.
Table 2: Fall 2012-2015 Doctoral, Masters & Undergraduate Students by Gender uses IPEDS' Ethnicity 1-5
In Fall 2012 CUNY OIRA Started Ethnicity Reporting Using the IPEDS Multiple Ethnicity Categories
Level=MASTERS
Level, Gender & IPEDS_ethnicFall 2012 Fall 2013 Fall 2014 Fall 2015
FULL-TIME PART-TIME FULL-TIME PART-TIME FULL-TIME PART-TIME FULL-TIME PART-TIME
MASTERS Men American Indian or Alaska 1 1 1 1 1
Asian 23 123 20 121 26 117 18 142
Black or African American 32 180 31 153 24 139 33 141
Hispanic/Latino 34 198 25 175 36 170 22 160
Nonresident alien 42 109 33 123 22 106 22 77
Two or more races 1 2 5 4 2
White 77 352 79 314 73 309 77 258
Women American Indian or Alaska 1 1 2 1 1
Asian 30 136 17 116 20 102 25 118
Black or African American 42 281 46 259 41 246 30 268
Hispanic/Latino 47 448 51 416 44 385 34 387
Native Hawaiian or Other 1
Nonresident alien 28 131 32 122 20 114 15 98
Two or more races 3 4 4
(Continued)

Click here for CUNY OIRA Ethnicity in City Facts 2014 Table 2
5Source: CUNY OIRA Institutional Research Data Base [IRDB]
4Total numbers include 'Permit' Undergraduate and Masters students from other CUNY colleges and 'CUNY BA' students.
3Part-time, Graduate Education students in Westchester and Rockland are included in this table.
2Other Ph.D. students are taught at CCNY, but CUNY's Graduate Center keeps their records and grants their degrees.
1Graduate students are in Masters or Advanced Certificate programs except for Engineering that has Ph.D.s - starting in Fall 2008.
Table 2: Fall 2012-2015 Doctoral, Masters & Undergraduate Students by Gender uses IPEDS' Ethnicity 1-5
In Fall 2012 CUNY OIRA Started Ethnicity Reporting Using the IPEDS Multiple Ethnicity Categories
Level=MASTERS
Level, Gender & IPEDS_ethnicFall 2012 Fall 2013 Fall 2014 Fall 2015
FULL-TIME PART-TIME FULL-TIME PART-TIME FULL-TIME PART-TIME FULL-TIME PART-TIME
White 76 479 79 431 74 413 60 392MASTERS Women
Total 431 2439 414 2232 383 2113 346 2048

Click here for CUNY OIRA Ethnicity in City Facts 2014 Table 2
5Source: CUNY OIRA Institutional Research Data Base [IRDB]
4Total numbers include 'Permit' Undergraduate and Masters students from other CUNY colleges and 'CUNY BA' students.
3Part-time, Graduate Education students in Westchester and Rockland are included in this table.
2Other Ph.D. students are taught at CCNY, but CUNY's Graduate Center keeps their records and grants their degrees.
1Graduate students are in Masters or Advanced Certificate programs except for Engineering that has Ph.D.s - starting in Fall 2008.
Table 2: Fall 2012-2015 Doctoral, Masters & Undergraduate Students by Gender uses IPEDS' Ethnicity 1-5
In Fall 2012 CUNY OIRA Started Ethnicity Reporting Using the IPEDS Multiple Ethnicity Categories
Level=UNDERGRADUATE
Level, Gender & IPEDS_ethnicFall 2012 Fall 2013 Fall 2014 Fall 2015
FULL-TIME PART-TIME FULL-TIME PART-TIME FULL-TIME PART-TIME FULL-TIME PART-TIME
UNDERGRADUATE Men American Indian or Alaska 3 7 5 3 7 1
Asian 1249 277 1282 324 1293 301 1401 309
Black or African American 706 336 667 310 606 346 618 346
Hispanic/Latino 1225 567 1205 528 1292 555 1363 607
Native Hawaiian or Other 14 5 15 5 20 12 13 5
Nonresident alien 421 152 360 156 310 129 283 136
Two or more races 40 6 47 10 85 16 96 26
White 837 421 821 363 761 359 771 319
Women American Indian or Alaska 6 1 3 5 2 8 7
Asian 1026 205 1117 178 1086 212 1190 196
Black or African American 1021 447 917 407 863 405 832 353
Hispanic/Latino 1842 740 1786 670 1852 750 1883 804
Native Hawaiian or Other 29 2 26 5 30 7 18 8
Nonresident alien 352 118 307 103 242 106 232 95
(Continued)

Click here for CUNY OIRA Ethnicity in City Facts 2014 Table 2
5Source: CUNY OIRA Institutional Research Data Base [IRDB]
4Total numbers include 'Permit' Undergraduate and Masters students from other CUNY colleges and 'CUNY BA' students.
3Part-time, Graduate Education students in Westchester and Rockland are included in this table.
2Other Ph.D. students are taught at CCNY, but CUNY's Graduate Center keeps their records and grants their degrees.
1Graduate students are in Masters or Advanced Certificate programs except for Engineering that has Ph.D.s - starting in Fall 2008.
Table 2: Fall 2012-2015 Doctoral, Masters & Undergraduate Students by Gender uses IPEDS' Ethnicity 1-5
In Fall 2012 CUNY OIRA Started Ethnicity Reporting Using the IPEDS Multiple Ethnicity Categories
Level=UNDERGRADUATE
Level, Gender & IPEDS_ethnicFall 2012 Fall 2013 Fall 2014 Fall 2015
FULL-TIME PART-TIME FULL-TIME PART-TIME FULL-TIME PART-TIME FULL-TIME PART-TIME
Two or more races 65 12 56 16 82 20 86 30UNDERGRADUATE Women
White 688 300 658 280 624 280 595 258
Total 9524 3589 9274 3355 9156 3503 9396 3500


4Source: CUNY OIRA Institutional Research Data Base [IRDB]
3Excludes tuition wavier graduate education students
2College Now is a NYC Board of Education and CUNY program that helps students prepare for college work
1Includes SEEK and Undergraduate and Masters 'Permit' students from other CUNY colleges and 'CUNY BA students
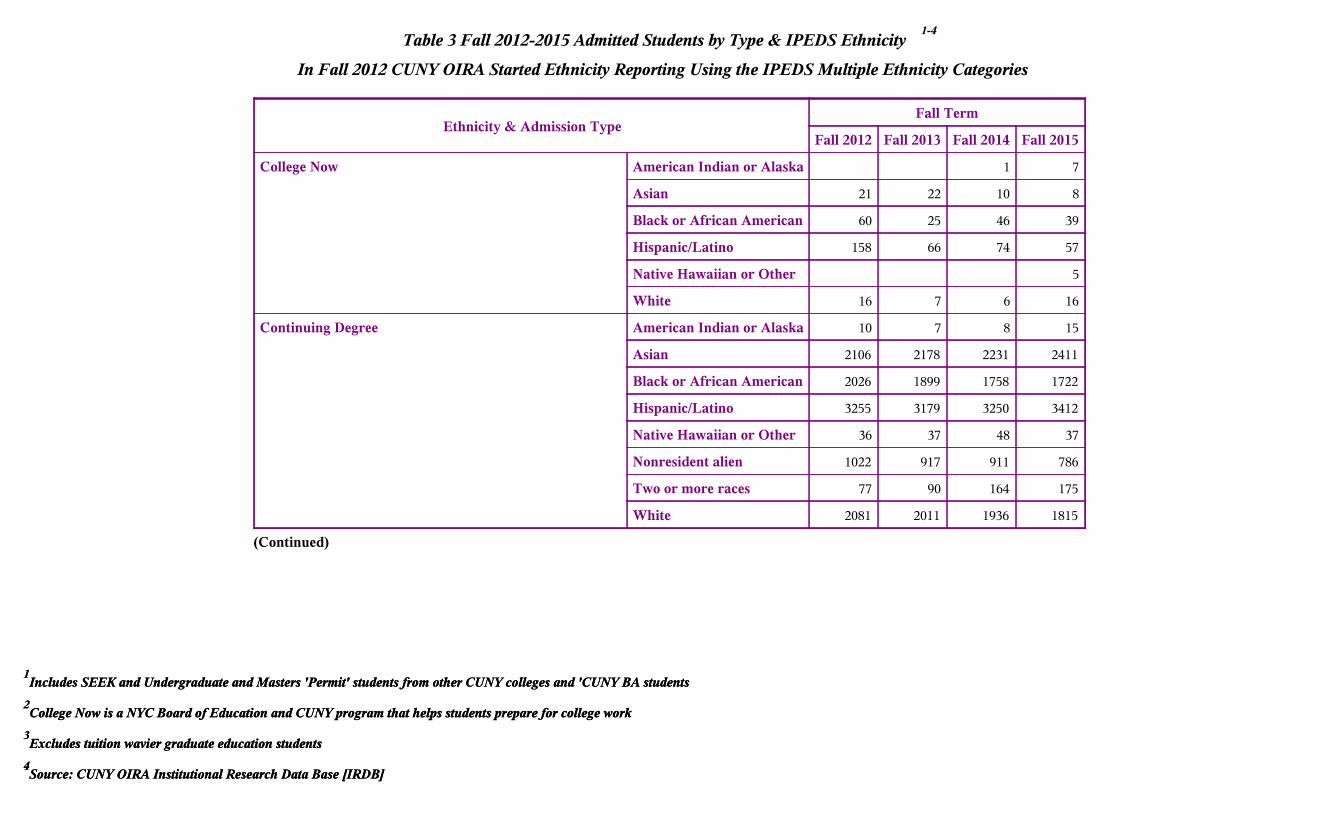
Table 3 Fall 2012-2015 Admitted Students by Type & IPEDS Ethnicity 1-4
In Fall 2012 CUNY OIRA Started Ethnicity Reporting Using the IPEDS Multiple Ethnicity Categories
Ethnicity & Admission TypeFall Term
Fall 2012 Fall 2013 Fall 2014 Fall 2015
College Now American Indian or Alaska 1 7
Asian 21 22 10 8
Black or African American 60 25 46 39
Hispanic/Latino 158 66 74 57
Native Hawaiian or Other 5
White 16 7 6 16
Continuing Degree American Indian or Alaska 10 7 8 15
Asian 2106 2178 2231 2411
Black or African American 2026 1899 1758 1722
Hispanic/Latino 3255 3179 3250 3412
Native Hawaiian or Other 36 37 48 37
Nonresident alien 1022 917 911 786
Two or more races 77 90 164 175
White 2081 2011 1936 1815
(Continued)

4Source: CUNY OIRA Institutional Research Data Base [IRDB]
3Excludes tuition wavier graduate education students
2College Now is a NYC Board of Education and CUNY program that helps students prepare for college work
1Includes SEEK and Undergraduate and Masters 'Permit' students from other CUNY colleges and 'CUNY BA students
Table 3 Fall 2012-2015 Admitted Students by Type & IPEDS Ethnicity 1-4
In Fall 2012 CUNY OIRA Started Ethnicity Reporting Using the IPEDS Multiple Ethnicity Categories
Ethnicity & Admission TypeFall Term
Fall 2012 Fall 2013 Fall 2014 Fall 2015
Continuing Nondegree Asian 16 33 40 12
Black or African American 43 39 39 35
Hispanic/Latino 40 193 45 43
Nonresident alien 2 2 2 4
Two or more races 1 1
White 61 60 38 38
Early College Initiative Asian 1 2 2
Black or African American 5 1 6 9
Hispanic/Latino 151 44 182 175
Two or more races 1
White 1 9 5
First-time Freshman American Indian or Alaska 3 4
Asian 494 517 528 621
Black or African American 160 182 143 183
Hispanic/Latino 392 380 432 432
Native Hawaiian or Other 9 9 13 2
Nonresident alien 115 93 58 74
(Continued)

4Source: CUNY OIRA Institutional Research Data Base [IRDB]
3Excludes tuition wavier graduate education students
2College Now is a NYC Board of Education and CUNY program that helps students prepare for college work
1Includes SEEK and Undergraduate and Masters 'Permit' students from other CUNY colleges and 'CUNY BA students
Table 3 Fall 2012-2015 Admitted Students by Type & IPEDS Ethnicity 1-4
In Fall 2012 CUNY OIRA Started Ethnicity Reporting Using the IPEDS Multiple Ethnicity Categories
Ethnicity & Admission TypeFall Term
Fall 2012 Fall 2013 Fall 2014 Fall 2015
Two or more races 22 18 17 34First-time Freshman
White 205 242 246 284
First-time Graduate Matriculant American Indian or Alaska 1 2
Asian 78 82 93 111
Black or African American 107 120 143 130
Hispanic/Latino 193 139 194 187
Native Hawaiian or Other 1
Nonresident alien 114 144 95 82
Two or more races 1 6 6
White 260 244 296 241
First-time Nondegree American Indian or Alaska 1
Asian 46 37 58 29
Black or African American 90 73 73 73
Hispanic/Latino 99 71 108 87
Native Hawaiian or Other 4
Nonresident alien 27 23 6 7
Two or more races 1 1 2
(Continued)

4Source: CUNY OIRA Institutional Research Data Base [IRDB]
3Excludes tuition wavier graduate education students
2College Now is a NYC Board of Education and CUNY program that helps students prepare for college work
1Includes SEEK and Undergraduate and Masters 'Permit' students from other CUNY colleges and 'CUNY BA students
Table 3 Fall 2012-2015 Admitted Students by Type & IPEDS Ethnicity 1-4
In Fall 2012 CUNY OIRA Started Ethnicity Reporting Using the IPEDS Multiple Ethnicity Categories
Ethnicity & Admission TypeFall Term
Fall 2012 Fall 2013 Fall 2014 Fall 2015
White 142 101 179 108First-time Nondegree
Graduate Readmit Asian 14 9 11 7
Black or African American 33 20 16 19
Hispanic/Latino 30 41 19 23
Nonresident alien 12 10 8 3
White 28 37 20 31
Internal Transfer from Graduate Nondegree to Degree Asian 6 1
Black or African American 3 5
Hispanic/Latino 2 5 1
Nonresident alien 3
White 3 11
Internal Transfer from Undergraduate Nondegree to De Asian 1 2 1 1
Black or African American 5 5
Hispanic/Latino 15 10
White 8 4 4
(Continued)

4Source: CUNY OIRA Institutional Research Data Base [IRDB]
3Excludes tuition wavier graduate education students
2College Now is a NYC Board of Education and CUNY program that helps students prepare for college work
1Includes SEEK and Undergraduate and Masters 'Permit' students from other CUNY colleges and 'CUNY BA students
Table 3 Fall 2012-2015 Admitted Students by Type & IPEDS Ethnicity 1-4
In Fall 2012 CUNY OIRA Started Ethnicity Reporting Using the IPEDS Multiple Ethnicity Categories
Ethnicity & Admission TypeFall Term
Fall 2012 Fall 2013 Fall 2014 Fall 2015
Nondegree Readmit Asian 3 1 2
Black or African American 1 3 9 6
Hispanic/Latino 1 3 1 4
White 5 3 10 5
Other High School Program American Indian or Alaska 1
Asian 38 41 61
Black or African American 30 15 20
Hispanic/Latino 38 31 48
White 49 17 54
Permit-In American Indian or Alaska 1
Asian 14 13 22 15
Black or African American 24 20 23 26
Hispanic/Latino 19 23 45 41
Native Hawaiian or Other 1 1
Nonresident alien 12 13 6 9
Two or more races 1 3
White 43 34 31 25
(Continued)

2Sources: Freshman (Regular & SEEK) from the Fall 2005-2015 Show tapes & the CCNY Admissions Office
1The figures show the number of students who were accepted and registered.
Table 4 Fall 2005-2015 Admitted and Registered Students 1-2
2Sources: Freshman (Regular & SEEK) from the Fall 2005-2015 Show tapes & the CCNY Admissions Office
1The figures show the number of students who were accepted and registered.
Table 4 Fall 2005-2015 Admitted and Registered Students 1-2
Student type=Regular Freshman
Registered and AdmittedStudents
Year
2005 2006 2007 2008 2009 2010 2011 2012 2013 2014 2015
Number Admitted 4,999 5,915 6,872 5,605 6,011 7,064 6,733 9,160 9,031 8,492 9,794
Number Registered 1,040 1,276 1,633 1,548 1,606 1,230 1,303 1,390 1,444 1,444 1,630
Percent Registered 20.8 21.6 23.8 27.6 26.7 17.4 19.4 15.2 16.0 17.0 16.6
Student type=SEEK
Registered and AdmittedStudents
Year
2005 2006 2007 2008 2009 2010 2011 2012 2013 2014 2015
Number Admitted 1,012 1,117 796 833 512 603 792 884 1,031 899 1,304
Number Registered 286 289 198 228 164 159 214 277 231 434 161
Percent Registered 28.3 25.9 24.9 27.4 32.0 26.3 27.0 31.3 24.4 48.3 12.3
Student type=Transfers
Registered and AdmittedStudents
Year
2005 2006 2007 2008 2009 2010 2011 2012 2013 2014 2015
Number Admitted 1,344 1,507 1,578 1,578 2,615 1,959 2,511 2,598 2,648 2,114 6,133
Number Registered 1,141 1,153 1,218 1,229 1,536 988 1,371 1,427 1,316 1,518 1,558
Percent Registered 84.9 76.5 77.1 77.9 58.7 50.1 54.6 54.9 49.7 71.8 25.4
1Source: CUNY OIRA Institutional Research Data Base [IRDB]
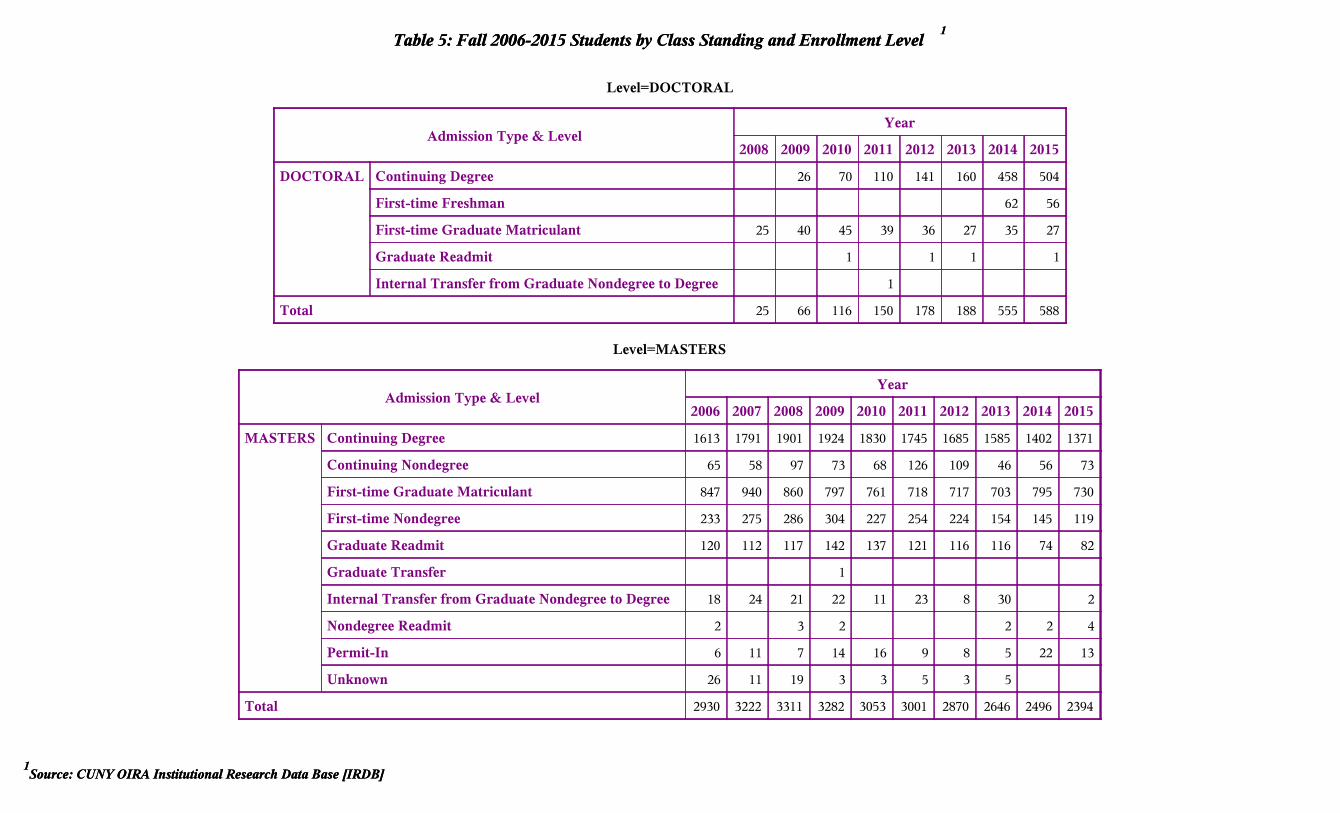
Table 5: Fall 2006-2015 Students by Class Standing and Enrollment Level 1
1Source: CUNY OIRA Institutional Research Data Base [IRDB]
Table 5: Fall 2006-2015 Students by Class Standing and Enrollment Level 1
Level=DOCTORAL
Admission Type & LevelYear
2008 2009 2010 2011 2012 2013 2014 2015
DOCTORAL Continuing Degree 26 70 110 141 160 458 504
First-time Freshman 62 56
First-time Graduate Matriculant 25 40 45 39 36 27 35 27
Graduate Readmit 1 1 1 1
Internal Transfer from Graduate Nondegree to Degree 1
Total 25 66 116 150 178 188 555 588
Level=MASTERS
Admission Type & LevelYear
2006 2007 2008 2009 2010 2011 2012 2013 2014 2015
MASTERS Continuing Degree 1613 1791 1901 1924 1830 1745 1685 1585 1402 1371
Continuing Nondegree 65 58 97 73 68 126 109 46 56 73
First-time Graduate Matriculant 847 940 860 797 761 718 717 703 795 730
First-time Nondegree 233 275 286 304 227 254 224 154 145 119
Graduate Readmit 120 112 117 142 137 121 116 116 74 82
Graduate Transfer 1
Internal Transfer from Graduate Nondegree to Degree 18 24 21 22 11 23 8 30 2
Nondegree Readmit 2 3 2 2 2 4
Permit-In 6 11 7 14 16 9 8 5 22 13
Unknown 26 11 19 3 3 5 3 5
Total 2930 3222 3311 3282 3053 3001 2870 2646 2496 2394

1Source: CUNY OIRA Institutional Research Data Base [IRDB]
1Source: CUNY OIRA Institutional Research Data Base [IRDB]
Table 5: Fall 2006-2015 Students by Class Standing and Enrollment Level 1
Level=UNDERGRADUATE
Admission Type & LevelYear
2006 2007 2008 2009 2010 2011 2012 2013 2014 2015
UNDERGRADUATE College Now 165 276 287 155 121 138 255 120 137 132
Continuing Degree 6596 7164 7893 8344 8820 8713 8787 8573 8446 8498
Continuing Nondegree 45 46 44 84 147 189 53 281 109 60
Early College Initiative 2 45 63 50 157 46 199 192
First-time Freshman 1565 1831 1776 1773 1389 1517 1397 1444 1379 1574
First-time Freshman in Prelude to Success Program 46
First-time Nondegree 193 178 187 152 158 185 180 152 285 187
Internal Transfer from AA to BA with Degree 1
Internal Transfer from Undergraduate Nondegree to Deg 23 22 17 19 18 8 29 21 1 5
Nondegree Readmit 15 11 16 4 3 4 10 8 20 11
Other High School Program 1 36 180 106 106 155 104 184
Permit-In 69 120 71 67 104 53 104 98 108 107
Undergraduate Readmit 509 464 514 617 478 615 561 484 500 429
Undergraduate Transfer from CUNY CC with Degree 124 125 131 156 184 263 87 72 266 320
Undergraduate Transfer from CUNY CC without Degree 265 313 318 390 277 319 574 592 221 256
Undergraduate Transfer from CUNY SC 181 164 198 226 163 214 187 175 211 249
Undergraduate Transfer from NYS Private CC with Degre 3 1 1 2 3
Undergraduate Transfer from NYS Private CC without De 8 5 6 15 3 8 17 6 1 1
Undergraduate Transfer from NYS Private SC 114 112 114 164 66 128 119 112 81 105
Undergraduate Transfer from Other Sources 29 31 23 16 10 18 15 11 2 1
(Continued)

1Source: CUNY OIRA Institutional Research Data Base [IRDB]
Table 5: Fall 2006-2015 Students by Class Standing and Enrollment Level 1
Level=UNDERGRADUATE
Admission Type & LevelYear
2006 2007 2008 2009 2010 2011 2012 2013 2014 2015
Undergraduate Transfer from Outside NYS Private CC wi 10 13 8 13 3 10 4 4 3 4UNDERGRADUATE
Undergraduate Transfer from Outside NYS Private SC 66 76 83 110 42 73 75 73 30 31
Undergraduate Transfer from Outside NYS Public CC wit 88 61 50 77 39 55 63 48 43 45
Undergraduate Transfer from Outside NYS Public SC 74 76 70 85 39 72 57 59 29 22
Undergraduate Transfer from SUNY CC with Degree 9 26 26 32 14 17 8 11 20 17
Undergraduate Transfer from SUNY CC without Degree 29 60 56 76 44 58 69 63 30 37
Undergraduate Transfer from SUNY SC 50 42 38 67 33 52 58 30 27 45
Undergraduate Transfer from Unknown Sources 79 92 90 89 51 59 65 39 507 378
Undergraduate Transfer in Prelude to Success Program 9
Unknown 4 7 11 3 7 10 27 3 4 6
Total 10369 11315 12066 12960 12384 12938 13113 12629 12659 12896

2Source: CUNY OIRA Institutional Research Data Base [IRDB]
1Continuing Students = Total degree students minus (first-time degree + advanced standing transfer + continuing non-degree + re-admitted students).
Table 6: Fall 2006-2015 SEEK Students by Enrollment Status 1-2
2Source: CUNY OIRA Institutional Research Data Base [IRDB]
1Continuing Students = Total degree students minus (first-time degree + advanced standing transfer + continuing non-degree + re-admitted students).
Table 6: Fall 2006-2015 SEEK Students by Enrollment Status 1-2
SEEK Admission Type
Fall terms
Fall2006
Fall2007
Fall2008
Fall2009
Fall2010
Fall2011
Fall2012
Fall2013
Fall2014
Fall2015
Continuing Degree 622 661 635 656 593 550 587 642 656 688
First-time Freshman 289 198 228 164 159 214 241 196 191 161
Internal Transfer from Undergraduate Nondegree to Deg 1 1
Undergraduate Readmit 33 21 34 22 23 27 18 20 20 17
Undergraduate Transfer from CUNY CC with Degree 9 3 7 8 17 11 5 7 8 8
Undergraduate Transfer from CUNY CC without Degree 3 6 3 10 5 10 15 20 3 1
Undergraduate Transfer from CUNY SC 13 2 8 8 5 13 6 6 12 15
Undergraduate Transfer from NYS Private SC 3 2 2 2 1 5 1 3 1
Undergraduate Transfer from Outside NYS Private SC 2 1 1 1
Undergraduate Transfer from SUNY CC with Degree 2
Undergraduate Transfer from SUNY CC without Degree 1 1 1 2
Undergraduate Transfer from SUNY SC 3 3 1 5 1 3 2 2
Undergraduate Transfer from Unknown Sources 1 12 8
Total 975 901 920 876 803 830 883 893 905 902

5Source: CUNY OIRA Institutional Research Data Base [IRDB]
4An 'Internal transfer' is a non-degree student who becomes a degree-seeking student.
3Continuing Students = Total degree students minus (first-time degree + advanced standing transfer + continuing non-degree + re-admitted students).
2College Now - a NYC Board of Education and CUNY program that helps students prepare for college work.
1Includes SEEK, Undergraduate and Masters 'Permit' students from other CUNY colleges, 'CUNY BA' and non-degree students.
Table 7: Fall 2006-2015 Full/Part-time Students by Enrollment Status 1-5
Type of Admission & Full Part Type
Term_Enrolled_Date
Fall 2006 Fall 2007 Fall 2008 Fall 2009 Fall 2010 Fall 2011 Fall 2012 Fall 2013 Fall 2014 Fall 2015
N % N % N % N % N % N % N % N % N % N %
College Now PART-TIME 165 100 276 100 287 100 155 100 121 100 138 100 255 100 120 100 137 100 132 100
Continuing Degree FULL-TIME 4,942 60 5,433 61 6,179 63 6,646 65 7,186 67 6,933 66 6,995 66 6,827 66 6,753 66 6,915 67
PART-TIME 3,267 40 3,522 39 3,615 37 3,648 35 3,534 33 3,635 34 3,618 34 3,491 34 3,553 34 3,458 33
Continuing Nondegree FULL-TIME 4 4 5 5 5 4 3 2 27 13 70 22 7 4 42 13 9 5 4 3
PART-TIME 106 96 99 95 136 96 154 98 188 87 245 78 155 96 285 87 156 95 129 97
Early College Initiative FULL-TIME 2 3 7 14 61 39 9 20 97 49 76 40
PART-TIME 2 100 45 100 61 97 43 86 96 61 37 80 102 51 116 60
First-time Freshman FULL-TIME 1,529 98 1,771 97 1,744 98 1,753 99 1,368 98 1,501 99 1,381 99 1,431 99 1,425 99 1,607 99
PART-TIME 36 2 60 3 32 2 20 1 21 2 16 1 16 1 13 1 16 1 23 1
First-time Freshman in Prelude to Success Program FULL-TIME 43 93
PART-TIME 3 7
First-time Graduate Matriculant FULL-TIME 107 13 119 13 133 15 183 22 216 27 205 27 213 28 204 28 217 26 178 24
PART-TIME 740 87 821 87 752 85 654 78 590 73 552 73 540 72 526 72 613 74 579 76
(Continued)

5Source: CUNY OIRA Institutional Research Data Base [IRDB]
4An 'Internal transfer' is a non-degree student who becomes a degree-seeking student.
3Continuing Students = Total degree students minus (first-time degree + advanced standing transfer + continuing non-degree + re-admitted students).
2College Now - a NYC Board of Education and CUNY program that helps students prepare for college work.
1Includes SEEK, Undergraduate and Masters 'Permit' students from other CUNY colleges, 'CUNY BA' and non-degree students.
Table 7: Fall 2006-2015 Full/Part-time Students by Enrollment Status 1-5
Type of Admission & Full Part Type
Term_Enrolled_Date
Fall 2006 Fall 2007 Fall 2008 Fall 2009 Fall 2010 Fall 2011 Fall 2012 Fall 2013 Fall 2014 Fall 2015
N % N % N % N % N % N % N % N % N % N %
First-time Nondegree FULL-TIME 36 8 30 7 40 8 47 10 32 8 35 8 29 7 22 7 30 7 19 6
PART-TIME 390 92 423 93 433 92 409 90 353 92 404 92 375 93 284 93 400 93 287 94
Graduate Readmit FULL-TIME 1 1 2 2 2 2 4 3 7 5 2 2 6 5 5 4 3 4 1 1
PART-TIME 119 99 110 98 115 98 138 97 131 95 119 98 111 95 112 96 71 96 82 99
Graduate Transfer FULL-TIME 1 100
Internal Transfer from AA to BA with Degree PART-TIME 1 100
Internal Transfer from Graduate Nondegree to Degree FULL-TIME 3 17 4 17 5 24 1 5 2 18 5 21 1 13 4 13 1 50
PART-TIME 15 83 20 83 16 76 21 95 9 82 19 79 7 88 26 87 1 50
Internal Transfer from Undergraduate Nondegree toDegree
FULL-TIME12 52 12 55 10 59 10 53 11 61 5 63 18 62 13 62 1 100 3 60
PART-TIME 11 48 10 45 7 41 9 47 7 39 3 38 11 38 8 38 2 40
Nondegree Readmit FULL-TIME 1 9 1 25 1 10 1 10
PART-TIME 17 100 10 91 19 100 6 100 3 100 3 75 9 90 9 90 22 100 15 100
Other High School Program PART-TIME 1 100 36 100 180 100 106 100 106 100 155 100 104 100 184 100
(Continued)

5Source: CUNY OIRA Institutional Research Data Base [IRDB]
4An 'Internal transfer' is a non-degree student who becomes a degree-seeking student.
3Continuing Students = Total degree students minus (first-time degree + advanced standing transfer + continuing non-degree + re-admitted students).
2College Now - a NYC Board of Education and CUNY program that helps students prepare for college work.
1Includes SEEK, Undergraduate and Masters 'Permit' students from other CUNY colleges, 'CUNY BA' and non-degree students.
Table 7: Fall 2006-2015 Full/Part-time Students by Enrollment Status 1-5
Type of Admission & Full Part Type
Term_Enrolled_Date
Fall 2006 Fall 2007 Fall 2008 Fall 2009 Fall 2010 Fall 2011 Fall 2012 Fall 2013 Fall 2014 Fall 2015
N % N % N % N % N % N % N % N % N % N %
Permit-In FULL-TIME 5 7 4 3 6 8 5 6 4 3 3 5 1 1 1 1
PART-TIME 70 93 127 97 72 92 76 94 116 97 59 95 112 100 103 100 129 99 119 99
Undergraduate Readmit FULL-TIME 172 34 166 36 173 34 242 39 188 39 259 42 230 41 178 37 178 35 159 36
PART-TIME 337 66 298 64 341 66 375 61 290 61 356 58 331 59 306 63 329 65 280 64
Undergraduate Transfer from CUNY CC with Degree FULL-TIME 85 69 88 70 86 66 106 68 133 72 172 65 64 74 50 69 201 74 245 75
PART-TIME 39 31 37 30 45 34 50 32 51 28 91 35 23 26 22 31 70 26 81 25
Undergraduate Transfer from CUNY CC without Degree FULL-TIME 195 74 220 70 237 75 285 73 221 80 250 78 457 80 467 79 183 81 207 78
PART-TIME 70 26 93 30 81 25 105 27 56 20 69 22 117 20 125 21 43 19 59 22
Undergraduate Transfer from CUNY SC FULL-TIME 118 65 105 64 149 75 162 72 113 69 137 64 124 66 124 71 162 75 209 79
PART-TIME 63 35 59 36 49 25 64 28 50 31 77 36 63 34 51 29 53 25 57 21
Undergraduate Transfer from NYS Private CC withDegree
FULL-TIME2 67 1 100 1 50 2 67
PART-TIME 1 33 1 100 1 50 1 33
(Continued)

5Source: CUNY OIRA Institutional Research Data Base [IRDB]
4An 'Internal transfer' is a non-degree student who becomes a degree-seeking student.
3Continuing Students = Total degree students minus (first-time degree + advanced standing transfer + continuing non-degree + re-admitted students).
2College Now - a NYC Board of Education and CUNY program that helps students prepare for college work.
1Includes SEEK, Undergraduate and Masters 'Permit' students from other CUNY colleges, 'CUNY BA' and non-degree students.
Table 7: Fall 2006-2015 Full/Part-time Students by Enrollment Status 1-5
Full_Part_Time_Desc=' '
Type of Admission & Full Part Type
Term_Enrolled_Date
Fall 2006 Fall 2007 Fall 2008 Fall 2009 Fall 2010 Fall 2011 Fall 2012 Fall 2013 Fall 2014 Fall 2015
N % N % N % N % N % N % N % N % N % N %
Undergraduate Transfer from NYS Private CC withoutDegree
FULL-TIME5 63 3 60 5 83 11 73 3 100 6 75 11 65 5 83 1 100 1 100
PART-TIME 3 38 2 40 1 17 4 27 2 25 6 35 1 17
Undergraduate Transfer from NYS Private SC FULL-TIME 72 63 84 75 91 80 130 79 46 70 87 68 88 74 90 80 65 79 77 73
PART-TIME 42 37 28 25 23 20 34 21 20 30 41 32 31 26 22 20 17 21 29 27
Undergraduate Transfer from Other Sources FULL-TIME 26 90 21 68 18 78 11 69 9 90 15 83 10 67 9 82 1 50 1 100
PART-TIME 3 10 10 32 5 22 5 31 1 10 3 17 5 33 2 18 1 50
Undergraduate Transfer from Outside NYS Private CCwith Degree
FULL-TIME1 100 2 67 2 100 1 100
PART-TIME 1 33 2 100 2 100
Undergraduate Transfer from Outside NYS Private CCwithout Degree
FULL-TIME8 89 7 70 4 67 9 82 1 100 7 78 3 75 3 75 1 33 4 100
PART-TIME 1 11 3 30 2 33 2 18 2 22 1 25 1 25 2 67
(Continued)

5Source: CUNY OIRA Institutional Research Data Base [IRDB]
4An 'Internal transfer' is a non-degree student who becomes a degree-seeking student.
3Continuing Students = Total degree students minus (first-time degree + advanced standing transfer + continuing non-degree + re-admitted students).
2College Now - a NYC Board of Education and CUNY program that helps students prepare for college work.
1Includes SEEK, Undergraduate and Masters 'Permit' students from other CUNY colleges, 'CUNY BA' and non-degree students.
Table 7: Fall 2006-2015 Full/Part-time Students by Enrollment Status 1-5
Type of Admission & Full Part Type
Term_Enrolled_Date
Fall 2006 Fall 2007 Fall 2008 Fall 2009 Fall 2010 Fall 2011 Fall 2012 Fall 2013 Fall 2014 Fall 2015
N % N % N % N % N % N % N % N % N % N %
Undergraduate Transfer from Outside NYS Private SC FULL-TIME 39 59 46 61 61 73 71 65 28 67 53 73 55 73 54 74 27 87 23 74
PART-TIME 27 41 30 39 22 27 39 35 14 33 20 27 20 27 19 26 4 13 8 26
Undergraduate Transfer from Outside NYS Public CCwith Degree
FULL-TIME17 81 8 89 6 50 12 75 4 67 7 54 2 67 3 60 3 43 8 80
PART-TIME 4 19 1 11 6 50 4 25 2 33 6 46 1 33 2 40 4 57 2 20
Undergraduate Transfer from Outside NYS Public CCwithout Degree
FULL-TIME47 70 39 75 28 74 47 77 23 70 30 71 46 77 26 60 26 70 21 57
PART-TIME 20 30 13 25 10 26 14 23 10 30 12 29 14 23 17 40 11 30 16 43
Undergraduate Transfer from Outside NYS Public SC FULL-TIME 40 54 49 64 48 69 63 74 27 69 49 68 41 72 41 69 24 83 16 70
PART-TIME 34 46 27 36 22 31 22 26 12 31 23 32 16 28 18 31 5 17 7 30
Undergraduate Transfer from SUNY CC with Degree FULL-TIME 7 78 23 88 21 81 25 78 11 79 14 82 6 75 7 64 17 77 12 71
PART-TIME 2 22 3 12 5 19 7 22 3 21 3 18 2 25 4 36 5 23 5 29
Undergraduate Transfer from SUNY CC without Degree FULL-TIME 21 72 49 82 42 75 73 96 39 89 50 86 57 83 55 87 29 94 23 59
PART-TIME 8 28 11 18 14 25 3 4 5 11 8 14 12 17 8 13 2 6 16 41
(Continued)

4Source: CUNY OIRA Institutional Research Data Base [IRDB]
3CUNY BA students and High School Students Taking college courses.
2Includes CUNY Honors College, SEEK, Permit students from other CUNY colleges. Excludes High School Students.
1FTEs are calculated by dividing total credits by 15 for Undergraduates and by 12 for Graduate students.
Table 8a: Fall 2005 - 2015 Undergraduate FTEs by Department 1-4
Level & DepartmentFTEs
Fall 2006 Fall 2007 Fall 2008 Fall 2009 Fall 2010 Fall 2011 Fall 2012 Fall 2013 Fall 2014 Fall 2015
UNDERGRADUATE ADMINISITRATIVE-Non-degree,Permit & Study Abroad 0.0 0.0 0.0 0.0 13.9 0.0 0.9 0.0 0.0 0.0
ARCHITECTURE 173.3 162.8 148.8 170.0 184.7 179.0 156.8 149.6 142.9 144.3
ARCHITECTURE/ARCH & ENVIRONL STUDIES 48.7 53.6 80.4 74.7 62.7 59.6 61.5 55.5 47.6 64.1
ARCHITECTURE/LANDSCAPE 6.0 2.5 1.0 0.0 0.3 0.5
ARCHITECTURE/URBAN DESIGN 7.3 0.8 1.3 0.3 0.3 0.3
CENTER FOR WORKER EDUCATION[IAS] 117.6 100.3 130.6 159.4 125.8 145.3 149.1 166.3 136.5 163.1
CITY HONORS COLLEGE 15.2 14.3 18.7 18.5 14.8 20.8 30.0
EDUCATION 27.2 29.9 24.6 38.4 34.3 29.2 24.4 31.3 25.2 24.4
EDUCATION/CHILDHOOD EDUCATION 85.8 88.4 95.6 127.4 121.9 144.4 145.9 158.4 145.1 135.8
EDUCATION/LEADERSHIP EDUCATION 0.3 0.5 9.6 8.3 5.5 5.2
EDUCATION/SECONDARY EDUC 11.4 19.6 24.0 18.8 27.2 29.7 31.3 37.8 31.8 29.4
ENGINEERING/BIOMEDICAL 19.7 35.5 23.2 24.2 31.3 33.7 43.5 39.8 42.1 55.7
ENGINEERING/CHEMICAL 54.2 53.1 52.2 68.1 72.0 67.2 71.4 82.4 81.5 91.9
ENGINEERING/CIVIL & TRANSPORT 99.4 118.8 105.4 115.2 113.7 126.3 118.1 140.3 148.7 196.8
ENGINEERING/COMPUTER SCIENCE 161.4 155.9 130.1 143.7 166.2 191.4 172.4 195.6 212.4 241.4
ENGINEERING/ELECTRICAL 230.1 206.0 223.1 201.8 205.4 195.4 199.0 182.9 205.1 230.5
ENGINEERING/ME-GRAPH 102.0 103.3 90.2 91.4 104.2 99.1 99.7 118.3 127.8 138.5
ENGINEERING/MECHANICAL 124.7 155.3 166.7 146.0 158.3 160.8 185.7 197.9 214.9 235.5
(Continued)

4Source: CUNY OIRA Institutional Research Data Base [IRDB]
3CUNY BA students and High School Students Taking college courses.
2Includes CUNY Honors College, SEEK, Permit students from other CUNY colleges. Excludes High School Students.
1FTEs are calculated by dividing total credits by 15 for Undergraduates and by 12 for Graduate students.
Table 8a: Fall 2005 - 2015 Undergraduate FTEs by Department 1-4
Level & DepartmentFTEs
Fall 2006 Fall 2007 Fall 2008 Fall 2009 Fall 2010 Fall 2011 Fall 2012 Fall 2013 Fall 2014 Fall 2015
ENGINEERING/SUSTAINABILITY 0.5 0.5UNDERGRADUATE
FIQWS: FRESHMAN INQ WRIT SEM 33.6 113.8 663.3 640.1 460.4 541.5 466.4 405.4 395.2 434.8
FQUAN: A TASTE FOR NUMBERS 16.2 18.8 12.0 16.2 9.8
HUMANITIES/AMERICAN STUDIES 1.8 1.0 1.2
HUMANITIES/ANTHROPOLOGY 143.0 106.5 116.1 130.9 143.4 132.8 140.9 137.5 154.7 146.7
HUMANITIES/ART 427.6 487.7 535.5 595.5 528.1 541.8 532.8 502.6 514.0 496.5
HUMANITIES/ASIAN STUDIES 16.4 19.6 52.2 27.0 23.4 29.4 30.2 46.7 42.6 41.8
HUMANITIES/ENGLISH 652.3 755.1 500.6 567.1 584.5 611.6 555.6 550.3 562.4 535.3
HUMANITIES/ENGLISH/ESL 47.0 34.7 32.9 30.5 19.5 12.8 14.7 13.4 5.5 7.2
HUMANITIES/ENGLISH/WORLD HUMANITIES 232.9 302.5 220.1 322.4 233.6 201.4 175.2 143.4 115.8 87.0
HUMANITIES/FOREIGN LANGUAGES/ARABIC 10.6 12.9 13.6 10.9 10.2 11.0 14.8 17.4 13.0 18.4
HUMANITIES/FOREIGN LANGUAGES/BENGALI 3.8 2.4
HUMANITIES/FOREIGN LANGUAGES/CHINESE 14.8 13.1 14.5 18.3 19.5 16.1 18.1 17.8 14.6 16.8
HUMANITIES/FOREIGN LANGUAGES/CLASSICS 15.8 12.6 14.0 19.8 18.8 8.0 10.0 10.8 13.0 10.0
HUMANITIES/FOREIGN LANGUAGES/COMP LIT 1.8 1.0 1.0 1.0 0.8 1.2 4.6 3.4 0.8
HUMANITIES/FOREIGN LANGUAGES/FRENCH 47.2 62.3 64.7 81.0 77.5 68.5 66.7 49.0 62.2 42.8
HUMANITIES/FOREIGN LANGUAGES/GERMAN 5.8 6.8 13.4 13.9 11.8 4.0
HUMANITIES/FOREIGN LANGUAGES/GREEK 1.6 4.4 4.6 3.4 1.6 3.0
(Continued)

4Source: CUNY OIRA Institutional Research Data Base [IRDB]
3CUNY BA students and High School Students Taking college courses.
2Includes CUNY Honors College, SEEK, Permit students from other CUNY colleges. Excludes High School Students.
1FTEs are calculated by dividing total credits by 15 for Undergraduates and by 12 for Graduate students.
Table 8a: Fall 2005 - 2015 Undergraduate FTEs by Department 1-4
Level & DepartmentFTEs
Fall 2006 Fall 2007 Fall 2008 Fall 2009 Fall 2010 Fall 2011 Fall 2012 Fall 2013 Fall 2014 Fall 2015
HUMANITIES/FOREIGN LANGUAGES/HEBREW 4.8 9.7 5.0 5.2 5.8 6.0 6.0 4.6 7.0 6.0UNDERGRADUATE
HUMANITIES/FOREIGN LANGUAGES/HINDI 4.3 5.0 6.0 9.7 9.8 7.9 7.3 5.8 1.8 1.8
HUMANITIES/FOREIGN LANGUAGES/ITALIAN 38.9 46.7 41.6 56.0 58.1 50.3 41.1 25.2 28.2 25.4
HUMANITIES/FOREIGN LANGUAGES/JAPANESE 16.3 17.3 19.2 18.8 19.9 17.8 19.2 18.8 20.0 23.0
HUMANITIES/FOREIGN LANGUAGES/LATIN 4.2 7.9 7.8 8.4 6.8 5.4 4.6 5.2 7.2 4.8
HUMANITIES/FOREIGN LANGUAGES/PORTUGESE 5.7 8.4 8.0 10.7 10.4 13.3 10.4 12.4 8.8 9.2
HUMANITIES/FOREIGN LANGUAGES/SPANISH 193.1 225.8 223.3 246.8 259.5 178.6 177.4 144.6 143.6 157.2
HUMANITIES/HISTORY 112.3 117.5 144.7 176.6 244.9 219.9 236.5 176.8 163.3 128.1
HUMANITIES/HISTORY/DVLPMNT US & PEOPLE 98.0 120.0 93.0 132.6 103.8 142.8 141.2 142.4 147.6 150.2
HUMANITIES/HISTORY/WORLD CIVILIZATION 253.1 167.9 142.1 167.3 127.8 152.8 192.0 161.4 163.8 129.8
HUMANITIES/HUMANITIES 5.6 6.4 4.8
HUMANITIES/JEWISH STUDIES 70.7 76.3 99.6 88.1 82.0 85.9 77.8 79.0 76.4 68.9
HUMANITIES/MEDIA COMMUNICATIONS 176.3 217.6 239.1 269.1 259.9 253.1 252.8 252.5 269.3 232.5
HUMANITIES/MUSIC 250.1 296.7 347.8 390.4 352.8 384.6 331.6 306.6 302.0 306.0
HUMANITIES/PHILOSOPHY 198.8 215.5 222.6 200.6 176.3 189.9 241.3 260.9 242.8 225.9
HUMANITIES/THEATER/SPEECH 315.5 365.3 362.7 406.3 388.9 409.8 408.3 329.7 329.5 362.9
MACAULAY HONORS COLLEGE 37.6 39.8 37.6
MILITARY SCIENCE 3.4 14.4 16.2
(Continued)

4Source: CUNY OIRA Institutional Research Data Base [IRDB]
3CUNY BA students and High School Students Taking college courses.
2Includes CUNY Honors College, SEEK, Permit students from other CUNY colleges. Excludes High School Students.
1FTEs are calculated by dividing total credits by 15 for Undergraduates and by 12 for Graduate students.
Table 8a: Fall 2005 - 2015 Undergraduate FTEs by Department 1-4
Level & DepartmentFTEs
Fall 2006 Fall 2007 Fall 2008 Fall 2009 Fall 2010 Fall 2011 Fall 2012 Fall 2013 Fall 2014 Fall 2015
POWELL SCHOOL/ECONOMICS 270.9 319.9 344.6 367.2 377.0 368.1 372.9 367.5 410.6 427.1UNDERGRADUATE
POWELL SCHOOL/INTERNATIONAL RELATIONS 1.5 1.8 0.5 1.5 0.8 0.3 1.5 0.8
POWELL SCHOOL/INTERNATIONAL STUDIES 25.9 32.7 33.7 43.5 37.6 44.4 48.6 47.2 49.0 55.6
POWELL SCHOOL/LATIN AMER & LATINO STD 36.1 24.5 22.0 16.8 26.4 39.3 29.0 30.5 37.7 31.7
POWELL SCHOOL/POLITICAL SCIENCE 169.8 195.6 214.3 221.9 257.8 281.5 280.4 240.5 264.3 274.1
POWELL SCHOOL/POLITICAL SCIENCE/BLACK STUDIES 66.0 69.3 85.5 79.9 60.6 66.2 61.2 60.0 69.8 70.6
POWELL SCHOOL/PSYCHOLOGY 481.8 512.0 678.8 658.0 720.3 699.7 790.5 798.8 854.5 858.8
POWELL SCHOOL/PUBLIC POLICY 0.3 0.3 0.5 0.3 0.8
POWELL SCHOOL/SOCIOLOGY 216.6 204.5 201.1 186.5 173.1 218.1 213.6 203.5 224.6 231.5
POWELL SCHOOL/WOMANS STUDIES 19.0 25.1 19.0 18.4 23.7 24.7 22.5 27.4 33.2 32.3
SCIENCE (BIOLOGY/PHYSICS/GRAD ED) 67.5 70.7 65.5 50.6 65.7 15.3 18.3 14.9 18.2 18.8
SCIENCE/ASTRONOMY 41.0 46.6 81.8 110.4 115.0 107.4 107.8 93.4 79.6 69.8
SCIENCE/BIOLOGY 329.9 373.5 369.8 402.2 405.8 398.3 455.1 414.1 426.5 406.8
SCIENCE/CHEMISTRY 312.6 346.6 358.3 388.0 378.5 409.1 444.0 446.6 463.0 486.6
SCIENCE/EARTH & ATMOSPHERIC SCIENCE 33.9 37.9 53.8 130.2 136.5 167.2 139.6 152.1 137.1 143.1
SCIENCE/MATHEMATICS 685.3 773.9 803.7 814.1 789.1 888.8 917.3 918.1 959.7 974.6
SCIENCE/PHYSICS 219.3 228.8 227.4 258.3 249.7 274.1 293.5 285.5 277.3 357.5
SOPHIE DAVIS MEDICAL SCHOOL 183.6 178.2 194.5 191.4 193.9 192.7 208.5 172.8 185.0 300.5
(Continued)

4Source: CUNY OIRA Institutional Research Data Base [IRDB]
3CUNY BA students and High School Students Taking college courses.
2Includes CUNY Honors College, SEEK, Permit students from other CUNY colleges. Excludes High School Students.
1FTEs are calculated by dividing total credits by 15 for Undergraduates and by 12 for Graduate students.
Table 8a: Fall 2005 - 2015 Undergraduate FTEs by Department 1-4
Level & DepartmentFTEs
Fall 2006 Fall 2007 Fall 2008 Fall 2009 Fall 2010 Fall 2011 Fall 2012 Fall 2013 Fall 2014 Fall 2015
SOPHIE DAVIS PHYSICIANS ASSISTANT 74.5 82.9 88.2 93.1 97.8 99.8 100.2 94.5 98.3 99.6UNDERGRADUATE
Total 7919.1 8662.9 9372.3 10091.4 9803.2 10087.2 10198.7 9812.1 10016.9 10328.5

4Source: CUNY OIRA Institutional Research Data Base [IRDB]
3CUNY BA students and High School Students Taking college courses.
2Includes CUNY Honors College, SEEK, Permit students from other CUNY colleges. Excludes High School Students.
1FTEs are calculated by dividing total credits by 15 for Undergraduates and by 12 for Graduate students.
Table 8b: Fall 2005 - 2015 Undergraduate FTEs by School/Division 1-4
Level & DepartmentFTEs
Fall 2006 Fall 2007 Fall 2008 Fall 2009 Fall 2010 Fall 2011 Fall 2012 Fall 2013 Fall 2014 Fall 2015
UNDERGRADUATE SCIENCES 981.0 1166.7 1086.6 1239.6 1195.5 1438.2 1526.1 1456.3 782.2 817.4
EDUCATION 309.6 369.9 382.7 408.5 408.6 409.1 373.4 379.6 302.4 410.7
GATEWAY 1994.7 1893.5 2307.8 2114.7 1860.3 1815.0 1862.9 1603.2 2547.7 2433.7
HUMANITIES & ARTS 1132.9 1406.1 1549.9 1816.9 1739.4 1737.2 1741.5 1606.8 1383.5 1331.6
CWE INTERDISCIPLINARY STUDIES 336.7 341.7 371.8 410.1 387.0 387.4 387.2 372.9 343.1 213.7
ENGINEERING 1611.1 1609.7 1612.0 1680.0 1769.1 1785.4 1781.5 1881.5 1884.5 2159.4
POWELL SCHOOL 890.7 1087.3 1283.9 1622.9 1633.8 1621.7 1604.9 1636.4 1780.7 1912.2
ARCHITECTURE 192.0 290.5 247.5 239.0 242.7 299.5 265.3 259.5 238.1 256.3
SOPHIE DAVIS/BIOMED 437.5 442.0 462.5 464.6 450.7 446.3 462.7 439.9 455.1 513.9
HIGH SCHOOL STUDENTS 33.0 55.5 67.5 95.3 116.1 147.6 193.3 176.2
ADMINISITRATIVE-Non-degree & Permit Students 299.7 279.7
Total 7919.1 8662.9 9372.3 10091.4 9803.2 10087.2 10198.7 9812.1 10016.9 10328.5

4Source: CUNY OIRA Institutional Research Data Base [IRDB]
3CUNY BA students and High School Students Taking college courses.
2Includes CUNY Honors College, SEEK, Permit students from other CUNY colleges. Excludes High School Students.
1FTEs are calculated by dividing total credits by 15 for Undergraduates and by 12 for Graduate students.
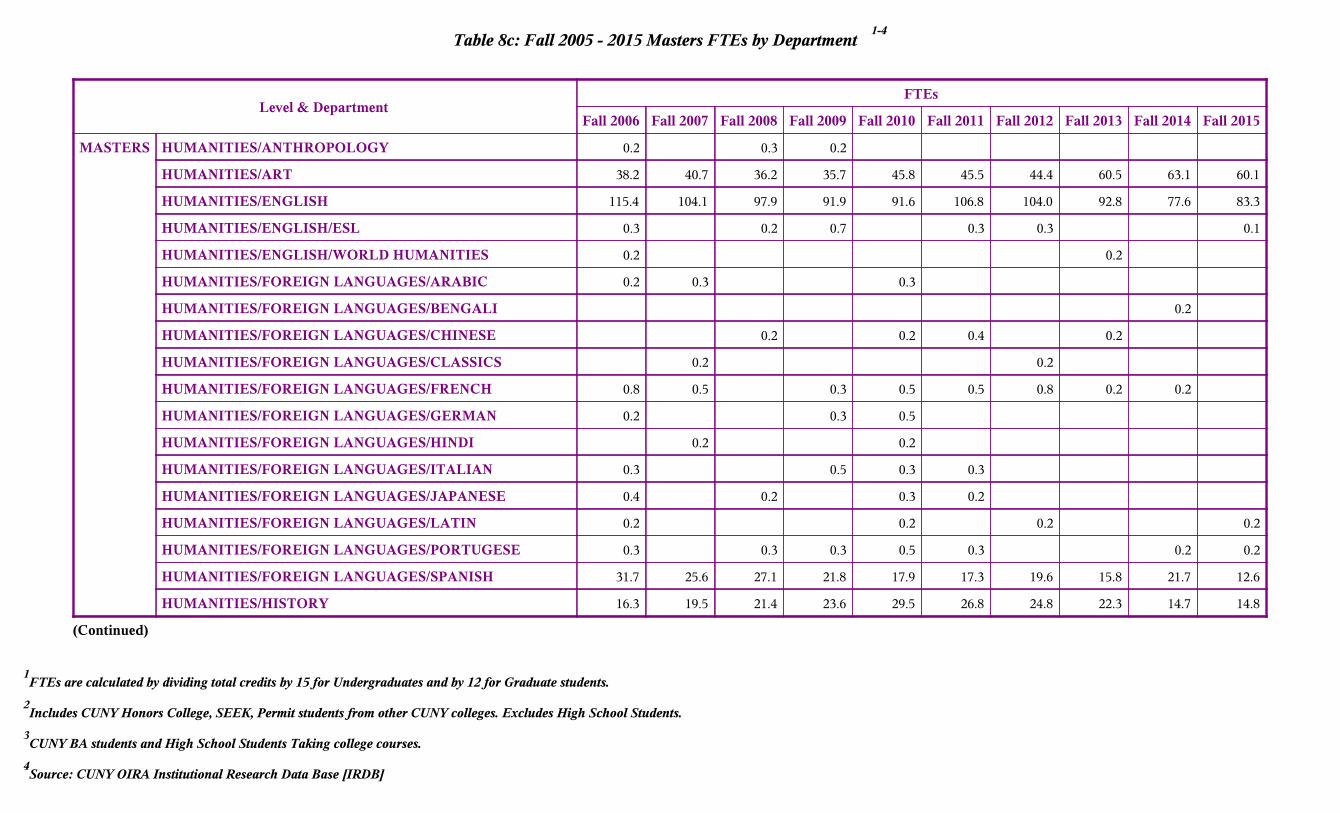
Table 8c: Fall 2005 - 2015 Masters FTEs by Department 1-4
4Source: CUNY OIRA Institutional Research Data Base [IRDB]
3CUNY BA students and High School Students Taking college courses.
2Includes CUNY Honors College, SEEK, Permit students from other CUNY colleges. Excludes High School Students.
1FTEs are calculated by dividing total credits by 15 for Undergraduates and by 12 for Graduate students.
Table 8c: Fall 2005 - 2015 Masters FTEs by Department 1-4
Level & DepartmentFTEs
Fall 2006 Fall 2007 Fall 2008 Fall 2009 Fall 2010 Fall 2011 Fall 2012 Fall 2013 Fall 2014 Fall 2015
MASTERS ADMINISITRATIVE-Non-degree,Permit & Study Abroad 0.0 0.0 0.0 0.0 1.8 3.8 0.0 0.8 0.0 0.0
ARCHITECTURE 39.7 44.5 42.0 47.6 78.0 119.5 119.3 107.5 100.0 95.8
ARCHITECTURE/ARCH & ENVIRONL STUDIES 0.2
ARCHITECTURE/LANDSCAPE 22.3 37.2 43.0 44.3 48.5 52.3 56.5 47.3 52.7 51.7
ARCHITECTURE/URBAN DESIGN 16.7 17.6 16.9 13.3 18.3 9.1 7.9 14.5 12.0 9.9
CENTER FOR WORKER EDUCATION[IAS] 0.3 6.5 11.0 12.5 10.3 12.1 9.8
EDUCATION 87.7 106.5 94.8 177.7 122.4 107.7 87.4 68.2 72.7 61.6
EDUCATION/CHILDHOOD EDUCATION 243.5 291.8 290.3 312.8 324.8 304.4 291.3 263.3 223.6 225.7
EDUCATION/LEADERSHIP EDUCATION 150.3 131.5 204.4 225.4 198.8 151.5 147.6 167.9 140.3 122.3
EDUCATION/SECONDARY EDUC 120.7 149.4 149.2 121.6 83.7 58.7 73.2 76.7 56.3 44.9
ENGINEERING/BIOMEDICAL 8.7 8.0 14.0 20.6 32.6 43.9 50.0 48.2 22.3 23.7
ENGINEERING/CHEMICAL 7.6 12.8 17.9 23.0 27.2 24.6 14.4 20.5 17.3 13.9
ENGINEERING/CIVIL & TRANSPORT 37.5 38.6 43.6 48.4 68.0 67.7 80.3 58.1 42.2 41.9
ENGINEERING/COMPUTER SCIENCE 83.6 101.8 76.2 62.9 60.6 67.5 55.0 55.9 64.5 55.0
ENGINEERING/ELECTRICAL 49.0 74.2 65.5 68.9 87.4 70.1 63.9 57.9 56.6 54.5
ENGINEERING/ME-GRAPH 16.5 35.7 28.3 38.7 39.5 26.2 25.9 32.6 25.8 23.2
ENGINEERING/MECHANICAL 25.2 31.4 22.1 29.4 37.2 38.6 33.5 25.9 24.3 18.0
ENGINEERING/SUSTAINABILITY 14.8 29.0 33.5 42.0 42.8 41.8
(Continued)
4Source: CUNY OIRA Institutional Research Data Base [IRDB]
3CUNY BA students and High School Students Taking college courses.
2Includes CUNY Honors College, SEEK, Permit students from other CUNY colleges. Excludes High School Students.
1FTEs are calculated by dividing total credits by 15 for Undergraduates and by 12 for Graduate students.
Table 8c: Fall 2005 - 2015 Masters FTEs by Department 1-4
Level & DepartmentFTEs
Fall 2006 Fall 2007 Fall 2008 Fall 2009 Fall 2010 Fall 2011 Fall 2012 Fall 2013 Fall 2014 Fall 2015
HUMANITIES/ANTHROPOLOGY 0.2 0.3 0.2MASTERS
HUMANITIES/ART 38.2 40.7 36.2 35.7 45.8 45.5 44.4 60.5 63.1 60.1
HUMANITIES/ENGLISH 115.4 104.1 97.9 91.9 91.6 106.8 104.0 92.8 77.6 83.3
HUMANITIES/ENGLISH/ESL 0.3 0.2 0.7 0.3 0.3 0.1
HUMANITIES/ENGLISH/WORLD HUMANITIES 0.2 0.2
HUMANITIES/FOREIGN LANGUAGES/ARABIC 0.2 0.3 0.3
HUMANITIES/FOREIGN LANGUAGES/BENGALI 0.2
HUMANITIES/FOREIGN LANGUAGES/CHINESE 0.2 0.2 0.4 0.2
HUMANITIES/FOREIGN LANGUAGES/CLASSICS 0.2 0.2
HUMANITIES/FOREIGN LANGUAGES/FRENCH 0.8 0.5 0.3 0.5 0.5 0.8 0.2 0.2
HUMANITIES/FOREIGN LANGUAGES/GERMAN 0.2 0.3 0.5
HUMANITIES/FOREIGN LANGUAGES/HINDI 0.2 0.2
HUMANITIES/FOREIGN LANGUAGES/ITALIAN 0.3 0.5 0.3 0.3
HUMANITIES/FOREIGN LANGUAGES/JAPANESE 0.4 0.2 0.3 0.2
HUMANITIES/FOREIGN LANGUAGES/LATIN 0.2 0.2 0.2 0.2
HUMANITIES/FOREIGN LANGUAGES/PORTUGESE 0.3 0.3 0.3 0.5 0.3 0.2 0.2
HUMANITIES/FOREIGN LANGUAGES/SPANISH 31.7 25.6 27.1 21.8 17.9 17.3 19.6 15.8 21.7 12.6
HUMANITIES/HISTORY 16.3 19.5 21.4 23.6 29.5 26.8 24.8 22.3 14.7 14.8
(Continued)

4Source: CUNY OIRA Institutional Research Data Base [IRDB]
3CUNY BA students and High School Students Taking college courses.
2Includes CUNY Honors College, SEEK, Permit students from other CUNY colleges. Excludes High School Students.
1FTEs are calculated by dividing total credits by 15 for Undergraduates and by 12 for Graduate students.
Table 8c: Fall 2005 - 2015 Masters FTEs by Department 1-4
Level & DepartmentFTEs
Fall 2006 Fall 2007 Fall 2008 Fall 2009 Fall 2010 Fall 2011 Fall 2012 Fall 2013 Fall 2014 Fall 2015
HUMANITIES/HISTORY/DVLPMNT US & PEOPLE 0.2MASTERS
HUMANITIES/HISTORY/WORLD CIVILIZATION 0.4
HUMANITIES/JEWISH STUDIES 0.2 0.2 0.4 0.4
HUMANITIES/MEDIA COMMUNICATIONS 46.0 42.3 43.3 51.1 44.7 51.8 51.5 71.8 91.5 84.9
HUMANITIES/MUSIC 12.7 13.6 13.9 12.5 11.4 13.8 13.2 14.7 11.2 7.4
HUMANITIES/PHILOSOPHY 0.2 0.2 0.3 0.2
HUMANITIES/THEATER/SPEECH 0.1 0.3 0.3 0.2 0.5 0.2 0.2
MILITARY SCIENCE 0.8 0.8
POWELL SCHOOL/ECONOMICS 39.5 35.6 42.0 40.7 32.6 44.4 45.9 28.5 32.4 40.0
POWELL SCHOOL/INTERNATIONAL RELATIONS 39.7 40.4 42.3 52.5 49.5 32.8 37.3 40.8 38.0 26.0
POWELL SCHOOL/INTERNATIONAL STUDIES 0.4 0.2
POWELL SCHOOL/LATIN AMER & LATINO STD 0.2 0.2 0.2
POWELL SCHOOL/POLITICAL SCIENCE 0.1 0.2 0.5 0.2 0.6 0.2 0.4
POWELL SCHOOL/POLITICAL SCIENCE/BLACK STUDIES 0.4 0.2 0.4 0.4 0.2 0.2 0.4
POWELL SCHOOL/PSYCHOLOGY 60.6 63.4 64.8 80.5 103.4 100.2 93.2 88.1 81.5 83.1
POWELL SCHOOL/PUBLIC POLICY 11.8 29.6 28.3 30.0 28.5 33.0 38.3 36.8
POWELL SCHOOL/SOCIOLOGY 4.0 10.1 13.5 7.3 11.8 17.0 15.8 14.5 9.0 3.8
SCIENCE (BIOLOGY/PHYSICS/GRAD ED) 4.7 11.9 29.2 0.2 0.2 0.6
(Continued)

4Source: CUNY OIRA Institutional Research Data Base [IRDB]
3CUNY BA students and High School Students Taking college courses.
2Includes CUNY Honors College, SEEK, Permit students from other CUNY colleges. Excludes High School Students.
1FTEs are calculated by dividing total credits by 15 for Undergraduates and by 12 for Graduate students.
Table 8c: Fall 2005 - 2015 Masters FTEs by Department 1-4
Level & DepartmentFTEs
Fall 2006 Fall 2007 Fall 2008 Fall 2009 Fall 2010 Fall 2011 Fall 2012 Fall 2013 Fall 2014 Fall 2015
SCIENCE/ASTRONOMY 0.2 0.4 0.4 0.6 0.8 0.2MASTERS
SCIENCE/BIOLOGY 22.1 22.6 22.3 21.1 26.8 20.1 33.6 32.1 22.3 17.3
SCIENCE/CHEMISTRY 9.1 22.1 22.6 18.9 12.9 19.7 11.3 8.2 11.4 11.4
SCIENCE/EARTH & ATMOSPHERIC SCIENCE 5.2 8.5 11.4 14.1 17.7 15.4 15.5 10.6 13.8 10.5
SCIENCE/MATHEMATICS 67.3 61.7 53.3 28.1 40.4 39.9 42.5 32.8 28.1 38.9
SCIENCE/PHYSICS 9.2 10.1 11.3 10.0 17.6 14.2 16.2 10.6 13.8 18.6
SOPHIE DAVIS MEDICAL SCHOOL 0.3 1.3
Total 1435.4 1615.3 1674.9 1777.5 1836.0 1785.0 1753.0 1676.6 1536.1 1446.2

4Source: CUNY OIRA Institutional Research Data Base [IRDB]
3CUNY BA students and High School Students Taking college courses.
2Includes CUNY Honors College, SEEK, Permit students from other CUNY colleges. Excludes High School Students.
1FTEs are calculated by dividing total credits by 15 for Undergraduates and by 12 for Graduate students.
Table 8d: Fall 2008 - 2015 DOCTORAL FTEs by Department 1-4
Level & MajorFall Term FTEs
Fall 2010 Fall 2011 Fall 2012 Fall 2013 Fall 2014 Fall 2015
DOCTORAL ADMINISITRATIVE-Non-degree,Permit & Study Abroad 0.0 0.0 0.0
ENGINEERING/BIOMEDICAL 0.1 0.8 18.7 21.5 2.8 0.7
ENGINEERING/CHEMICAL 0.4 0.7 1.8 16.5 3.6 3.8
ENGINEERING/CIVIL & TRANSPORT 0.2 0.7 0.7 1.4 1.3
ENGINEERING/COMPUTER SCIENCE 0.3 0.3
ENGINEERING/ELECTRICAL 0.2 2.2 1.3 0.9 1.3
ENGINEERING/ME-GRAPH 0.5
ENGINEERING/MECHANICAL 0.3 0.8 1.5 1.1
SCIENCE/MATHEMATICS 0.3
SCIENCE/PHYSICS 0.2 0.2
All 0.5 2.0 24.2 41.0 10.7 8.5


2Sources: CUNY OIRA IRDB 2005-06 through 2014-15 Graduate Files.
1See 'Data Sources' for a definition of Non-Resident Alien.
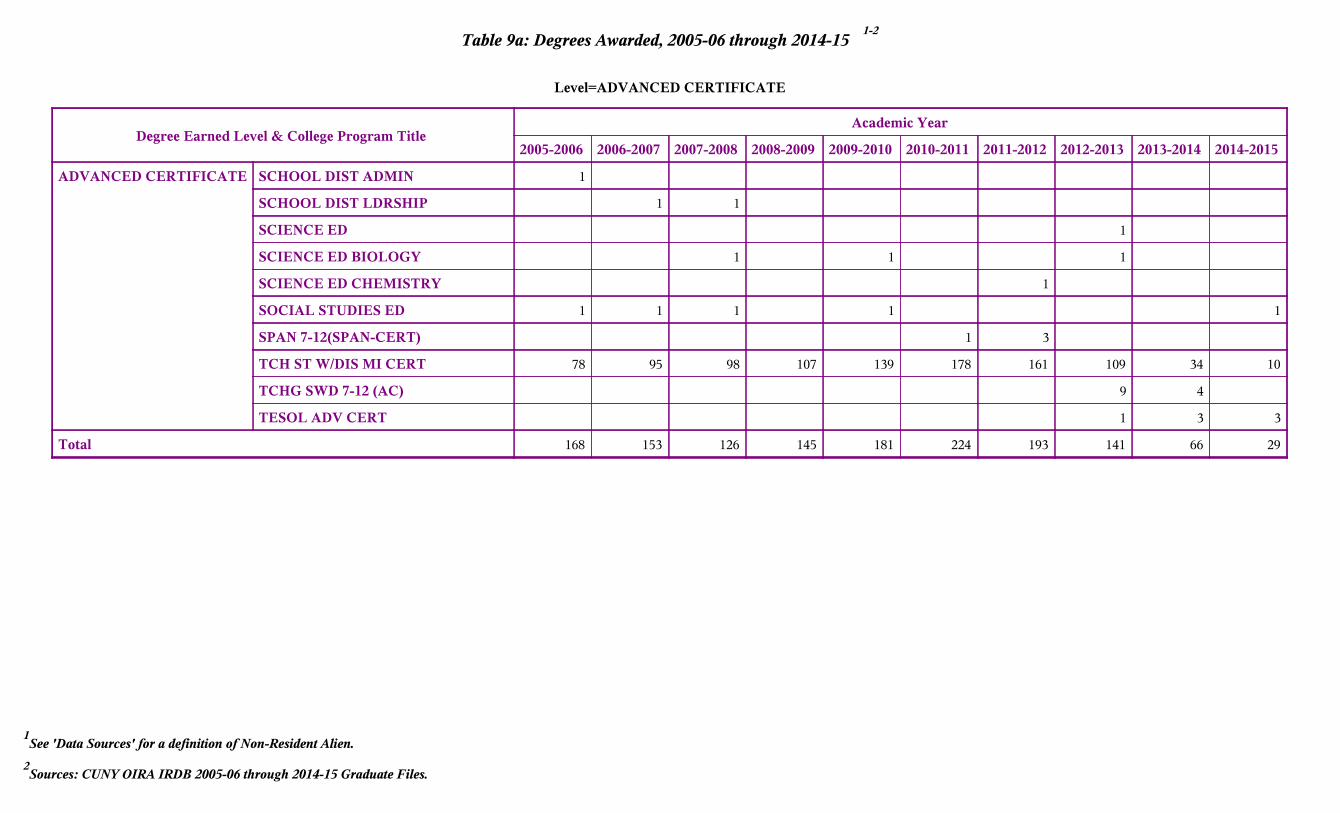
Table 9a: Degrees Awarded, 2005-06 through 2014-15 1-2
2Sources: CUNY OIRA IRDB 2005-06 through 2014-15 Graduate Files.
1See 'Data Sources' for a definition of Non-Resident Alien.
Table 9a: Degrees Awarded, 2005-06 through 2014-15 1-2
Level=ADVANCED CERTIFICATE
Degree Earned Level & College Program TitleAcademic Year
2005-2006 2006-2007 2007-2008 2008-2009 2009-2010 2010-2011 2011-2012 2012-2013 2013-2014 2014-2015
ADVANCED CERTIFICATE ALT CRT BILINGUAL CHILDHOOD 15 6 1 5 6 5 1
ALT CRT CHILDHOOD 41 19 1 3
ALT CRT EARLY CHILDHOOD 1
ALT CRT ENGLISH 7-12 17 18 5 16 15 6 3 3
ALT CRT SCIENCE ED 2 1 2 1 1
ART K-12 TEACHER 5 8 9 10 6 9 11 14
BILINGUAL CHILDHOOD CERT 4
BILINGUAL EXTENSION 1 1
BILINGUAL SPEC ED 1 3 6 20 7 1
CIVIL ENGINEER 2 1 1
DGTL & INTERDISCP CERT 6 5
ED THTR NON CERT 9 9
ENGINEER MANAGEMENT 1 1 1 1 1
ENGLISH 1
ENGLISH ED 1 3 2 2
ENTRY LEVELLDR CERT 2 1 2
MATHEMATICS ED 2 2 2 1
SCHL BUILD LDRSHIPSCED 1
SCHOOL ADMIN & SUPER 7 3
(Continued)
2Sources: CUNY OIRA IRDB 2005-06 through 2014-15 Graduate Files.
1See 'Data Sources' for a definition of Non-Resident Alien.
Table 9a: Degrees Awarded, 2005-06 through 2014-15 1-2
Level=ADVANCED CERTIFICATE
Degree Earned Level & College Program TitleAcademic Year
2005-2006 2006-2007 2007-2008 2008-2009 2009-2010 2010-2011 2011-2012 2012-2013 2013-2014 2014-2015
SCHOOL DIST ADMIN 1ADVANCED CERTIFICATE
SCHOOL DIST LDRSHIP 1 1
SCIENCE ED 1
SCIENCE ED BIOLOGY 1 1 1
SCIENCE ED CHEMISTRY 1
SOCIAL STUDIES ED 1 1 1 1 1
SPAN 7-12(SPAN-CERT) 1 3
TCH ST W/DIS MI CERT 78 95 98 107 139 178 161 109 34 10
TCHG SWD 7-12 (AC) 9 4
TESOL ADV CERT 1 3 3
Total 168 153 126 145 181 224 193 141 66 29

2Sources: CUNY OIRA IRDB 2005-06 through 2014-15 Graduate Files.
1See 'Data Sources' for a definition of Non-Resident Alien.
2Sources: CUNY OIRA IRDB 2005-06 through 2014-15 Graduate Files.
1See 'Data Sources' for a definition of Non-Resident Alien.
Table 9a: Degrees Awarded, 2005-06 through 2014-15 1-2
Level=BACHELOR'S
Degree Earned Level & College Program TitleAcademic Year
2005-2006 2006-2007 2007-2008 2008-2009 2009-2010 2010-2011 2011-2012 2012-2013 2013-2014 2014-2015
BACHELOR'S AMERICAN STUDIES 2 1
ANTHROPOLOGY 3 2 5 7 9 11 10 12 13 15
ARCHITECTURE B-ARCH 50 41
ARCHITECTURE I 59 65 56 48 58 37 68 55 6
ARCHITECTURE MHC 2 3 3
AREA ST AS LA RU 6 4 6 1 8 3 5 5 7 4
AREA ST AS LA RU MHC 1 2
AREA ST BLST PR JWS 10 7 12 8 9 6 11 11 8 10
ART 60 69 75 68 64 101 93 87 90 99
ART K-12 TEACHER 1
ART MHC 1 1 1
BILING CHILDHOOD ED 1 3 3 4 15 26
BILINGUAL CHILDHOOD 8 17 13 8 5 12 12 12 3
BIMEMICAL ENGINEER MHC 7 8
BIOLOGY 29 40 62 60 87 81 93 114 117 99
BIOLOGY BS-MA 1 1 2
BIOLOGY BS-MS 2 2 6
BIOLOGY MHC 4 3 4 2
BIOMEDICAL ENGINEER 10 12 27 19 11 20 12 30 20 19
(Continued)

2Sources: CUNY OIRA IRDB 2005-06 through 2014-15 Graduate Files.
1See 'Data Sources' for a definition of Non-Resident Alien.
Table 9a: Degrees Awarded, 2005-06 through 2014-15 1-2
Level=BACHELOR'S
Degree Earned Level & College Program TitleAcademic Year
2005-2006 2006-2007 2007-2008 2008-2009 2009-2010 2010-2011 2011-2012 2012-2013 2013-2014 2014-2015
BIOMEDICAL ENGINEER MHC 3 4 2BACHELOR'S
CHEM ENGINEER MHC 4 2
CHEMICAL ENGINEER 9 28 27 13 20 31 22 34 3
CHEMISTRY 16 22 29 27 20 25 22 31 57 69
CHEMISTRY MHC 3 1 2
CHILDHOOD ED 4 4 9 14 11 63 39
CIVIL ENGINEER 7 15 34 21 44 24 28 30 37 31
CIVIL ENGINEER MHC 2 3 14
COMMUNICATIONS 59 79 75 62 108 126 125 92 86 101
COMP LITERATURE 1 1 1
COMPUTER ENGINEER 10 26 26 24 23 16 21 23 22 25
COMPUTER ENGR MHC 1 1 3
COMPUTER SCIENCE 26 20 32 19 28 17 30 27 28 23
CWE EARLY CHILD ED 2
CWE INTERDISC LA&SCI 146 137 156 138 129 156 150 124 119 137
EARLY CHILDHOOD ED 50 34 35 40 42 69 57 75 30 14
EARTH SYS SCI ENV ENGINEER 19 29
ECONOMICS 45 39 47 51 69 86 66 64 70 70
ECONOMICS 4-YEAR 1 9 5 4
(Continued)

2Sources: CUNY OIRA IRDB 2005-06 through 2014-15 Graduate Files.
1See 'Data Sources' for a definition of Non-Resident Alien.
Table 9a: Degrees Awarded, 2005-06 through 2014-15 1-2
Level=BACHELOR'S
Degree Earned Level & College Program TitleAcademic Year
2005-2006 2006-2007 2007-2008 2008-2009 2009-2010 2010-2011 2011-2012 2012-2013 2013-2014 2014-2015
ECONOMICS MHC 1 1 3 9BACHELOR'S
ELEC DES & MULTIMED 8 6 14 16 17 17 20 22 7 15
ELEC DESIGN MULTI-MEDIA MHC 1
ELEC ENGINEER LCC 1
ELEC ENGINEER MHC 1 2
ELECTRICAL ENGINEER 57 77 82 87 88 74 71 78 70 57
ELEMEN W/BILIN EXT 1
ELEMENTARY N-6 1 1
ENGLISH 58 65 62 62 84 106 133 149 133 115
ENGLISH 7-12 1
ENGLISH MHC 3 1 1
ENV EARTH SYS SCI 7 4 10 10 6 11 4 8
ENV ENGR MHC 1
FILM 8 14 17 27 25 31 21 23 20
GEOLOGY 1 4 5 3 5 6 6 11 10 17
HISTORY 16 15 19 24 28 31 39 51 57 44
HISTORY 4YEAR 3 2 10 1
HISTORY MHC 1 2
INTERNAT RELATIONS 20 11 22 39 22 34 56 40 6
(Continued)

2Sources: CUNY OIRA IRDB 2005-06 through 2014-15 Graduate Files.
1See 'Data Sources' for a definition of Non-Resident Alien.
Table 9a: Degrees Awarded, 2005-06 through 2014-15 1-2
Level=BACHELOR'S
Degree Earned Level & College Program TitleAcademic Year
2005-2006 2006-2007 2007-2008 2008-2009 2009-2010 2010-2011 2011-2012 2012-2013 2013-2014 2014-2015
INTERNAT STUDIES 51 45BACHELOR'S
INTERNAT STUDIES MHC 1 3 1 4
LANDSCAPE ARCH I 13 7 2 3 3 1 1 1
MANAGMNT & ADMIN 25 43 45 35 52 44 48 52 68 75
MANAGMNT & ADMIN MHC 7
MATH 4-YEAR 1
MATH SCI & IND APPL 1 4 6 6 7 7 6 15 22 23
MATH SCI & IND APPL MHC 1
MATHEMATICS 3 8 17 16 10 15 22 22 17 17
MECH ENGINEER LCC 2
MECHANICAL ENGINEER 32 44 46 59 64 62 50 51 70 76
MECHANICAL ENGINEER MHC 2
MHCG 1
MUSIC 31 24 58 51 51 54 46 59 54 53
MUSIC K-12 TEACHER 1 1
MUSIC MHC 1 1 2
PHILOSOPHY 6 7 12 7 5 11 9 11 8 10
PHYSICIAN'S ASST 19 21 29 18 23 34 33 22 28 31
PHYSICS 5 10 7 5 4 9 6 6 18 13
(Continued)

2Sources: CUNY OIRA IRDB 2005-06 through 2014-15 Graduate Files.
1See 'Data Sources' for a definition of Non-Resident Alien.
Table 9a: Degrees Awarded, 2005-06 through 2014-15 1-2
Level=BACHELOR'S
Degree Earned Level & College Program TitleAcademic Year
2005-2006 2006-2007 2007-2008 2008-2009 2009-2010 2010-2011 2011-2012 2012-2013 2013-2014 2014-2015
POLITICAL SCIENCE 21 32 20 28 47 52 54 40 57 65BACHELOR'S
POLITICAL SCIENCE MHC 2 2
PRE-LAW 7 1 5 4 6 7 6 9 15
PSYCHOLOGY 105 123 144 176 189 282 300 287 338 369
PSYCHOLOGY MHC 2 1 5
ROM LANG FR IT SP 28 27 28 32 27 32 25 28 26 25
SOCIOLOGY 26 44 38 31 44 45 55 58 66 73
SOPHIE DAVIS 49 64 56 55 62 61 58 55 53 47
THEATRE 9 10 10 13 22 27 23 35 35 35
URBAN LEGAL STUDIES 1 1 1
Total 1,096 1,278 1,463 1,413 1,638 1,918 1,974 2,026 2,116 2,156

2Sources: CUNY OIRA IRDB 2005-06 through 2014-15 Graduate Files.
1See 'Data Sources' for a definition of Non-Resident Alien.
Table 9a: Degrees Awarded, 2005-06 through 2014-15 1-2
2Sources: CUNY OIRA IRDB 2005-06 through 2014-15 Graduate Files.
1See 'Data Sources' for a definition of Non-Resident Alien.
Table 9a: Degrees Awarded, 2005-06 through 2014-15 1-2
Level=DOCTORAL
Degree Earned Level & College Program TitleAcademic Year
2011-2012 2012-2013 2013-2014 2014-2015
DOCTORAL BIOMEDICAL ENGINEER PHD 4 3 5
CHEMICAL ENGINEER PHD 1 1 4 8
CIVIL ENGINEER 3 5
CIVIL ENGINEER PHD 1
ELECTRICAL ENGINEER PHD 1 5 10
MECHANICAL ENGINEER PHD 1 2 2 5
Total 2 9 17 33

2Sources: CUNY OIRA IRDB 2005-06 through 2014-15 Graduate Files.
1See 'Data Sources' for a definition of Non-Resident Alien.
2Sources: CUNY OIRA IRDB 2005-06 through 2014-15 Graduate Files.
1See 'Data Sources' for a definition of Non-Resident Alien.
Table 9a: Degrees Awarded, 2005-06 through 2014-15 1-2
Level=MASTERS
Degree Earned Level & College ProgramTitle
Academic Year
2005-2006 2006-2007 2007-2008 2008-2009 2009-2010 2010-2011 2011-2012 2012-2013 2013-2014 2014-2015
MASTERS ALT CERT MDL SCH SC 1 1 2 15 33 26 4 1
ALT CERT MIDSCH MATH 43 38 63 58 49 47 16 7
ALT CRT ENG/SPKRS 25 40 22 46 40 11 2 2
ALT CRT MATH ED TR 24 31 28 29 39 22 7 2
ALT CRT SCIENCE ED 23 21 37 39 50 18 2 2
ALT CRT SOCIAL STU 5 4 3 1 1
APPLIED URBAN ANTH 1 1 1 1
ARCHITECTURE I 9 15 12 23 17 24 37 25 17
ARCHITECTURE II 3 1 3 6 1
ART 6 3 7 2 5 4 6 1
ART (MFA) 7 8 9 5 6 2 9 6
ART HISTORY 1 1
ART K-12 TEACHER 7 8
ART(MFA) 12 10
BILING EXT ELEMENT 2 1
BILINGUAL CHILDHD ED 10 11 6 5 11 7 8 11 17 11
BILINGUAL SPEC ED 6 1 5 3 3 8 7 5 8 5
BIOCHEMISTRY 4 2 7 4 1 4 1 3 3 3
BIOLOGY 4 5 9 4 4 15 7 6 9 11
(Continued)

2Sources: CUNY OIRA IRDB 2005-06 through 2014-15 Graduate Files.
1See 'Data Sources' for a definition of Non-Resident Alien.
Table 9a: Degrees Awarded, 2005-06 through 2014-15 1-2
Level=MASTERS
Degree Earned Level & College ProgramTitle
Academic Year
2005-2006 2006-2007 2007-2008 2008-2009 2009-2010 2010-2011 2011-2012 2012-2013 2013-2014 2014-2015
BIOLOGY BS-MA 1 1 2MASTERS
BIOLOGY BS-MS 2 2 6
BIOMEDICAL ENGINEER 3 13 5 15 11 11 14 19 9 7
BRANDING & INTEGRTD 23
CHEMICAL ENGINEER 10 8 6 10 12 10 6 22 5 7
CHEMISTRY 1 7 2 10 9 9 8 6 1
CHILDHOOD ED 24 45 37 34 33 32 31 42 30 17
CIVIL ENGINEER 17 14 19 20 22 27 24 37 31 19
COMPUTER ENGINEER 21 27
COMPUTER SCIENCE 39 49 50 61 41 35 22 33 3
CREATIVE WRITING 35 34 53 24 30 26 28 32 39 21
CWE STDY OF AMERICAS 6 7
EARLY CHILDHOOD ED 25 32 23 45 26 26 38 39 34 26
EARTH SYS & ENV SCI & TEC 4
ECONOMICS 14 34 17 27 15 19 10 20 24 24
ECONOMICS 4-YEAR 1 9 5 4
ED THEATER 2 10 23 28 31 10 13
ELECTRICAL ENGINEER 54 45 30 51 39 39 47 48 30 36
ELEMENTARY ED 5 2
(Continued)

2Sources: CUNY OIRA IRDB 2005-06 through 2014-15 Graduate Files.
1See 'Data Sources' for a definition of Non-Resident Alien.
Table 9a: Degrees Awarded, 2005-06 through 2014-15 1-2
Level=MASTERS
Degree Earned Level & College ProgramTitle
Academic Year
2005-2006 2006-2007 2007-2008 2008-2009 2009-2010 2010-2011 2011-2012 2012-2013 2013-2014 2014-2015
ENGLISH 5 18 9 6 14 7 14 14 24 13MASTERS
ENGLISH 7-12 16 2 31 7 23 25 11 5 1
ENVIRONMENTAL ED 1
GEOLOGY 4 1 3 1 8 5 3 6 1 5
HISTORY 14 8 9 11 8 17 16 11 27 8
HISTORY 4YEAR 3 2 10 1
INFORMATION SYSTEMS 7 1 9 22 14
INTDEPT ENGINEER PROG 2 1
INTERNAT RELATIONS 9 12 15 25
INTERNAT STUDIES 28 32 40 20 22 29 12 1 2
LANDSCAPE ARCH I 14 18
LANDSCAPE ARCH II 1 1 2 1 1
LANG AND LITERACY 9 5 11 13 10 9 7 9 12 10
LITERACY BIRTH 24 13 18 11 14 15 12 9 2
LITERACY BIRTH-G 4 2
LITERACY GR 5-12 14 6 3 11 10 7 2 3 3
MATH 4-YEAR 1
MATHEMATICS 11 10 8 12 5 9 11 15 42 30
MATHEMATICS ED 3 7 10 6 17 13 6 49 2
(Continued)

2Sources: CUNY OIRA IRDB 2005-06 through 2014-15 Graduate Files.
1See 'Data Sources' for a definition of Non-Resident Alien.
Table 9a: Degrees Awarded, 2005-06 through 2014-15 1-2
Level=MASTERS
Degree Earned Level & College ProgramTitle
Academic Year
2005-2006 2006-2007 2007-2008 2008-2009 2009-2010 2010-2011 2011-2012 2012-2013 2013-2014 2014-2015
MDL SCHL MTH ED SPC 2 2 4 2 7 12 10 14 11 9MASTERS
MECHANICAL ENGINEER 19 24 33 27 18 15 25 26 16 19
MEDIA ARTS PROD 21 19 26 17 22 22 14 29 20 23
MEGR 1 2
MENTAL HEALTH COUN 3 6 18 22 20 18 23 9
MIDDLE SCHL SCI EDU 2 4 4 2 4 9 3 8 2 2
MUSIC 6 13 10 7 10 10 11 7 7 7
PHYSICS 4 11 4 5 6 2 3 6 7 11
PSYCHOLOGY 14 43 41 20 25 37 29 36 22 29
PUBLIC SERVICE MGT 7 22 14 13 16 18
READING TEACHER 1
SCHL BUILD LDRSHIPSCED 13 7 29 10 31 21 16 16 25
SCHOOL ADMIN & SUPER 26 23 6 3
SCIENCE ED 2 1 1 3
SCIENCE ED BIOLOG 4 6 6 7 3 7 6 3
SCIENCE ED CHEMISTRY 3 4 4 1 2 1 6 12
SCIENCE ED PHYSICS 1 2 1 2 1
SEC SCIENCE ED 1
SOCIAL STUDIES ED 4 10 11 2 3 7 8 11 5 5
(Continued)

2Sources: CUNY OIRA IRDB 2005-06 through 2014-15 Graduate Files.
1See 'Data Sources' for a definition of Non-Resident Alien.
Table 9a: Degrees Awarded, 2005-06 through 2014-15 1-2
Level=MASTERS
Degree Earned Level & College ProgramTitle
Academic Year
2005-2006 2006-2007 2007-2008 2008-2009 2009-2010 2010-2011 2011-2012 2012-2013 2013-2014 2014-2015
SOCIOLOGY 5 3 2 6 5 4 15 11 20MASTERS
SPAN 7-12 (NON-SPAN) 2 1 5
SPAN 7-12(SPAN MAJ) 3 6 3
SPAN 7-12(SPAN-CERT) 2
SPANISH 3 9 10 9 9 9 19 9 19 9
STDY OF AMERICAS 1 6 3
SUSTAINABILITY IN U 15 16 25 20
TCH ENG AS 2ND LANG 1
TCH ENGLISH/SPKRS 17 27 24 30 36 25 39 24 38 34
TCH STDS W/DIS IN MID 4 19 8 2
TCH STUD W/DIS 86 54
TCHG SWD 7-12 14 29 41
TEACH SPECIAL ED 5 1 1
URBAN DESIGN 6 14 6 14 9 12 12 9 15 13
Total 652 793 795 808 842 851 724 892 899 804

2Sources: CUNY OIRA IRDB 2005-06 through 2014-15 Graduate Files.
1See 'Data Sources' for a definition of Non-Resident Alien.
Table 9b: Degrees Awarded, 2005-06 through 2014-15 by Gender 1-2
2Sources: CUNY OIRA IRDB 2005-06 through 2014-15 Graduate Files.
1See 'Data Sources' for a definition of Non-Resident Alien.
Table 9b: Degrees Awarded, 2005-06 through 2014-15 by Gender 1-2
Gender & Degree TypeAcademic Year
2005-2006 2006-2007 2007-2008 2008-2009 2009-2010 2010-2011 2011-2012 2012-2013 2013-2014 2014-2015
Men ADVANCED CERTIFICATE 47 46 48 41 52 70 52 34 16 8
BACHELOR'S 458 575 664 644 778 859 870 877 921 931
DOCTORAL 1 7 12 25
MASTERS 298 401 369 366 363 355 333 406 391 340
Women ADVANCED CERTIFICATE 121 107 78 104 129 154 141 107 50 21
BACHELOR'S 638 703 799 769 860 1,059 1,104 1,149 1,195 1,225
DOCTORAL 1 2 5 8
MASTERS 354 392 426 442 479 496 391 486 508 464
Total 1,916 2,224 2,384 2,366 2,661 2,993 2,893 3,068 3,098 3,022

2Sources: CUNY OIRA IRDB 2005-06 through 2014-15 Graduate Files.
1See 'Data Sources' for a definition of Non-Resident Alien.
Table 9c: Degrees Awarded, 2005-06 through 2014-15 Ethnicity - IPEDS not available1-2
2Sources: CUNY OIRA IRDB 2005-06 through 2014-15 Graduate Files.
1See 'Data Sources' for a definition of Non-Resident Alien.
Table 9c: Degrees Awarded, 2005-06 through 2014-15 Ethnicity - IPEDS not available1-2
Degree Type & EthnicityAcademic Year
2005-2006 2006-2007 2007-2008 2008-2009 2009-2010 2010-2011 2011-2012 2012-2013 2013-2014 2014-2015
ADVANCED CERTIFICATE Asian or Pacific Islander 3 2 3 2 6 2 5 10 1
Black, Non-Hispanic 28 26 21 27 24 27 31 27 7 4
Hispanic 31 24 11 22 26 36 28 32 20 9
Nonresident Alien 2 2 4 3 2 2 2 1
White, Non-Hispanic 104 101 91 92 121 156 127 70 36 15
BACHELOR'S American Indian or Native Alaskan 1 2 5 1 2 5 4 4 3
Asian or Pacific Islander 133 173 212 189 292 276 287 328 419 440
Black, Non-Hispanic 363 367 407 392 370 532 514 476 487 529
Hispanic 308 354 361 377 468 541 603 630 616 633
Nonresident Alien 102 140 201 167 185 179 175 175 146 160
White, Non-Hispanic 189 244 280 283 322 388 390 413 444 391
DOCTORAL Asian or Pacific Islander 1 3 2
Black, Non-Hispanic 1 2
Hispanic 1 1 2
Nonresident Alien 1 4 8 16
White, Non-Hispanic 3 3 13
(Continued)

2Sources: CUNY OIRA IRDB 2005-06 through 2014-15 Graduate Files.
1See 'Data Sources' for a definition of Non-Resident Alien.
Table 9c: Degrees Awarded, 2005-06 through 2014-15 Ethnicity - IPEDS not available1-2
Degree Type & EthnicityAcademic Year
2005-2006 2006-2007 2007-2008 2008-2009 2009-2010 2010-2011 2011-2012 2012-2013 2013-2014 2014-2015
MASTERS American Indian or Native Alaskan 2 1 1 1 1 2
Asian or Pacific Islander 47 47 54 50 60 64 50 90 59 78
Black, Non-Hispanic 154 153 158 167 149 157 123 138 162 147
Hispanic 102 114 75 85 125 133 119 139 171 135
Nonresident Alien 132 163 159 188 163 135 126 160 111 121
White, Non-Hispanic 215 316 349 318 344 361 305 365 395 321
Total 1,916 2,224 2,384 2,366 2,661 2,993 2,893 3,068 3,098 3,022

Enr
ollm
ent
2575
125175225275325375425475525575625675725775825875925975
102510751125117512251275132513751425147515251575162516751725177518251875192519752025207521252175222522752325237524252475
Academic Terms
2006 2007 2008 2009 2010 2011 2012 2013 2014 2015
Undergraduates
Masters
Certificates
Graph 9: Degrees Awarded 2006 through 2015 -Doctoral:2011=2,2012=9,2013=17,2015=33

3Source: CUNY OIRA IRDB.
2Other NYS includes Nassau, Putnam, Rockland, Suffork and Westchester.
1Other NYS includes Bergen, Essex, Hudson and Union.
Table 10: Fall 2006-2015 All Students by Residence and Gender1-3
3Source: CUNY OIRA IRDB.
2Other NYS includes Nassau, Putnam, Rockland, Suffork and Westchester.
1Other NYS includes Bergen, Essex, Hudson and Union.
Table 10: Fall 2006-2015 All Students by Residence and Gender1-3
Residence & Gender
Fall Terms
%Fall2006
Fall2007
Fall2008
Fall2009
Fall2010
Fall2011
Fall2012
Fall2013
Fall2014
Fall2015
Bronx Men 1,051 1,074 1,127 1,237 1,171 1,180 1,180 1,115 1,103 1,181 7.4
Women 1,224 1,340 1,514 1,639 1,424 1,537 1,575 1,529 1,494 1,614 9.6
Brooklyn Men 1,300 1,319 1,376 1,441 1,419 1,402 1,392 1,328 1,292 1,442 8.9
Women 1,271 1,356 1,485 1,611 1,505 1,531 1,557 1,522 1,334 1,429 9.5
Manhattan Men 1,599 1,628 1,598 1,660 1,527 1,580 1,574 1,471 1,392 1,510 10.1
Women 2,135 2,220 2,258 2,257 2,100 2,098 2,125 1,944 1,763 1,815 13.4
Missing Men 97 152 149 163 159 155 140 181 747 301 1.5
Women 86 139 146 159 168 187 176 155 807 336 1.5
Other NJ Men 143 213 181 145 112 112 108 101 89 88 0.8
Women 129 149 145 138 122 118 108 98 82 102 0.8
Other NYS Men 647 767 870 910 916 956 936 959 922 994 5.7
Women 678 813 982 1,122 1,065 1,051 1,058 1,037 931 981 6.3
Queens Men 1,629 1,863 1,931 2,079 2,067 2,231 2,221 2,146 2,007 2,201 13.2
Women 1,310 1,504 1,640 1,747 1,798 1,951 2,011 1,878 1,780 1,937 11.4
Total 13,299 14,537 15,402 16,308 15,553 16,089 16,161 15,464 15,743 15,931 100

1Source: CUNY OIRA Institutional Research Data Base [IRDB]
4Filipino includes Tagalog.
3Chinese includes Cantonese and Mandarin.
1This table shows all languages spoken at CCNY.
1Source: CUNY OIRA Institutional Research Data Base [IRDB]
4Filipino includes Tagalog.
3Chinese includes Cantonese and Mandarin.
1This table shows all languages spoken at CCNY.
Table 11a: Fall 2006-2015 Students by Native Language and Gender 1-4
Language
Term_Enrolled_Date
Fall 2006 Fall 2007 Fall 2008 Fall 2009 Fall 2010 Fall 2011 Fall 2012 Fall 2013 Fall 2014 Fall 2015
Men Women Men Women Men Women Men Women Men Women Men Women Men Women Men Women Men Women Men Women
AFRIKAANS 1 2 1 2 1 3 1 2 1 4 2 3 1 5 2
AKAN 2 1 5 1 6 4 7 6 6 3 4 2 6 3 6 2 7 3 9 4
ALBANIAN 32 22 33 27 31 33 34 38 40 39 43 35 31 36 37 29 41 31 38 29
AMHARIC 5 7 6 5 5 3 4 2 6 6 5 6 5 6 4 8 3 3 3 3
ARABIC 85 30 94 33 100 41 100 39 89 38 106 42 100 45 83 53 98 56 108 57
ARMENIAN 1 1 1 2 3 2 3 1 3 2 1 2 2 3 2 3 2 3 4
ASSAMESE 1
AZERBAIJANI 1 3 1 1 1 1 1
BALUCHI 2 2 2 2 2 1 2 2
BEMBA 1 2 2 1 1
BENGALI 152 108 176 129 181 140 213 154 212 154 229 190 241 182 212 178 214 185 202 176
BERBER 1 1 1 1 3 3 1 1 1 1 1 1 1 1
BRAHUI 1 1 1 1
BULGARIAN 9 2 8 4 9 4 5 4 8 5 8 4 5 3 3 5 2 4 5
BURMESE 12 6 10 7 17 9 23 8 21 9 20 4 19 4 17 4 15 5 12 3
BYELORUSSIAN 2 2 3 2 3 1 1 1 1 1 1 2 1 1 1
CAMBODIAN 2 1 1 2 1 2 1 2 1 2 2 1 3
(Continued)

1Source: CUNY OIRA Institutional Research Data Base [IRDB]
4Filipino includes Tagalog.
3Chinese includes Cantonese and Mandarin.
1This table shows all languages spoken at CCNY.
Table 11a: Fall 2006-2015 Students by Native Language and Gender 1-4
Language
Term_Enrolled_Date
Fall 2006 Fall 2007 Fall 2008 Fall 2009 Fall 2010 Fall 2011 Fall 2012 Fall 2013 Fall 2014 Fall 2015
Men Women Men Women Men Women Men Women Men Women Men Women Men Women Men Women Men Women Men Women
CANTONESE 69 35 64 49 79 45 76 51 82 48 71 52 75 48 69 52 77 55 76 48
CATALAN 1 1 1 1 1 1 1
CEBUANO 1 1 1 1 1 2 2 2 1 1 1 1 1
CHAGGA 1 1 1 1 1 1
CHIGA 1 1
CHINESE 183 84 173 114 179 124 209 128 210 151 217 161 226 179 237 200 232 184 248 186
CREOLE 63 46 57 47 56 45 46 38 33 36 34 33 33 31 29 27 29 23 34 27
CZECH 2 1 1 1 1 1 1 1 1 2 2
DANISH 1
DUTCH-FLEMISH 1 1 3 2 3 2 3 1 4 2 3 3 1 3 1
DYERMA 1 1 1
DZONGKHA 1 1 1 1 2 1 2 1 1 2 2 1
EDO 3 3 5 2 6 4 4 4 5 2 3 1 6 2 7 1 6 1 2 1
EFIK 1 1 1 1 1 1 1 2
ENGLISH 1440 1480 1619 1721 1818 2064 2037 2407 2050 2357 2132 2478 2146 2553 2172 2499 2311 2529 2467 2541
ESPERANTO 1 1 1 1 1 1
ESTONIAN 2 2 2 2 1
(Continued)

1Source: CUNY OIRA Institutional Research Data Base [IRDB]
4Filipino includes Tagalog.
3Chinese includes Cantonese and Mandarin.
1This table shows all languages spoken at CCNY.
Table 11a: Fall 2006-2015 Students by Native Language and Gender 1-4
Language
Term_Enrolled_Date
Fall 2006 Fall 2007 Fall 2008 Fall 2009 Fall 2010 Fall 2011 Fall 2012 Fall 2013 Fall 2014 Fall 2015
Men Women Men Women Men Women Men Women Men Women Men Women Men Women Men Women Men Women Men Women
EWE 3 1 2 5 1 5 1 7 2 4 2 7 3 5 5 5 4 7 3
FARSI 2 3 7 6 7 11 2 10 6 7 4 7 8 5 11 3 12 3 11
FINNISH 1 2 1 1 1 1 1
FON 1 2 2 2 1 1 1
FRENCH 56 30 58 31 58 31 51 38 54 37 48 34 54 32 52 30 49 39 56 41
FULA 2 1 3 4 3 7 2 5 3 5 5 3 5 6 4 8 3 9 2
FULAKUNDA 1 1
FUTA JALON 1 1 2 1 1 1 1
GAELIC 1 1 1
GEORGIAN 2 1 2 1 2 2 2 3 2 3 4 4 3 5 4 2 4 5
GERMAN 1 9 6 4 5 1 6 2 8 2 4 2 3 2 2 3 1
GREEK 19 12 17 8 16 11 14 7 10 7 9 10 9 8 10 7 11 10 15 10
GUARANI 1 1
GUJARATI 13 11 15 12 14 10 12 8 16 6 20 8 18 11 15 8 14 11 13 12
HAKKA 1 1 1 2 1
HAUSA 3 3 3 1 4 5 5 4 1 2 3 1 3 2 3 3 2
HEBREW 19 16 19 15 19 15 19 12 15 10 15 10 13 8 13 6 6 5 6 4
(Continued)

1Source: CUNY OIRA Institutional Research Data Base [IRDB]
4Filipino includes Tagalog.
3Chinese includes Cantonese and Mandarin.
1This table shows all languages spoken at CCNY.
Table 11a: Fall 2006-2015 Students by Native Language and Gender 1-4
Language
Term_Enrolled_Date
Fall 2006 Fall 2007 Fall 2008 Fall 2009 Fall 2010 Fall 2011 Fall 2012 Fall 2013 Fall 2014 Fall 2015
Men Women Men Women Men Women Men Women Men Women Men Women Men Women Men Women Men Women Men Women
HINDI 23 12 29 12 30 9 29 10 28 10 27 8 21 9 18 8 14 9 18 9
HUNGARIAN 3 5 5 6 6 5 5 5 5 3 4 4 3 6 1 7 3 5 2 3
IBIBIO 1 1 1 1 1 1 1 1 1 2 2
ICELANDIC 1
IGBO 18 9 17 7 14 9 15 7 14 7 15 4 14 5 12 7 10 7 10 13
IJAW 1 1 1 1 1 1 1
ILOCANO 1 1 1 1 1 2 1 1 1
INDONESIAN 6 3 5 5 6 6 4 7 3 5 3 6 5 5 6 5 9 3 6 4
ITALIAN 11 6 12 5 11 4 12 5 5 5 8 4 12 4 9 4 9 4 8 1
JAPANESE 25 54 29 50 25 42 20 39 9 30 9 25 5 25 5 22 4 20 9 18
KABYLE 1 2
KAMBA 1 1 1 1 1
KANNADA 2 2 1 1 1 1 1
KAREN 1
KASHMIRI 1 1 1
KAZAKH 1 1
KHMER 1 1 1 1 2 1 1 1 1 1
(Continued)

1Source: CUNY OIRA Institutional Research Data Base [IRDB]
4Filipino includes Tagalog.
3Chinese includes Cantonese and Mandarin.
1This table shows all languages spoken at CCNY.
Table 11a: Fall 2006-2015 Students by Native Language and Gender 1-4
Language
Term_Enrolled_Date
Fall 2006 Fall 2007 Fall 2008 Fall 2009 Fall 2010 Fall 2011 Fall 2012 Fall 2013 Fall 2014 Fall 2015
Men Women Men Women Men Women Men Women Men Women Men Women Men Women Men Women Men Women Men Women
KIKUYU 1 1 1 1 1 1 1
KIRGHIZ 1 1 1 1
KONKANI 1 1 1 1 1 1
KOREAN 65 57 63 71 70 66 76 61 79 60 89 61 87 64 81 45 75 36 59 32
KURDISH 1 1
LATIN 1 1 1 1
LATVIAN 1 1 1 2
LINGALA 1 2 1 1 1 1 1
LITHUANIAN 2 2 1 2 2 2 2 1 1 2 1 3 1
LUO 1 1 1 1
LURI 1 1 1
MACEDONIAN 2 2 1 1 1 1 2 2 2 2 3 3 2
MALAGASY 1 1 1 2 1
MALAY 1 1 1 1 2 5 3 4 2 1
MALAYALAM 22 8 23 8 25 10 22 12 18 13 12 10 17 15 16 15 14 14 15 11
MALINKE-BAMBARA-D 1 1 2 1 1 2 2 2 2 1 2 1 1 1 2 1
MANDARIN 13 7 17 16 18 17 21 19 22 21 19 22 17 23 16 17 12 18 16 21
(Continued)

1Source: CUNY OIRA Institutional Research Data Base [IRDB]
4Filipino includes Tagalog.
3Chinese includes Cantonese and Mandarin.
1This table shows all languages spoken at CCNY.
Table 11a: Fall 2006-2015 Students by Native Language and Gender 1-4
Language
Term_Enrolled_Date
Fall 2006 Fall 2007 Fall 2008 Fall 2009 Fall 2010 Fall 2011 Fall 2012 Fall 2013 Fall 2014 Fall 2015
Men Women Men Women Men Women Men Women Men Women Men Women Men Women Men Women Men Women Men Women
MARATHI 1 1 1 1 1 1 1 1 1
MAZANDARANI 1 1 1 1 1
MENDE 1 1 1 1 1 1 1 1
MIN 1
MISSING/UNKNOWN 2891 3543 3127 3771 3080 3939 3169 4037 2979 3635 3108 3734 3104 3759 2956 3445 3106 3539 3144 3621
MOLDAVIAN 1 1 1 1 1
MONGOLIAN 1 1 1 1 1 1 1 1 2 1 1 1 2
MORE 1 1 1 1
NEPALI 3 2 10 4 17 8 21 9 26 9 31 18 35 17 33 18 36 14 25 12
NGULU 1 1 1
NORWEGIAN 1 1 1 1 1 1 1
NOT ASKED 23 45 19 36 14 30 10 29 7 19 5 25 6 20 4 19 6 14 6 11
NUPE 1
ORIYA 1 1 1
OTHER 22 14 24 13 23 9 16 10 17 5 19 4 15 6 10 7 7 3 6 4
PANAY-HILIGAYNON 1
PASHTU 3 2 3 1 4 2 3 1 3 3 3 2 3 2 5 3 6 1
(Continued)

1Source: CUNY OIRA Institutional Research Data Base [IRDB]
4Filipino includes Tagalog.
3Chinese includes Cantonese and Mandarin.
1This table shows all languages spoken at CCNY.
Table 11a: Fall 2006-2015 Students by Native Language and Gender 1-4
Language
Term_Enrolled_Date
Fall 2006 Fall 2007 Fall 2008 Fall 2009 Fall 2010 Fall 2011 Fall 2012 Fall 2013 Fall 2014 Fall 2015
Men Women Men Women Men Women Men Women Men Women Men Women Men Women Men Women Men Women Men Women
PERSIAN 8 2 6 3 6 3 4 2 4 3 1 4 4 2 3 1 6 3 6 3
PILIPINO 3 4 4 4 4 1 7 1 8 6 1 7 2 5 2 5 1 6 1
POLISH 41 36 43 36 35 44 39 48 32 49 33 38 35 36 33 29 31 24 30 23
PORTUGUESE 8 14 15 11 15 18 16 22 14 23 13 23 15 22 10 21 8 18 10 13
PUNJABI 18 10 24 15 29 20 28 23 26 28 32 30 35 29 31 20 25 17 21 13
PUSHTO 2 2 3 2 2 3 2 2 1 3 1 2 2 1
QUECHUA 1
ROMANIAN 6 1 7 1 9 6 12 5 13 8 11 6 9 7 8 7 5 7 2 5
RUANDA 1 1
RUSSIAN 61 62 65 68 67 67 75 65 80 60 79 64 74 77 67 75 63 73 66 73
SANTALI 1 1
SERBO-CROATIAN 6 3 7 5 6 5 9 5 9 10 11 6 10 5 8 4 7 7 5 4
SHILHA 1 1
SHONA 1 1 1 1 2 2 1 1 1
SINCHI 1 1 1
SINHALESE 5 8 5 2 4 3 8 4 8 3 4 5 3 4 3 3 6 3
SLOVAK 2 2 1 1 1 1 1 1 1 1 1
(Continued)

1Source: CUNY OIRA Institutional Research Data Base [IRDB]
4Filipino includes Tagalog.
3Chinese includes Cantonese and Mandarin.
1This table shows all languages spoken at CCNY.
Table 11a: Fall 2006-2015 Students by Native Language and Gender 1-4
Language
Term_Enrolled_Date
Fall 2006 Fall 2007 Fall 2008 Fall 2009 Fall 2010 Fall 2011 Fall 2012 Fall 2013 Fall 2014 Fall 2015
Men Women Men Women Men Women Men Women Men Women Men Women Men Women Men Women Men Women Men Women
SOGO 1
SOMALI 2 1 1 1 1 1 3 5 1 3 1 1 1
SONTINKE 2 1 1 1 1 1 1 1 1 1
SPANISH 761 876 809 972 834 1053 864 1084 818 1034 825 1056 766 1041 718 1018 688 975 650 944
SWAHILI 3 2 3 2 3 4 4 4 3 2 3 3 3 2 4 2 2
SWEDISH 1 2 3 4 2 4 2 3 1 3 1 4 2 3 2 2 2 1
TAGALOG 8 7 9 5 10 7 11 12 13 15 18 15 18 20 24 20 29 19 29 23
TAJIKI 1 1 1 1 1 1 3 2 1 3 3
TAMIL 8 4 9 3 8 5 7 5 7 8 6 8 4 11 2 8 1 8 1 6
TATAR 1 1
TELUGU 2 1 4 1 3 1 4 3 2 1 2 2 2 3 2 2 2
TEMNE 1 1 1
THAI 2 2 3 1 2 2 1 3 3 3 3 4 4 4 2 4 1 7 3
TIBETAN 1 1 2 1 4 1 3 6 5 8 7 4 4 8 8 4 12 2 11 2
TIGRINYA 1 1 1 1
TURKISH 7 7 11 7 7 7 8 6 10 7 10 7 6 7 5 4 8 7 9 6
TURKMEN 1 1 2 1 2 1 2 1
(Continued)

1Source: CUNY OIRA Institutional Research Data Base [IRDB]
4Filipino includes Tagalog.
3Chinese includes Cantonese and Mandarin.
1This table shows all languages spoken at CCNY.
Table 11a: Fall 2006-2015 Students by Native Language and Gender 1-4
Language
Term_Enrolled_Date
Fall 2006 Fall 2007 Fall 2008 Fall 2009 Fall 2010 Fall 2011 Fall 2012 Fall 2013 Fall 2014 Fall 2015
Men Women Men Women Men Women Men Women Men Women Men Women Men Women Men Women Men Women Men Women
TWI-FANTE 14 7 19 9 14 9 12 8 12 9 12 10 13 8 16 8 17 7 16 9
TWO OR MORE LANGU 25 21 37 27 28 30 28 31 23 24 13 12 13 9 8 7 4 7 5 4
UBZEH 1 1 2 2 2 1 2 4 2 4 3 4 3 3
UKRAINIAN 7 10 8 13 9 13 5 15 12 13 18 13 14 12 17 11 16 14 19 10
URDU 80 40 77 54 89 58 95 55 85 69 77 82 83 95 84 85 72 65 79 69
VIETNAMESE 17 9 15 9 11 8 11 9 6 9 6 11 8 10 11 9 20 9 20 7
WOLAYTTA 1 1 1 1 1 1 1
WOLOF 9 4 9 5 8 6 7 5 9 2 6 2 6 3 10 3 9 5 8 8
XHOSA 1
YIDDISH 1 1 1 1 1 2 1
YORUBA 29 14 31 13 32 12 25 9 26 12 21 11 17 11 14 11 12 11 13 6
ZULU 1 1 1 1 1
Total 6466 6833 7016 7521 7232 8170 7635 8673 7371 8182 7616 8473 7551 8610 7301 8163 7552 8191 7717 8214

2There are 96 countries in the world. CCNY has students from 87.8% of them. Data collection started in Fall 1992.
1This table shows all languages spoken at CCNY.
2There are 96 countries in the world. CCNY has students from 87.8% of them. Data collection started in Fall 1992.
1This table shows all languages spoken at CCNY.
Table 11b: Fall 2006-2015 Students by Country and Gender 1
Country
Term_Enrolled_Date
Fall 2006 Fall 2007 Fall 2008 Fall 2009 Fall 2010 Fall 2011 Fall 2012 Fall 2013 Fall 2014 Fall 2015
Men Women Men Women Men Women Men Women Men Women Men Women Men Women Men Women Men Women Men Women
Afghanistan 4 2 9 4 8 4 6 3 5 4 5 7 8 7 8 6 10 7 11 6
Albania 23 19 26 23 26 28 27 28 29 30 31 28 26 28 32 23 36 26 33 29
Algeria 3 2 3 2 3 1 3 1 3 1 3 1 3 2 3 1 3 1
Andorra 1 1 1 1 1
Angola 1 1 2 3 3 1 1
Antigua and Barbuda 7 11 8 11 11 12 9 9 8 11 6 6 4 7 2 7 7 8 7 8
Argentina 13 6 11 7 9 9 7 6 8 8 9 10 8 11 10 12 12 15 12 11
Armenia 1 1 1 2 1 2 1 1 5 4 1 4 1 3 2 7 2 5 5
Australia 1 2 2 1 2 1 1 1 1 1 1 2 1
Austria 3 3 2 3 2 4 1 1 1 1 2 4 2 3 4
Azerbaijan 1 1 1 3 2 1 1 2 1 2 1 3
Bahamas 1 2 1 2 1 4 1 4 1 1 1 1 1 1 1
Bahrain 1 1
Bangladesh 161 118 192 144 198 156 252 170 244 171 268 206 288 194 259 203 276 220 269 221
Barbados 26 34 29 31 27 35 23 25 20 24 12 21 10 16 10 14 9 11 9 12
Belarus/Belorussia 4 4 4 7 4 9 3 9 1 9 5 8 5 10 4 7 9 9 11
Belgium 1 1 1 1 1 1 1 1 1 1 1 1 1 1
Belize 7 5 8 6 6 9 6 10 5 8 5 9 3 8 2 8 4 8 2 10
Benin 2 2 1 1 1 2 1 2 2 2 4 2 5 1 3 1
(Continued)

2There are 96 countries in the world. CCNY has students from 87.8% of them. Data collection started in Fall 1992.
1This table shows all languages spoken at CCNY.
Table 11b: Fall 2006-2015 Students by Country and Gender 1
Country
Term_Enrolled_Date
Fall 2006 Fall 2007 Fall 2008 Fall 2009 Fall 2010 Fall 2011 Fall 2012 Fall 2013 Fall 2014 Fall 2015
Men Women Men Women Men Women Men Women Men Women Men Women Men Women Men Women Men Women Men Women
Bermuda 1 1 1 1 1 3 1 2
Bhutan 1 1 1 1 1 1 1 1 2 2 1
Bolivia 6 4 9 4 8 6 7 6 7 3 6 3 9 2 10 3 3 3 5 4
Bosnia and Herzegovin 3 1 3 1 2 2 3 1 4 1 2 2 2 2 3 2 5 2 5 1
Botswana 1 1 1
Brazil 8 10 13 9 12 13 12 16 11 14 17 16 20 15 18 16 15 14 15 13
British Virgin Island 1
British West Indies 4 1 3 2 2 2 1 3 1 3 1 5 1 5 4 3 1 2
Bulgaria 8 2 7 2 9 2 5 3 8 4 8 4 6 3 6 6 3 5 1 6
Burkina Faso 1 5 7 6 5 1 4 1 5 2 5 3 1 6 2
Burma 1 1 2 1 1 1 1 1 1
Burundi 1 1 1 1 1 2
Cambodia 3 2 3 3 3 4 2 4 3 3 3 3 3 3 2 4 2 3 1 2
Cameroon 5 5 5 3 5 4 5 4 6 6 7 4 5 7 6 8 8 10 7 9
Canada 2 2 1 3 2 5 5 4 7 5 6 3 7 5 9 7 3 5 7 3
Cape Verde 1 1 1 1 1 1 1 1
Central African Repub 1
Chad 1 1 1 2 1
Chile 7 6 6 9 6 9 6 9 6 9 5 10 6 7 4 5 5 4 6 5
(Continued)

2There are 96 countries in the world. CCNY has students from 87.8% of them. Data collection started in Fall 1992.
1This table shows all languages spoken at CCNY.
Table 11b: Fall 2006-2015 Students by Country and Gender 1
Country
Term_Enrolled_Date
Fall 2006 Fall 2007 Fall 2008 Fall 2009 Fall 2010 Fall 2011 Fall 2012 Fall 2013 Fall 2014 Fall 2015
Men Women Men Women Men Women Men Women Men Women Men Women Men Women Men Women Men Women Men Women
China 195 105 196 150 237 158 258 167 274 190 280 201 296 228 313 251 327 264 357 282
Colombia 101 100 114 102 122 97 131 105 125 104 132 111 122 113 116 115 110 104 112 102
Congo 1 1 2 1 2 1 1 1 1
Costa Rica 8 7 7 8 5 7 6 12 4 9 6 6 5 7 5 4 4 6 2 6
Cote D'Ivoire (Ivory 10 1 10 1 7 1 7 4 8 6 8 4 8 1 10 8 5 8 8
Croatia 3 2 3 3 1 4 2 4 3 4 3 4 2 4 1 2 1 2 1 2
Cuba 15 27 18 21 15 21 19 22 20 23 18 19 19 17 13 14 10 18 11 16
Cyprus 3 3 3 3 3 4 3 6 4 5 4 4 5 6 5 4 5 2 4
Czechoslovakia 2 2 2 2 2 2 2 1 1 1 1 2 1 2 2 4
Denmark 2 1 1 1 1 1 1 1
Djibouti 1 1 1 1
Dominica 3 9 1 9 6 8 7 5 8 4 9 4 4 5 6 3 6 3 5 2
Dominican Republic 474 645 484 706 506 791 525 829 501 788 505 791 456 762 441 765 454 749 431 709
Dutch Antilles 1 1 2 1 1 1 1
East Germany 1 1 1 1 2 1 2
Ecuador 144 105 168 114 174 129 195 151 192 155 182 171 173 174 159 172 156 171 155 154
Egypt 44 14 42 13 49 21 45 28 39 23 56 27 48 31 35 41 51 46 70 55
El Salvador 20 14 16 18 19 28 18 37 26 36 27 24 21 32 23 34 31 29 34 34
Equatorial Guinea 1 1 1
(Continued)

2There are 96 countries in the world. CCNY has students from 87.8% of them. Data collection started in Fall 1992.
1This table shows all languages spoken at CCNY.
Table 11b: Fall 2006-2015 Students by Country and Gender 1
Country
Term_Enrolled_Date
Fall 2006 Fall 2007 Fall 2008 Fall 2009 Fall 2010 Fall 2011 Fall 2012 Fall 2013 Fall 2014 Fall 2015
Men Women Men Women Men Women Men Women Men Women Men Women Men Women Men Women Men Women Men Women
Eritrea 1 2 1 2 1 2 1 1
Estonia 1 1 2 1 2 1 2 2 1
Ethiopia 3 7 2 6 3 5 2 4 1 7 2 7 4 9 4 10 3 5 3 5
Fiji 1 1 1 1 1 1 1
Finland 2 1 2 2 2 1 1 1 1 1 2 1 1 1
France 5 8 5 10 7 7 5 8 5 5 7 5 8 6 6 4 4 8 5 8
Gabon 1 1 1 1 1 3 2 3 1 4 3 1 2 2 1 2 2 1
Gambia 2 1 4 1 3 3 4 3 5 3 5 3 6 3 7 2 6 2 6 1
Georgia 2 1 2 1 2 2 2 4 2 1 3 5 4 3 4 5 1 6 4
Germany 20 18 16 20 23 14 22 12 21 13 16 19 14 11 16 11 19 20 25 15
Ghana 33 13 49 18 43 17 41 21 42 19 39 19 34 19 36 23 39 28 42 31
Greece 33 14 38 15 37 16 34 13 28 15 33 13 29 14 23 14 27 17 34 24
Grenada 12 11 14 14 12 17 16 18 11 14 6 14 6 13 3 13 4 11 6 7
Guam 1 1 1 2 1
Guatemala 13 5 13 5 15 12 19 15 17 17 23 15 19 17 22 14 21 14 17 16
Guinea 8 1 11 3 13 4 12 5 14 6 15 7 13 6 9 6 8 5 7 3
Guinea-Bissau 1
Guyana 97 101 110 117 113 119 125 122 117 125 128 124 124 120 120 97 95 87 103 83
Haiti 133 126 131 134 136 142 113 139 102 128 84 118 93 104 90 94 92 89 89 75
(Continued)

2There are 96 countries in the world. CCNY has students from 87.8% of them. Data collection started in Fall 1992.
1This table shows all languages spoken at CCNY.
Table 11b: Fall 2006-2015 Students by Country and Gender 1
Country
Term_Enrolled_Date
Fall 2006 Fall 2007 Fall 2008 Fall 2009 Fall 2010 Fall 2011 Fall 2012 Fall 2013 Fall 2014 Fall 2015
Men Women Men Women Men Women Men Women Men Women Men Women Men Women Men Women Men Women Men Women
Honduras 16 27 16 24 18 29 18 29 20 28 17 34 24 39 17 36 21 33 22 31
Hong Kong 70 32 61 39 60 31 60 25 61 23 53 21 51 22 48 26 45 19 39 15
Hungary 3 7 5 7 7 4 5 5 6 4 3 4 4 8 3 11 2 9 4 7
Iceland 1 1
India 123 83 140 87 160 92 159 99 161 98 154 100 150 106 135 102 132 103 138 90
Indonesia 8 3 7 5 8 6 6 9 7 7 8 9 9 6 11 5 11 4 9 4
Iran 10 3 12 3 9 1 12 3 14 7 12 7 11 10 10 12 7 13 12 14
Iraq 1 1 1 1 1 2 2 2 2 1 2 2 1 1 1
Ireland 51 24 41 24 40 20 41 25 26 27 26 28 24 28 22 28 26 25 28 22
Isle Of Man 1 1 1
Israel 23 19 26 18 29 22 29 18 27 14 23 17 18 12 20 12 15 13 13 13
Italy 50 18 56 32 48 28 64 36 48 38 52 35 55 36 48 38 44 36 51 35
Jamaica 124 144 148 190 142 199 144 206 143 181 139 181 123 171 113 145 101 140 94 132
Japan 25 54 28 53 26 43 22 39 12 30 15 25 10 22 9 22 7 20 11 17
Jordan 5 2 2 7 1 8 3 10 3 9 4 6 6 4 6 3 7 7 8
Kazakhstan 1 1 1 1 1 3 1 3 1 3 1 2 1 2 1 1
Kenya 5 3 6 3 7 6 7 5 7 5 4 1 3 1 3 1 1 1 1
Kosovo 7 2 8 2 5 3 6 6 8 6 7 6 6 8 4 8 6 8 10 3
Kuwait 1 1 3 1 2 1 1 1 1 1
(Continued)

2There are 96 countries in the world. CCNY has students from 87.8% of them. Data collection started in Fall 1992.
1This table shows all languages spoken at CCNY.
Table 11b: Fall 2006-2015 Students by Country and Gender 1
Country
Term_Enrolled_Date
Fall 2006 Fall 2007 Fall 2008 Fall 2009 Fall 2010 Fall 2011 Fall 2012 Fall 2013 Fall 2014 Fall 2015
Men Women Men Women Men Women Men Women Men Women Men Women Men Women Men Women Men Women Men Women
Kyrgystan 1 1 1 1 2 1 1 2 1 1 1
Laos 1
Latvia 2 1 2 1 1 1 2 1 1 1 2
Lebanon 5 1 8 2 7 2 7 4 5 6 10 5 6 8 10 6 13 8 12 6
Liberia 3 1 2 1 1 1 2 2 3 2 2 3 1 2 1 2 3 3 3
Libya 1
Lithuania 2 3 2 2 2 1 2 1 3 1 4 2 4 3 3 2 3 1 5 2
Macao 2 2 3 1 1 1 1
Macedonia 3 2 1 3 1 2 2 4 3 1 2 2 2 3
Madagascar 1 1 1 1 1 1
Malawi 1 1 1 1 1 1 1
Malaysia 4 4 7 6 7 6 8 10 8 10 8 12 5 9 8 8 9 7 13 6
Mali 3 2 2 6 3 4 3 6 2 6 2 5 3 3 2 2 3 2
Malta 1 1 1 1 2 1 2 2 1 1 1
Mauritania 2 1 1 1 1 2 1 1 1
Mauritius 1 1 1 1 1 1 2 2
Mexico 67 63 90 71 101 75 114 79 103 94 104 110 108 117 117 125 119 148 137 159
Missing/Unknown 3028 3624 3245 3870 3246 4103 3341 4252 3159 3844 3293 4019 3310 4103 3170 3758 3316 3823 3378 3918
Moldova 2 1 2 2 2 3 3 3 2 2 3 2 2 3 2 5 3 4 1 2
(Continued)

2There are 96 countries in the world. CCNY has students from 87.8% of them. Data collection started in Fall 1992.
1This table shows all languages spoken at CCNY.
Table 11b: Fall 2006-2015 Students by Country and Gender 1
Country
Term_Enrolled_Date
Fall 2006 Fall 2007 Fall 2008 Fall 2009 Fall 2010 Fall 2011 Fall 2012 Fall 2013 Fall 2014 Fall 2015
Men Women Men Women Men Women Men Women Men Women Men Women Men Women Men Women Men Women Men Women
Monaco 1 1 1 1 1 1 1
Mongolia 1 1 1 1 1 1 1 2 1 1 1 2 1
Montenegro 1 3 3 2 5 2 6 5 4 9 5 5 6 6 5 6 5 8 6
Montserrat 1 1 1 1 1
Morocco 10 6 15 8 16 9 14 8 16 5 20 3 19 5 19 6 19 9 18 9
Mozambique 1 1
Myanmar, Formerly Bur 15 5 13 5 16 7 20 6 20 7 19 2 15 2 14 3 14 4 10 5
Namibia 1 1
Nauru 1 1
Nepal 5 3 12 4 16 7 17 13 22 16 29 21 34 19 33 19 35 12 28 11
Netherlands (Holland) 1 1 1 1 2 3 3 1 2 2 2 2 1
Nicaragua 5 9 4 11 5 15 7 16 10 14 10 15 9 12 9 10 6 4 4 5
Niger 2 3 3 1 4 1 3 1 1 1 2 1 1 1 2 2
Nigeria 81 60 88 64 93 57 93 59 92 64 84 53 67 49 65 52 59 53 54 49
Northern Mariana Isla 1 1 1 1 1 1 1
Norway 1 3 2 4 1 2 1 3 3 2 3 2 3 1 3 2
Not Asked 9 24 7 20 5 15 5 11 4 8 1 15 3 9 2 12 4 8 3 5
Other 13 16 12 11 8 14 8 16 4 17 6 19 15 18 12 15 14 15 24 19
Pacific Ocean 1 1
(Continued)

2There are 96 countries in the world. CCNY has students from 87.8% of them. Data collection started in Fall 1992.
1This table shows all languages spoken at CCNY.
Table 11b: Fall 2006-2015 Students by Country and Gender 1
Country
Term_Enrolled_Date
Fall 2006 Fall 2007 Fall 2008 Fall 2009 Fall 2010 Fall 2011 Fall 2012 Fall 2013 Fall 2014 Fall 2015
Men Women Men Women Men Women Men Women Men Women Men Women Men Women Men Women Men Women Men Women
Pakistan 80 37 83 56 93 65 105 67 93 80 92 95 98 111 115 98 118 86 121 91
Palestine 1 1 1 3
Panama 11 15 10 13 13 18 13 22 9 17 9 17 10 12 10 11 8 13 9 14
Paraguay 1 3 3 2 3 2 4 2 3 4 5 5 4 4 6 2 4 2 5 1
Peru 44 31 47 45 49 58 47 67 50 67 46 59 52 64 49 54 48 58 38 58
Philippines 26 28 40 29 43 33 46 45 52 44 63 43 64 54 69 54 77 53 80 58
Poland 59 49 69 42 61 46 64 54 60 55 52 41 57 37 57 36 56 29 56 31
Portugal 3 6 3 3 1 4 1 3 1 4 2 2 2 1 1 1 2 2 3 3
Puerto Rico 141 210 143 239 138 264 153 259 131 250 131 220 122 216 117 176 118 193 117 184
Qatar 1 1 1 1 1 1
Romania 6 3 9 3 11 9 15 10 18 11 15 8 13 7 13 6 11 6 6 5
Russia 57 39 56 43 51 40 46 45 37 38 32 41 35 47 34 45 44 50 47 40
Rwanda 2 1 1 1 1 1 1 1 1 1 2 3 3
Saudi Arabia 1 1 1 1
Senegal 11 5 11 5 10 8 7 6 11 4 11 5 10 6 13 6 15 8 12 11
Serbia 2 2 3 2 3 3 4 3 4 2 6 2 5 2 3 3 3 1
Seychelles 1 1 1 1 1 1
Sierra Leone 2 2 2 4 1 6 3 5 3 6 3 5 2 4 4 1 5 4 3 4
Singapore 2 1 2 1 1 2 1 1 3
(Continued)
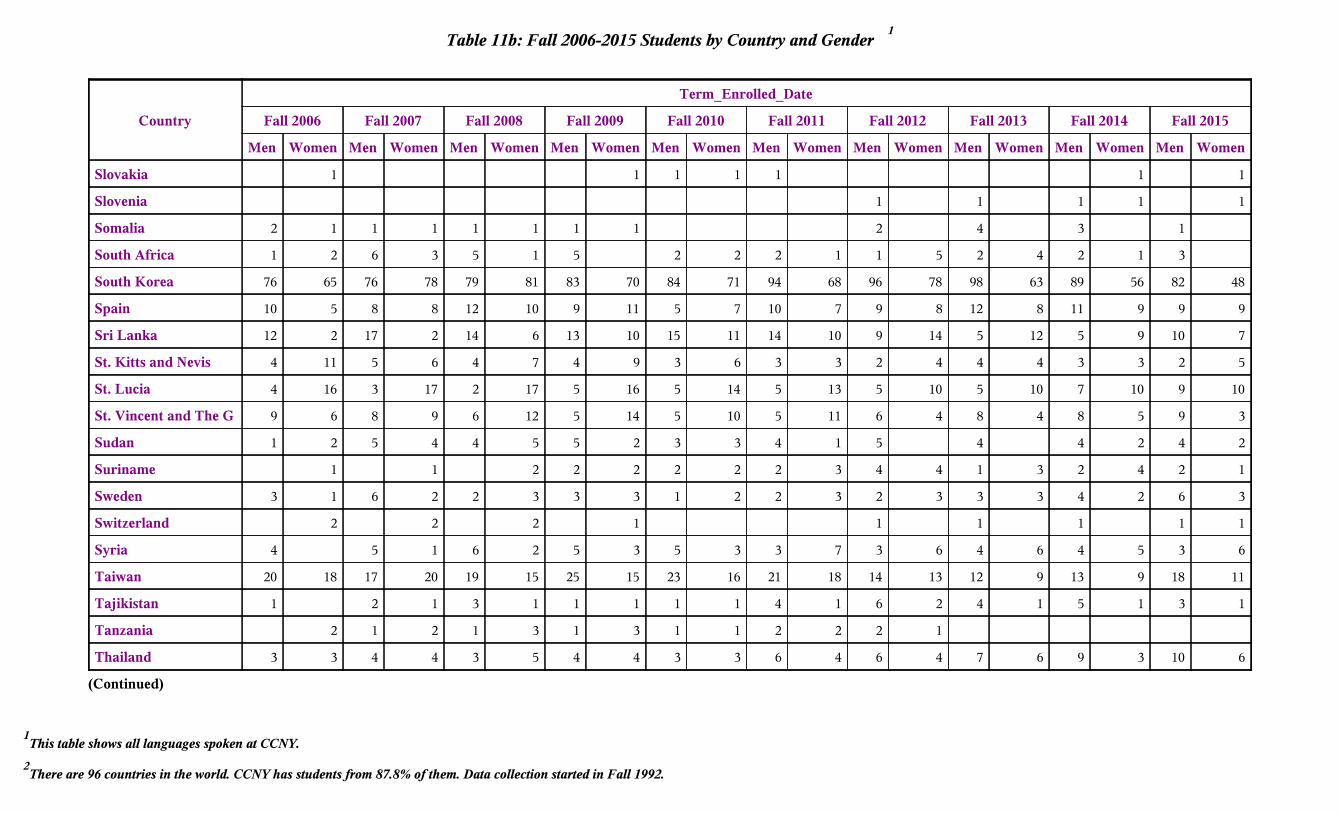
2There are 96 countries in the world. CCNY has students from 87.8% of them. Data collection started in Fall 1992.
1This table shows all languages spoken at CCNY.
Table 11b: Fall 2006-2015 Students by Country and Gender 1
Country
Term_Enrolled_Date
Fall 2006 Fall 2007 Fall 2008 Fall 2009 Fall 2010 Fall 2011 Fall 2012 Fall 2013 Fall 2014 Fall 2015
Men Women Men Women Men Women Men Women Men Women Men Women Men Women Men Women Men Women Men Women
Slovakia 1 1 1 1 1 1 1
Slovenia 1 1 1 1 1
Somalia 2 1 1 1 1 1 1 1 2 4 3 1
South Africa 1 2 6 3 5 1 5 2 2 2 1 1 5 2 4 2 1 3
South Korea 76 65 76 78 79 81 83 70 84 71 94 68 96 78 98 63 89 56 82 48
Spain 10 5 8 8 12 10 9 11 5 7 10 7 9 8 12 8 11 9 9 9
Sri Lanka 12 2 17 2 14 6 13 10 15 11 14 10 9 14 5 12 5 9 10 7
St. Kitts and Nevis 4 11 5 6 4 7 4 9 3 6 3 3 2 4 4 4 3 3 2 5
St. Lucia 4 16 3 17 2 17 5 16 5 14 5 13 5 10 5 10 7 10 9 10
St. Vincent and The G 9 6 8 9 6 12 5 14 5 10 5 11 6 4 8 4 8 5 9 3
Sudan 1 2 5 4 4 5 5 2 3 3 4 1 5 4 4 2 4 2
Suriname 1 1 2 2 2 2 2 2 3 4 4 1 3 2 4 2 1
Sweden 3 1 6 2 2 3 3 3 1 2 2 3 2 3 3 3 4 2 6 3
Switzerland 2 2 2 1 1 1 1 1 1
Syria 4 5 1 6 2 5 3 5 3 3 7 3 6 4 6 4 5 3 6
Taiwan 20 18 17 20 19 15 25 15 23 16 21 18 14 13 12 9 13 9 18 11
Tajikistan 1 2 1 3 1 1 1 1 1 4 1 6 2 4 1 5 1 3 1
Tanzania 2 1 2 1 3 1 3 1 1 2 2 2 1
Thailand 3 3 4 4 3 5 4 4 3 3 6 4 6 4 7 6 9 3 10 6
(Continued)

2There are 96 countries in the world. CCNY has students from 87.8% of them. Data collection started in Fall 1992.
1This table shows all languages spoken at CCNY.
Table 11b: Fall 2006-2015 Students by Country and Gender 1
Country
Term_Enrolled_Date
Fall 2006 Fall 2007 Fall 2008 Fall 2009 Fall 2010 Fall 2011 Fall 2012 Fall 2013 Fall 2014 Fall 2015
Men Women Men Women Men Women Men Women Men Women Men Women Men Women Men Women Men Women Men Women
Togo 6 1 5 1 6 2 9 3 10 4 13 4 17 5 14 6 16 5 16 3
Trinidad and Tobago 81 88 77 100 72 85 67 87 74 80 58 81 60 68 51 64 55 54 48 45
Tunisia 2 1 1 1 1 1 2 1 2 1 1 2 1 2 1 2 1 3
Turkey 10 7 14 9 11 11 12 6 12 6 11 7 7 8 6 5 9 7 11 6
Turkmenistan 1 1
US Virgin Islands 1 4 2 1 1 2 1 5 2 5 1 7 3 9 2 5 3 5 1 2
USA 175 246 253 319 362 469 480 662 515 663 593 739 623 798 608 814 659 783 704 800
Uganda 2 3 2 3 2 2 1 1 1 1 2 1 2 1 2 1 2 1 3 1
Ukraine 18 20 20 26 24 26 28 24 39 20 48 22 44 23 47 23 42 26 38 26
United Arab Emirates 1 1 1 1 1 1 2
United Kingdom 32 23 35 21 28 24 29 16 17 13 15 11 16 7 10 13 15 17 14 11
Uruguay 2 2 2 4 2 2 1 3 2 1 2 1 1 4 2 3 1 2 3 1
Uzbekistan 5 5 4 6 6 8 6 9 9 7 8 7 5 11 8 12 11 10 12 11
Vanuatu 1 1
Venezuela 10 10 12 5 12 7 15 8 16 7 15 7 15 7 12 3 14 4 10 5
Vietnam 24 11 22 12 17 12 17 12 13 12 14 16 16 18 19 19 25 20 27 18
West Germany 1
Yemen 12 4 16 2 12 4 15 3 14 7 10 6 17 5 16 6 26 6 29 10
Yugoslavia 5 3 4 2 3 3 5 3 4 5 6 3 4 3 2 1 2 2
(Continued)

2There are 96 countries in the world. CCNY has students from 87.8% of them. Data collection started in Fall 1992.
1This table shows all languages spoken at CCNY.
Table 11b: Fall 2006-2015 Students by Country and Gender 1
Country
Term_Enrolled_Date
Fall 2006 Fall 2007 Fall 2008 Fall 2009 Fall 2010 Fall 2011 Fall 2012 Fall 2013 Fall 2014 Fall 2015
Men Women Men Women Men Women Men Women Men Women Men Women Men Women Men Women Men Women Men Women
Zaire 1 2 1 2 2 1 1 1
Zambia 3 1 2 1 1 1 1 2 1 1 1 1 1
Zimbabwe 1 2 1 1 1 1 1 1
Total 6466 6832 7016 7521 7232 8170 7635 8673 7371 8182 7616 8473 7551 8610 7301 8163 7552 8191 7717 8214

4Source: CUNY OIRA Institutional Research Data Base [IRDB]
3Includes 'Permit' students from other CUNY colleges and 'CUNY BA' students.
2This table excludes non-degree students.
1For definition of 'Level' see 'Technical Note'.
Table 12 Fall 2006-2015 Undergraduates Enrollment by Level 1-4
4Source: CUNY OIRA Institutional Research Data Base [IRDB]
3Includes 'Permit' students from other CUNY colleges and 'CUNY BA' students.
2This table excludes non-degree students.
1For definition of 'Level' see 'Technical Note'.
Table 12 Fall 2006-2015 Undergraduates Enrollment by Level 1-4
Level
Fall terms
Fall 2006 Fall 2007 Fall 2008 Fall 2009 Fall 2010 Fall 2011 Fall 2012 Fall 2013 Fall 2014 Fall 2015
N % N % N % N % N % N % N % N % N % N %
FRESHMAN 3,823 36.9 4,271 37.7 4,258 35.3 4,226 32.6 3,582 28.9 3,786 29.3 3,658 27.9 3,455 27.4 3,676 28.2 3,650 27.4
SOPHOMORE 2,240 21.6 2,479 21.9 2,853 23.6 3,171 24.5 2,901 23.4 2,701 20.9 2,611 19.9 2,441 19.3 2,516 19.3 2,435 18.3
JUNIOR 2,299 22.2 2,434 21.5 2,679 22.2 3,058 23.6 3,136 25.3 3,094 23.9 3,439 26.2 3,278 26.0 3,244 24.9 3,453 25.9
SENIOR 2,007 19.4 2,131 18.8 2,276 18.9 2,505 19.3 2,765 22.3 3,357 25.9 3,405 26.0 3,455 27.4 3,599 27.6 3,802 28.5
Total 10,369 100.0 11,315 100.0 12,066 100.0 12,960 100.0 12,384 100.0 12,938 100.0 13,113 100.0 12,629 100.0 13,035 100.0 13,340 100.0
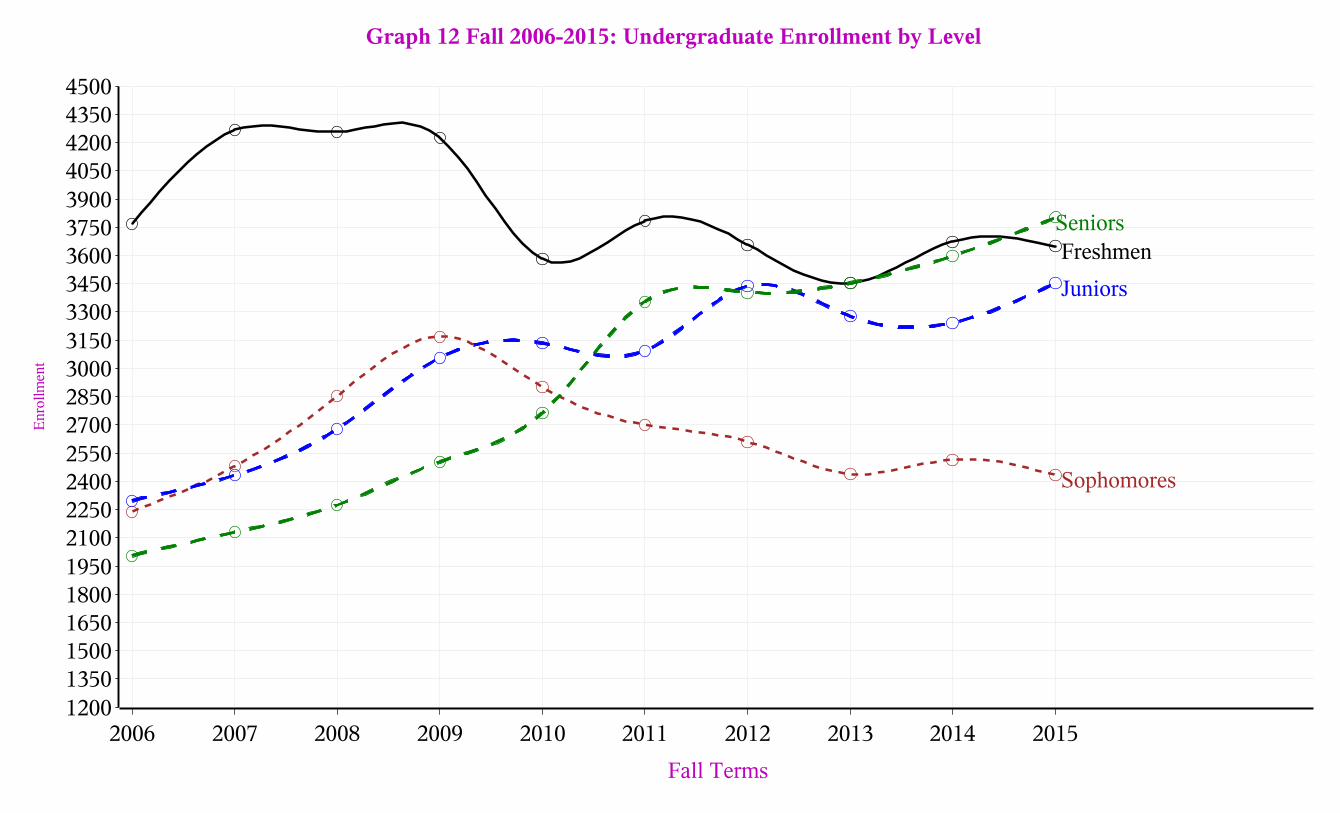
Enr
ollm
ent
12001350150016501800195021002250240025502700285030003150330034503600375039004050420043504500
Fall Terms
2006 2007 2008 2009 2010 2011 2012 2013 2014 2015
Freshmen
Sophomores
Juniors
Seniors
Graph 12 Fall 2006-2015: Undergraduate Enrollment by Level

5Source: CUNY OIRA Institutional Research Data Base [IRDB]
4Upper Division = Juniors and Seniors with more than 60 credits.
3Lower Division = Freshmen and Sophomores with 60 credits or less.
2Includes 'Permit' students from other CUNY colleges and 'CUNY BA' students.
1For definition of 'Level' see 'Technical Note'.
Table 13: Fall 2006-2015 Enrollment by Lower/Upper & Graduate Divisions, Full/Part-time 1-5
Class_Division_Desc=GRADUATE DIVISION
Upper/Lower Division & Full/Part-timeStatus
Term_Enrolled_Date
Fall 2006 Fall 2007 Fall 2008 Fall 2009 Fall 2010 Fall 2011 Fall 2012 Fall 2013 Fall 2014 Fall 2015
N % N % N % N % N % N % N % N % N % N %
GRADUATE DIVISION FULL-TIME 246 8.4 265 8.2 300 9.0 373 11.1 450 14.2 446 14.2 474 15.6 447 15.8 415 15.3 376 14.5
PART-TIME 2,684 91.6 2,957 91.8 3,036 91.0 2,975 88.9 2,719 85.8 2,705 85.8 2,574 84.4 2,388 84.2 2,293 84.7 2,215 85.5
Total 2,930 100.0 3,222 100.0 3,336 100.0 3,348 100.0 3,169 100.0 3,151 100.0 3,048 100.0 2,835 100.0 2,708 100.0 2,591 100.0
Class_Division_Desc=UNDERGRADUATE LOWER DIVISION
Upper/Lower Division & Full/Part-time Status
Term_Enrolled_Date
Fall 2006 Fall 2007 Fall 2008 Fall 2009 Fall 2010 Fall 2011 Fall 2012 Fall 2013 Fall 2014 Fall 2015
N % N % N % N % N % N % N % N % N % N %
UNDERGRADUATE LOWER DIVISION FULL-TIME 4,516 74.5 4,991 73.9 5,457 76.7 5,737 77.6 5,013 77.3 5,008 77.2 4,624 73.8 4,426 75.1 4,669 75.4 4,615 75.8
PART-TIME 1,547 25.5 1,759 26.1 1,654 23.3 1,660 22.4 1,470 22.7 1,479 22.8 1,645 26.2 1,470 24.9 1,523 24.6 1,470 24.2
Total 6,063 100.0 6,750 100.0 7,111 100.0 7,397 100.0 6,483 100.0 6,487 100.0 6,269 100.0 5,896 100.0 6,192 100.0 6,085 100.0

5Source: CUNY OIRA Institutional Research Data Base [IRDB]
4Upper Division = Juniors and Seniors with more than 60 credits.
3Lower Division = Freshmen and Sophomores with 60 credits or less.
2Includes 'Permit' students from other CUNY colleges and 'CUNY BA' students.
1For definition of 'Level' see 'Technical Note'.
Table 13: Fall 2006-2015 Enrollment by Lower/Upper & Graduate Divisions, Full/Part-time 1-5
Class_Division_Desc=UNDERGRADUATE UPPER DIVISION
Upper/Lower Division & Full/Part-time Status
Term_Enrolled_Date
Fall 2006 Fall 2007 Fall 2008 Fall 2009 Fall 2010 Fall 2011 Fall 2012 Fall 2013 Fall 2014 Fall 2015
N % N % N % N % N % N % N % N % N % N %
UNDERGRADUATE UPPER DIVISION FULL-TIME 2,892 67.2 3,155 69.1 3,442 69.5 3,904 70.2 4,304 72.9 4,547 70.5 4,900 71.6 4,848 72.0 4,762 69.6 5,120 70.6
PART-TIME 1,414 32.8 1,410 30.9 1,513 30.5 1,659 29.8 1,597 27.1 1,904 29.5 1,944 28.4 1,885 28.0 2,081 30.4 2,135 29.4
Total 4,306 100.0 4,565 100.0 4,955 100.0 5,563 100.0 5,901 100.0 6,451 100.0 6,844 100.0 6,733 100.0 6,843 100.0 7,255 100.0

Enr
ollm
ent
300
600
900
1200
1500
1800
2100
2400
2700
3000
3300
3600
3900
4200
4500
4800
5100
5400
5700
6000
Fall Terms
2006 2007 2008 2009 2010 2011 2012 2013 2014 2015
Lower_Full-time
Lower_Part-time
Upper_Full-time
Upper_Part-time
Graph 13 Fall 2005-2014 Undergraduates by Class Division

4Source: CUNY OIRA Institutional Research Data Base [IRDB]
3In Spring 2007, The Center for Worker Education (CWE) became Interdisciplinary Arts & Science (IAS).
2'Permit' students from other CUNY colleges, SEEK and 'CUNY BA' students are included.
1Excluded students are those who withdrew or not attending all courses. 'Permit' students from other CUNY colleges, SEEK and 'CUNY BA' students are included.
Table 14: Fall 2006-2015 All Degree-Seeking Undergraduates by Division/School1-4
School or Division
Term_Enrolled_Date
Fall 2006 Fall 2007 Fall 2008 Fall 2009 Fall 2010 Fall 2011 Fall 2012 Fall 2013 Fall 2014 Fall 2015
N % N % N % N % N % N % N % N % N % N %
ADMINISITRATIVE-Non-degree & Permit Students 6 0.0
ARCHITECTURE 219 2.2 327 3.0 281 2.4 258 2.1 252 2.1 314 2.6 275 2.2 270 2.3 250 2.1 271 2.2
CWE INTERDISCIPLINARY STUDIES 635 6.4 577 5.3 609 5.3 635 5.1 608 5.2 598 4.9 598 4.9 556 4.7 524 4.3 338 2.7
EDUCATION 399 4.0 470 4.4 481 4.2 518 4.2 509 4.3 510 4.2 474 3.9 475 4.0 398 3.3 558 4.5
ENGINEERING 1,933 19.4 1,919 17.8 1,909 16.6 2,025 16.4 2,130 18.1 2,206 18.0 2,167 17.7 2,276 19.1 2,286 18.8 2,584 20.7
GATEWAY 2,493 25.1 2,450 22.7 2,897 25.2 2,660 21.6 2,290 19.4 2,252 18.4 2,318 18.9 2,037 17.1 3,303 27.1 3,127 25.1
HUMANITIES & ARTS 1,463 14.7 1,798 16.6 1,949 17.0 2,219 18.0 2,093 17.8 2,125 17.3 2,122 17.3 1,969 16.5 1,758 14.4 1,706 13.7
POWELL SCHOOL 1,125 11.3 1,379 12.8 1,588 13.8 2,015 16.3 1,993 16.9 2,013 16.4 1,993 16.2 2,062 17.3 2,234 18.3 2,399 19.2
SCIENCES 1,238 12.4 1,433 13.3 1,318 11.5 1,534 12.4 1,455 12.3 1,807 14.7 1,880 15.3 1,833 15.4 971 8.0 1,002 8.0
SOPHIE DAVIS/BIOMED 441 4.4 449 4.2 461 4.0 476 3.9 456 3.9 441 3.6 449 3.7 440 3.7 452 3.7 484 3.9
Total 9,946 100.0 10,802 100.0 11,493 100.0 12,340 100.0 11,786 100.0 12,266 100.0 12,276 100.0 11,918 100.0 12,182 100.0 12,469 100.0

1Source: CUNY OIRA Institutional Research Data Base [IRDB]
1Source: CUNY OIRA Institutional Research Data Base [IRDB]
Table 15: Fall 2006-2015 Undergraduates by Major 1
Majors
Fall Terms
Fall2006
Fall2007
Fall2008
Fall2009
Fall2010
Fall2011
Fall2012
Fall2013
Fall2014
Fall2015
ENGINEER CHEMICAL 121 132 131 151 171 163 176 174
ENGINEER CIVIL 348 364 342 386 416 412 381 357 376 444
ADMINISITRATIVE-NON-DEGREE & PERMIT STUDENTS 270 856 871
AMERICAN STUDIES 1 1 5 2
ANTHROPOLOGY 15 27 31 34 43 50 43 46 49 52
ARCHITECTURE B-ARCH 208 324 281 258 250 314 275 259 250 271
ARCHITECTURE MHC 10
AREA ST AS LA RU 16 10 16 24 17 20 19 17 19 22
AREA ST BLST PR JWS 30 27 29 36 24 30 22 27 33 34
ART 343 337 364 394 374 375 369 369 331 367
ART MHC 1 11 17
BIOLOGY 219 319 324 344 271 294 278 255 287 285
BIOLOGY BS-MA 1
BIOLOGY BS-MS 3 1
BIOLOGY MHC 10
BIOTECHNOLOGY 1 4 13
CHEMISTRY 68 87 77 78 82 93 112 130 342 363
CHEMISTRY MHC 4
COMMUNICATIONS 283 377 456 410 307 262 214 191 189 156
COMP LITERATURE 2 1 1 4 1
COMPUTER SCIENCE 199 186 173 180 178 183 195 237 236 338
(Continued)

1Source: CUNY OIRA Institutional Research Data Base [IRDB]
Table 15: Fall 2006-2015 Undergraduates by Major 1
Majors
Fall Terms
Fall2006
Fall2007
Fall2008
Fall2009
Fall2010
Fall2011
Fall2012
Fall2013
Fall2014
Fall2015
CUNY BACCALAUREATE 21 62 42 32 29 24 52 39 21 36
CWE INTERDISC LA&SCI 594 550 487 660 620 605 604 563 550 477
ECONOMICS 155 196 246 256 232 228 253 237 255 299
ECONOMICS MHC 3 13 29
EDUCATION ALT CRT BILINGUAL CHILDHOOD 2 5 6 8 8 11 13 21 112 137
EDUCATION ART K-12 TEACHER 3
EDUCATION BILINGUAL CHILDHOOD 22 15 22 39 64 73 72 84
EDUCATION EARLY CHILDHOOD 40 50 67 142 285 317 264 295 260 280
EDUCATION EARTH SCIENCE 7-12 1
EDUCATION ELEMENTARY N-6 3 2 1 1
EDUCATION ENGLISH 7-12 2
EDUCATION LANG OTHER THAN ENG 1 1 1 1 1
EDUCATION MUSIC K-12 TEACHER 6 8 1 1
ELEC DES & MULTIMED 37 52 53 55 47 49 47 39 71 60
ENGINEER BIOMEDICAL 128 136 139 141 176 188 214 212 232 227
ENGINEER BIOMEDICAL MHC 21
ENGINEER BIOMEMICAL MHC 18 46
ENGINEER CHEMICAL HCC 4 4 3
ENGINEER CHEMICAL MHC 11
ENGINEER CIVIL HCC 1 5
ENGINEER CIVIL LCC 5 7
(Continued)

1Source: CUNY OIRA Institutional Research Data Base [IRDB]
Table 15: Fall 2006-2015 Undergraduates by Major 1
Majors
Fall Terms
Fall2006
Fall2007
Fall2008
Fall2009
Fall2010
Fall2011
Fall2012
Fall2013
Fall2014
Fall2015
ENGINEER CIVIL MHC 7 21 76
ENGINEER COMPUTER 250 217 218 237 229 244 234 240 286 302
ENGINEER COMPUTER MHC 2
ENGINEER EARTH SYS SCI ENV 100 87
ENGINEER ELECTRICAL 513 491 500 485 490 475 427 404 468 478
ENGINEER ELECTRICAL HCC 12 13
ENGINEER ELECTRICAL LCC 1 7 4
ENGINEER ELECTRICAL MHC 9
ENGINEER MECHANICAL 361 366 373 402 408 463 434 474 534 563
ENGINEER MECHANICAL HCC 2 1 1 1
ENGINEER MECHANICAL LCC 4 5 6 6
ENGLISH 212 280 317 453 460 461 484 443 408 341
ENGLISH MHC 5
ENV EARTH SYS SCI 18 30 35 48 65 80 83 105 25 29
FILM 23 54 37 54 58 49 48 50 54 61
GATEWAY 2,988 3,140 3,666 3,274 2,741 2,719 2,826 2,152 3,306 3,127
GEOLOGY 15 13 16 27 30 31 42 42 42 44
HIGH SCHOOL PROGRAM 166 276 325 419 389 436 595 498
HISTORY 93 100 124 169 192 211 183 164 146 113
HISTORY MHC 1 3
INTERNAT RELATIONS 111 124 154 184 189 169 154 136
(Continued)

1Source: CUNY OIRA Institutional Research Data Base [IRDB]
Table 15: Fall 2006-2015 Undergraduates by Major 1
Majors
Fall Terms
Fall2006
Fall2007
Fall2008
Fall2009
Fall2010
Fall2011
Fall2012
Fall2013
Fall2014
Fall2015
INTERNAT STUDIES 128 123
INTERNAT STUDIES MHC 5 3 8
LANDSCAPE ARCH I 11 3 2 1
LIBERAL ARTS 53
MANAGMNT & ADMIN 161 199 211 249 217 215 233 238 242 237
MANAGMNT & ADMIN MHC 3 36
MATH SCI & IND APPL 15 22 27 30 37 57 87 102 96 124
MATHEMATICS 49 64 55 64 71 100 87 75 116 95
MHC AREA ST AS LA R 1
MHC FILM BFA 6
MHC THEATER 1
MUSIC 248 283 296 277 297 312 307 309 274 281
PHILOSOPHY 25 24 28 32 31 37 33 39 34 33
PHYSICS 24 26 26 32 35 43 47 61 60 61
POLITICAL SCIENCE 103 125 145 199 193 178 172 173 195 203
POLITICAL SCIENCE MHC 2
PRE-LAW 12 31 29 53 44 56 57 54 62 37
PSYCHOLOGY 414 519 605 805 864 888 878 966 1,079 1,168
PSYCHOLOGY MHC 1 8 23
PUBLISHING (CERT) 2 1 1 1
ROM LANG FR IT SP 114 110 118 122 92 96 91 91 70 67
(Continued)

1Source: CUNY OIRA Institutional Research Data Base [IRDB]
Table 15: Fall 2006-2015 Undergraduates by Major 1
Majors
Fall Terms
Fall2006
Fall2007
Fall2008
Fall2009
Fall2010
Fall2011
Fall2012
Fall2013
Fall2014
Fall2015
SCIENCE 910 901 793 954 929 1,190 1,222 1,138
SOCIOLOGY 108 120 122 175 169 181 162 156 177 156
SOCIOLOGY MHC 1
SOPHIE DAVIS BIOMED 361 365 372 379 353 346 352 347 349 383
SOPHIE DAVIS PHYSICIAN'S ASST 80 84 89 97 103 95 97 93 103 101
SPEECH PATH 2 1 1 1
THEATRE 63 74 88 106 99 112 139 121 116 132
URBAN LEGAL STUDIES 1 1 1 1 1 1 3
Total 10,369 11,315 12,066 12,960 12,384 12,938 13,113 12,629 13,035 13,340

Click here for CUNY OIRA Ethnicity in City Facts 2014 Table 2
2Source: CUNY OIRA Institutional Research Data Base [IRDB]
1Includes non-degree and 'Permit' students from other CUNY colleges.
Table 16: Fall 2005-2014: Undergraduate Students Areas of Study by Division/School by Gender and Ethnicity 1-2
Division=ADMINISITRATIVE-Non-degree & Permit Students
Division/School, Gender & EthnicityFall Terms
09012014 09012015
ADMINISITRATIVE-Non-degree & Permit Students Men American Indian or Alaskan Native 2 1
Asian 83 65
Black or African American 82 93
Hispanic/Latino 176 191
Native Hawaiian or Other Pacific Islander 4
Nonresident alien 5 9
Two or more races 2 2
White 142 120
Women American Indian or Alaskan Native 1 7
Asian 51 62
Black or African American 114 115
Hispanic/Latino 276 263
Native Hawaiian or Other Pacific Islander 1 6
Nonresident alien 9 11
Two or more races 2 4
White 131 131
Total 1,081 1,080

Click here for CUNY OIRA Ethnicity in City Facts 2014 Table 2
2Source: CUNY OIRA Institutional Research Data Base [IRDB]
1Includes non-degree and 'Permit' students from other CUNY colleges.
Table 16: Fall 2005-2014: Undergraduate Students Areas of Study by Division/School by Gender and Ethnicity 1-2
Division=ARCHITECTURE
Division/School, Gender & EthnicityFall Terms
09012012 09012013 09012014 09012015
ARCHITECTURE Men Asian 39 49 42 46
Black or African American 21 21 20 34
Hispanic/Latino 52 46 45 51
Native Hawaiian or Other Pacific Islander 1 1 2 1
Nonresident alien 32 34 24 16
Two or more races 1 4
White 81 87 88 88
Women Asian 47 51 46 56
Black or African American 18 19 20 16
Hispanic/Latino 64 45 47 47
Native Hawaiian or Other Pacific Islander 3 3 4
Nonresident alien 31 29 24 27
Two or more races 1 2 3 4
White 77 74 75 72
Total 467 461 441 462

Click here for CUNY OIRA Ethnicity in City Facts 2014 Table 2
2Source: CUNY OIRA Institutional Research Data Base [IRDB]
1Includes non-degree and 'Permit' students from other CUNY colleges.
Table 16: Fall 2005-2014: Undergraduate Students Areas of Study by Division/School by Gender and Ethnicity 1-2
Division=CWE INTERDISCIPLINARY STUDIES
Division/School, Gender & EthnicityFall Terms
09012012 09012013 09012014 09012015
CWE INTERDISCIPLINARY STUDIES Men Asian 8 6 5 2
Black or African American 41 39 47 30
Hispanic/Latino 39 29 33 30
Nonresident alien 3 3 4 2
White 24 19 17 13
Women American Indian or Alaskan Native 1
Asian 25 33 22 15
Black or African American 177 161 155 93
Hispanic/Latino 231 213 207 125
Nonresident alien 11 14 16 10
Two or more races 5 4 4 4
White 66 67 45 37
Total 631 588 555 361

Click here for CUNY OIRA Ethnicity in City Facts 2014 Table 2
2Source: CUNY OIRA Institutional Research Data Base [IRDB]
1Includes non-degree and 'Permit' students from other CUNY colleges.
Table 16: Fall 2005-2014: Undergraduate Students Areas of Study by Division/School by Gender and Ethnicity 1-2
Division=EDUCATION
Division/School, Gender & EthnicityFall Terms
09012012 09012013 09012014 09012015
EDUCATION Men Asian 31 26 22 26
Black or African American 91 81 40 41
Hispanic/Latino 116 106 92 94
Nonresident alien 8 11 3 4
Two or more races 3 2 2 3
White 132 114 79 69
Women Asian 137 139 105 131
Black or African American 266 242 179 195
Hispanic/Latino 535 518 429 549
Native Hawaiian or Other Pacific Islander 2 2
Nonresident alien 49 45 33 37
Two or more races 4 3 6 8
White 374 292 198 183
Total 1,746 1,579 1,190 1,342

Click here for CUNY OIRA Ethnicity in City Facts 2014 Table 2
2Source: CUNY OIRA Institutional Research Data Base [IRDB]
1Includes non-degree and 'Permit' students from other CUNY colleges.
Table 16: Fall 2005-2014: Undergraduate Students Areas of Study by Division/School by Gender and Ethnicity 1-2
Division=ENGINEERING
Division/School, Gender & EthnicityFall Terms
09012012 09012013 09012014 09012015
ENGINEERING Men American Indian or Alaskan Native 1 4 2 1
Asian 685 731 762 910
Black or African American 264 278 222 245
Hispanic/Latino 409 400 427 444
Native Hawaiian or Other Pacific Islander 7 9 14 11
Nonresident alien 411 386 317 293
Two or more races 17 22 35 34
White 418 422 454 469
Women American Indian or Alaskan Native 1 1
Asian 160 168 172 230
Black or African American 56 62 49 66
Hispanic/Latino 97 107 126 142
Native Hawaiian or Other Pacific Islander 3 4 1 1
Nonresident alien 153 143 124 117
Two or more races 7 6 8 9
White 90 108 115 133
Total 2,779 2,850 2,828 3,106
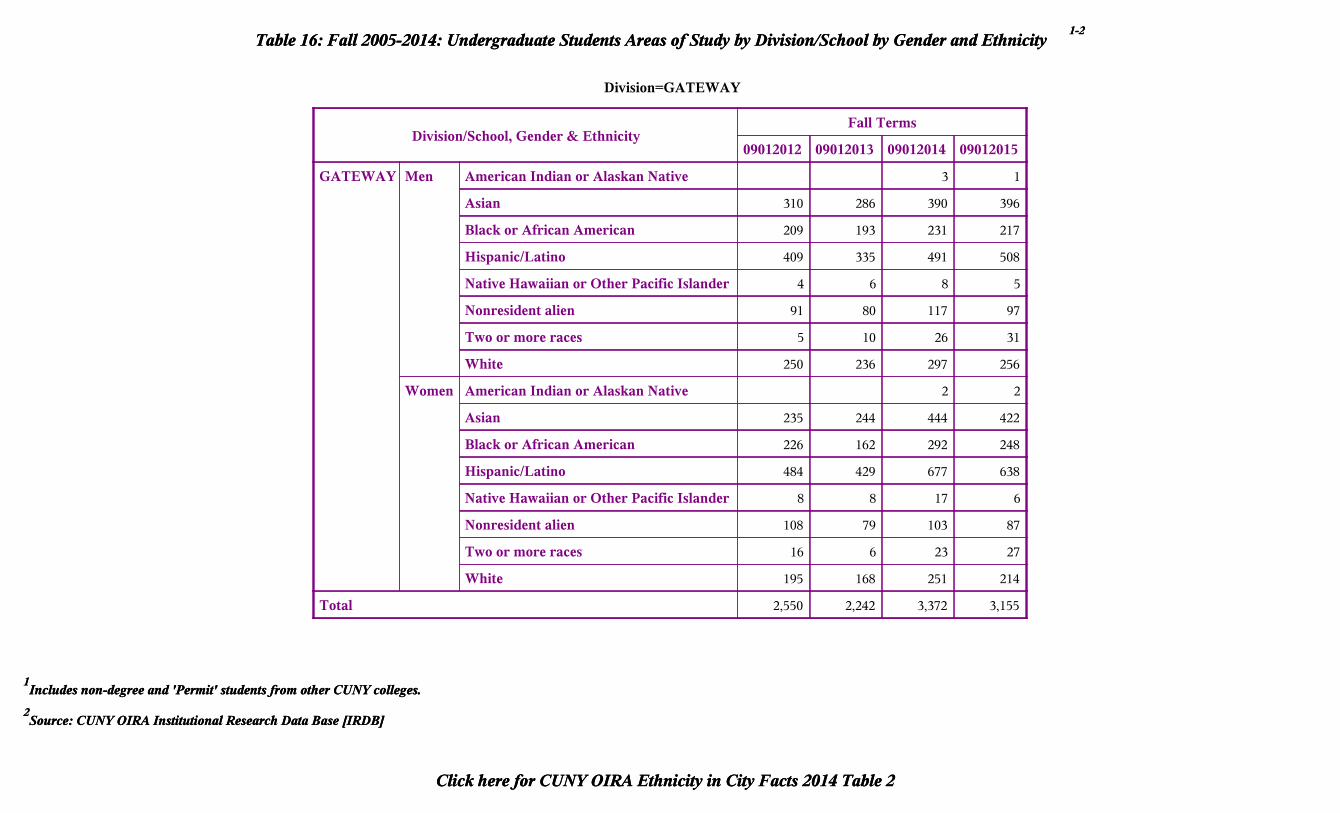
Click here for CUNY OIRA Ethnicity in City Facts 2014 Table 2
2Source: CUNY OIRA Institutional Research Data Base [IRDB]
1Includes non-degree and 'Permit' students from other CUNY colleges.
Table 16: Fall 2005-2014: Undergraduate Students Areas of Study by Division/School by Gender and Ethnicity 1-2
Division=GATEWAY
Division/School, Gender & EthnicityFall Terms
09012012 09012013 09012014 09012015
GATEWAY Men American Indian or Alaskan Native 3 1
Asian 310 286 390 396
Black or African American 209 193 231 217
Hispanic/Latino 409 335 491 508
Native Hawaiian or Other Pacific Islander 4 6 8 5
Nonresident alien 91 80 117 97
Two or more races 5 10 26 31
White 250 236 297 256
Women American Indian or Alaskan Native 2 2
Asian 235 244 444 422
Black or African American 226 162 292 248
Hispanic/Latino 484 429 677 638
Native Hawaiian or Other Pacific Islander 8 8 17 6
Nonresident alien 108 79 103 87
Two or more races 16 6 23 27
White 195 168 251 214
Total 2,550 2,242 3,372 3,155

Click here for CUNY OIRA Ethnicity in City Facts 2014 Table 2
2Source: CUNY OIRA Institutional Research Data Base [IRDB]
1Includes non-degree and 'Permit' students from other CUNY colleges.
Table 16: Fall 2005-2014: Undergraduate Students Areas of Study by Division/School by Gender and Ethnicity 1-2
Division=HIGH SCHOOL STUDENTS
Division/School, Gender & EthnicityFall Terms
09012012 09012013
HIGH SCHOOL STUDENTS Men Asian 28 53
Black or African American 28 20
Hispanic/Latino 133 113
White 42 32
Women Asian 32 31
Black or African American 68 35
Hispanic/Latino 241 202
White 23 12
Total 595 498
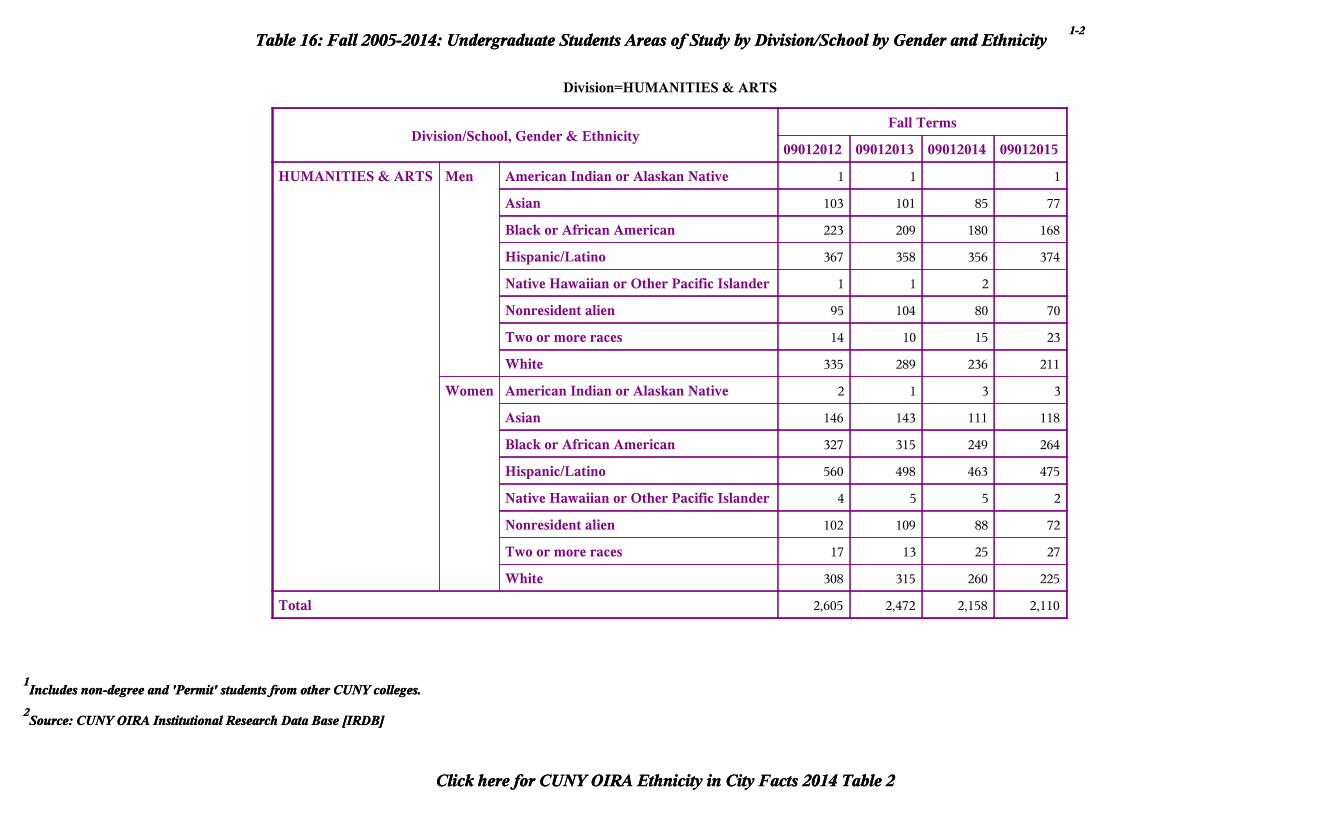
Click here for CUNY OIRA Ethnicity in City Facts 2014 Table 2
2Source: CUNY OIRA Institutional Research Data Base [IRDB]
1Includes non-degree and 'Permit' students from other CUNY colleges.
Table 16: Fall 2005-2014: Undergraduate Students Areas of Study by Division/School by Gender and Ethnicity 1-2
Division=HUMANITIES & ARTS
Division/School, Gender & EthnicityFall Terms
09012012 09012013 09012014 09012015
HUMANITIES & ARTS Men American Indian or Alaskan Native 1 1 1
Asian 103 101 85 77
Black or African American 223 209 180 168
Hispanic/Latino 367 358 356 374
Native Hawaiian or Other Pacific Islander 1 1 2
Nonresident alien 95 104 80 70
Two or more races 14 10 15 23
White 335 289 236 211
Women American Indian or Alaskan Native 2 1 3 3
Asian 146 143 111 118
Black or African American 327 315 249 264
Hispanic/Latino 560 498 463 475
Native Hawaiian or Other Pacific Islander 4 5 5 2
Nonresident alien 102 109 88 72
Two or more races 17 13 25 27
White 308 315 260 225
Total 2,605 2,472 2,158 2,110

Click here for CUNY OIRA Ethnicity in City Facts 2014 Table 2
1Sources: CUNY OIRA IRDB Graduate Files.
Table 17: 2005-2007 through 2014-2015: Undergraduate Degrees Awarded by Division/School 1
Click here for CUNY OIRA Ethnicity in City Facts 2014 Table 2
1Sources: CUNY OIRA IRDB Graduate Files.
Table 17: 2005-2007 through 2014-2015: Undergraduate Degrees Awarded by Division/School 1
Division=ARCHITECTURE
Division or School 2005-2006 2006-2007 2007-2008 2008-2009 2009-2010 2010-2011 2011-2012 2012-2013 2013-2014 2014-2015
ARCHITECTURE Asian or Pacific Islander 15 14 8 5 12 3 18 10 10 11
Black, Non-Hispanic 5 9 7 8 8 5 7 5 4 2
Hispanic 14 15 13 19 14 14 11 22 16 16
Nonresident Alien 9 10 11 5 14 9 8 8 8 5
White, Non-Hispanic 29 24 19 14 13 9 27 14 19 7
Total 72 72 58 51 61 40 71 59 57 41
Division=CWE INTERDISCIPLINARY STUDIES
Division or School 2005-2006 2006-2007 2007-2008 2008-2009 2009-2010 2010-2011 2011-2012 2012-2013 2013-2014 2014-2015
CWE INTERDISCIPLINARY STUDIES American Indian or Native A 1 1 1
Asian or Pacific Islander 6 4 8 6 5 7 11 8 5 6
Black, Non-Hispanic 77 79 79 76 64 86 62 52 45 61
Hispanic 53 36 53 54 55 58 67 69 51 45
Nonresident Alien 3 4 2 1 2 1 2 3 1 5
White, Non-Hispanic 27 30 27 26 18 31 25 17 18 20
Total 166 153 170 163 144 183 168 150 120 137

Click here for CUNY OIRA Ethnicity in City Facts 2014 Table 2
1Sources: CUNY OIRA IRDB Graduate Files.
Table 17: 2005-2007 through 2014-2015: Undergraduate Degrees Awarded by Division/School 1
Division=EDUCATION
Division or School 2005-2006 2006-2007 2007-2008 2008-2009 2009-2010 2010-2011 2011-2012 2012-2013 2013-2014 2014-2015
EDUCATION Asian or Pacific Islander 1 5 1 1 3 4 2 13 14 13
Black, Non-Hispanic 16 9 8 2 6 13 16 12 26 11
Hispanic 16 24 20 16 18 36 36 37 45 42
Nonresident Alien 5 1 1 3 3 3 6 2 6 3
White, Non-Hispanic 3 2 4 6 9 7 9 13 19 10
Total 41 41 34 28 39 63 69 77 110 79
Division=ENGINEERING
Division or School 2005-2006 2006-2007 2007-2008 2008-2009 2009-2010 2010-2011 2011-2012 2012-2013 2013-2014 2014-2015
ENGINEERING American Indian or Native A 1 1 1 1
Asian or Pacific Islander 44 58 66 58 79 71 69 89 82 106
Black, Non-Hispanic 28 43 44 39 37 43 38 33 42 36
Hispanic 23 28 55 47 54 43 44 54 49 50
Nonresident Alien 33 53 67 58 63 45 52 56 46 44
White, Non-Hispanic 22 40 49 43 54 58 44 63 62 48
Total 151 222 281 246 287 261 247 296 281 284

Click here for CUNY OIRA Ethnicity in City Facts 2014 Table 2
1Sources: CUNY OIRA IRDB Graduate Files.
Table 17: 2005-2007 through 2014-2015: Undergraduate Degrees Awarded by Division/School 1
Division=HUMANITIES & ARTS
Division or School 2005-2006 2006-2007 2007-2008 2008-2009 2009-2010 2010-2011 2011-2012 2012-2013 2013-2014 2014-2015
HUMANITIES & ARTS American Indian or Native A 1 1 2 1 1
Asian or Pacific Islander 19 15 33 30 47 42 45 55 65 49
Black, Non-Hispanic 96 84 91 81 90 138 141 140 148 139
Hispanic 79 110 98 114 139 157 176 187 161 175
Nonresident Alien 31 37 58 42 46 59 46 40 27 39
White, Non-Hispanic 50 65 89 85 112 144 139 145 126 125
Total 275 311 370 353 434 540 547 569 528 528
Division=POWELL SCHOOL
Division or School 2005-2006 2006-2007 2007-2008 2008-2009 2009-2010 2010-2011 2011-2012 2012-2013 2013-2014 2014-2015
POWELL SCHOOL American Indian or Native A 2 1 4 1 1
Asian or Pacific Islander 19 32 45 43 78 81 79 78 133 145
Black, Non-Hispanic 89 95 118 127 113 172 179 174 153 206
Hispanic 101 119 92 103 151 201 228 198 233 256
Nonresident Alien 18 23 34 44 44 42 41 43 37 38
White, Non-Hispanic 41 37 50 63 68 85 89 94 135 110
Total 268 306 339 382 454 582 620 587 692 756

Click here for CUNY OIRA Ethnicity in City Facts 2014 Table 2
1Sources: CUNY OIRA IRDB Graduate Files.
Click here for CUNY OIRA Ethnicity in City Facts 2014 Table 2
1Sources: CUNY OIRA IRDB Graduate Files.
Table 17: 2005-2007 through 2014-2015: Undergraduate Degrees Awarded by Division/School 1
Division=SCIENCES
Division or School 2005-2006 2006-2007 2007-2008 2008-2009 2009-2010 2010-2011 2011-2012 2012-2013 2013-2014 2014-2015
SCIENCES American Indian or Native A 1 2 1
Asian or Pacific Islander 12 15 23 29 40 42 41 57 90 93
Black, Non-Hispanic 23 29 31 38 33 44 45 38 46 44
Hispanic 12 13 26 13 20 21 27 50 44 39
Nonresident Alien 2 12 27 13 13 19 19 23 20 26
White, Non-Hispanic 6 19 19 23 28 28 29 43 45 50
Total 55 88 126 117 134 154 161 211 247 253
Division=SOPHIE DAVIS/BIOMED
Division or School 2005-2006 2006-2007 2007-2008 2008-2009 2009-2010 2010-2011 2011-2012 2012-2013 2013-2014 2014-2015
SOPHIE DAVIS/BIOMED American Indian or Native A 1
Asian or Pacific Islander 17 30 28 17 28 26 22 18 20 17
Black, Non-Hispanic 29 19 29 21 19 31 26 22 23 30
Hispanic 10 9 4 11 17 11 14 13 17 10
Nonresident Alien 1 1 1 1 1 1
White, Non-Hispanic 11 27 23 23 20 26 28 24 20 21
Total 68 85 85 73 85 95 91 77 81 78

1Source: CUNY OIRA Institutional Research Data Base [IRDB]
1Source: CUNY OIRA Institutional Research Data Base [IRDB]
Table 18: Fall 2006-2015 Freshmen High Schools of Origin 1
High Schools
Fall Terms
Fall2006
Fall2007
Fall2008
Fall2009
Fall2010
Fall2011
Fall2012
Fall2013
Fall2014
Fall2015
A E SMITH 6 4 10 10 10 9 7 9 9 8
A E STVNSN 28 26 24 23 18 13 13 16 13 12
A HAMILTON 4 5 5 6 7 5 5 4 4 2
A HENNINGE 2 2 2 3 2 1
A JACKSON 3 2 2 2 3 1 2 1 2 2
A LINCOLN 18 13 20 22 23 36 39 45 42 37
A MARTIN 15 12 9 8 7 9 11 13 8 6
A PH RAND 94 101 98 108 94 87 81 72 69 67
AC LDY G C 2 2 5 6 7 5 5 4 2 2
AC MT ST U 10 18 20 20 16 13 15 15 20 23
AC RESRCTN 1 1
AC ST JSPH 1 1 1
ADAMS SCH 1 1 1
ADEPHI AC 1
ALB MAGNUS 1 2 2 2 1 2 2 1
ALBANY ACA 1 1
ALBANY HS 1 1 3 5 5 3 2 1 2 1
ALBION 1
ALFRED ALM 1
ALL HALLOW 5 8 7 11 13 14 16 18 22 12
ALL SAINTS 1 6 6 5 7 19 18 14 12 12
ALLEGANY C 1 1 2 1 1 1
ALLENDALE 1 1
AMHRST CNT 1
AMITYV MEM 3 4 3 3 3 4 6 7 4 3
AQUINAS HS 33 35 34 35 38 52 43 38 43 46
AQUINAS IN 1 1 1 1
AR STEPINC 5 6 6 5 4 3 3 2 1
ARC MOLLOY 21 24 33 41 41 42 47 57 59 62
ARCHBISHOP 1 1 1 1 1 1 1 1
ARDSLEY HS 1 1 2 4 4 4 3 4 3 3
ARLINGTON 1 3 5 3 3 6 3 3 6 5
ART MONROE 1 2 2 3 3 1 1 1
AUTOMOTIVE 1 4 4 4 5 4 2 2
AUX H S 1 1 2 2
AVIATION 35 56 69 85 105 129 147 142 130 117
B ACADEMY 6 9 15 14 11 11 5 2 6 12
B CARDOZO 64 71 80 106 98 115 129 107 104 98
B FRANKLIN 1
B HILLS-BA 1
(Continued)

1Source: CUNY OIRA Institutional Research Data Base [IRDB]
Table 18: Fall 2006-2015 Freshmen High Schools of Origin 1
High Schools
Fall Terms
Fall2006
Fall2007
Fall2008
Fall2009
Fall2010
Fall2011
Fall2012
Fall2013
Fall2014
Fall2015
B REGIONAL 4 3 3 4 5 5 5 4 4 5
B SCRMT NR 6 7 7 5 6 6 3 2 1 1
BABYLON HS 1 1 1 1 1
BAIS YAK B 1
BALDWIN HS 4 6 9 10 6 10 11 14 13 17
BALLSTON S 1 1 1 1
BANNEKER 2 1 1 2 2 3 5 6 3 3
BAS TORAH 1
BAY RDG EV 1
BAY RDGE 1 2 1
BAY SHORE 1 2 3 2 3 8 12 12 13 12
BAYSIDE HS 50 70 97 128 142 144 121 98 74 61
BCH CHNNL 7 10 17 16 17 16 17 11 9 8
BEACON 36 38 41 46 39 38 38 35 35 34
BEACON HS 3 4 3 2 3 3 2 2 3 2
BELLPRT SR 1 3 2 2 2 2 2 1
BENJAMIN F 1
BERNE KNOX 1 1 1 1 1
BETH JACOB 1 1 1
BETHLEHEM 1 1 1 1
BETHPAGE 1 1 1 1 1
BISHOP FAL 1 1
BISHOP GIB 1 1 1 1
BISHOP KEA 1 2 1 2 1 1
BISHOP LUD 1 1
BKLYN AC 1 1 1 1 1 1
BKLYN CN 2 2 2 1 1 3 1 2 1
BKLYN FRND 2 3 2 1 1 2 3 2 2 1
BKLYN TECH 211 208 229 233 238 245 244 253 249 244
BKLYN-DR 1
BOYS HS 20 22 20 19 16 13 8 8 9 5
BRANDEIS 3 3 5 5 1 2 2 2 2 2
BRCH WATHN 1 1 1
BREARLEY S 1 1 1 1 2
BRENTWOOD 6 9 11 13 10 11 7 7 5 4
BREWSTER 1 2 3 3 3 4 5 5
BRIARCLIFF 2 3 2 1 1 3 3
BRIGHTON 1 1 1
BRKLY INST 1 1 1 1
BRNRD BOYS 1 1 1 3 2 2 1 3 2 2
(Continued)

1Source: CUNY OIRA Institutional Research Data Base [IRDB]
Table 18: Fall 2006-2015 Freshmen High Schools of Origin 1
High Schools
Fall Terms
Fall2006
Fall2007
Fall2008
Fall2009
Fall2010
Fall2011
Fall2012
Fall2013
Fall2014
Fall2015
BROCKPORT 1 1 1 1
BRONX CN 1
BRONX HS S 90 97 90 91 80 88 99 102 101 119
BROWNING 1 1 1 1 2 1 1 2 1
BS YAAKOV 1 1
BSH FORD 10 12 14 16 17 15 18 15 11 6
BSH KEARNY 2 2 3 2 3 2 5 4 4 7
BSH LGHLIN 9 9 14 12 12 11 13 14 14 11
BSHWCK HS 17 12 14 9 7 4 2 3 2 2
BTH JCB S 1 1 1
BUFFALO TR 1
BUSHWICK 10 8 7 10 7 11 10 15 10 11
BYRAM HILL 2 1 1 2 1 2
C BARTON 35 45 54 56 49 49 51 35 33 26
C CLMBS HS 51 45 43 41 41 44 36 29 22 19
C E GORTON 4 7 13 16 16 18 13 11 14 14
C E HUGHES 1 1 2
C MCAULEY 4 5 3 2 2 1 2 2 1
C ROBIN 1 1
C-P P EAST 1 1 1
CAIRO CNTL 1 1
CALASANCTI 1 1
CALHOUN 1 1 2 2 3 1 1 1
CANARSIE 21 17 20 23 22 16 13 14 11 9
CANISIUS H 1 1 1 1 1 1 2
CARD HAYES 23 28 30 35 26 23 17 15 16 21
CARD SPLMN 32 36 40 39 39 40 42 41 43 41
CARLE PL 2 4 5 6 5 3 1
CARMEL CTL 1 1 1 1 2
CASCADILLA 1
CATHDRL HS 28 29 29 40 29 32 37 32 33 26
CATHOLIC C 1
CATTARAUGU 1
CAYUGA C 1 1 1 1
CENTER MOR 1 2 3 2
CENTEREACH 1 1 3 7 7 5 5 4
CENTRAL HI 2 1 1 1 1
CENTRAL PE 2 2 1 4 4 2 7 9 10 15
CENTRAL SC 3 1 2 4 3 2 5 5 3 2
CHAMINADE 4 5 5 6 9 9 7 8 9 9
(Continued)

1Source: CUNY OIRA Institutional Research Data Base [IRDB]
Table 18: Fall 2006-2015 Freshmen High Schools of Origin 1
High Schools
Fall Terms
Fall2006
Fall2007
Fall2008
Fall2009
Fall2010
Fall2011
Fall2012
Fall2013
Fall2014
Fall2015
CHANGE 10 14 16 13 15 10 8 7 8 8
CHAPIN SCH 1 2 1 1
CHARLES W 1 1 2 2 2 1
CHATHAM 1 1 1 1 2 1
CHELSEA VC 16 20 17 14 13 14 10 16 18 17
CHENANGO V 1 1 1 1
CHESTER HI 1 1 1 1 1 1
CHOIR 3 4 3 3 3 4 5 3 4 2
CHRISTIAN 1
CHRST KG B 18 15 21 24 23 20 18 27 24 21
CHRST KG G 1 1 1 3 1 1
CITY SCHL 13 13 12 15 17 18 21 22 13 14
CLEVELAND 1 1
CLINTON SR 1 2 1 1 1
CLOSED 2 1 1 2 3 1 1 1 2 3
CLRKSTWN N 4 3 6 8 9 10 8 7 2 4
CLRKSTWN S 6 6 4 4 2 4 4 6 6 7
CLYDE-SAVA 1 1
CMMCK HS N 1 1 2 1 2 1 2 3 2 2
CNTRL ISLP 3 2 2 6 9 8 6 7
COBLESKILL 1
COLLEGIATE 1 1 1 1 1
COLUM GRAM 1 1 1 1 2 2 3
COLUMBIA H 2 1 1
COMSEWOGUE 1 1 1 1 1 1 1
CONCORD 1 1 1
CONCORD HS 1 1
CONNETQUOT 1 5 5 1 6 4 3 4
COPIAGUE 2 3 3 2 3 3 1 1 1
COR-PAINTE 1
CORNWALL C 1 1 1 1 1
CROTN HRMN 1 1 1 2 3 3
CSD FUTURE 4 8 9 11 9 9 10 11 11 14
CTH PR SEM 1 2 2 2 1 1 2 1 1
CURTIS 17 23 22 24 26 26 25 36 28 33
D CLINTON 133 146 151 187 147 132 114 115 110 101
DALTON SCH 1 1 3 4 3 4 2 2 1
DANSVILLE 1
DARROW 1 1 1 1
DAY SCHOOL 2 3 3 4 2 2 2 1 1
(Continued)

1Source: CUNY OIRA Institutional Research Data Base [IRDB]
Table 18: Fall 2006-2015 Freshmen High Schools of Origin 1
High Schools
Fall Terms
Fall2006
Fall2007
Fall2008
Fall2009
Fall2010
Fall2011
Fall2012
Fall2013
Fall2014
Fall2015
DEER PARK 1 1 2 5 4 3 2
DEL ACAD & 1 1 1 2 1 1
DIVINE WOR 1
DIVISN AV 1 1 2 2 2 2
DMNCNCOMM 1 1 1 1
DOBBS FRRY 1 1 2 6 5 3 4 5 4 3
DOMINCN AC 2 2 2 3 4 3 7 6 5 5
DOUGLASS 26 22 25 29 34 44 47 48 54 68
DOVER JR-S 1
DUNKIRK HI 1
DWIGHT SCH 1 1 1 1
E CHILDS 30 46 39 35 31 19 11 13 8 5
E DISTRICT 5 5 3 2 2 1 1 3 1 1
E HAMPTON 1 5 5 4 5 3 4 2
E ISLIP 2 1 2 2 3 1 1
E MEADOW 2 1 2 4 5 5 5 4 3 2
E R MURROW 68 71 86 100 124 140 125 105 85 87
E ROCKAWAY 1 2 2 2 2 5 5 2
E VANDRMLN 2 2
EAST HIGH 1
EAST NY 1 3 1 1 2 1 1 1
EASTPORT 1 1 2 1 1 2 3 4
ECONOMICS 11 10 10 13 15 19 30 24 27 21
EDGEMONT 1 1 2 3 4 4 6
EDISON TEC 1
EDUCATIONA 3 4 4 5 3 1 3 5 5 6
EL PUENTE 1 1 1 3 5 5 5 3 2 1
ELDRED CNT 1 1 1 2 1 1 2 1
ELIS IRWIN 2 1 1 1 1 1 1
ELLENVILLE 1
ELLICOTTVL 1 1 1 1 1
ELMONT MEM 15 22 33 40 38 34 39 35 33 36
EMMA WILLA 1
ENY TRANS 4 11 13 17 14 18 18 18 16 15
ERASMUS 8 3 6 4 4 3 2 2 5 4
ERASMUS EV 1 1 1 1 1 1
ESTCHESTER 1 3 1 2 4 5 9 6
EVEN H S F 1
EZRA ACAD 1 1 1 2 2 2
F D R 66 81 93 107 108 96 97 100 70 73
(Continued)

1Source: CUNY OIRA Institutional Research Data Base [IRDB]
Table 18: Fall 2006-2015 Freshmen High Schools of Origin 1
High Schools
Fall Terms
Fall2006
Fall2007
Fall2008
Fall2009
Fall2010
Fall2011
Fall2012
Fall2013
Fall2014
Fall2015
F D ROOSEV 1 1 3 3 2 1 1
F K LANE 28 33 37 41 33 29 23 17 14 8
F LEWIS 83 93 109 141 167 174 166 164 128 129
FAIRPORT 1 1
FALLSBURGH 1 2 2 2 1
FAR ROCK 9 6 7 9 6 8 7 5 4 2
FARMINGDAL 1 1 2 3 3 4 5 7 5 8
FAYETTEVIL 2 2 2
FEM SAC HT 1
FIELDSTON 4 5 6 7 4 2 1 2 2
FL MUS ART 81 91 85 105 104 112 121 114 103 98
FLAGS 5 7 8 5 4 6 4 3 5 5
FLORAL PK 3 7 9 12 11 13 9 9 8 10
FLUSHING 35 38 52 45 36 39 50 43 41 35
FONDA FULT 1 1
FONTBONNE 1 1 2 2 2 4 2 3 4
FORDHAM PR 5 5 9 9 9 11 5 8 4 3
FOREIGN 205 230 246 279 277 229 219 163 151 126
FOREST HL 55 67 87 90 87 98 113 112 131 121
FOX LANE 2 3 2 6 8 10 8 7 5 1
FRANKFORT 1 1
FREEPORT 6 9 7 9 9 12 8 6 5 4
FRIENDS AC 1
FRIENDS SE 2 1 2 2 1 1 1
FT HAMLTN 79 90 109 137 137 155 153 147 142 130
G CLEVELND 46 47 57 50 46 62 65 63 58 47
G DODGE 14 16 13 12 14 14 9 7 15 11
G HEWLETT 1 1 2 5 5 4 6 7 6 7
G RAY BODL 1 1 1
G WASH EVE 1 1 1 1 1
G WASHNGTN 17 18 18 14 15 21 18 14 11 8
G WINGATE 16 13 10 10 8 10 8 5 5 3
G WSTGHSE 4 4 4 2 3 3 5 3 7 5
GARDEN SCH 1 1 1 2 2 1 2 2 1
GARDN CITY 1 2 1 1
GATES-CHIL 1 1 1 2
GED 214 229 230 239 231 273 297 287 280 273
GED NO DIP 1 1 1 1
GLEN COVE 2 2 4 3 3 2 4 3 2 2
GLENS FALL 1
(Continued)

1Source: CUNY OIRA Institutional Research Data Base [IRDB]
Table 18: Fall 2006-2015 Freshmen High Schools of Origin 1
High Schools
Fall Terms
Fall2006
Fall2007
Fall2008
Fall2009
Fall2010
Fall2011
Fall2012
Fall2013
Fall2014
Fall2015
GN MCARTHR 2 2 1 2 2 3 4 6 5
GOSHEN CTL 1 1 2 2 3 4 2 2
GOUVERNEUR 1 1
GR NECK N 1 2 2 3 3 4 4 3 7
GR NECK S 2 4 4 6 8 7 6 6 7 5
GRAHAM SCH 1
GRAPHIC 14 24 25 24 24 22 17 17 17 16
GREECE ARC 1
GREENVILLE 1
GROVER CLE 1 1 1 1 1 1 1
GRTR NY AC 4 6 5 5 4 7 4 6 9 4
GUIDERLAND 3 3 2 1
H F CAREY 1 2 4 4 4 3 3 4 4 5
H GREELEY 2 2 3 4 4 5 3 4
H HUDSON 2 3 3 4 8 2 3 8
H LEHMAN 66 65 74 70 69 85 95 90 89 87
H MANN 4 5 4 6 5 6 5 5 1
H S TRUMAN 33 37 49 52 47 41 37 33 36 23
HAFTR HS 1 1 2 2 1 3 3 4 2 3
HAGOLAH 1 1 2 1 1 1 1 2
HALDANE CE 1 2 3
HAMPTN BAY 1 1 1 1 3 2
HARBORFLDS 1 2 4 2 1 1 2
HARLEM PR 1
HARMONY 1 1 1
HARRISON 1 3 4 4 3 2 2 2 2 2
HAUPPAUGE 1 1 1 2 4 4 2 2
HEB AC WES 1 2 2 1 1 1 1
HEBR AC N 61 76 67 74 77 87 88 85 87 82
HEBREW AC 1 1 1
HEBREW HS 2 1 1
HEMPSTEAD 3 4 9 6 6 4 6 4 3 6
HERRICK SR 6 7 8 7 9 8 12 16 14 17
HEWLETT 1 1 1 1 1
HICKSVILLE 3 2 2 6 5 3 4 10 5 9
HILLCREST 64 70 82 98 92 104 86 85 76 66
HILTON CEN 1
HLF HLLW H 3 3 5 4 5 7 11 8 7 10
HLY CR ACA 28 22 20 23 17 20 19 17 24 21
HLY CROSS 4 6 9 12 8 9 12 9 12 9
(Continued)

1Source: CUNY OIRA Institutional Research Data Base [IRDB]
Table 18: Fall 2006-2015 Freshmen High Schools of Origin 1
High Schools
Fall Terms
Fall2006
Fall2007
Fall2008
Fall2009
Fall2010
Fall2011
Fall2012
Fall2013
Fall2014
Fall2015
HLY TRINTY 5 4 6 6 7 5 8 11 8 5
HNTNGTN HS 3 2 3 3 2 2 1 2 2
HNTR TAN C 1 1 1 3 2
HOLLAND PA 1 1 1
HOMER CENT 1 1
HONEOYE FL 1 1
HS ART DES 39 38 40 47 41 40 37 35 33 37
HS FASH IN 76 57 61 70 60 62 55 56 56 45
HS REDIREC 2 1 1 1 1
HS TELE 29 36 29 25 24 35 46 46 50 53
HSTNGS HUD 2 1 1 1 2 1 4 2 2 3
HUDSON HS 1 2 1
HUMANITIES 79 68 66 73 71 63 59 33 29 23
HUNTER CLG 7 10 9 12 13 12 14 16 13 15
HUTCHINSON 1 1
ICHABOB CR 1 1 1 1
INTERNATNL 38 38 29 30 29 29 31 28 22 19
IONA PREP 2 4 6 7 5 4 4 2 2 1
IRONDEQUOI 1 1
IRVINGTON 2 1 2 2 2 1 1 2 2
ISLIP HS 1 1 1 2 4 3 4 4
ISLND TREE 1 1 4
J ADAMS 47 63 59 67 65 68 48 50 48 52
J ADDAMS V 15 17 22 16 22 27 29 21 19 20
J BOWNE HS 71 85 96 95 97 106 103 107 101 107
J BRAVRMN 1 5 12 12 12 14 14 13 13
J DEWEY HS 60 56 57 69 64 64 67 58 47 44
J H GLENN 1 1 1 1 2 1 1 1 2
J JAY HPWL 1 2 2 3 3 6 5 4 5 3
J JAY HS 14 10 6 13 8 7 5 5 5 3
J JAY KAT 1 1 1 1 2 3
J MADISON 40 55 63 60 77 74 61 58 54 56
J MONROE 2 1 1 4 1 2 2 1
J RICHMAN 9 7 5 5 4 1 2
J S BURKE 1 1 1 1
J W YOUNG 1 1 1 1 1 3
J WILSON 2 2 2
JAMAICA 23 30 35 38 35 39 35 34 24 18
JAMAICA E 1 1
JAMAICA VC 1 1 1 1 1 1
(Continued)

1Source: CUNY OIRA Institutional Research Data Base [IRDB]
Table 18: Fall 2006-2015 Freshmen High Schools of Origin 1
High Schools
Fall Terms
Fall2006
Fall2007
Fall2008
Fall2009
Fall2010
Fall2011
Fall2012
Fall2013
Fall2014
Fall2015
JAMESVILLE 1
JEFF YOUNG 1
JERICHO HS 1 3 1 2 3 2 2 3 4 4
JF KNNDY B 4 5 3 1 2 1 2 3 3
JF KNNDY P 3 3 2 1 2 2 3 3 1 1
JFK BRONX 90 89 88 85 67 63 54 40 36 28
JOHN C BIR 1 1 1
JOHN F KEN 4 4 4 4 2 1 2 2 3 1
KAM MESVTA 1 1 1 1 1 1
KARAFIN ED 1 1 1 1 1 1
KBORO DR 4 2 3 5 6 2 2 1
KENMORE EA 1 1 3 2 1 1 1
KENMORE WE 1 1
KENNEDY SM 1
KENSINGTON 1 1 1 1
KEW FOREST 2 1
KINGS PARK 1 1 2 3 3 3 1 1 1
KINGSBORO 12 15 18 19 21 21 25 28 27 32
KINGSTON 2 4 5 6 4 3 2 2 2
L BRANDEIS 31 41 50 53 50 47 45 42 30 31
L I C 99 107 125 138 129 111 105 86 90 89
L I LUTHRN 1 1 2 1 1 1 3
LAFAYETTE 37 40 41 36 27 22 20 11 8 2
LAG MIDL 3 7 7 7 7 5 5 6 10 12
LAKE GEORG 1
LAKE PLACI 1
LAKELAND 1 4 3 1 4 5 8 9
LANCASTER 1 1
LANDMARK 4 6 5 4 5 4 2 4 3 4
LANSING CE 1 1 1 1 1
LANSINGBUR 1 1
LASALLE AC 8 13 13 18 13 10 6 9 7 7
LATES 3 6 12 12 10
LAVELLE BL 1
LAWRENCE 2 2 2 2 4 6 7 5 6 6
LEADERSHIP 10 9 14 15 22 18 19 23 22 16
LEGACY 4 4 6 8 9 6 5 6 7 4
LEVITTOWN 1 1 1 1
LIBERTY C 1 2 1 1 1 1 1
LINCOLN AC 19 14 16 23 25 23 26 18 15 9
(Continued)
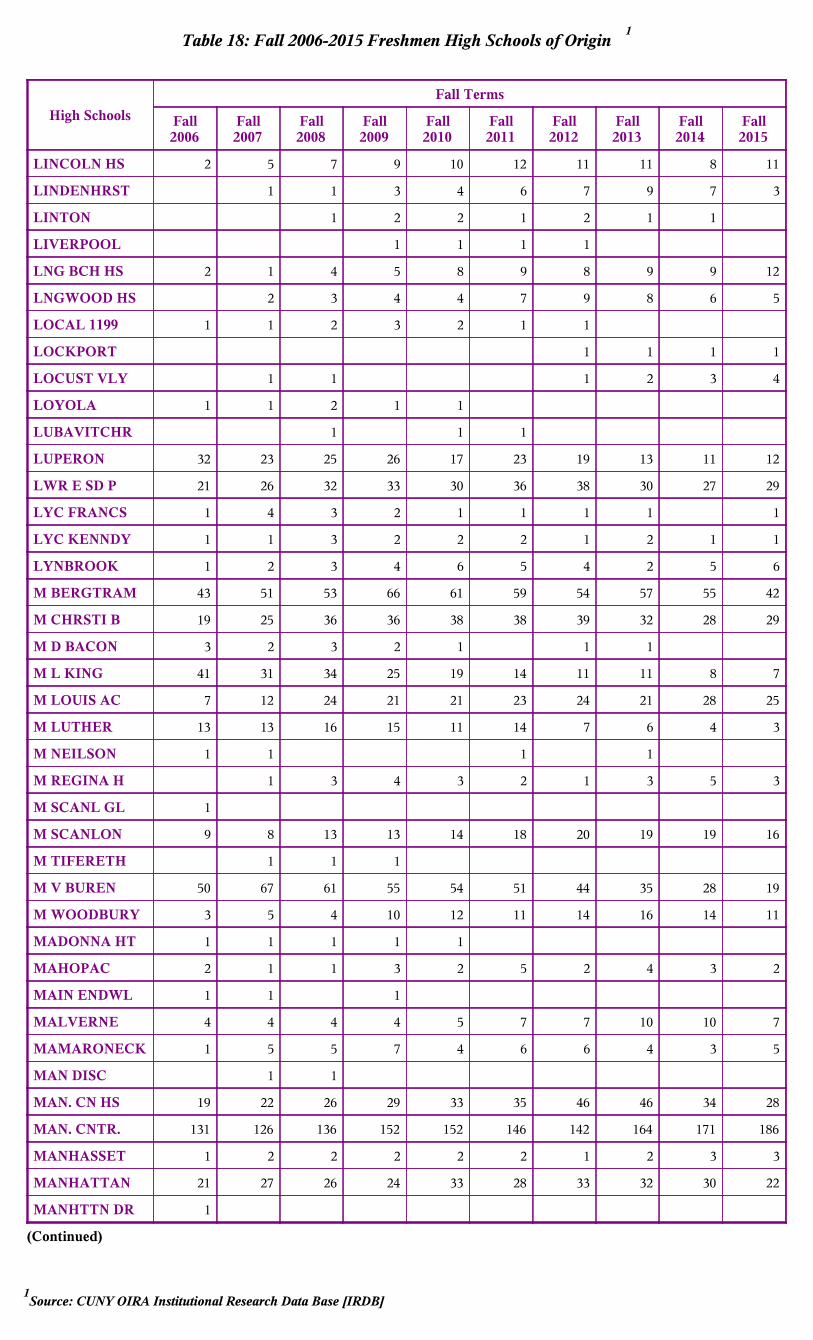
1Source: CUNY OIRA Institutional Research Data Base [IRDB]
Table 18: Fall 2006-2015 Freshmen High Schools of Origin 1
High Schools
Fall Terms
Fall2006
Fall2007
Fall2008
Fall2009
Fall2010
Fall2011
Fall2012
Fall2013
Fall2014
Fall2015
LINCOLN HS 2 5 7 9 10 12 11 11 8 11
LINDENHRST 1 1 3 4 6 7 9 7 3
LINTON 1 2 2 1 2 1 1
LIVERPOOL 1 1 1 1
LNG BCH HS 2 1 4 5 8 9 8 9 9 12
LNGWOOD HS 2 3 4 4 7 9 8 6 5
LOCAL 1199 1 1 2 3 2 1 1
LOCKPORT 1 1 1 1
LOCUST VLY 1 1 1 2 3 4
LOYOLA 1 1 2 1 1
LUBAVITCHR 1 1 1
LUPERON 32 23 25 26 17 23 19 13 11 12
LWR E SD P 21 26 32 33 30 36 38 30 27 29
LYC FRANCS 1 4 3 2 1 1 1 1 1
LYC KENNDY 1 1 3 2 2 2 1 2 1 1
LYNBROOK 1 2 3 4 6 5 4 2 5 6
M BERGTRAM 43 51 53 66 61 59 54 57 55 42
M CHRSTI B 19 25 36 36 38 38 39 32 28 29
M D BACON 3 2 3 2 1 1 1
M L KING 41 31 34 25 19 14 11 11 8 7
M LOUIS AC 7 12 24 21 21 23 24 21 28 25
M LUTHER 13 13 16 15 11 14 7 6 4 3
M NEILSON 1 1 1 1
M REGINA H 1 3 4 3 2 1 3 5 3
M SCANL GL 1
M SCANLON 9 8 13 13 14 18 20 19 19 16
M TIFERETH 1 1 1
M V BUREN 50 67 61 55 54 51 44 35 28 19
M WOODBURY 3 5 4 10 12 11 14 16 14 11
MADONNA HT 1 1 1 1 1
MAHOPAC 2 1 1 3 2 5 2 4 3 2
MAIN ENDWL 1 1 1
MALVERNE 4 4 4 4 5 7 7 10 10 7
MAMARONECK 1 5 5 7 4 6 6 4 3 5
MAN DISC 1 1
MAN. CN HS 19 22 26 29 33 35 46 46 34 28
MAN. CNTR. 131 126 136 152 152 146 142 164 171 186
MANHASSET 1 2 2 2 2 2 1 2 3 3
MANHATTAN 21 27 26 24 33 28 33 32 30 22
MANHTTN DR 1
(Continued)
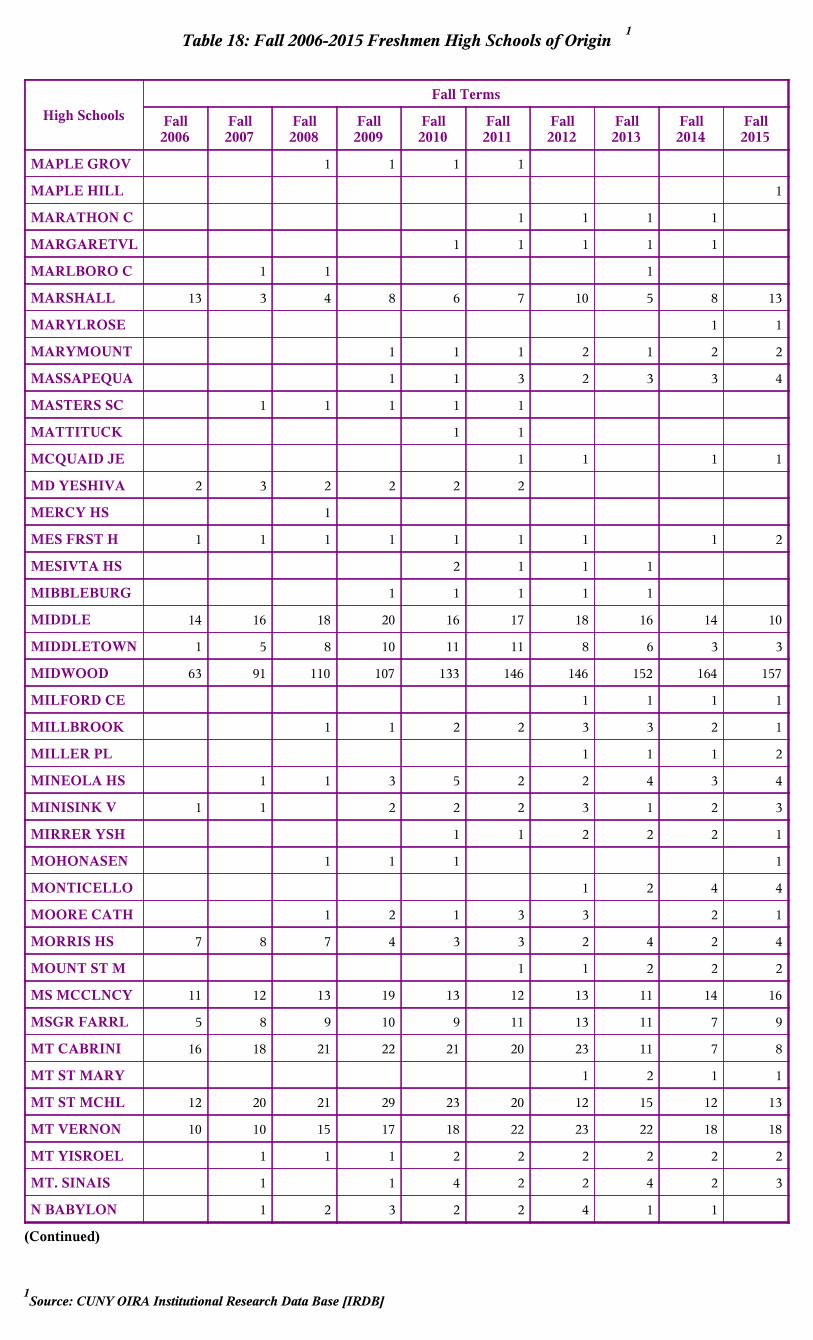
1Source: CUNY OIRA Institutional Research Data Base [IRDB]
Table 18: Fall 2006-2015 Freshmen High Schools of Origin 1
High Schools
Fall Terms
Fall2006
Fall2007
Fall2008
Fall2009
Fall2010
Fall2011
Fall2012
Fall2013
Fall2014
Fall2015
MAPLE GROV 1 1 1 1
MAPLE HILL 1
MARATHON C 1 1 1 1
MARGARETVL 1 1 1 1 1
MARLBORO C 1 1 1
MARSHALL 13 3 4 8 6 7 10 5 8 13
MARYLROSE 1 1
MARYMOUNT 1 1 1 2 1 2 2
MASSAPEQUA 1 1 3 2 3 3 4
MASTERS SC 1 1 1 1 1
MATTITUCK 1 1
MCQUAID JE 1 1 1 1
MD YESHIVA 2 3 2 2 2 2
MERCY HS 1
MES FRST H 1 1 1 1 1 1 1 1 2
MESIVTA HS 2 1 1 1
MIBBLEBURG 1 1 1 1 1
MIDDLE 14 16 18 20 16 17 18 16 14 10
MIDDLETOWN 1 5 8 10 11 11 8 6 3 3
MIDWOOD 63 91 110 107 133 146 146 152 164 157
MILFORD CE 1 1 1 1
MILLBROOK 1 1 2 2 3 3 2 1
MILLER PL 1 1 1 2
MINEOLA HS 1 1 3 5 2 2 4 3 4
MINISINK V 1 1 2 2 2 3 1 2 3
MIRRER YSH 1 1 2 2 2 1
MOHONASEN 1 1 1 1
MONTICELLO 1 2 4 4
MOORE CATH 1 2 1 3 3 2 1
MORRIS HS 7 8 7 4 3 3 2 4 2 4
MOUNT ST M 1 1 2 2 2
MS MCCLNCY 11 12 13 19 13 12 13 11 14 16
MSGR FARRL 5 8 9 10 9 11 13 11 7 9
MT CABRINI 16 18 21 22 21 20 23 11 7 8
MT ST MARY 1 2 1 1
MT ST MCHL 12 20 21 29 23 20 12 15 12 13
MT VERNON 10 10 15 17 18 22 23 22 18 18
MT YISROEL 1 1 1 2 2 2 2 2 2
MT. SINAIS 1 1 4 2 2 4 2 3
N BABYLON 1 2 3 2 2 4 1 1
(Continued)

1Source: CUNY OIRA Institutional Research Data Base [IRDB]
Table 18: Fall 2006-2015 Freshmen High Schools of Origin 1
High Schools
Fall Terms
Fall2006
Fall2007
Fall2008
Fall2009
Fall2010
Fall2011
Fall2012
Fall2013
Fall2014
Fall2015
N DAME ACA 1 2 1 1 3 2
N DAME SCH 6 8 10 6 13 14 13 12 9 8
N HYDE PK 7 7 7 11 9 7 8 9 7 10
N RCHLLE 2 2 3 2 3 3 2 4 3 3 3
N ROCKLAND 3 10 10 17 19 20 22 26 25 25
N SHORE 3 5 5 2 1 1
N THOMAS 54 53 52 50 46 33 31 30 22 20
N UTRECHT 29 48 57 65 64 53 56 65 62 65
N Y MIL AC 1 1 1 2 1 1
NANUET SEN 2 2 1 2 4 4 3 3 3 1
NAZARETH 7 11 10 7 5 6 6 7 7 3
NAZARETH A 1 1 1 1
NEW DORP 7 5 9 12 13 11 9 9 7 12
NEW HRTFRD 1 1 1 1
NEW ROCHEL 12 18 31 31 32 31 34 34 42 40
NEW VISION 5 6 8 11 18 20 19 16 10 5
NEW VISTAS 1 1 1
NEWBRGH FR 1 3 4 4 11 14 16 8 7
NEWFIELD 1 1 1 1 2 1 1 3 3
NEWTOWN 101 109 104 113 116 118 113 106 95 90
NIAGARA FA 1
NIAGARA WH 1 1
NISKAYUNA 1 2 2 2
NO ETS 37 55 67 84 161 172 175 169 185 172
NORTH SALE 2 2 2 2 1 1 1
NORTHPORT 1 2 4 5 4 7 7 4 3
NORTHWOOD 1
NORWICH HI 1 1
NOTRE DAME 1 2 2 1 1
NRTHEASTRN 1 5 6 6 3 5 5 5 3 4
NYACK HS 2 3 3 7 8 5 7 5 4 5
O L PERP H 2 2 1 1
O L VICTRY 1 1 2 1 2 2 3 2 1 1
O OF ST 234 315 415 575 541 694 768 775 590 397
O SAV LUTH 1 1 1 1 1 1 2 2
OCEANSIDE 3 5 6 6 7 10 11 12 11
OFFSITE 1 1 1 1 1 1
ONEILL HIG 1
ONEONTA HI 1 1 1 2 1 1
ONTEORA CN 1 2 1 1 1 1 1 1 3 4
(Continued)

1Source: CUNY OIRA Institutional Research Data Base [IRDB]
Table 18: Fall 2006-2015 Freshmen High Schools of Origin 1
High Schools
Fall Terms
Fall2006
Fall2007
Fall2008
Fall2009
Fall2010
Fall2011
Fall2012
Fall2013
Fall2014
Fall2015
OSSINING 1 2 4 11 11 14 15 14 10 10
OUR LADY L 1 1 1 2 2 1 1
OUR LADY O 1 1 1 2 2 1 1 1
OUT ST GED 13 10 17 27 25 18 20 23 22 16
OWEGO FREE 1
OYSTER BAY 1 1 2 4 3 2 2 2 1
P D SCHRBR 2 3 4 2 5 10 9 11 8 9
PACIFIC 1 2 1 3 2 2 2 2 1
PACKER COL 1 2 1 1
PARK EAST 5 8 4 9 5 6 9 10 10 11
PARK SCHOO 1 1
PARK WEST 16 18 17 13 15 14 11 8 7 7
PATCH-MEDF 3 4 4 4 2 4 2 2 2
PAUL V MOO 1 1 1
PAWLING HI 1 1 1
PEACE 1 1 3 4 4 6 1 1 2 1
PEARL RVR 1 1 1 2 1 4 3 2
PEEKSKILL 1 2 2 6 6 4 4 4 2 1
PELHAM MEM 4 4 4 4 6 6 7 5 4 4
PENFIELD 2 2 3 1
PHYSICAL 3 3 4 7 5 2 3 1 2
PIERSON 1 2 1 2 1
PINE BUSH 2 5 6 5 2 3 4 5 6 4
PITTSFORD 2 2 1 2 1
PLAINEDGE 1 1 2 2 2 2 2 2 4 3
PLATTSBURG 1
PLEASANT 1 1 1 1
PLEASNTVL 2 4 8 5 2 1 1 1
PLNV BTHPG 1 1 1 1 1
POLY PREP 2 2 2 1 1 2 1 1 2
POUGHKEEPS 1 3 3 2 1 1
PRESTN HS 1 2 3 8 10 9 13 16 20 21
PROF CHILD 1 1
PROSP HTS 12 16 10 9 7 7 6 3 1 1
PRS PK YSH 1 1 2 2 2
PT CHESTER 3 4 5 4 5 2 5 4 6 4
PT JERVIS 1 1 1
PT RCHMND 11 14 15 15 17 14 14 13 12 11
PUTNAM VAL 1 1
QUEEN OF A 1 1 1
(Continued)

1Source: CUNY OIRA Institutional Research Data Base [IRDB]
Table 18: Fall 2006-2015 Freshmen High Schools of Origin 1
High Schools
Fall Terms
Fall2006
Fall2007
Fall2008
Fall2009
Fall2010
Fall2011
Fall2012
Fall2013
Fall2014
Fall2015
QUEENS VOC 20 19 21 23 26 25 25 27 30 29
QUEENSBURY 1 1 1
R C KETCHM 1 2 2 2 2 2 3 2 1
R GREEN HS 17 14 18 18 17 18 20 22 16 13
R HIRSCH B 1 1 1 1
R MCKEE 3 4 4 4 3 3 3 4 2
R S R HIRS 1 1 2 1 2 2
R STEINER 1 2 2 1 2 3 2 2 2 1
R STEVNSN 2 2 2 2 1 3 3 3 2 4
R-C-SELKIR 1
RAMAPO SEN 9 11 15 14 10 13 18 21 13 9
RAMAZ SCH 1 1 1 2 2 2 1 1 2 2
RCHMND HL 37 44 50 52 52 61 69 71 65 57
RCHMNDTOWN 1 1 1 1 1 1 1
RED HK CTL 1 1 1 1 1
REGIS HS 2 4 5 5 6 5 7 5 4 5
RENAISSANC 6 10 8 6 3 9 7 6 3 1
RHINEBECK 1 1 1
RICE HS 3 1 2 3 2 1 1 2 2
RIVERDALE 1 1 1
RIVERDLE 2 2 3
RIVERHEAD 2 1 1 2 1 2 3 3
RIVERSIDE 1 1 1 1 1
ROBESON 5 5 7 9 8 6 6 2 2 3
ROCKLAND C 1
ROCKY PNT 1 1 1 1 1
RONDOUT 1 2 2
ROOSEVELT 7 13 11 14 13 15 11 10 10 11
ROSLYN HS 1 1 3 3 2 2 3
RSEVLT JR 1 1 2 1 2 2 1 1 1
RYE 1 1 3 1 1 1 1 1
RYE COUNTR 1
RYE NECK 1 2 2 2 1
S ACADEMY 1 1 1
S BRONX 10 7 11 14 10 11 11 13 14 10
S CALHOUN 1 2 4 4 7 7 7 9 11 9
S E WAGNER 11 9 17 23 29 33 35 43 45 29
S GOMPERS 21 20 22 20 15 20 16 11 12 8
S HALE 5 6 2 3 3 2 1 2
S I ACAD 1 1 1 1 1 1 1
(Continued)

1Source: CUNY OIRA Institutional Research Data Base [IRDB]
Table 18: Fall 2006-2015 Freshmen High Schools of Origin 1
High Schools
Fall Terms
Fall2006
Fall2007
Fall2008
Fall2009
Fall2010
Fall2011
Fall2012
Fall2013
Fall2014
Fall2015
S J TILDEN 19 20 18 16 11 6 3 3 3 2
S MARIS HS 2 3 3 3 3 3 1 1 2
S S SEWARD 1 1
SAC HRT AC 10 10 9 10 9 10 10 7 5 4
SAC HRT YK 1 3 1 3 3 3 5 6 5 5
SACHEM 1 1 3 2 4 3 3 1
SAINT AGNE 1 1 2 2 2 2
SALESIAN 2 2 3 4 6 5 10 13 11 10
SARANAC LA 1 1
SARATOGA S 1 1
SATLITE AC 7 3 2 3 3 6 4 10 10 6
SAUGERTIES 1
SAUNDER TR 18 19 26 29 31 34 43 47 35 41
SAYVILLE 1 1 1 1
SCARSDALE 1 1 3 3 5 4 5 4 1
SCH HOLY C 1 1 1 1 1 2 1 1 1
SCH P ARTS 1 1
SCHUYLERVI 1
SCIENCE 16 16 13 22 21 25 26 27 21 20
SCTIA GLNV 1 1
SEAFORD HS 1 2 2 4 3 2 2
SENIOR HIG 1 1 2 2 1 2
SEWANHAKA 3 7 20 23 22 23 19 16 11 9
SEWARD PK 32 28 23 22 23 14 6 6 5 5
SHAKER HIG 1 1 1 1 1 2
SHARIE TOR 1 2 2 1
SHEEPSHEAD 52 44 47 42 41 45 44 41 33 35
SHELTR ISL 1
SHENENDEHO 1 1 2 2 1 1 1
SHEVACH HS 2 1 1
SHOREHAM 1 1 1 2 1
SHULMITH G 1 1 1 1
SI TECH. 9 12 11 10 9 11 12 17 18 26
SINAI ACAD 2 2 2 1 1
SLEEPY HLW 1 1 1 1 2 2 2 2 3
SMITHTOWN 1 3 4 3 1 2 1 2 2
SO BRONX 6 7 6 4 4 6 2 2 1
SO SENECA 1 1 1
SO SHORE 14 15 13 16 14 8 5 2 3 2
SO SIDE SR 1 3 3 4 3 2 3 2 1
(Continued)
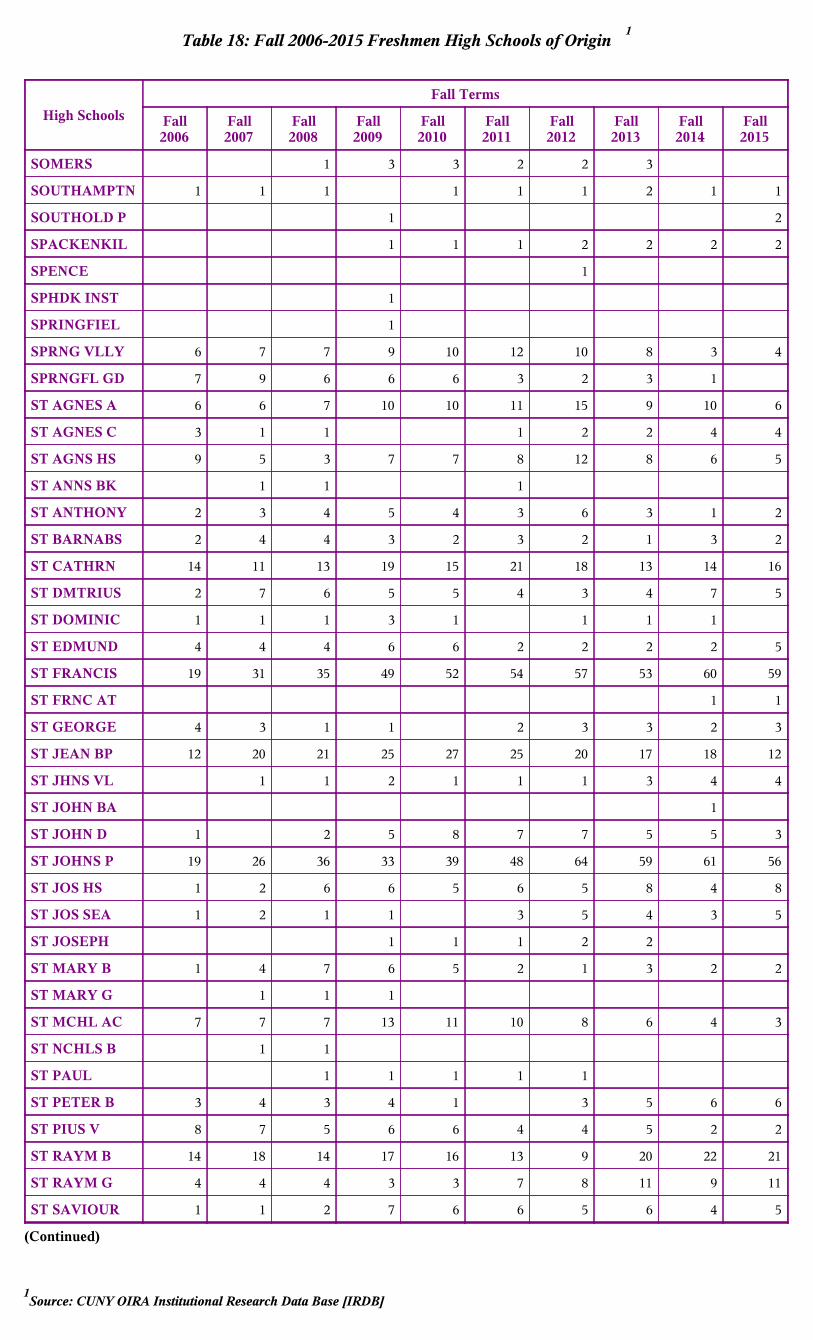
1Source: CUNY OIRA Institutional Research Data Base [IRDB]
Table 18: Fall 2006-2015 Freshmen High Schools of Origin 1
High Schools
Fall Terms
Fall2006
Fall2007
Fall2008
Fall2009
Fall2010
Fall2011
Fall2012
Fall2013
Fall2014
Fall2015
SOMERS 1 3 3 2 2 3
SOUTHAMPTN 1 1 1 1 1 1 2 1 1
SOUTHOLD P 1 2
SPACKENKIL 1 1 1 2 2 2 2
SPENCE 1
SPHDK INST 1
SPRINGFIEL 1
SPRNG VLLY 6 7 7 9 10 12 10 8 3 4
SPRNGFL GD 7 9 6 6 6 3 2 3 1
ST AGNES A 6 6 7 10 10 11 15 9 10 6
ST AGNES C 3 1 1 1 2 2 4 4
ST AGNS HS 9 5 3 7 7 8 12 8 6 5
ST ANNS BK 1 1 1
ST ANTHONY 2 3 4 5 4 3 6 3 1 2
ST BARNABS 2 4 4 3 2 3 2 1 3 2
ST CATHRN 14 11 13 19 15 21 18 13 14 16
ST DMTRIUS 2 7 6 5 5 4 3 4 7 5
ST DOMINIC 1 1 1 3 1 1 1 1
ST EDMUND 4 4 4 6 6 2 2 2 2 5
ST FRANCIS 19 31 35 49 52 54 57 53 60 59
ST FRNC AT 1 1
ST GEORGE 4 3 1 1 2 3 3 2 3
ST JEAN BP 12 20 21 25 27 25 20 17 18 12
ST JHNS VL 1 1 2 1 1 1 3 4 4
ST JOHN BA 1
ST JOHN D 1 2 5 8 7 7 5 5 3
ST JOHNS P 19 26 36 33 39 48 64 59 61 56
ST JOS HS 1 2 6 6 5 6 5 8 4 8
ST JOS SEA 1 2 1 1 3 5 4 3 5
ST JOSEPH 1 1 1 2 2
ST MARY B 1 4 7 6 5 2 1 3 2 2
ST MARY G 1 1 1
ST MCHL AC 7 7 7 13 11 10 8 6 4 3
ST NCHLS B 1 1
ST PAUL 1 1 1 1 1
ST PETER B 3 4 3 4 1 3 5 6 6
ST PIUS V 8 7 5 6 6 4 4 5 2 2
ST RAYM B 14 18 14 17 16 13 9 20 22 21
ST RAYM G 4 4 4 3 3 7 8 11 9 11
ST SAVIOUR 1 1 2 7 6 6 5 6 4 5
(Continued)

1Source: CUNY OIRA Institutional Research Data Base [IRDB]
Table 18: Fall 2006-2015 Freshmen High Schools of Origin 1
High Schools
Fall Terms
Fall2006
Fall2007
Fall2008
Fall2009
Fall2010
Fall2011
Fall2012
Fall2013
Fall2014
Fall2015
ST VNCNT F 10 10 9 13 13 10 14 16 13 17
STERN ACAD 1 3 2 2 2
STILLWATER 1
STISSING M 2 2 2 2
STNY BROOK 1 1
STORM KING 1
STUYVESANT 113 98 94 84 65 73 79 71 83 77
SUFFERN 2 4 6 4 4 3 6 5 3 3
SYOSSET 4 3 5 8 14 13 13 12 10 7
SYRACUSE C 1 1 1
T A EDISON 1 1 1
T EDISON 69 80 90 124 149 156 147 129 103 75
T HARRIS 24 34 40 43 48 43 35 27 19 14
T JEFERSN 3 5 4 6 5 1 2 2 1 1
T ROOSEVLT 25 24 14 12 9 9 10 11 10 8
T RSEVLT E 1 1 1
T VODAATH 1 1 1 1 1 1
TACONIC HI 1
TALENT UN 7 12 15 16 15 16 15 16 16 14
TAPPAN ZEE 1 5 6 5 4 5 3 4 3 3
THE WHETLY 1 2 2 2 1 1
THE WINDSR 1 1 2 2 2
THRNTN DNV 1 2 2 2 2 3 2 1 1 1
TICONDEROG 1
TIFERES 1
TORAH AC G 1
TORAH ACAD 1 1
TOTTENVILL 11 17 14 13 16 26 23 23 21 13
TRINITY 1 1 1 1 1 1 1 1
TROY HS 1 1 1
TUCKAHOE 2 3 3 1 3 1 1 3 4 6
TUTORING 1 1 3 4 3 1 1
TUXEDO 1 2 2 2 4 3 2 3
UN INTERNT 1 3 4 5 8 6 4 3 2
UNC. GED 2 2 2 3 1 1 2 2
UNION ENDI 2 2 3 3 3 3
UNIONDALE 15 17 22 25 22 21 17 14 12 11
UNITY 2 1 3 1 1 2 4 3 1 2
UNIV. HGT. 1 6 9 9 8 4 5 4 10 12
URSULINE 1 2 2 2 3 4 3 4 3 3
(Continued)
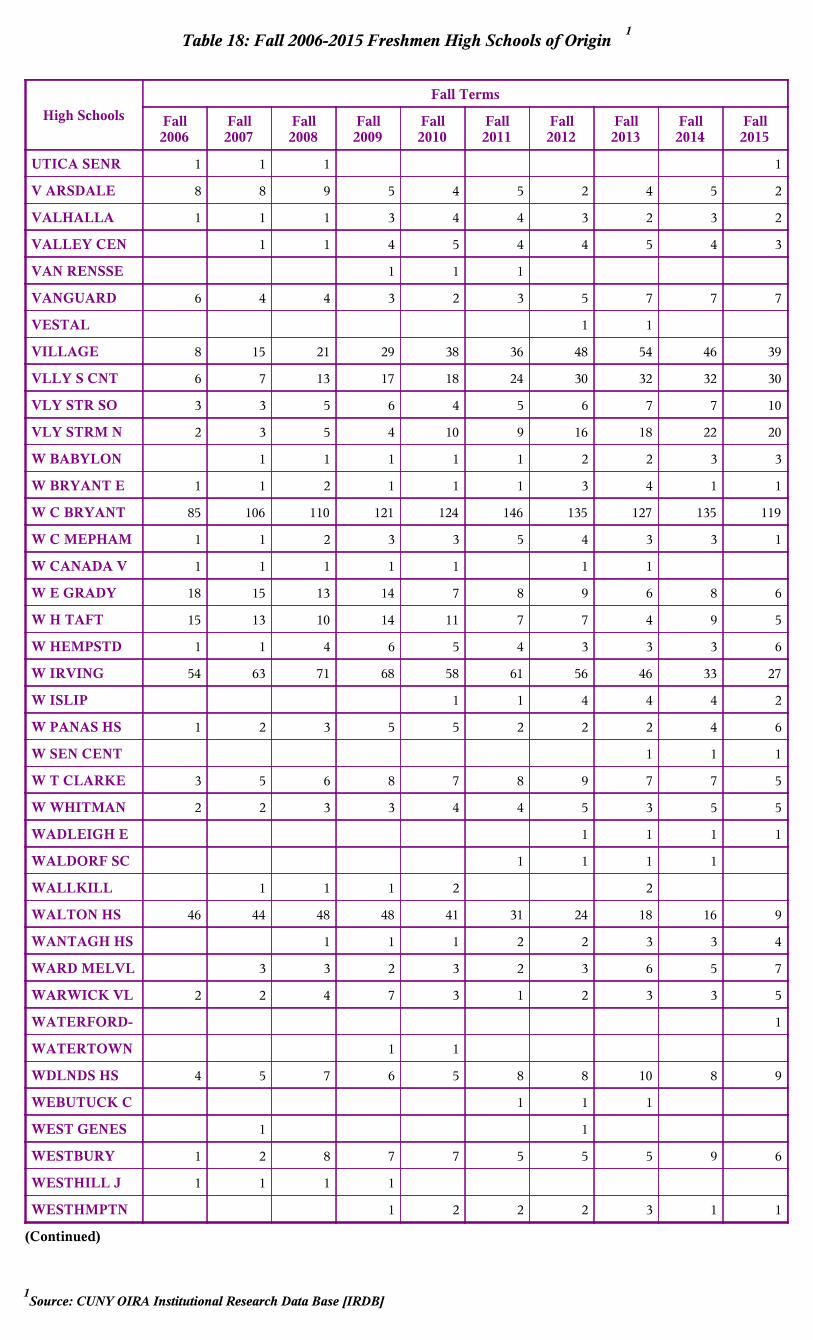
1Source: CUNY OIRA Institutional Research Data Base [IRDB]
Table 18: Fall 2006-2015 Freshmen High Schools of Origin 1
High Schools
Fall Terms
Fall2006
Fall2007
Fall2008
Fall2009
Fall2010
Fall2011
Fall2012
Fall2013
Fall2014
Fall2015
UTICA SENR 1 1 1 1
V ARSDALE 8 8 9 5 4 5 2 4 5 2
VALHALLA 1 1 1 3 4 4 3 2 3 2
VALLEY CEN 1 1 4 5 4 4 5 4 3
VAN RENSSE 1 1 1
VANGUARD 6 4 4 3 2 3 5 7 7 7
VESTAL 1 1
VILLAGE 8 15 21 29 38 36 48 54 46 39
VLLY S CNT 6 7 13 17 18 24 30 32 32 30
VLY STR SO 3 3 5 6 4 5 6 7 7 10
VLY STRM N 2 3 5 4 10 9 16 18 22 20
W BABYLON 1 1 1 1 1 2 2 3 3
W BRYANT E 1 1 2 1 1 1 3 4 1 1
W C BRYANT 85 106 110 121 124 146 135 127 135 119
W C MEPHAM 1 1 2 3 3 5 4 3 3 1
W CANADA V 1 1 1 1 1 1 1
W E GRADY 18 15 13 14 7 8 9 6 8 6
W H TAFT 15 13 10 14 11 7 7 4 9 5
W HEMPSTD 1 1 4 6 5 4 3 3 3 6
W IRVING 54 63 71 68 58 61 56 46 33 27
W ISLIP 1 1 4 4 4 2
W PANAS HS 1 2 3 5 5 2 2 2 4 6
W SEN CENT 1 1 1
W T CLARKE 3 5 6 8 7 8 9 7 7 5
W WHITMAN 2 2 3 3 4 4 5 3 5 5
WADLEIGH E 1 1 1 1
WALDORF SC 1 1 1 1
WALLKILL 1 1 1 2 2
WALTON HS 46 44 48 48 41 31 24 18 16 9
WANTAGH HS 1 1 1 2 2 3 3 4
WARD MELVL 3 3 2 3 2 3 6 5 7
WARWICK VL 2 2 4 7 3 1 2 3 3 5
WATERFORD- 1
WATERTOWN 1 1
WDLNDS HS 4 5 7 6 5 8 8 10 8 9
WEBUTUCK C 1 1 1
WEST GENES 1 1
WESTBURY 1 2 8 7 7 5 5 5 9 6
WESTHILL J 1 1 1 1
WESTHMPTN 1 2 2 2 3 1 1
(Continued)

1Source: CUNY OIRA Institutional Research Data Base [IRDB]
Table 18: Fall 2006-2015 Freshmen High Schools of Origin 1
High Schools
Fall Terms
Fall2006
Fall2007
Fall2008
Fall2009
Fall2010
Fall2011
Fall2012
Fall2013
Fall2014
Fall2015
WESTLAKE 1 1 1 2 2 3 3 4 3
WESTSIDE 15 11 15 12 9 5 8 15 10 8
WHMAXWELL 6 6 3 3 3 3 5 3 2 2
WHITE PLNS 17 22 19 25 26 24 23 18 16 15
WHITESTONE 1 1 1 1 2 2 2 3 3
WILBUR H L 1 1 1 2
WILLMSVLLE 1
WINSTON 1 1
WLMSVL NO 1
WM FLOYD 2 2 3 3 6 2 2 1
WM NOTTING 1 2 1 2 2 1 1
WOODMERE 2 4 4 2 2 2 3
WSHNGTNVLL 1 4 5 4 6 6 5 5 4 5
WYANDANCH 1 1 1 1
XAVERIAN 2 1 2 4 8 9 9 9 8 12
XAVIER 9 8 8 10 14 9 11 9 11 9
Y A YAAKOV 1 2 1 1 1 1
YESH H S 1 1 1 1
YESH U GRL 2 1 2 2 1 1 2 6
YESH U HSB 1 1 1 1
YONKERS 1 1 2 2 2 2 2 2 2 3
YORK PREP 1 2 3 5 4 5 4 2
YORKTOWN 2 2 4 4 2 2 4 4

2Source: CUNY OIRA Institutional Research Data Base [IRDB]
1Includes non-degree, 'Permit' students from other CUNY colleges & 'CUNY BA' students. Excludes high school students taking college courses.
Table 19a: Fall 2006-2015: First-time, Full-time Freshmen by Age and Gender 1-2
New Freshmen Median Age 18.3 Mode: 17.9
Age of Freshmen
Fall Terms
Fall 2006 Fall 2007 Fall 2008 Fall 2009 Fall 2010 Fall 2011 Fall 2012 Fall 2013 Fall 2014 Fall 2015
N % % N % % N % % N % % N % % N % % N % % N % % N % % N % %
Gender
19 Men 79 10 0.5 101 11 0.6 80 10 0.5 91 11 0.6 49 7 0.3 89 12 0.6 65 10 0.4 79 11 0.5 62 8 0.4 82 9 0.5
Women 70 9 0.4 63 7 0.4 65 7 0.4 46 5 0.3 40 6 0.3 49 6 0.3 52 7 0.3 48 7 0.3 48 7 0.3 48 6 0.3
20 - 22 Men 45 6 0.3 61 7 0.4 43 5 0.3 39 5 0.2 32 5 0.2 32 4 0.2 37 5 0.2 26 4 0.2 26 3 0.2 23 3 0.1
Women 28 4 0.2 41 4 0.3 30 3 0.2 25 3 0.2 33 5 0.2 20 3 0.1 39 5 0.2 32 4 0.2 23 3 0.1 22 3 0.1
23 - 24 Men 5 1 0.0 11 1 0.1 3 0 0.0 5 1 0.0 1 0 0.0 1 0 0.0 3 0 0.0 4 1 0.0 3 0 0.0 5 1 0.0
Women 6 1 0.0 9 1 0.1 4 0 0.0 1 0 0.0 2 0 0.0 2 0 0.0 2 0 0.0 1 0 0.0 3 0 0.0
25 - 29 Men 6 1 0.0 4 0 0.0 6 1 0.0 2 0 0.0 4 1 0.0 2 0 0.0 2 0 0.0 1 0 0.0 1 0 0.0
Women 5 1 0.0 5 1 0.0 1 0 0.0 4 1 0.0 2 0 0.0 1 0 0.0
30 - 44 Men 4 0 0.0 2 0 0.0 4 0 0.0 2 0 0.0 3 0 0.0 1 0 0.0
Women 1 0 0.0 2 0 0.0 2 0 0.0 1 0 0.0 2 0 0.0 1 0 0.0
45 & OVER Men 1 0 0.0 1 0 0.0
Women 1 0 0.0 1 0 0.0
UNDER 19 Men 652 83 4.1 712 80 4.5 705 84 4.5 716 83 4.5 604 88 3.8 596 83 3.8 567 84 3.6 610 85 3.9 655 87 4.2 756 87 4.8
Women 672 86 4.3 817 87 5.2 831 89 5.3 842 92 5.3 625 89 4.0 720 91 4.6 627 87 4.0 643 89 4.1 616 89 3.9 688 90 4.4

2Source: CUNY OIRA Institutional Research Data Base [IRDB]
1Includes non-degree, 'Permit' students from other CUNY colleges & 'CUNY BA' students. Excludes high school students taking college courses.
Table 19b: Fall 2006-2015: All Undergraduates by Age and Gender 1-2
All Undergraduates Median Age 21.7 Mode: 21.0
Age ofUndergraduates
Fall Terms
Fall 2006 Fall 2007 Fall 2008 Fall 2009 Fall 2010 Fall 2011 Fall 2012 Fall 2013 Fall 2014 Fall 2015
N % % N % % N % % N % % N % % N % % N % % N % % N % % N % %
Gender
19 Men 627 12 0.5 656 12 0.5 725 13 0.6 785 13 0.6 710 12 0.6 736 12 0.6 662 11 0.5 669 11 0.6 733 11 0.6 792 12 0.7
Women 579 11 0.5 689 13 0.6 813 14 0.7 868 13 0.7 838 14 0.7 732 11 0.6 793 12 0.7 744 12 0.6 744 11 0.6 734 11 0.6
20 - 22 Men 1,475 29 1.2 1,696 31 1.4 1,822 31 1.5 2,029 33 1.7 2,034 35 1.7 2,104 34 1.7 2,134 35 1.8 2,076 35 1.7 2,087 33 1.7 2,175 33 1.8
Women 1,369 27 1.1 1,606 29 1.3 1,818 31 1.5 2,153 33 1.8 2,222 36 1.8 2,392 37 2.0 2,393 37 2.0 2,332 37 1.9 2,354 35 1.9 2,375 35 2.0
23 - 24 Men 638 12 0.5 652 12 0.5 675 12 0.6 790 13 0.7 763 13 0.6 800 13 0.7 797 13 0.7 820 14 0.7 838 13 0.7 856 13 0.7
Women 563 11 0.5 570 10 0.5 612 10 0.5 696 11 0.6 685 11 0.6 729 11 0.6 782 12 0.6 789 13 0.7 829 12 0.7 837 12 0.7
25 - 29 Men 792 15 0.7 832 15 0.7 862 15 0.7 841 14 0.7 845 14 0.7 923 15 0.8 945 16 0.8 841 14 0.7 887 14 0.7 904 14 0.7
Women 710 14 0.6 719 13 0.6 706 12 0.6 740 11 0.6 750 12 0.6 762 12 0.6 826 13 0.7 762 12 0.6 812 12 0.7 850 13 0.7
30 - 44 Men 623 12 0.5 619 11 0.5 619 11 0.5 568 9 0.5 540 9 0.4 607 10 0.5 602 10 0.5 548 9 0.5 584 9 0.5 542 8 0.4
Women 724 14 0.6 664 12 0.5 643 11 0.5 638 10 0.5 552 9 0.5 584 9 0.5 593 9 0.5 565 9 0.5 589 9 0.5 530 8 0.4
45 & OVER Men 128 2 0.1 119 2 0.1 115 2 0.1 122 2 0.1 112 2 0.1 122 2 0.1 109 2 0.1 107 2 0.1 114 2 0.1 116 2 0.1
Women 224 4 0.2 212 4 0.2 200 3 0.2 203 3 0.2 192 3 0.2 208 3 0.2 216 3 0.2 178 3 0.1 179 3 0.1 161 2 0.1
UNDER 19 Men 869 17 0.7 961 17 0.8 972 17 0.8 967 16 0.8 860 15 0.7 815 13 0.7 779 13 0.6 821 14 0.7 1,133 18 0.9 1,241 19 1.0
Women 879 17 0.7 1,043 19 0.9 1,159 19 1.0 1,141 18 0.9 891 15 0.7 988 15 0.8 887 14 0.7 879 14 0.7 1,151 17 1.0 1,226 18 1.0
UNKNOWN Men 1 0 0.0
Women 1 0 0.0 1 0 0.0 1 0 0.0

3Source: CUNY OIRA Institutional Research Data Base [IRDB]
2High school, College Now & Middle College students are excluded. BA/MA majors in Economics, History, and Math are included in the Graduate Majors
1Starting in Fall 2014 'SCIENCE' majors where not coded as '001' or 'SCI'.
3Source: CUNY OIRA Institutional Research Data Base [IRDB]
2High school, College Now & Middle College students are excluded. BA/MA majors in Economics, History, and Math are included in the Graduate Majors
1Starting in Fall 2014 'SCIENCE' majors where not coded as '001' or 'SCI'.
Table 20: Fall 2006-2015: Undergraduates by Major 1-3
Majors
Term
Fall2006
Fall2007
Fall2008
Fall2009
Fall2010
Fall2011
Fall2012
Fall2013
Fall2014
Fall2015
ADMINISITRATIVE-NON-DEGREE & PERMIT STUDENTS 270 856 871
AMERICAN STUDIES 1 1 5 2
ANTHROPOLOGY 15 27 31 34 43 50 43 46 49 52
ARCHITECTURE B-ARCH 208 324 281 258 250 314 275 259 250 271
ARCHITECTURE MHC 10
AREA ST AS LA RU 16 10 16 24 17 20 19 17 19 22
AREA ST BLST PR JWS 30 27 29 36 24 30 22 27 33 34
ART 343 337 364 394 374 375 369 369 331 367
ART MHC 1 11 17
BIOLOGY 219 319 324 344 271 294 278 255 287 285
BIOLOGY BS-MS 3 1
BIOLOGY MHC 10
BIOTECHNOLOGY 1 4 13
CHEMISTRY 68 87 77 78 82 93 112 130
CHEMISTRY MHC 4
COMMUNICATIONS 283 377 456 410 307 262 214 191 189 156
COMP LITERATURE 2 1 1 4 1
COMPUTER SCIENCE 199 186 173 180 178 183 195 237 236 338
CUNY BACCALAUREATE 21 62 42 32 29 24 52 39 21 36
(Continued)

3Source: CUNY OIRA Institutional Research Data Base [IRDB]
2High school, College Now & Middle College students are excluded. BA/MA majors in Economics, History, and Math are included in the Graduate Majors
1Starting in Fall 2014 'SCIENCE' majors where not coded as '001' or 'SCI'.
Table 20: Fall 2006-2015: Undergraduates by Major 1-3
Majors
Term
Fall2006
Fall2007
Fall2008
Fall2009
Fall2010
Fall2011
Fall2012
Fall2013
Fall2014
Fall2015
CWE EARLY CHILD ED 2 2 1
CWE INTERDISC LA&SCI 570 519 459 600 575 550 572 512 524 338
ECONOMICS 135 174 215 229 209 218 244 232 255 299
ECONOMICS MHC 3 13 29
EDUCATION ALT CRT BILINGUAL CHILDHOOD 2 5 6 8 8 11 13 21 112 137
EDUCATION ART K-12 TEACHER 3
EDUCATION BILINGUAL CHILDHOOD 22 15 22 39 64 73 72 84
EDUCATION CHILDHOOD EDUCATION 40 50 67 142 285 317 264 295 260 280
EDUCATION EARLY CHILDHOOD 22 29 27 60 45 55 32 51 26 139
EDUCATION EARTH SCIENCE 7-12 1
EDUCATION ELEMENTARY N-6 3 2 1 1
EDUCATION ENGLISH 7-12 2
EDUCATION LANG OTHER THAN ENG 1 1 1 1 1
EDUCATION MUSIC K-12 TEACHER 6 8 1 1
ELEC DES & MULTIMED 37 52 53 55 47 49 47 39 71 60
ENGINEER BIOMEDICAL 128 136 139 141 176 188 214 212 232 227
ENGINEER BIOMEDICAL MHC 21
ENGINEER BIOMEMICAL MHC 18 46
ENGINEER CHEMICAL 121 132 131 151 171 163 176 174 342 363
(Continued)

3Source: CUNY OIRA Institutional Research Data Base [IRDB]
2High school, College Now & Middle College students are excluded. BA/MA majors in Economics, History, and Math are included in the Graduate Majors
1Starting in Fall 2014 'SCIENCE' majors where not coded as '001' or 'SCI'.
Table 20: Fall 2006-2015: Undergraduates by Major 1-3
Majors
Term
Fall2006
Fall2007
Fall2008
Fall2009
Fall2010
Fall2011
Fall2012
Fall2013
Fall2014
Fall2015
ENGINEER CHEMICAL HCC 4 4 3
ENGINEER CHEMICAL MHC 11
ENGINEER CIVIL 348 364 342 386 416 412 381 357 376 444
ENGINEER CIVIL HCC 1 5
ENGINEER CIVIL LCC 5 7
ENGINEER CIVIL MHC 7 21 76
ENGINEER COMPUTER 250 217 218 237 229 244 234 240 286 302
ENGINEER COMPUTER MHC 2
ENGINEER EARTH SYS SCI ENV 100 87
ENGINEER ELECTRICAL 513 491 500 485 490 475 427 404 468 478
ENGINEER ELECTRICAL HCC 12 13
ENGINEER ELECTRICAL LCC 1 7 4
ENGINEER ELECTRICAL MHC 9
ENGINEER MECHANICAL 361 366 373 402 408 463 434 474 534 563
ENGINEER MECHANICAL HCC 2 1 1 1
ENGINEER MECHANICAL LCC 4 5 6 6
ENGLISH 208 276 316 453 460 461 484 443 408 341
ENGLISH MHC 5
ENV EARTH SYS SCI 18 30 35 48 65 80 83 105 25 29
(Continued)

3Source: CUNY OIRA Institutional Research Data Base [IRDB]
2High school, College Now & Middle College students are excluded. BA/MA majors in Economics, History, and Math are included in the Graduate Majors
1Starting in Fall 2014 'SCIENCE' majors where not coded as '001' or 'SCI'.
Table 20: Fall 2006-2015: Undergraduates by Major 1-3
Majors
Term
Fall2006
Fall2007
Fall2008
Fall2009
Fall2010
Fall2011
Fall2012
Fall2013
Fall2014
Fall2015
FILM 23 54 37 54 58 49 48 50 54 61
GATEWAY 2,988 3,140 3,666 3,274 2,741 2,719 2,826 2,152 3,306 3,127
GEOLOGY 15 13 16 27 30 31 42 42 42 44
HISTORY 92 99 122 167 185 196 167 152 146 113
HISTORY MHC 1 3
INTERNAT RELATIONS 111 124 154 184 189 169 154 136
INTERNAT STUDIES 128 123
INTERNAT STUDIES MHC 5 3 8
LANDSCAPE ARCH I 11 3 2 1
LIBERAL ARTS 53
MANAGMNT & ADMIN 160 199 211 249 217 215 233 238 242 237
MANAGMNT & ADMIN MHC 3 36
MATH SCI & IND APPL 15 22 27 30 37 57 87 102 96 124
MATHEMATICS 47 63 54 64 69 98 86 75 116 95
MHC AREA ST AS LA R 1
MHC FILM BFA 6
MHC THEATER 1
MUSIC 248 283 296 277 297 312 307 309 274 281
PHILOSOPHY 25 24 28 32 31 37 33 39 34 33
(Continued)

3Source: CUNY OIRA Institutional Research Data Base [IRDB]
2High school, College Now & Middle College students are excluded. BA/MA majors in Economics, History, and Math are included in the Graduate Majors
1Starting in Fall 2014 'SCIENCE' majors where not coded as '001' or 'SCI'.
Table 20: Fall 2006-2015: Undergraduates by Major 1-3
Majors
Term
Fall2006
Fall2007
Fall2008
Fall2009
Fall2010
Fall2011
Fall2012
Fall2013
Fall2014
Fall2015
PHYSICS 24 26 26 32 35 43 47 61 60 61
POLITICAL SCIENCE 103 125 145 199 193 178 172 173 195 203
POLITICAL SCIENCE MHC 2
PRE-LAW 12 31 29 53 44 56 57 54 62 37
PSYCHOLOGY 414 519 605 805 864 888 878 966 1,079 1,168
PSYCHOLOGY MHC 1 8 23
PUBLISHING (CERT) 2 1 1 1
ROM LANG FR IT SP 114 110 118 122 92 96 91 91 70 67
SCIENCE 910 901 793 954 929 1,190 1,222 1,138
SOCIOLOGY 108 120 122 175 169 181 162 156 177 156
SOCIOLOGY MHC 1
SOPHIE DAVIS BIOMED 361 365 372 379 353 346 352 347 349 383
SOPHIE DAVIS PHYSICIAN'S ASST 80 84 89 97 103 95 97 93 103 101
SPEECH PATH 2 1 1 1
THEATRE 63 74 88 106 99 112 139 121 116 132
URBAN LEGAL STUDIES 1 1 1 1 1 1 3
Total 10,175 11,011 11,706 12,512 11,962 12,475 12,492 12,114 13,035 13,340

2Source: CUNY OIRA Institutional Research Data Base [IRDB]
1High school, College Now & Middle College students are not included. BA/MA majors in Economics, History, and Math are included in the Graduate Majors
Table 21: Fall 2006-2015: All Degree-Seeking Undergraduates by Division/School 1-3
2Source: CUNY OIRA Institutional Research Data Base [IRDB]
1High school, College Now & Middle College students are not included. BA/MA majors in Economics, History, and Math are included in the Graduate Majors
Table 21: Fall 2006-2015: All Degree-Seeking Undergraduates by Division/School 1-3
MajorsYear
2006 2007 2008 2009 2010 2011 2012 2013 2014 2015
ADMINISITRATIVE-Non-degree & Permit Students 270 856 871
ARCHITECTURE 219 327 281 258 252 314 275 270 250 271
CWE INTERDISCIPLINARY STUDIES 647 600 619 660 620 605 604 563 524 338
EDUCATION 399 470 481 518 509 510 474 475 398 558
ENGINEERING 1,937 1,921 1,910 2,025 2,131 2,206 2,167 2,276 2,286 2,584
GATEWAY 2,731 2,660 3,131 2,835 2,480 2,473 2,549 1,971 3,306 3,127
HIGH SCHOOL STUDENTS 166 276 325 419 389 436 595 498
HUMANITIES & ARTS 1,460 1,795 1,947 2,218 2,089 2,112 2,107 1,957 1,758 1,706
POWELL SCHOOL 1,105 1,357 1,558 1,988 1,970 2,005 1,985 2,057 2,234 2,399
SCIENCES 1,236 1,432 1,318 1,534 1,455 1,809 1,882 1,835 971 1,002
SOPHIE DAVIS/BIOMED 441 449 461 476 456 441 449 440 452 484
Total 10,341 11,287 12,031 12,931 12,351 12,911 13,087 12,612 13,035 13,340

1Source: CUNY OIRA Institutional Research Data Base [IRDB]
Table 22a: Degrees Awarded 2005-2006 through 2013-2014 by School/Division 1
1Source: CUNY OIRA Institutional Research Data Base [IRDB]
Table 22a: Degrees Awarded 2005-2006 through 2013-2014 by School/Division 1
Degree_Earned_Level_Desc=ADVANCED CERTIFICATE
Division or School byMajor 2006-2007 2007-2008 2008-2009 2009-2010 2010-2011 2011-2012 2012-2013 2013-2014 2014-2015
EDUCATION 5 6 8 4 7 4 6 4
ENGINEERING 1 3 1 1 2 1
HUMANITIES & ARTS 1
Total 6 9 1 8 4 8 4 9 5

1Source: CUNY OIRA Institutional Research Data Base [IRDB]
Table 22a: Degrees Awarded 2005-2006 through 2013-2014 by School/Division 1
1Source: CUNY OIRA Institutional Research Data Base [IRDB]
Table 22a: Degrees Awarded 2005-2006 through 2013-2014 by School/Division 1
Degree_Earned_Level_Desc=BACHELOR'S
Division or School by Major 2006-2007 2007-2008 2008-2009 2009-2010 2010-2011 2011-2012 2012-2013 2013-2014 2014-2015
ARCHITECTURE 72 58 51 61 40 71 59 57 41
CWE INTERDISCIPLINARY STUDIES 153 170 163 144 183 168 150 120 137
EDUCATION 41 34 28 39 63 68 76 110 79
ENGINEERING 210 254 227 276 238 231 264 279 284
HUMANITIES & ARTS 28 45 47 50 64 70 96 485 528
POWELL SCHOOL 295 321 374 437 572 602 571 690 756
SCIENCES 88 126 117 134 154 161 211 247 253
SOPHIE DAVIS/BIOMED 85 85 73 85 95 91 77 81 78
Total 972 1093 1080 1226 1409 1462 1504 2069 2156

1Source: CUNY OIRA Institutional Research Data Base [IRDB]
Table 22a: Degrees Awarded 2005-2006 through 2013-2014 by School/Division 1
1Source: CUNY OIRA Institutional Research Data Base [IRDB]
Table 22a: Degrees Awarded 2005-2006 through 2013-2014 by School/Division 1
Degree_Earned_Level_Desc=DOCTORAL
Division orSchool by Major 2011-2012 2012-2013 2013-2014 2014-2015
ENGINEERING 2 9 17 33
Total 2 9 17 33

1Source: CUNY OIRA Institutional Research Data Base [IRDB]
Table 22a: Degrees Awarded 2005-2006 through 2013-2014 by School/Division 1
1Source: CUNY OIRA Institutional Research Data Base [IRDB]
Table 22a: Degrees Awarded 2005-2006 through 2013-2014 by School/Division 1
Degree_Earned_Level_Desc=MASTER'S
Division or School by Major 2006-2007 2007-2008 2008-2009 2009-2010 2010-2011 2011-2012 2012-2013 2013-2014 2014-2015
ARCHITECTURE 26 21 28 33 31 55 69 80 68
CWE INTERDISCIPLINARY STUDIES 1 6 9 7
EDUCATION 499 468 537 598 596 452 460 378 295
ENGINEERING 153 143 184 145 145 139 194 147 136
HUMANITIES & ARTS 78 99 65 80 82 93 105 156 120
POWELL SCHOOL 113 102 76 94 143 103 119 104 124
SCIENCES 29 38 28 34 46 35 48 81 78
Total 898 871 918 984 1043 878 1001 955 828

1Source: CUNY OIRA Institutional Research Data Base [IRDB]
Table 22b: Degrees Awarded 2005-2006 through 2013-2014 by School/Division & Gender 1
1Source: CUNY OIRA Institutional Research Data Base [IRDB]
Table 22b: Degrees Awarded 2005-2006 through 2013-2014 by School/Division & Gender 1
Degree_Earned_Level_Desc=ADVANCED CERTIFICATE
Division or School byMajor & Gender 2006-2007 2007-2008 2008-2009 2009-2010 2010-2011 2011-2012 2012-2013 2013-2014 2014-2015
EDUCATION Men 1 5 3 2 1 1 1
Women 4 1 5 2 6 3 5 4
ENGINEERING Men 1 2 1 2 1
Women 1 1
HUMANITIES & ARTS Men 1
Total 6 9 1 8 4 8 4 9 5

1Source: CUNY OIRA Institutional Research Data Base [IRDB]
Table 22b: Degrees Awarded 2005-2006 through 2013-2014 by School/Division & Gender 1
1Source: CUNY OIRA Institutional Research Data Base [IRDB]
Table 22b: Degrees Awarded 2005-2006 through 2013-2014 by School/Division & Gender 1
Degree_Earned_Level_Desc=BACHELOR'S
Division or School by Major & Gender 2006-2007 2007-2008 2008-2009 2009-2010 2010-2011 2011-2012 2012-2013 2013-2014 2014-2015
ARCHITECTURE Men 37 35 31 35 26 44 30 32 19
Women 35 23 20 26 14 27 29 25 22
CWE INTERDISCIPLINARY STUDIES Men 32 32 25 25 29 28 23 21 27
Women 121 138 138 119 154 140 127 99 110
EDUCATION Men 5 5 3 5 2 14 6 6 8
Women 36 29 25 34 61 54 70 104 71
ENGINEERING Men 167 188 189 239 203 203 217 231 238
Women 43 66 38 37 35 28 47 48 46
HUMANITIES & ARTS Men 20 27 32 33 38 42 61 206 205
Women 8 18 15 17 26 28 35 279 323
POWELL SCHOOL Men 116 116 126 180 233 196 211 250 275
Women 179 205 248 257 339 406 360 440 481
SCIENCES Men 42 71 69 62 77 77 100 123 131
Women 46 55 48 72 77 84 111 124 122
SOPHIE DAVIS/BIOMED Men 33 40 15 30 36 48 28 32 28
Women 52 45 58 55 59 43 49 49 50
Total 972 1093 1080 1226 1409 1462 1504 2069 2156

1Source: CUNY OIRA Institutional Research Data Base [IRDB]
Table 22b: Degrees Awarded 2005-2006 through 2013-2014 by School/Division & Gender 1
1Source: CUNY OIRA Institutional Research Data Base [IRDB]
Table 22b: Degrees Awarded 2005-2006 through 2013-2014 by School/Division & Gender 1
Degree_Earned_Level_Desc=DOCTORAL
Division or School byMajor & Gender 2011-2012 2012-2013 2013-2014 2014-2015
ENGINEERING Men 1 7 12 25
Women 1 2 5 8
Total 2 9 17 33

1Source: CUNY OIRA Institutional Research Data Base [IRDB]
Table 22b: Degrees Awarded 2005-2006 through 2013-2014 by School/Division & Gender 1
1Source: CUNY OIRA Institutional Research Data Base [IRDB]
Table 22b: Degrees Awarded 2005-2006 through 2013-2014 by School/Division & Gender 1
Degree_Earned_Level_Desc=MASTER'S
Division or School by Major & Gender 2006-2007 2007-2008 2008-2009 2009-2010 2010-2011 2011-2012 2012-2013 2013-2014 2014-2015
ARCHITECTURE Men 14 9 15 16 17 30 40 38 27
Women 12 12 13 17 14 25 29 42 41
CWE INTERDISCIPLINARY STUDIES Men 1 3 2 2
Women 3 7 5
EDUCATION Men 163 152 150 188 179 132 125 90 80
Women 336 316 387 410 417 320 335 288 215
ENGINEERING Men 128 111 135 107 105 111 138 105 98
Women 25 32 49 38 40 28 56 42 38
HUMANITIES & ARTS Men 42 51 36 36 37 42 57 74 53
Women 36 48 29 44 45 51 48 82 67
POWELL SCHOOL Men 55 42 34 30 49 31 42 41 45
Women 58 60 42 64 94 72 77 63 79
SCIENCES Men 17 25 21 21 26 19 25 53 42
Women 12 13 7 13 20 16 23 28 36
Total 898 871 918 984 1043 878 1001 955 828

1Source: CUNY OIRA Institutional Research Data Base [IRDB]
Table 22b: Degrees Awarded 2005-2006 through 2013-2014 by School/Division & Gender 1
1Source: CUNY OIRA Institutional Research Data Base [IRDB]
Table 22b: Degrees Awarded 2005-2006 through 2013-2014 by School/Division & Gender 1
Degree_Earned_Level_Desc=ADVANCED CERTIFICATE
Division or School by Major & Gender 2006-2007 2007-2008 2008-2009 2009-2010 2010-2011 2011-2012 2012-2013 2013-2014 2014-2015
EDUCATION Asian or Pacific Islander 1 1 1
Black, Non-Hispanic 3 1 1
Hispanic 1 1 1 3
Nonresident Alien 1 1 1
White, Non-Hispanic 1 5 5 4 5 1 2 4
ENGINEERING Black, Non-Hispanic 1
Hispanic 1 1
White, Non-Hispanic 1 2 1 1 1
HUMANITIES & ARTS Black, Non-Hispanic 1
Total 6 9 1 8 4 8 4 9 5

1Source: CUNY OIRA Institutional Research Data Base [IRDB]
Table 22b: Degrees Awarded 2005-2006 through 2013-2014 by School/Division & Gender 1
1Source: CUNY OIRA Institutional Research Data Base [IRDB]
Table 22b: Degrees Awarded 2005-2006 through 2013-2014 by School/Division & Gender 1
Degree_Earned_Level_Desc=BACHELOR'S
Division or School by Major & Gender 2006-2007 2007-2008 2008-2009 2009-2010 2010-2011 2011-2012 2012-2013 2013-2014 2014-2015
ARCHITECTURE Asian or Pacific Islander 14 8 5 12 3 18 10 10 11
Black, Non-Hispanic 9 7 8 8 5 7 5 4 2
Hispanic 15 13 19 14 14 11 22 16 16
Nonresident Alien 10 11 5 14 9 8 8 8 5
White, Non-Hispanic 24 19 14 13 9 27 14 19 7
CWE INTERDISCIPLINARY STUDIES American Indian or Native A 1 1 1
Asian or Pacific Islander 4 8 6 5 7 11 8 5 6
Black, Non-Hispanic 79 79 76 64 86 62 52 45 61
Hispanic 36 53 54 55 58 67 69 51 45
Nonresident Alien 4 2 1 2 1 2 3 1 5
White, Non-Hispanic 30 27 26 18 31 25 17 18 20
EDUCATION Asian or Pacific Islander 5 1 1 3 4 2 13 14 13
Black, Non-Hispanic 9 8 2 6 13 16 12 26 11
Hispanic 24 20 16 18 36 36 37 45 42
Nonresident Alien 1 1 3 3 3 6 2 6 3
White, Non-Hispanic 2 4 6 9 7 8 12 19 10
ENGINEERING American Indian or Native A 1 1 1
Asian or Pacific Islander 55 56 50 76 64 61 76 81 106
Black, Non-Hispanic 41 41 37 36 40 36 29 42 36
Hispanic 28 53 47 52 40 42 49 49 50
Nonresident Alien 49 58 54 61 39 51 50 45 44
(Continued)

1Source: CUNY OIRA Institutional Research Data Base [IRDB]
Table 22b: Degrees Awarded 2005-2006 through 2013-2014 by School/Division & Gender 1
Degree_Earned_Level_Desc=BACHELOR'S
Division or School by Major & Gender 2006-2007 2007-2008 2008-2009 2009-2010 2010-2011 2011-2012 2012-2013 2013-2014 2014-2015
White, Non-Hispanic 37 46 38 51 54 41 59 62 48ENGINEERING
HUMANITIES & ARTS American Indian or Native A 1 1
Asian or Pacific Islander 6 9 6 9 6 7 15 60 49
Black, Non-Hispanic 6 9 10 9 8 13 22 137 139
Hispanic 4 12 12 12 17 22 30 146 175
Nonresident Alien 4 3 4 4 9 8 5 26 39
White, Non-Hispanic 8 12 15 16 24 20 24 115 125
POWELL SCHOOL American Indian or Native A 2 1 4 1 1
Asian or Pacific Islander 30 42 43 75 79 74 76 132 145
Black, Non-Hispanic 91 110 125 112 169 177 168 153 206
Hispanic 118 89 100 148 197 221 195 233 256
Nonresident Alien 22 32 43 41 42 40 43 37 38
White, Non-Hispanic 34 48 61 61 84 86 89 134 110
SCIENCES American Indian or Native A 1 2 1
Asian or Pacific Islander 15 23 29 40 42 41 57 90 93
Black, Non-Hispanic 29 31 38 33 44 45 38 46 44
Hispanic 13 26 13 20 21 27 50 44 39
Nonresident Alien 12 27 13 13 19 19 23 20 26
White, Non-Hispanic 19 19 23 28 28 29 43 45 50
(Continued)

1Source: CUNY OIRA Institutional Research Data Base [IRDB]
Table 22b: Degrees Awarded 2005-2006 through 2013-2014 by School/Division & Gender 1
Degree_Earned_Level_Desc=BACHELOR'S
Division or School by Major & Gender 2006-2007 2007-2008 2008-2009 2009-2010 2010-2011 2011-2012 2012-2013 2013-2014 2014-2015
SOPHIE DAVIS/BIOMED American Indian or Native A 1
Asian or Pacific Islander 30 28 17 28 26 22 18 20 17
Black, Non-Hispanic 19 29 21 19 31 26 22 23 30
Hispanic 9 4 11 17 11 14 13 17 10
Nonresident Alien 1 1 1 1 1
White, Non-Hispanic 27 23 23 20 26 28 24 20 21
Total 972 1093 1080 1226 1409 1462 1504 2069 2156

1Source: CUNY OIRA Institutional Research Data Base [IRDB]
Table 22b: Degrees Awarded 2005-2006 through 2013-2014 by School/Division & Gender 1
1Source: CUNY OIRA Institutional Research Data Base [IRDB]
Table 22b: Degrees Awarded 2005-2006 through 2013-2014 by School/Division & Gender 1
Degree_Earned_Level_Desc=DOCTORAL
Division or School by Major & Gender 2011-2012 2012-2013 2013-2014 2014-2015
ENGINEERING Asian or Pacific Islander 1 3 2
Black, Non-Hispanic 1 2
Hispanic 1 1 2
Nonresident Alien 1 4 8 16
White, Non-Hispanic 3 3 13
Total 2 9 17 33

1Source: CUNY OIRA Institutional Research Data Base [IRDB]
Table 22b: Degrees Awarded 2005-2006 through 2013-2014 by School/Division & Gender 1
1Source: CUNY OIRA Institutional Research Data Base [IRDB]
Table 22b: Degrees Awarded 2005-2006 through 2013-2014 by School/Division & Gender 1
Degree_Earned_Level_Desc=MASTER'S
Division or School by Major & Gender 2006-2007 2007-2008 2008-2009 2009-2010 2010-2011 2011-2012 2012-2013 2013-2014 2014-2015
ARCHITECTURE Asian or Pacific Islander 2 1 2 3 2 4 4 5
Black, Non-Hispanic 5 1 4 5 4 5 9 10 9
Hispanic 1 1 2 1 3 3 8 9 8
Nonresident Alien 5 6 7 4 8 17 16 11 7
White, Non-Hispanic 13 13 14 21 13 28 32 46 39
CWE INTERDISCIPLINARY STUDIES Black, Non-Hispanic 3 2 3
Hispanic 1 1 4 3
Nonresident Alien 1 1
White, Non-Hispanic 2 2
EDUCATION Asian or Pacific Islander 12 22 31 35 19 19 27 17 18
Black, Non-Hispanic 108 101 142 116 115 90 79 75 65
Hispanic 104 57 81 108 115 82 105 109 72
Nonresident Alien 8 9 12 20 13 15 14 11 13
White, Non-Hispanic 267 279 271 319 334 246 235 166 127
ENGINEERING Asian or Pacific Islander 17 17 13 17 20 21 43 12 31
Black, Non-Hispanic 16 20 14 10 17 12 17 22 12
Hispanic 10 3 4 7 12 12 18 19 14
Nonresident Alien 85 92 126 88 64 56 73 51 38
White, Non-Hispanic 25 11 27 23 32 38 43 43 41
(Continued)

1Source: CUNY OIRA Institutional Research Data Base [IRDB]
Table 22b: Degrees Awarded 2005-2006 through 2013-2014 by School/Division & Gender 1
Degree_Earned_Level_Desc=MASTER'S
Division or School by Major & Gender 2006-2007 2007-2008 2008-2009 2009-2010 2010-2011 2011-2012 2012-2013 2013-2014 2014-2015
HUMANITIES & ARTS American Indian or Native A 1 1 1
Asian or Pacific Islander 6 6 1 5 3 3 6 8 1
Black, Non-Hispanic 12 19 8 10 13 13 18 25 22
Hispanic 11 12 11 13 12 20 15 24 18
Nonresident Alien 7 13 5 11 10 9 14 16 31
White, Non-Hispanic 42 49 40 41 44 47 52 82 47
POWELL SCHOOL American Indian or Native A 1 1
Asian or Pacific Islander 5 6 1 2 9 4 12 7 10
Black, Non-Hispanic 24 24 14 24 24 19 31 23 22
Hispanic 7 6 4 13 20 21 13 17 19
Nonresident Alien 38 28 27 30 26 18 25 14 27
White, Non-Hispanic 39 38 30 25 63 41 38 43 45
SCIENCES American Indian or Native A 1
Asian or Pacific Islander 6 5 4 4 9 4 5 12 13
Black, Non-Hispanic 3 6 4 2 8 11 3 11 18
Hispanic 1 4 2 4 6 3 8 5 10
Nonresident Alien 7 6 8 8 12 9 16 7 5
White, Non-Hispanic 12 17 10 15 11 8 16 46 32
Total 898 871 918 984 1043 878 1001 955 828

3Source: CUNY OIRA Institutional Research Data Base [IRDB]
2Permit students from other colleges & Advanced Certificate students are included.
1Students withdrawn from or not attending all courses are excluded.
Table 23a: Fall 2006-2015 Masters & Doctoral Enrollment by Full/Part-time 1-3
3Source: CUNY OIRA Institutional Research Data Base [IRDB]
2Permit students from other colleges & Advanced Certificate students are included.
1Students withdrawn from or not attending all courses are excluded.
Table 23a: Fall 2006-2015 Masters & Doctoral Enrollment by Full/Part-time 1-3
Level=DOCTORAL
Level & Part/Full-timeStatus
Fall Terms & Part/Full-time Status
Fall2008
Fall2009 Fall 2010 Fall 2011 Fall 2012 Fall 2013 Fall 2014 Fall 2015
N % N % N % N % N % N % N % N %
DOCTORAL FULL-TIME 9 36.0 23 34.8 39 33.6 35 23.3 43 24.2 33 17.5 32 15.1 30 15.2
PART-TIME 16 64.0 43 65.2 77 66.4 115 76.7 135 75.8 156 82.5 180 84.9 167 84.8
Total 25 100.0 66 100.0 116 100.0 150 100.0 178 100.0 189 100.0 212 100.0 197 100.0
Level=MASTER'S
Level & Part/Full-timeStatus
Fall Terms & Part/Full-time Status
Fall 2006 Fall 2007 Fall 2008 Fall 2009 Fall 2010 Fall 2011 Fall 2012 Fall 2013 Fall 2014 Fall 2015
N % N % N % N % N % N % N % N % N % N %
MASTER'S FULL-TIME 246 8.4 265 8.2 291 8.8 350 10.7 411 13.5 411 13.7 431 15.0 414 15.6 383 15.3 346 14.5
PART-TIME 2,684 91.6 2,957 91.8 3,020 91.2 2,932 89.3 2,642 86.5 2,590 86.3 2,439 85.0 2,232 84.4 2,113 84.7 2,048 85.5
Total 2,930 100.0 3,222 100.0 3,311 100.0 3,282 100.0 3,053 100.0 3,001 100.0 2,870 100.0 2,646 100.0 2,496 100.0 2,394 100.0

3Source: CUNY OIRA Institutional Research Data Base [IRDB]
2Permit students from other colleges & Advanced Certificate students are included.
1Students withdrawn from or not attending all courses are excluded.
3Source: CUNY OIRA Institutional Research Data Base [IRDB]
2Permit students from other colleges & Advanced Certificate students are included.
1Students withdrawn from or not attending all courses are excluded.
Table 23b: Fall 2006-2015 Graduate Enrollment by Full/Part-time & Gender 1-3
Level=DOCTORAL
Gender, Level & Full Part-Time
Term_Enrolled_Date
Fall2008
Fall2009 Fall 2010 Fall 2011 Fall 2012 Fall 2013 Fall 2014 Fall 2015
N % N % N % N % N % N % N % N %
Men DOCTORAL FULL-TIME 8 88.9 19 82.6 30 76.9 26 74.3 31 72.1 21 63.6 19 59.4 20 66.7
PART-TIME 8 50.0 26 60.5 51 66.2 78 67.8 90 66.7 104 66.7 125 69.4 113 67.7
Women DOCTORAL FULL-TIME 1 11.1 4 17.4 9 23.1 9 25.7 12 27.9 12 36.4 13 40.6 10 33.3
PART-TIME 8 50.0 17 39.5 26 33.8 37 32.2 45 33.3 52 33.3 55 30.6 54 32.3
Total 25 100.0 66 100.0 116 100.0 150 100.0 178 100.0 189 100.0 212 100.0 197 100.0
Level=MASTER'S
Gender, Level & Full Part-Time
Term_Enrolled_Date
Fall 2006 Fall 2007 Fall 2008 Fall 2009 Fall 2010 Fall 2011 Fall 2012 Fall 2013 Fall 2014 Fall 2015
N % N % N % N % N % N % N % N % N % N %
Men MASTER'S FULL-TIME 132 53.7 135 50.9 144 49.5 159 45.4 189 46.0 180 43.8 208 48.3 189 45.7 184 48.0 177 51.2
PART-TIME 1,134 42.3 1,260 42.6 1,172 38.8 1,131 38.6 1,054 39.9 1,062 41.0 963 39.5 887 39.7 847 40.1 780 38.1
Women MASTER'S FULL-TIME 114 46.3 130 49.1 147 50.5 191 54.6 222 54.0 231 56.2 223 51.7 225 54.3 199 52.0 169 48.8
PART-TIME 1,550 57.7 1,697 57.4 1,848 61.2 1,801 61.4 1,588 60.1 1,528 59.0 1,476 60.5 1,345 60.3 1,266 59.9 1,268 61.9
Total 2,930 100.0 3,222 100.0 3,311 100.0 3,282 100.0 3,053 100.0 3,001 100.0 2,870 100.0 2,646 100.0 2,496 100.0 2,394 100.0

3Source: CUNY OIRA Institutional Research Data Base [IRDB]
2Permit students from other colleges & Advanced Certificate students are included.
1Students withdrawn from or not attending all courses are excluded.
3Source: CUNY OIRA Institutional Research Data Base [IRDB]
2Permit students from other colleges & Advanced Certificate students are included.
1Students withdrawn from or not attending all courses are excluded.
Table 23c: Fall 2006-2015 Graduate Enrollment by Full/Part-time & Degree/Nondegree 1-3
Degree_Status_Desc=DEGREE
Full Part-Time
Term_Enrolled_Date
Fall 2006 Fall 2007 Fall 2008 Fall 2009 Fall 2010 Fall 2011 Fall 2012 Fall 2013 Fall 2014 Fall 2015
N % N % N % N % N % N % N % N % N % N %
DEGREE FULL-TIME 218 100.0 249 100.0 285 100.0 369 100.0 447 100.0 438 100.0 471 100.0 445 100.0 410 100.0 375 100.0
PART-TIME 2,389 100.0 2,627 100.0 2,645 100.0 2,587 100.0 2,411 100.0 2,321 100.0 2,242 100.0 2,188 100.0 2,073 100.0 2,007 100.0
Total 2,607 100.0 2,876 100.0 2,930 100.0 2,956 100.0 2,858 100.0 2,759 100.0 2,713 100.0 2,633 100.0 2,483 100.0 2,382 100.0
Degree_Status_Desc=NONDEGREE
Full Part-Time
Term_Enrolled_Date
Fall 2006 Fall 2007 Fall 2008 Fall 2009 Fall 2010 Fall 2011 Fall 2012 Fall 2013 Fall 2014 Fall 2015
N % N % N % N % N % N % N % N % N % N %
NONDEGREE FULL-TIME 28 100.0 16 100.0 15 100.0 4 100.0 3 100.0 8 100.0 3 100.0 2 100.0 5 100.0 1 100.0
PART-TIME 295 100.0 330 100.0 391 100.0 388 100.0 308 100.0 384 100.0 332 100.0 200 100.0 220 100.0 208 100.0
Total 323 100.0 346 100.0 406 100.0 392 100.0 311 100.0 392 100.0 335 100.0 202 100.0 225 100.0 209 100.0

Enr
ollm
ent
100
600
1100
1600
2100
2600
3100
3600
4100
Fall Terms
2006 2007 2008 2009 2010 2011 2012 2013 2014 2015
Full-time
Part-time
Women
Men
Total
Graph 23: Graduate Enrollment, 2006-2015Full/Part-time, Women/Men includes DOCTORAL students as does the total

Enr
ollm
ent
100
600
1100
1600
2100
2600
3100
3600
4100
Fall Terms
2006 2007 2008 2009 2010 2011 2012 2013 2014 2015
Full-time
Part-time
Women
Men
Total

1Sources: CUNY Institutional Research Database [IRDB]
1Sources: CUNY Institutional Research Database [IRDB]
Table 24: Fall 2006-2015 Graduate (Masters and Certificate) & PHDs by Major 1
In Fall 2008 All PHD Students were Coded PHD' 1
College Program TitleFall Terms
Fall 2006 Fall 2007 Fall 2008 Fall 2009 Fall 2010 Fall 2011 Fall 2012 Fall 2013 Fall 2014 Fall 2015
ADMINISITRATIVE-NON-DEGREE & PERMIT STUDENTS 307 335 389 387 306 387 326 201 225 209
ALT CERT MDL SCH SC 14 87 41 65 29 4
APPLIED URBAN ANTHROPOLOGY 3 2
ARCHITECTURE B-ARCH 46 62 64 75 89 115 122 111 66 68
ARCHITECTURE II 1 1 3 7 4
ARCHITECTURE SUSTAINABILITY IN THE URBAN ENVIRONMENT MS 22 39 55 66 70 70
ART 27 31 41 34 54 55 41 58
ART (MFA) 22 20 13 12 12 16 13 13
ART HISTORY 52 50
ART(MFA) 17 24
BIOCHEMISTRY 10 13 8 6 10 16 11 10 9 7
BIOLOGY 17 17 15 27 21 21 36 46 35 25
BIOLOGY BS-MA 1 5 1
BIOTECHNOLOGY 1 4
BRANDING & INTEGRTD 31 60 62
CHEMISTRY 8 19 19 26 16 13 15 12
COMPUTER SCIENCE 134 170 122 100 78 87 62 59
CREATIVE WRITING 88 92
CREATIVE WRITING MA 143 122 115 111 115 119 130 114
CWE STDY OF AMERICAS 17 25 27 25 31 23
(Continued)

1Sources: CUNY Institutional Research Database [IRDB]
Table 24: Fall 2006-2015 Graduate (Masters and Certificate) & PHDs by Major 1
In Fall 2008 All PHD Students were Coded PHD' 1
College Program TitleFall Terms
Fall 2006 Fall 2007 Fall 2008 Fall 2009 Fall 2010 Fall 2011 Fall 2012 Fall 2013 Fall 2014 Fall 2015
DGTL & INTERDISCP CERT 6 14 16 17
EARTH SYS & ENV SCI & TEC 6 12 10
ECONOMICS 71 60 59 59 52 67 70 49 54 62
ED THTR PROF CERT M 1
EDUCATION BILINGUAL SPEC ED 12 21 25 46 39 26 32 34 15 10
EDUCATION ALT CRT BILINGUAL CHILDHOOD 2 11 17 11 5 1
EDUCATION ART K-12 TEACHER 25 25 20 22 24 27 23 26 22 38
EDUCATION BILINGUAL CHILDHD ED 17 20 19 20 27 17 33 28 23 22
EDUCATION BILINGUAL CHILDHOOD CERT 17 30
EDUCATION BILINGUAL ED (ITI) 9 2
EDUCATION BILINGUAL EXTENSION 3 8 5 8 14 15 9 16 13 8
EDUCATION BILINGUAL EXTENSION-ELEMENTARY MSED 1 1
EDUCATION BILINGUAL SP ED 7-12 CERT 1
EDUCATION BIOLOGY ADV CRT 1 1 1
EDUCATION BIOLOGY TRANS B MA 67 58 102 39 9 2 1
EDUCATION CHEMISTRY ADV CRT 2 1
EDUCATION CHEMISTRY MA 6 3 8 5 3 4 3 5
EDUCATION CHEMISTRY TRANS B MA 16 15 24 7 3 1
EDUCATION CHILD CRT 6 4 3
EDUCATION CHILDHOOD ED 1-6 1 1
(Continued)

1Sources: CUNY Institutional Research Database [IRDB]
Table 24: Fall 2006-2015 Graduate (Masters and Certificate) & PHDs by Major 1
In Fall 2008 All PHD Students were Coded PHD' 1
College Program TitleFall Terms
Fall 2006 Fall 2007 Fall 2008 Fall 2009 Fall 2010 Fall 2011 Fall 2012 Fall 2013 Fall 2014 Fall 2015
EDUCATION CHILDHOOD EDUCATION 109 118 99 82 74 77 74 66 60 64
EDUCATION EARLY CHILD 1-6 8 31 47 35 13 5
EDUCATION EARLY CHILDHOOD 108 102 113 107 125 135 122 120 112 92
EDUCATION EARTH SCIENCE TRANS B MA 10 11 21 9 1
EDUCATION EAS MA 2 2 2 4 2 2 2
EDUCATION ED THEATER 16 51 65 75 65 62 26 31
EDUCATION ED THTR NON CERT 11 7
EDUCATION ELEMENTARY MSED 1 1 1 1 1
EDUCATION ENGLISH 7-12 19 28 28 39 30 24 23 29 4 2
EDUCATION ENGLISH 7-12 CRT 13 38 51 21 9 2 1
EDUCATION ENGLISH ADV CRT 5 1 3 3 2
EDUCATION ENTRY LEVELLDR CERT 25 5 6 3 6 4 4 7 6
EDUCATION ESL MS 1
EDUCATION LIT BIRTH-6 MSED 57 54 59 53 35 23 21 13
EDUCATION LITERACY 5-12 MSED 29 22 26 22 12 5 6 4
EDUCATION LITERACY BIRTH-G 15 14
EDUCATION LITERACY GR 5-12 3
EDUCATION MATH ADV CRT 1 1 1 1 1 1
EDUCATION MATH MA 25 16 19 27 28 31 54 41
EDUCATION MATH TRANS B 42 47 48 37 19 5 1
(Continued)

1Sources: CUNY Institutional Research Database [IRDB]
Table 24: Fall 2006-2015 Graduate (Masters and Certificate) & PHDs by Major 1
In Fall 2008 All PHD Students were Coded PHD' 1
College Program TitleFall Terms
Fall 2006 Fall 2007 Fall 2008 Fall 2009 Fall 2010 Fall 2011 Fall 2012 Fall 2013 Fall 2014 Fall 2015
EDUCATION MDL SCHL MTH ED SPC 20 14
EDUCATION MID SCH MATH 273 11 13 13 26 52 51 42 20
EDUCATION MID SCH MATH TRANS B 250 252 207 117 41 7 1
EDUCATION MIDDLE SCHL SCI EDU 18 17
EDUCATION PHYSICS CERT 5 1 5 3 1
EDUCATION PHYSICS MA 1 2 2 2 4 5 4 4
EDUCATION SCHL BUILD LDRSHIP 16 39 60 53 58 48 42 49 45 42
EDUCATION SCHOOL ADMIN/SUPER 34 9 1 1
EDUCATION SCHOOL ADMIN/SUPER ADV CRT 5 4 1
EDUCATION SCHOOL DIST ADMIN 2
EDUCATION SCHOOL DIST LEADERSHIP MSED 5 5 2 5 2 1
EDUCATION SCIENCE ED BIOLOG 13 18 13 8 11 12 11 16 21 18
EDUCATION SCIENCE MID SCH 15 11 9 29 18 12 17 10
EDUCATION SECONDARY ED SOC STUDIES ADV CRT 2 1 2 2 1
EDUCATION SOC STUDIES 20 16 10 16 23 27 17 19
EDUCATION SOCIAL STUDIES ED 19 14
EDUCATION SOCIAL STUDIES TRANS B MA 4 3 1 1
EDUCATION SPAN 7-12 (NON-SPAN) 5 3 11 13 8
EDUCATION SPAN 7-12(SPAN MAJ) 5 10 10 11 10
EDUCATION SPAN 7-12(SPAN-CERT) 3 2 2 1
(Continued)

1Sources: CUNY Institutional Research Database [IRDB]
Table 24: Fall 2006-2015 Graduate (Masters and Certificate) & PHDs by Major 1
In Fall 2008 All PHD Students were Coded PHD' 1
College Program TitleFall Terms
Fall 2006 Fall 2007 Fall 2008 Fall 2009 Fall 2010 Fall 2011 Fall 2012 Fall 2013 Fall 2014 Fall 2015
EDUCATION SPECIAL ED MSED 1 1
EDUCATION STUDENTS WITH DISABILITIES GRADES 7-12 29 3
EDUCATION TCH ENG/SPKRS/OTH LANGS TRANS B MS 68 80 83 48 6 1 24 22
EDUCATION TCH ENGLISH/SPKRS 63 69 69 87 82 83 81 83 84 125
EDUCATION TCH ST W/DIS MI CERT 242 300 408 469 402 308 256 185 4
EDUCATION TCH STDS W/DIS IN MID CHLD 17 4
EDUCATION TCH STUD W/DIS 111 61
EDUCATION TCHG SWD 7-12 126 147
EDUCATION TCHG SWD 7-12 GENERALIST 29 51
EDUCATION TESOL ADV CERT 4 1
ENGINEER BIOMEDICAL 21 22 30 33 40 38 27 21 20 16
ENGINEER BIOMEDICAL PHD 10 21 26 34 36 39 38
ENGINEER CHEMICAL 16 27 32 32 24 10 8 13 26 26
ENGINEER CHEMICAL ADV CERT 4 6
ENGINEER CHEMICAL CERT 4
ENGINEER CHEMICAL PHD 13 25 34 39 43 39 42
ENGINEER CIVIL 72 76 83 91 114 118 128 104 112 121
ENGINEER CIVIL PHD 12 18 23 33 37
ENGINEER COMPUTER 70 68
ENGINEER ELECTRICAL 99 150 109 108 118 98 88 78 74 77
(Continued)
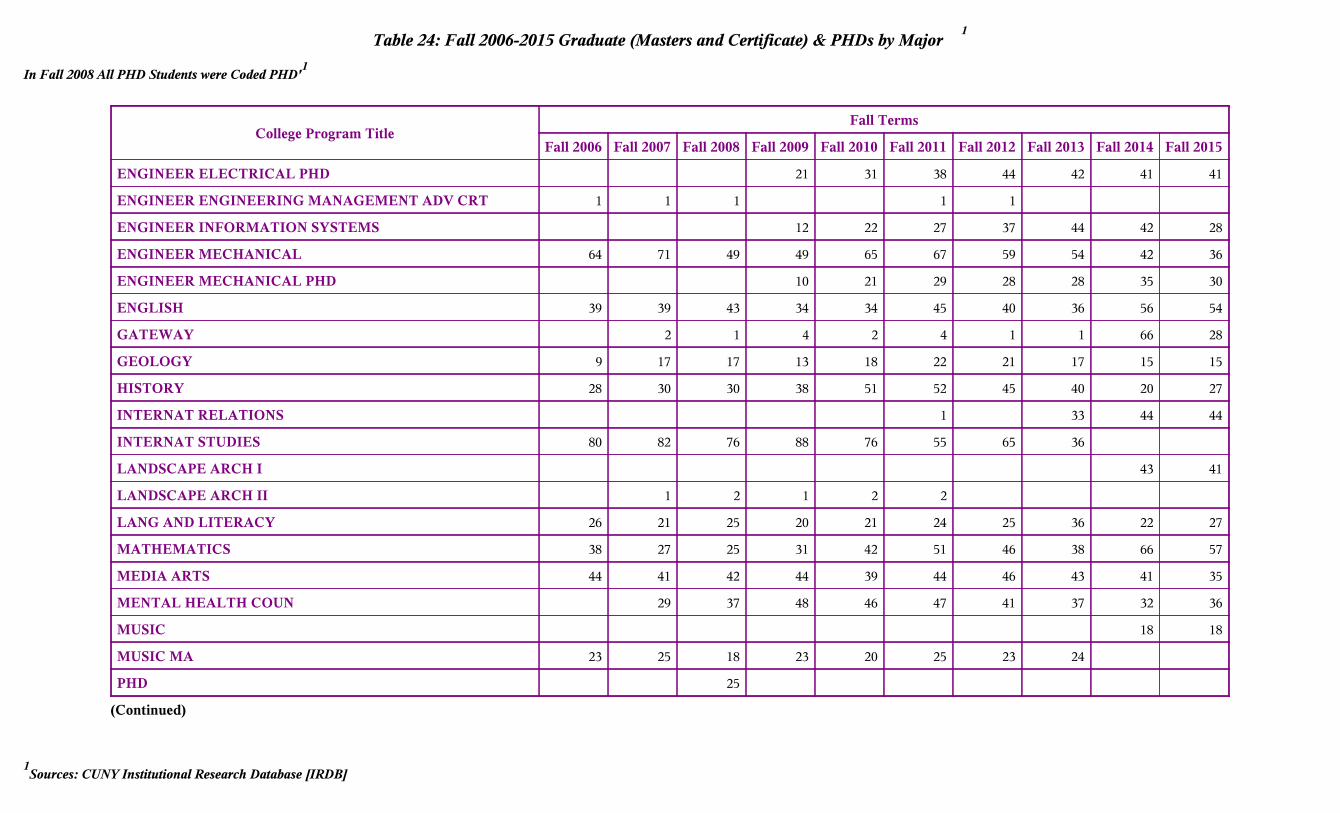
1Sources: CUNY Institutional Research Database [IRDB]
Table 24: Fall 2006-2015 Graduate (Masters and Certificate) & PHDs by Major 1
In Fall 2008 All PHD Students were Coded PHD' 1
College Program TitleFall Terms
Fall 2006 Fall 2007 Fall 2008 Fall 2009 Fall 2010 Fall 2011 Fall 2012 Fall 2013 Fall 2014 Fall 2015
ENGINEER ELECTRICAL PHD 21 31 38 44 42 41 41
ENGINEER ENGINEERING MANAGEMENT ADV CRT 1 1 1 1 1
ENGINEER INFORMATION SYSTEMS 12 22 27 37 44 42 28
ENGINEER MECHANICAL 64 71 49 49 65 67 59 54 42 36
ENGINEER MECHANICAL PHD 10 21 29 28 28 35 30
ENGLISH 39 39 43 34 34 45 40 36 56 54
GATEWAY 2 1 4 2 4 1 1 66 28
GEOLOGY 9 17 17 13 18 22 21 17 15 15
HISTORY 28 30 30 38 51 52 45 40 20 27
INTERNAT RELATIONS 1 33 44 44
INTERNAT STUDIES 80 82 76 88 76 55 65 36
LANDSCAPE ARCH I 43 41
LANDSCAPE ARCH II 1 2 1 2 2
LANG AND LITERACY 26 21 25 20 21 24 25 36 22 27
MATHEMATICS 38 27 25 31 42 51 46 38 66 57
MEDIA ARTS 44 41 42 44 39 44 46 43 41 35
MENTAL HEALTH COUN 29 37 48 46 47 41 37 32 36
MUSIC 18 18
MUSIC MA 23 25 18 23 20 25 23 24
PHD 25
(Continued)

1Sources: CUNY Institutional Research Database [IRDB]
Table 24: Fall 2006-2015 Graduate (Masters and Certificate) & PHDs by Major 1
In Fall 2008 All PHD Students were Coded PHD' 1
College Program TitleFall Terms
Fall 2006 Fall 2007 Fall 2008 Fall 2009 Fall 2010 Fall 2011 Fall 2012 Fall 2013 Fall 2014 Fall 2015
PHYSICS 9 12 13 11 19 23 19 18 20 23
PSYCHOLOGY 114 86 73 65 73 78 68 72 71 62
PUBLIC SERVICE MGT 18 40 39 40 33 37 44 39
SOCIOLOGY 18 18 19 18 24 31 32 25 18 10
SPANISH 32 25
SPANISH MA 63 59 59 50 40 34 30 32
TCH STDTS W/DIS 1-6 1
TRANSLATIONAL MEDIC 4
URBAN DESIGN 9 13 14 10 13 11 11 14 12 12
Total 2930 3222 3336 3348 3169 3151 3048 2835 2708 2591

3Sources: CUNY OIRA IRDB Graduate Files.
2In 2009-2010, the CUNY OIRA IRDB did not include 8 Engineering Interdepartmental [IEP] degrees.
1The 5-year Architecture degree has been removed from this table. It is a bachelor's degree.
Table 25a: Graduate Degrees Awarded by Division/School 2006-07 through 2014-15 1-3
DegreesAcademic Year
2006-2007 2007-2008 2008-2009 2009-2010 2010-2011 2011-2012 2012-2013 2013-2014 2014-2015
ARCHITECTURE 26 21 28 33 31 55 69 80 68
CWE INTERDISCIPLINARY STUDIES 1 6 9 7
EDUCATION 504 474 537 606 600 459 464 384 299
ENGINEERING 154 146 185 145 145 142 203 166 170
HUMANITIES & ARTS 120 140 99 111 110 124 133 158 120
POWELL SCHOOL 113 102 76 94 143 103 119 104 124
SCIENCES 29 38 28 34 46 35 48 81 78
Total 946 921 953 1,023 1,075 919 1,042 982 866

3Sources: CUNY OIRA IRDB Graduate Files.
2In 2009-2010, the CUNY OIRA IRDB did not include 8 Engineering Interdepartmental [IEP] degrees.
1The 5-year Architecture degree has been removed from this table. It is a bachelor's degree.
Table 25b: Graduate Degrees Awarded by Division/School by Ethnicity with Non-Residents 2006-07 through 2014-15 1-3
In 2006-07 through 2014-15 IPEDS' Ethnicity Categories for Graduate Degrees are not in the IRDB - as yet
Division/SchoolAcademic Year
2006-2007 2007-2008 2008-2009 2009-2010 2010-2011 2011-2012 2012-2013 2013-2014 2014-2015
ARCHITECTURE Asian or Pacific Islander 2 1 2 3 2 4 4 5
Black, Non-Hispanic 5 1 4 5 4 5 9 10 9
Hispanic 1 1 2 1 3 3 8 9 8
Nonresident Alien 5 6 7 4 8 17 16 11 7
White, Non-Hispanic 13 13 14 21 13 28 32 46 39
CWE INTERDISCIPLINARY STUDIES Black, Non-Hispanic 3 2 3
Hispanic 1 1 4 3
Nonresident Alien 1 1
White, Non-Hispanic 2 2
EDUCATION Asian or Pacific Islander 12 23 31 35 19 20 28 17 18
Black, Non-Hispanic 111 101 142 117 115 91 79 75 65
Hispanic 105 57 81 109 115 82 106 112 72
Nonresident Alien 8 9 12 21 13 15 15 12 13
White, Non-Hispanic 268 284 271 324 338 251 236 168 131
ENGINEERING Asian or Pacific Islander 17 17 13 17 20 21 44 15 33
Black, Non-Hispanic 16 21 14 10 17 13 17 24 12
Hispanic 10 3 4 7 12 13 19 21 16
Nonresident Alien 85 92 126 88 64 57 77 59 54
White, Non-Hispanic 26 13 28 23 32 38 46 47 55
(Continued)

Data Sources and Interpretation of the Statistical Tables
CITY FACTS information comes from several different sources*:
A: The Show Data comes from information in the CUNY OIRA Institutional Research Data Base [IRDB] and from the CUNYFIRST Data Base. The data represents the College's enrollment at the end of the third week of each semester and is a “fixed” or “frozen” data file. [This time was established by the federal government as the official time for all institutions of higher education for their reporting. It was done to make comparisons possible.] It is used by the City University of New York (CUNY) Central Office’s official enrollment statistical source in preparing reports for the New York State Education Department (NYSED), the National Center for Education Statistics (NCES), the Integrated Postsecondary Education Data System (IPEDS) as well as reports for other government agencies. CUNY’s statistical treatment of enrollment and course data for the Show Data follows:
l) Students who registered, but withdrew prior to the end of the third week in the semester are excluded. Changesmade by Records and Registration after the third week, are not reflected in these tables.
2) Permit students, (i.e., students who are taking classes at CCNY), but are getting their degrees from another CUNYcollege, are included in the computation of full-time equivalent (FTE – see Technical Note “FTE calculation“) students and are included in the CCNY enrollment head count. CUNY credits them to their home college. Thus their number differs from those in City Facts.
3) CUNY BA students are handled the same way as Permit students.4) Class standing is based on total cumulative credits earned prior to the present semester. This creates the following
groups of students: Freshmen 0-30 Sophomores 31-60 Juniors 61-90 Seniors 91-120+ Graduate 0-36+
Non-degree students are put into three groups: Lower, Upper and Graduate. They are in the head count. 5) When the degree indicator is missing, the student is classified as non-degree.6) When full- or part-time status is missing, the student is classified as part-time.7) When the degree indicator shows the student is enrolled in a degree program, but class level is missing, the student
is classified as a freshman. 8) Credits generated by undergraduate students in graduate courses are counted as graduate level credits in the
calculation of student FTEs (– see Technical Note “FTE calculation“) and, conversely, credits generated by graduate students in undergraduate courses are counted as undergraduate credits.

9) Non-Resident Aliens: According to the field definitions for the Show Data, there are two categories of ForeignCitizens and Non-Resident Aliens. Both of them are included in the Non-Resident Alien category in the IPEDS reports:
A Foreign Resident who pays non-resident tuition and is not eligible for TAP. (Includes any foreign student who has lived in New York for one year and/or has not been a permanent resident [green card holder] or applied for permanent residency at least one year prior to the start of the semester.)
A Foreign Resident who pays resident tuition and is not eligible for TAP. (For example, United Nations Personnel, Temporary Resident, Permanent Resident Pending or Refugee Pending).
10) The ethnicity information in City Facts uses the CUNY OIRA Institutional Research Data Base's data. Many studentsdo not report their ethnicity, but for a number of reasons it is important to have reasonably accurate information of the actual number of students in each ethnicity category. To this end, CUNY OIRA uses a federally approved algorithm to impute ethnicity for students with missing ethnicity information. For example, supposed we have six ethnicity categories (Asian, Black, Hispanic, Native American, White, Foreign) and no information about X's ethnicity. Guessing at X's ethnicity at random carries a 16.67% probability of arriving at her actual ethnicity. Using the CUNY OIRA's algorithm based on name, address, high school and other known information, there is a 75% probability of arriving at X's actual ethnicity. For large enough groups, the numbers of students in each ethnicity category come close to the actual numbers because errors cancel each other out to a large extent.
Sources: U.S. Department of Education, National Center for Education Statistics, Integrated Postsecondary Education Data System (IPEDS) Graduation Rates and Institutional Characteristics components
The CUNY Office of Institutional Research and Analysis (OIRA) Since multiple admissions started in Fall 2002, this data comes from the IRDB.
Integrated Postsecondary Education Data System (IPEDS) A U.S. Department of Education database collected by the U.S. Department of Commerce, Bureau of the Census, for the National Center for Education Statistics (NCES).
According to IPEDS:
A Non-Resident Alien is a person who is not a citizen or national of the United States who is in this country on a temporary basis, and does not have the right to remain indefinitely.

Resident Aliens who are not citizens or nationals of the United States who have alien registration receipt cards (Form I-551/I55), and who have been lawfully admitted for permanent residence are to be reported in the appropriate racial/ethnic categories along with United States citizens. (See "A: The Show Data Non-Resident Aliens" above.)
For the 2010-2011 school year, IPEDS required Educational institutions to implement new data reporting. The old and the new definitions of ethnicity are:
Current IPEDS Reporting Categories New IPEDS Reporting Categories
1) Non-Resident Alien2) Race and Ethnicity unknown3) Black, non-Hispanic4) American Indian/Alaskan Native5) Asian/Pacific Islander6) Hispanic7) White, non-Hispanic
1) Nonresident Alien2) Race and Ethnicity unknown3) Hispanics of any race
For non-Hispanics only: 4) American Indian or Alaska Native5) Asian6) Black or African American7) Native Hawaiian or Other Pacific Islander8) White9) Two or more races
Technical Note
Level by Credits
LOWER DIVISION Freshmen:
Lower 0-15 Upper 16-30
Sophomores: Lower 31-46 Upper 47-60
UPPER Division Juniors:
Lower 61-75 Upper 76-90
Seniors: Lower 91-106 Upper 107 or more

FTE calculation FTE's are calculated by dividing total credits by 15 for Undergraduates and by 12 for Graduate students. One student taking 15 credits = 1 FTE. One 3-credit course with 10 students has a sum of 30 credits. Divide 30 by 15 to get 2 FTEs.