Embed Size (px)
Citation preview
CITY OF ATASCADERO
Community-Wide and Government Operations 2005
Baseline Greenhouse Gas Emissions Inventory
Prepared for:
SAN LUIS OBISPO AIR POLLUTION CONTROL DISTRICT ON BEHALF OF THE CITY OF ATASCADERO
Prepared by:
860 WALNUT STREET, SUITE B
SAN LUIS OBISPO, CA 93401-2725
April 2010

BASELINE GREENHOUSE GAS
EMISSIONS INVENTORY
City of Atascadero
Credits and Acknowledgements
Report prepared by PMC for the San Luis Obispo Air Pollution Control District on behalf of the
City of Atascadero.
PMC PROJECT TEAM
Tammy Seale, Project Manager
Jaime Hill, Associate Planner
Jillian Rich, Associate Planner
Scott Kaiser, Assistant Planner
WITH ASSISTANCE FROM:
Air Pollution Control District
Larry Allen, Air Pollution Control Officer
Aeron Arlin Genet, Planning and Outreach
Manager
Melissa Guise, Air Quality Specialist
Dean Carlson, Air Quality Engineer
City of Atascadero
Warren Frace, Director, Community
Development
Callie Taylor, Associate Planner,
Community Development
Geoff English, Deputy Director, Public
Works Department
Rachelle Rickard, Director, Administrative
Services
Justin Black, Public Works, Chief Plant
Operator
Lori Brickley, Finance Tech
Amanda Muether, Dispatch
County of San Luis Obispo
Janice Campbell, Agriculture Department
IWMA
Peter Cron, Analyst
Atascadero Waste Alternatives
Mike LaBarbara, Municipal Marketing
Pacific Waste Services, Inc.
Jim Wyse, President
PG&E
John Bohman, Green Communities and
Innovator Pilots
Southern California Gas Company
Colby Morrow, Environmental Affairs
Program Manager, Customer Programs
ICLEI – Local Governments for
Sustainability
Jonathan Strunin, Program Officer
Allison Culpen, Program Associate
California Air Resources Board
Tom Scheffelin, Analyst, Transportation
Analysis Section
Jon Taylor P.E., Manager, Transportation
Analysis Section

BASELINE GREENHOUSE GAS
EMISSIONS INVENTORY
City of Atascadero Page i
Table of Contents
Executive Summary ................................................................................................................... 1
1. Introduction .......................................................................................................................... 7
1.1 Purpose of a GHG Inventory ..................................................................................... 7
1.2 Climate Change – Legislative Background ............................................................... 9
1.3 The Cities for Climate Protection Campaign ............................................................12
1.4 Local Sustainability and Climate Change Mitigation Activities ..................................13
2. Community and Government Operations Inventory Methodology ........................................15
2.1 Baseline and Forecast Years ...................................................................................15
2.2 The Two Inventories: Community-wide and City Government Operations ...............15
2.3 Data Collection and Methodology ............................................................................17
2.4 Data Sources ...........................................................................................................18
2.5 Data Limitations .......................................................................................................20
2.6 Clean Air and Climate Protection Software 2009 .....................................................22
3. Community GHG Inventory Results .....................................................................................24
3.1 Community-Wide Emissions by Scope ....................................................................24
3.2 All Scope Emissions by Sector ................................................................................26
3.3 Transportation .........................................................................................................27
3.4 The Built Environment (Residential, Commercial, Industrial) ....................................29
3.5 Waste ......................................................................................................................31
3.6 Other – Off-road Agricultural Equipment ..................................................................32
3.7 Community Emissions by Source ............................................................................33
3.8 Per Capita Emissions ..............................................................................................35
4. City Government Operations GHG Emissions Inventory Results .........................................36
4.1 City Government Operations Inventory Results .......................................................36
4.2 Building Sector ........................................................................................................37
4.3 Vehicle and Transit Fleet .........................................................................................38
4.4 Employee Commute ................................................................................................39
4.5 Streetlights and Traffic Signals ................................................................................41
4.6 Water and Sewage ..................................................................................................41
4.7 Waste ......................................................................................................................43
4.8 Other – Miscellaneous Equipment ...........................................................................43
4.9 City Emissions by Source ........................................................................................43
5. Forecast ..............................................................................................................................46
6. Conclusion and Next Steps .................................................................................................48
COMMUNITY-WIDE AND
GOVERNMENT OPERATIONS 2005
Page ii City of Atascadero
List of Figures
Figure ES-1: Community GHG Emissions by Sector ................................................................ 2
Figure ES-3: City Government Portion of Community-Wide GHG Emissions ........................... 3
Figure ES-2: City Government Operations GHG Emissions by Sector ..................................... 3
Figure ES-4: 2020 and 2025 City of Atascadero Business-as-usual GHG Emissions Forecast 5
Figure ES-5: Business-as-usual Forecast in Relation to State-Recommended Reduction Targets ............................................................................................................... 6
Figure 1-1: The Greenhouse Gas Effect ............................................................................... 7
Figure 1-2: California Climate Change Emissions and Targets ...........................................10
Figure 1-3: The ICLEI Five-Milestone Process .....................................................................12
Figure 2-1: The Relationship Between Community-wide and City Government Inventories .16
Figure 2-2: GHG Emissions Scopes .....................................................................................18
Figure 3-1: 2005 Community GHG Emissions by Scope ......................................................25
Figure 3-2: 2005 Community GHG Emissions by Sector ......................................................26
Figure 3-3: Community GHG Emissions by Fuel Source ......................................................27
Figure 3-4: Built Environment GHG Emissions by Sector .....................................................29
Figure 3-5: Built Environment GHG Emissions by Source ....................................................29
Figure 3-6: Residential GHG Emissions by Source ..............................................................30
Figure 3-7: Commercial/ Industrial GHG Emissions by Source ............................................30
Figure 3-8: Waste GHG Emissions by Type .........................................................................32
Figure 3-9: Community GHG Emissions by Source ..............................................................34
Figure 4-2: City Government Operations GHG Emissions by Sector ...................................36
Figure 4-1: City Government Operations Contribution to Community-Wide GHG Emissions 36
Figure 4-3: Building GHG Emissions by Source ...................................................................37
Figure 4-4: Vehicle Fleet Fuel Consumption per Year by Type ............................................39
Figure 4-5: GHG Emissions from Wastewater Treatment Plant ...........................................42
Figure 4-6: City Government Operations GHG Emissions by Source ..................................44
Figure 4-7: City Government Operations GHG Emissions by Sector with Wastewater Treatment Plant Removed .................................................................................45
Figure 5-1: 2020 and 2025 Business-as-usual Projected Growth in Community-wide GHG Emissions ..........................................................................................................46
Figure 6-1: GHG Forecast in Relation to Reduction Targets ................................................49
BASELINE GREENHOUSE GAS
EMISSIONS INVENTORY
City of Atascadero Page iii
List of Tables
Table 2-1: Data Sources for Community Analysis, 2005 .....................................................19
Table 2-2: Data Sources for City Government Operations Analysis, 2005 ..........................20
Table 3-1: GHG Emissions Sources Included in 2005 Community Inventory by Scope and Sector ................................................................................................................24
Table 3-2: Community GHG Emissions per Sector per Scope (Metric Tons of CO2e) .........25
Table 3-3: Community GHG Emissions by Sector (Metric Tons of CO2e) ...........................27
Table 3-4: Transportation GHG Emissions by Road Type ...................................................28
Table 3-5: Transportation GHG Emissions by Fuel Source .................................................28
Table 3-6: Residential GHG Emissions by Source ..............................................................30
Table 3-7: Commercial/Industrial GHG Emissions Sources ................................................31
Table 3-8: Waste GHG Emissions by Waste Type ..............................................................32
Table 3-9: Community GHG Emissions by Source ..............................................................34
Table 4-1: 2005 City Government Operations GHG Emissions by Sector ..........................37
Table 4-2: Building Sector GHG Emissions by Source, 2005 ..............................................38
Table 4-3: Days of City Employee Travel by Commute Mode .............................................40
Table 4-4: Employee Commute VMT by Vehicle and Fuel Type .........................................41
Table 4-5: City Government Operations GHG Emissions by Source ..................................44
Appendices
Appendix A: CACP2009 Detailed Report for Community-Wide Emissions, 2005
Appendix B: CACP2009 Detailed Report for City Government Operations Emissions, 2005
Appendix C: Detailed Methodology for Community-Wide Inventory
Appendix D: Detailed Methodology for City Government Operations Inventory
Appendix E: City Employee Commute Survey, 2009

BASELINE GREENHOUSE GAS
EMISSIONS INVENTORY
City of Atascadero Page 1
Executive Summary
Climate change is quickly becoming a high priority among
policymakers and residents alike. In March 2009, the City Council
made a commitment to evaluating Atascadero‟s contribution to
global climate change through the development of a Community-
Wide and City Government Operations Baseline Greenhouse
Gas (GHG) Emissions Inventory (Inventory). This Inventory
identifies the major sources of greenhouse gas emissions within
the city1 and provides a baseline against which future progress
can be measured. This Inventory includes two components: (1) a
community-wide analysis and (2) a City government operations
analysis. It is important to note that the City government
operations inventory is a subset of the community inventory,
meaning that all City government operations emissions are
included in the commercial/industrial, transportation, waste, or
“other” categories of the community-wide inventory. The City
government operations inventory should not be added to the
community analysis; rather it should be looked at as a slice of the
complete picture. Specifically, this Inventory does the following:
Calculates GHGs from community-wide2 activities,
including City government operations, within the City‟s
jurisdictional boundary in calendar year 2005;
Identifies the major sources of greenhouse gas emissions
from community-wide sources and City government
operations;
Provides City decision-makers and the community with adequate information to inform
policy decisions; and
Forecasts how emissions will grow in the community if no behavioral changes are made.
1 In this report, the term “city” refers to the area inside the jurisdictional boundary of the City of
Atascadero, whereas “City government” refers to those activities which are under the operational control of City agencies.
2 “Community-wide” or “community” refers to all activities within the city (as defined above), including
those from businesses, industrial processes, residents, vehicles, and City government operations.
What are Greenhouse Gas Emissions (GHGs)?
Gases that trap heat in the Earth‟s atmosphere are called greenhouse gases, or GHGs. Greenhouse gases include carbon dioxide, methane, nitrous oxide, and fluorinated gases. While many of these gases occur naturally in the atmosphere, modern human activity has led to a steep increase in the amount of GHGs released into the atmosphere over the last 100 years. Collectively, these gases intensify the natural greenhouse effect, thus causing global average surface temperatures to rise, which in turn affects global climate patterns. GHGs are often quantified in terms of CO2 equivalent, or CO2e, a unit of measurement that equalizes the potency of GHGs.
Source: Intergovernmental Panel on Climate Change (IPCC), 2007
COMMUNITY-WIDE AND
GOVERNMENT OPERATIONS 2005
Page 2 City of Atascadero
The 2005 community-wide and City government operations baseline GHG Inventory represents
a key step in the City of Atascadero‟s efforts to improve air quality, enhance sustainability, and
ensure the safety and comfort of its residents for generations to come. In addition, this Inventory
allows the City to quantitatively track and take credit for its numerous efforts related to energy
efficiency and the mitigation of global climate change.
COMMUNITY-WIDE GHG INVENTORY RESULTS
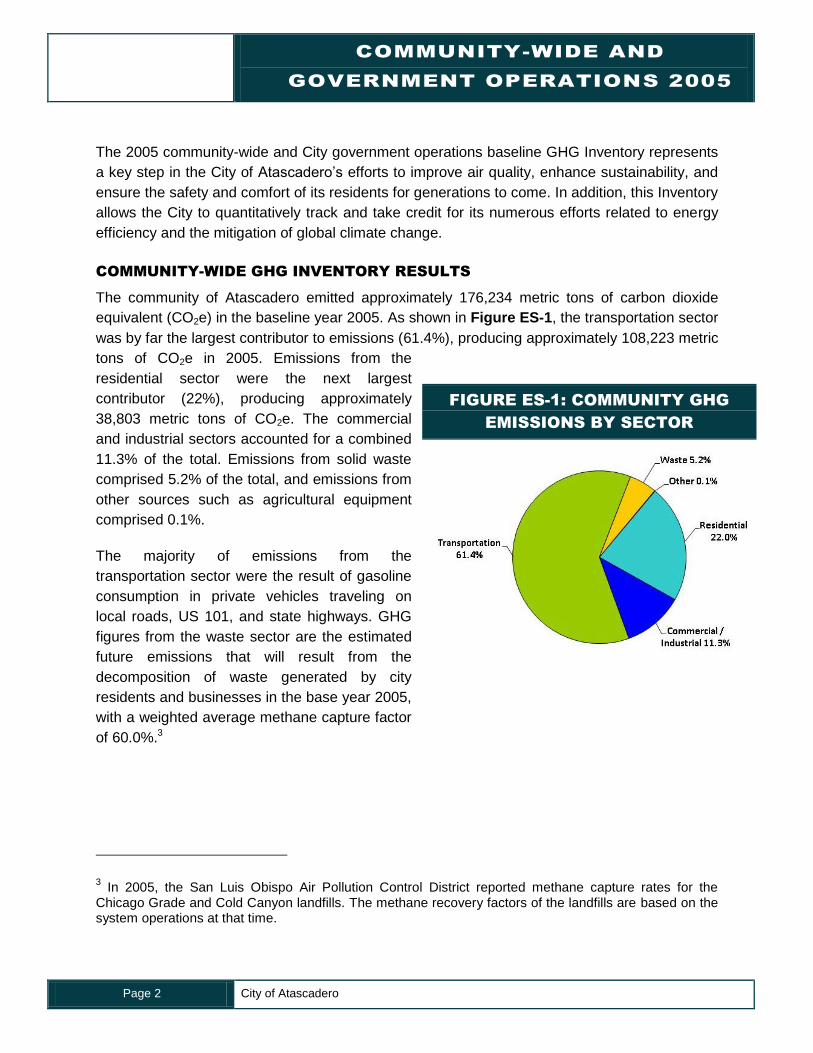
The community of Atascadero emitted approximately 176,234 metric tons of carbon dioxide
equivalent (CO2e) in the baseline year 2005. As shown in Figure ES-1, the transportation sector
was by far the largest contributor to emissions (61.4%), producing approximately 108,223 metric
tons of CO2e in 2005. Emissions from the
residential sector were the next largest
contributor (22%), producing approximately
38,803 metric tons of CO2e. The commercial
and industrial sectors accounted for a combined
11.3% of the total. Emissions from solid waste
comprised 5.2% of the total, and emissions from
other sources such as agricultural equipment
comprised 0.1%.
The majority of emissions from the
transportation sector were the result of gasoline
consumption in private vehicles traveling on
local roads, US 101, and state highways. GHG
figures from the waste sector are the estimated
future emissions that will result from the
decomposition of waste generated by city
residents and businesses in the base year 2005,
with a weighted average methane capture factor
of 60.0%.3
3 In 2005, the San Luis Obispo Air Pollution Control District reported methane capture rates for the
Chicago Grade and Cold Canyon landfills. The methane recovery factors of the landfills are based on the system operations at that time.
FIGURE ES-1: COMMUNITY GHG
EMISSIONS BY SECTOR
BASELINE GREENHOUSE GAS
EMISSIONS INVENTORY
City of Atascadero Page 3
CITY GOVERNMENT OPERATIONS GHG INVENTORY RESULTS
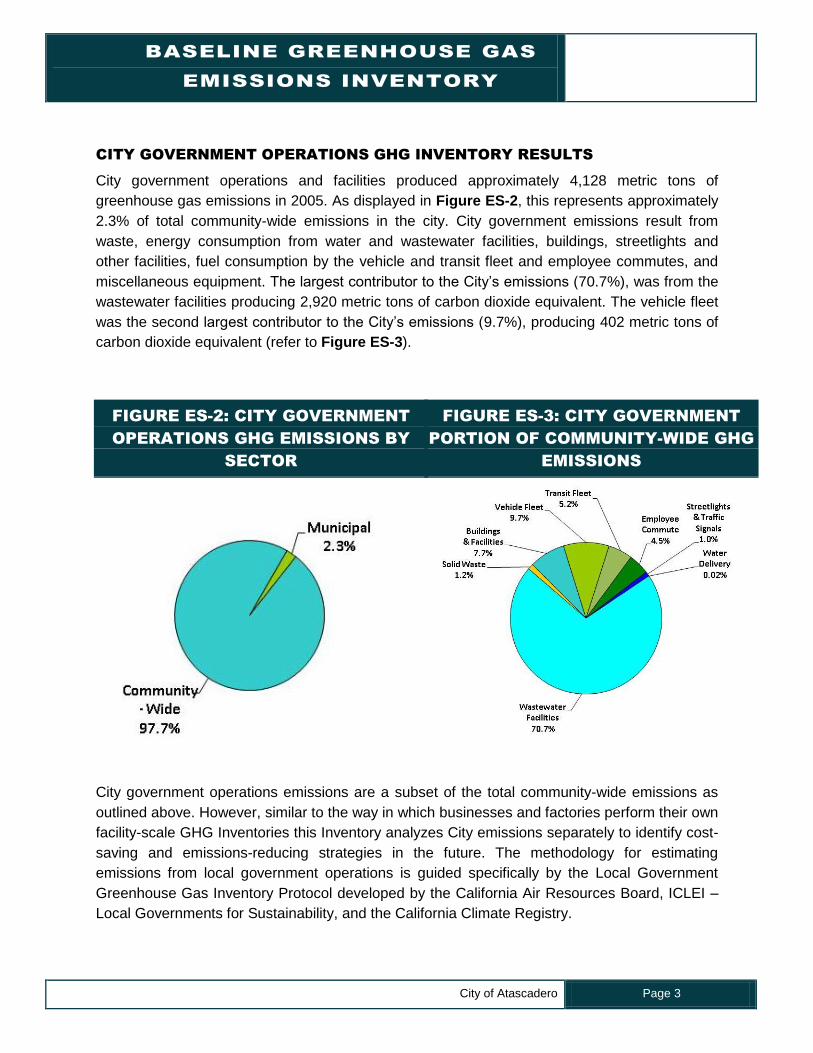
City government operations and facilities produced approximately 4,128 metric tons of
greenhouse gas emissions in 2005. As displayed in Figure ES-2, this represents approximately
2.3% of total community-wide emissions in the city. City government emissions result from
waste, energy consumption from water and wastewater facilities, buildings, streetlights and
other facilities, fuel consumption by the vehicle and transit fleet and employee commutes, and
miscellaneous equipment. The largest contributor to the City‟s emissions (70.7%), was from the
wastewater facilities producing 2,920 metric tons of carbon dioxide equivalent. The vehicle fleet
was the second largest contributor to the City‟s emissions (9.7%), producing 402 metric tons of
carbon dioxide equivalent (refer to Figure ES-3).
City government operations emissions are a subset of the total community-wide emissions as
outlined above. However, similar to the way in which businesses and factories perform their own
facility-scale GHG Inventories this Inventory analyzes City emissions separately to identify cost-
saving and emissions-reducing strategies in the future. The methodology for estimating
emissions from local government operations is guided specifically by the Local Government
Greenhouse Gas Inventory Protocol developed by the California Air Resources Board, ICLEI –
Local Governments for Sustainability, and the California Climate Registry.
FIGURE ES-3: CITY GOVERNMENT
PORTION OF COMMUNITY-WIDE GHG
EMISSIONS
FIGURE ES-2: CITY GOVERNMENT
OPERATIONS GHG EMISSIONS BY
SECTOR
COMMUNITY-WIDE AND
GOVERNMENT OPERATIONS 2005
Page 4 City of Atascadero
DATA LIMITATIONS
This Community-Wide and City Government Operations Baseline GHG Emissions Inventory
captures the major sources of greenhouse gases caused by activities within the city per
standard practice. However, it is important to note that some likely emission sources were not
included in the Inventory, either because of privacy laws, lack of data, or a lack of reasonable
methodology for calculating emissions. It is estimated that the sources not included in the
inventory comprise less than 5.0% of total emissions in the city. It is likely that as greenhouse
gas inventories become more common, methodology and accessibility to data will improve.
The sources that could not be included due to privacy laws, lack of data availability, and/or a
reasonable methodology include the following:
Refrigerants from City government operations facilities and vehicles;
Freight and passenger trains;
Propane, wind or solar energy consumed by the community-at-large;
Recreational off-road equipment and vehicles; and
Residential septic tanks systems.
These limitations are explained further in this document.
FORECAST AND NEXT STEPS
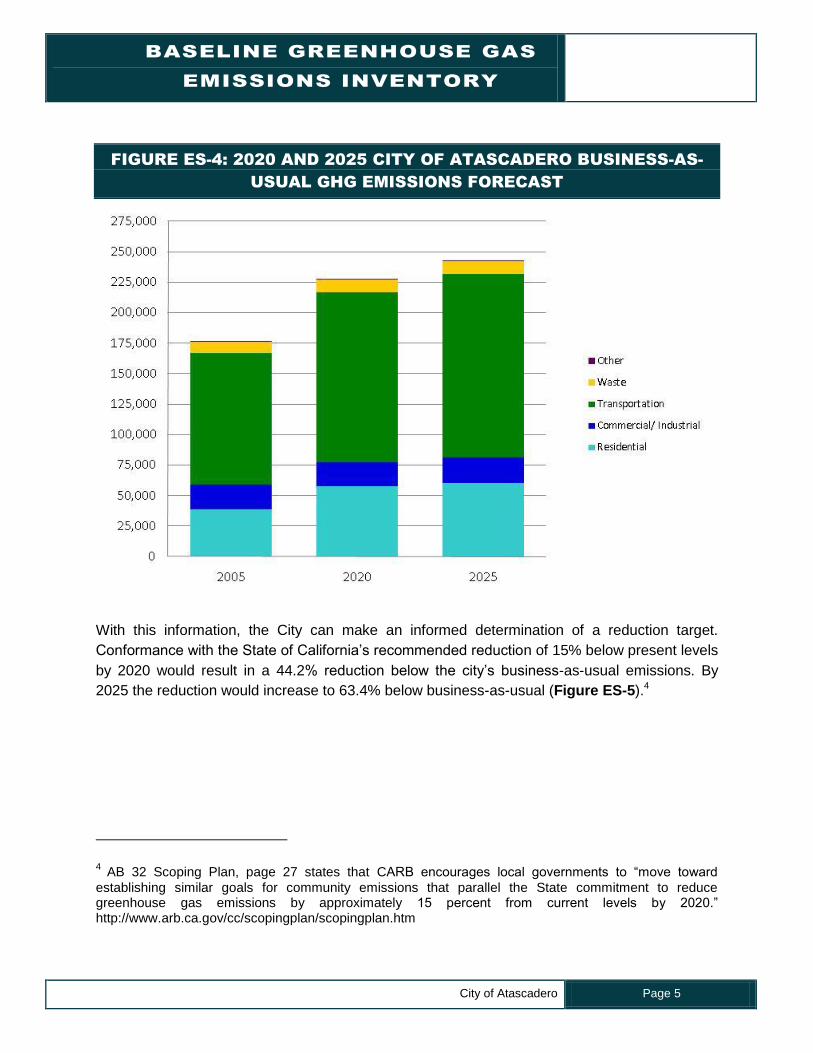
If consumption trends continue the pattern observed in 2005 emissions will reach 227,647
metric tons of CO2e by 2020, or a 29.2% increase over 2005 baseline levels. By 2025 emissions
will reach 242,428 metric tons of CO2e, or a 37.6% increase over 2005 baseline levels.
BASELINE GREENHOUSE GAS
EMISSIONS INVENTORY
City of Atascadero Page 5
FIGURE ES-4: 2020 AND 2025 CITY OF ATASCADERO BUSINESS-AS-
USUAL GHG EMISSIONS FORECAST
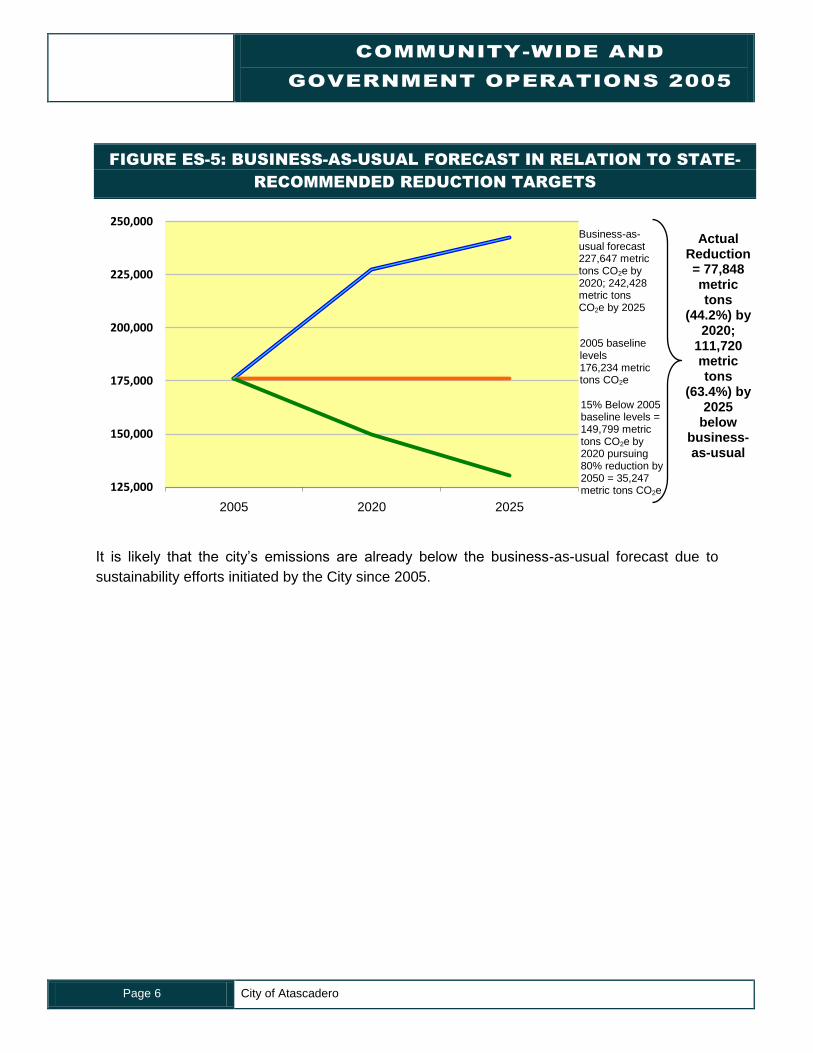
With this information, the City can make an informed determination of a reduction target.
Conformance with the State of California‟s recommended reduction of 15% below present levels
by 2020 would result in a 44.2% reduction below the city‟s business-as-usual emissions. By
2025 the reduction would increase to 63.4% below business-as-usual (Figure ES-5).4
4 AB 32 Scoping Plan, page 27 states that CARB encourages local governments to “move toward
establishing similar goals for community emissions that parallel the State commitment to reduce greenhouse gas emissions by approximately 15 percent from current levels by 2020.” http://www.arb.ca.gov/cc/scopingplan/scopingplan.htm
COMMUNITY-WIDE AND
GOVERNMENT OPERATIONS 2005
Page 6 City of Atascadero
FIGURE ES-5: BUSINESS-AS-USUAL FORECAST IN RELATION TO STATE-
RECOMMENDED REDUCTION TARGETS
It is likely that the city‟s emissions are already below the business-as-usual forecast due to
sustainability efforts initiated by the City since 2005.
125,000
150,000
175,000
200,000
225,000
250,000
2005 2020 2025
Business-as-usual forecast 227,647 metric tons CO2e by 2020; 242,428 metric tons CO2e by 2025
2005 baseline levels 176,234 metric tons CO2e
15% Below 2005 baseline levels = 149,799 metric tons CO2e by 2020 pursuing 80% reduction by 2050 = 35,247 metric tons CO2e
Actual Reduction = 77,848 metric tons
(44.2%) by 2020;
111,720 metric tons
(63.4%) by 2025
below business-as-usual
BASELINE GREENHOUSE GAS
EMISSIONS INVENTORY
City of Atascadero Page 7
1. Introduction
In March 2009, the City Council adopted a resolution to join
ICLEI – Local Governments for Sustainability (ICLEI) and to
authorize the preparation of a greenhouse gas emissions (GHG)
baseline inventory. In committing to the project, the City of
Atascadero embarked on an ongoing, coordinated effort to
reduce the GHG emissions that cause global warming, to
improve air quality, and to reduce costs.
This section introduces the Inventory, defines key terms used
throughout the Inventory, and provides an overview of climate
change science and regulation in California.
1.1 PURPOSE OF A GHG INVENTORY
This Inventory represents completion of the first step in the City‟s climate protection process. As
advised by ICLEI, quantifying recent-year emissions is essential to establish: (1) a baseline
against which to measure future emission levels, and (2) an understanding of where the highest
percentages of emissions are coming from, and, therefore, the greatest opportunities for
emissions reductions. This Inventory presents estimates of greenhouse gas emissions in 2005
resulting from the community as a whole.
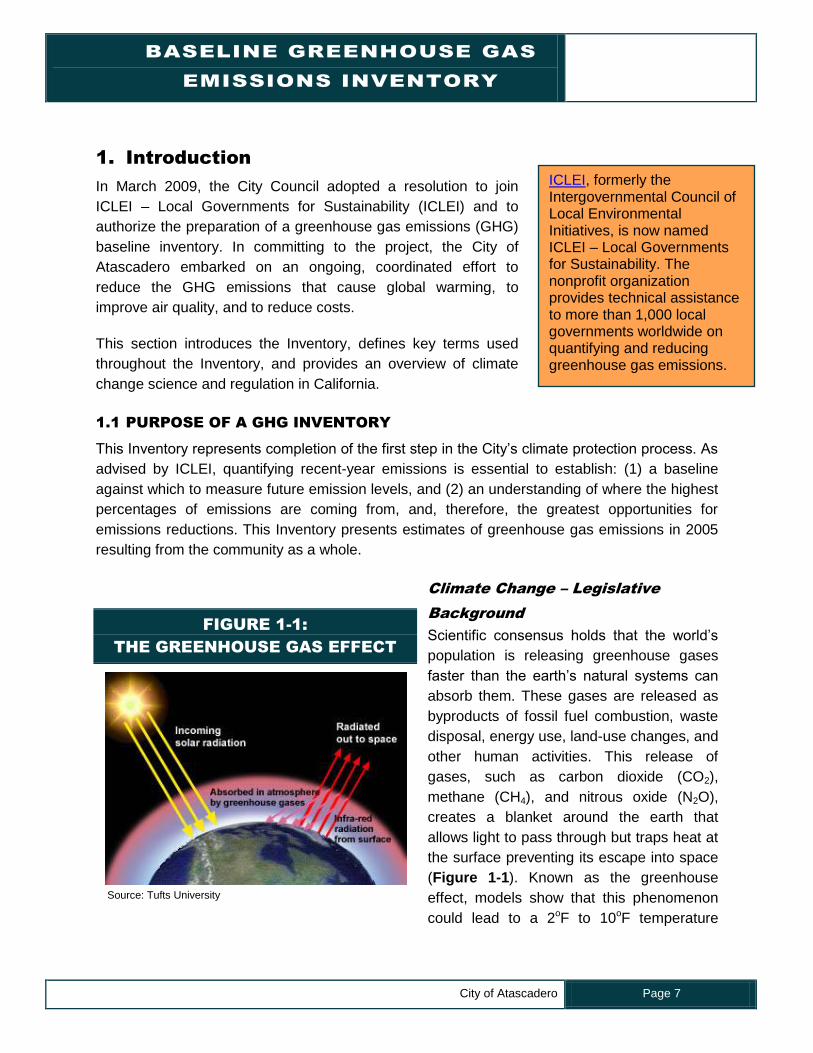
Climate Change – Legislative
Background
Scientific consensus holds that the world‟s
population is releasing greenhouse gases
faster than the earth‟s natural systems can
absorb them. These gases are released as
byproducts of fossil fuel combustion, waste
disposal, energy use, land-use changes, and
other human activities. This release of
gases, such as carbon dioxide (CO2),
methane (CH4), and nitrous oxide (N2O),
creates a blanket around the earth that
allows light to pass through but traps heat at
the surface preventing its escape into space
(Figure 1-1). Known as the greenhouse
effect, models show that this phenomenon
could lead to a 2oF to 10oF temperature
FIGURE 1-1:
THE GREENHOUSE GAS EFFECT
Source: Tufts University
ICLEI, formerly the Intergovernmental Council of Local Environmental Initiatives, is now named ICLEI – Local Governments for Sustainability. The nonprofit organization provides technical assistance to more than 1,000 local governments worldwide on quantifying and reducing greenhouse gas emissions.
COMMUNITY-WIDE AND
GOVERNMENT OPERATIONS 2005
Page 8 City of Atascadero
increase over the next 100 years. The Intergovernmental Panel on Climate Change (IPCC)
warns that most of the warming observed over the last 50 years is attributable to human
activities.5
Although used interchangeably, there is a difference between the terms “climate change” and
“global warming.” According to the State, climate change refers to “any long-term change in
average climate conditions in a place or region, whether due to natural causes or as a result of
human activities.6 The use of the term “climate change” is becoming more prevalent because it
encompasses all changes to the climate, not just temperature. Additionally, the term “climate
change” conveys temporality, implying that climate change can be slowed with the efforts of
local, regional, state, national, and world entities.
Changes in the earth‟s temperature will have impacts for residents and businesses in the City of
Atascadero. Some of the major impacts to the Central Coast expected to occur include the
following, separated by sector.78
Coastline: The San Luis Obispo County coastline could face inundation as a result of
sea level rise and global warming. As temperatures rise, the ocean waters rise as well
due to thermal expansion and the melting of glaciers and snowpack. The state‟s 2009
Climate Change Impacts Assessment (the 2009 Scenarios Project) estimates that sea
levels will rise by 12 to 18 inches by 2050 and 21 to 55 inches by 2100. This level of sea
rise has the potential to negatively affect groundwater salination as well as the size and
attractiveness of local beaches, which could affect property values and the tourism
industry in the county;
Reduced Water Supply: The 2009 Scenarios Project estimates a decrease in
precipitation of 12 -35% by 2050. Higher temperatures are also expected to increase
evaporation and make for a generally drier climate. In addition, more precipitation will fall
as rain rather than snow, which will cause snow to melt earlier in the year and not in the
warmer, drier months when water is in higher demand;
5 Intergovernmental Panel on Climate Change. Fourth Assessment Report, Working Group I. 2007.
Climate Change 2007: The Physical Science Basis, Summary for Policy Makers.
6 California Natural Resources Agency. 2009 California Climate Adaptation Strategy Discussion Draft.
August 2009.
7 California Climate Change Center. Our Changing Climate: Assessing the Risks to California (2006),
www.climatechange.ca.gov
8 Governor‟s Office of Planning and Research (OPR). Proposed CEQA Guideline Amendments for
Greenhouse Gas Emissions. April 2009.
BASELINE GREENHOUSE GAS
EMISSIONS INVENTORY
City of Atascadero Page 9
Agriculture: Climate change could cause a shift in the type and location of agriculture in
the area. As saltwater intrudes into coastal aquifers and groundwater resources
decrease, it is possible that some crops will be forced out of the area, which affects the
local economy and food supply. Water supplies to agriculture may be 20 -23% below
demand targets between 2020 and 2050;
Public Health: Climate change could potentially threaten the health of residents of
Atascadero. Heat waves are expected to have a major impact on public health, as will
decreasing air quality and an increase in mosquito breeding and mosquito-borne
diseases. There is also expected to be an increase in allergenic plant pollen and an
increase in the frequency of wildfires. The elderly, young, and other vulnerable
populations will need assistance as they will not have the resources to deal with the
costs and adapt to the expected changes.
Although one city cannot resolve the issue of climate change, local governments can make a
positive impact through cumulative local action. Cities and counties have the ability to reduce
greenhouse gas emissions through effective land use and transportation planning, wise waste
management, and the efficient use of energy. The City can achieve multiple benefits including
lower energy bills, improved air quality, economic development, reduced emissions, and better
quality of life through:
Energy efficiency in City facilities and vehicle fleet;
Sustainable purchasing and waste reduction efforts;
Land use and transportation planning; and
Efficient management of water resources.
This Inventory serves as a baseline measurement for implementing and tracking the
effectiveness of these efforts.
1.2 CLIMATE CHANGE – LEGISLATIVE BACKGROUND
California continues to be a leader in addressing climate change in the United States and in the
world. In June of 2005, Governor Schwarzenegger issued a landmark Executive Order
establishing progressive greenhouse gas emissions targets for the entire state. Executive Order
(EO) S-3-05 makes the following goals:
By 2010, reduce greenhouse gas emissions to 2000 levels;
COMMUNITY-WIDE AND
GOVERNMENT OPERATIONS 2005
Page 10 City of Atascadero
By 2020, reduce greenhouse gas emissions to 1990 levels;
By 2050, reduce greenhouse gas emissions to 80% below 1990 levels.
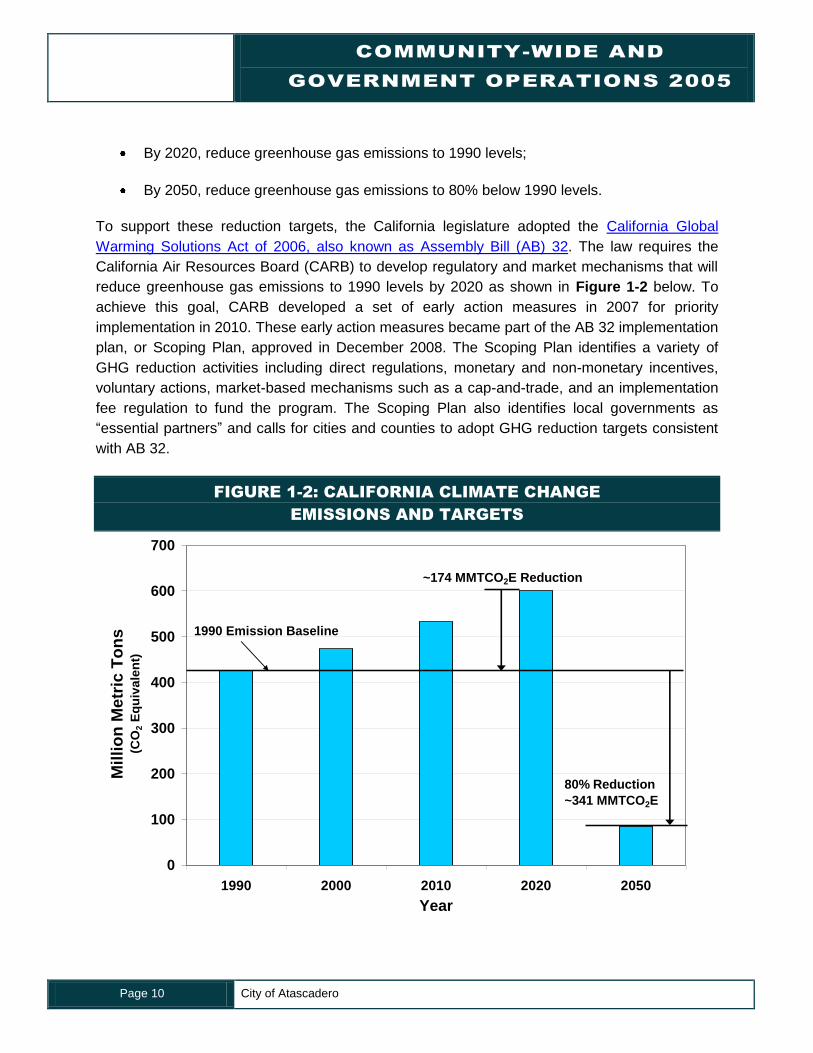
To support these reduction targets, the California legislature adopted the California Global
Warming Solutions Act of 2006, also known as Assembly Bill (AB) 32. The law requires the
California Air Resources Board (CARB) to develop regulatory and market mechanisms that will
reduce greenhouse gas emissions to 1990 levels by 2020 as shown in Figure 1-2 below. To
achieve this goal, CARB developed a set of early action measures in 2007 for priority
implementation in 2010. These early action measures became part of the AB 32 implementation
plan, or Scoping Plan, approved in December 2008. The Scoping Plan identifies a variety of
GHG reduction activities including direct regulations, monetary and non-monetary incentives,
voluntary actions, market-based mechanisms such as a cap-and-trade, and an implementation
fee regulation to fund the program. The Scoping Plan also identifies local governments as
“essential partners” and calls for cities and counties to adopt GHG reduction targets consistent
with AB 32.
FIGURE 1-2: CALIFORNIA CLIMATE CHANGE
EMISSIONS AND TARGETS
CAT Report Emissions
0
100
200
300
400
500
600
700
1990 2000 2010 2020 2050
Year
Mil
lio
n M
etr
ic T
on
s
(C
O2 E
qu
ivale
nt)
1990 Emission Baseline
80% Reduction
~341 MMTCO2E
~174 MMTCO2E Reduction
BASELINE GREENHOUSE GAS
EMISSIONS INVENTORY
City of Atascadero Page 11
In support of the AB 32 reduction targets, California adopted Senate Bill (SB) 97 in August
2007, which formally acknowledges that climate change is an important environmental issue
that requires analysis under the California Environmental Quality Act (CEQA). In response to SB
97, the Governor‟s Office of Planning and Research (OPR) submitted their proposed
amendments to the CEQA Guidelines for greenhouse gas emissions in April 2009. These
proposed amendments will provide guidance to public agencies regarding the analysis of
mitigation and the effects of GHG emissions in CEQA documents. The Natural Resources
Agency is required to certify and adopt the amendments before January 1, 2010.9
Although EO S-3-05 and SB 97 have made California a national leader in climate change policy,
there is much more to come. The California legislature passed numerous bills in recent years
concerning energy use, land use, transportation, and other climate change topics. These bills
will result in the guidance and funding necessary for local governments to move forward with
climate action efforts.
At the same time, the State is working to form regional approaches to reducing greenhouse gas
emissions in response to the passage of Senate Bill 375. SB 375 aims to reduce greenhouse
gas emissions by linking transportation funding to land use planning. It also requires
Metropolitan Planning Organizations, including the San Luis Obispo Council of Governments, to
include a Sustainable Communities Strategy (SCS) in their Regional Transportation Plans
(RTPs) for reducing suburban sprawl. The bill also creates incentives for implementation of
sustainable communities strategies and sustainable transportation plans. Additional efforts are
under way to affect the overall transportation sector by mandating fewer emissions from
vehicles, including Assembly Bill 1493, signed into law in 2002, which will require carmakers to
reduce emissions from new passenger cars and light trucks beginning in 2009. US
Environmental Protection Agency (EPA) approved the new emissions standards in June 2009.
The State is also preparing for climate change resiliency in order to adapt to the inevitable
effects of climate change. In November 2008, Governor Schwarzenegger signed Executive
Order S-13-08 which asked the Natural Resources Agency to identify how state agencies can
respond to rising temperature, changing precipitation patterns, sea level rise, and extreme
natural events. The order requires the Natural Resources Agency to develop a Climate
Adaptation Strategy (CAS) to analyze climate change impacts to the state and recommend
strategies to manage those threats. The Natural Resources Agency released a discussion draft
of the CAS in August 2009.
9 Governor‟s Office of Planning and Research (OPR). Proposed CEQA Guideline Amendments for
Greenhouse Gas Emissions. April 2009.
COMMUNITY-WIDE AND
GOVERNMENT OPERATIONS 2005
Page 12 City of Atascadero
The scale and pace at which the State of California is addressing this issue necessitates that
local governments accelerate efforts to combat climate change.
1.3 THE CITIES FOR CLIMATE PROTECTION CAMPAIGN
By adopting a resolution to join ICLEI – Local Governments for Sustainability, the City of
Atascadero is now part of an international movement of local governments. More than 1,000
local governments, including over 500 in the United States, have joined ICLEI‟s Cities for
Climate Protection (CCP) campaign.
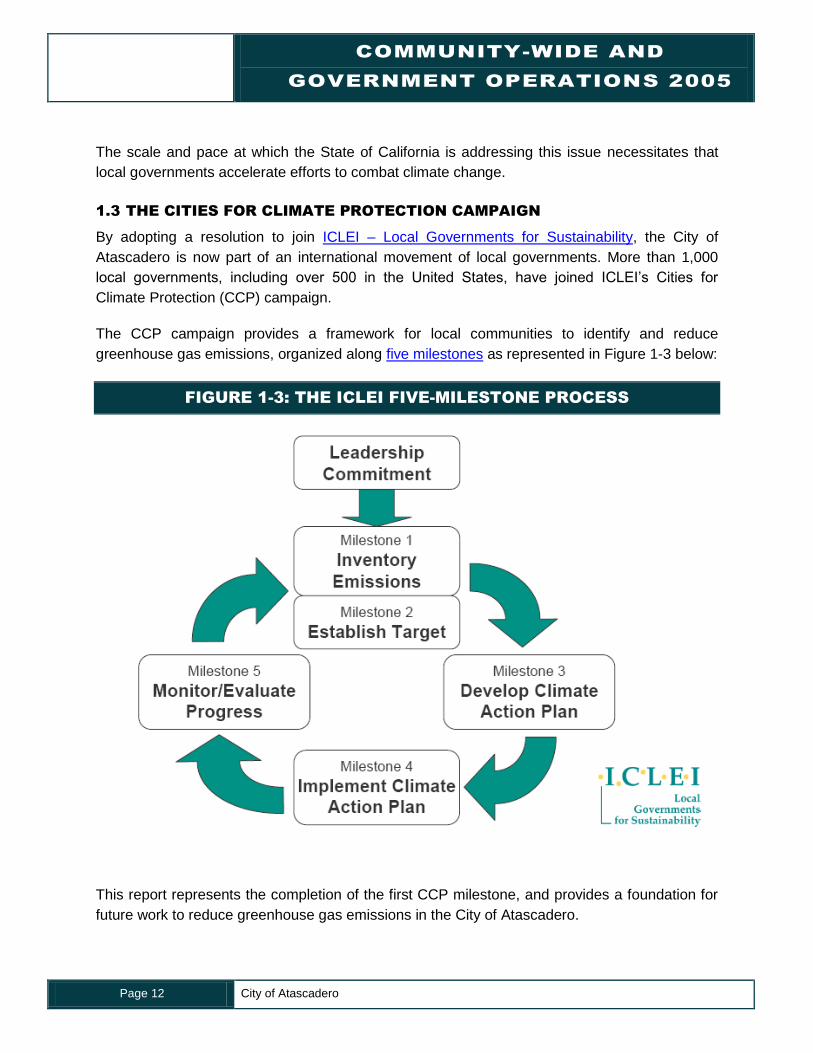
The CCP campaign provides a framework for local communities to identify and reduce
greenhouse gas emissions, organized along five milestones as represented in Figure 1-3 below:
FIGURE 1-3: THE ICLEI FIVE-MILESTONE PROCESS
This report represents the completion of the first CCP milestone, and provides a foundation for
future work to reduce greenhouse gas emissions in the City of Atascadero.
BASELINE GREENHOUSE GAS
EMISSIONS INVENTORY
City of Atascadero Page 13
1.4 LOCAL SUSTAINABILITY AND CLIMATE CHANGE MITIGATION
ACTIVITIES
Many of the air pollution programs already in place throughout San Luis Obispo County reduce
ozone forming pollutants and toxic emissions, but they also have ancillary benefits and reduce
greenhouse gas emissions. The County, cities, and the Air Pollution Control District (APCD)
implement rules and regulations, clean fuels programs, CEQA mitigation measures, grants, the
Transportation Choices Program, pollution prevention activities, energy efficiency and
conservation measures, water conservation programs, partnerships, and general public
outreach that directly or indirectly address climate change and reduce greenhouse gas
emissions.
The APCD Board, approved the first report or plan to address climate change in the county. The
plan, (Options for Addressing Climate Change in San Luis Obispo County (2005)) identifies the
following seven actions that could be implemented to specifically address greenhouse gases
(GHG) at the local level:
1) Prepare a countywide inventory of greenhouse gas emissions;
2) Target a percentage of mitigation grant funds for greenhouse gas emission reductions;
3) Evaluate and quantify the GHG reduction benefits from existing district programs;
4) Develop public education and outreach campaigns on climate change;
5) Encourage and provide support for local governments to join the Cities for Climate
Protection program;
6) Develop partnership with Cal Poly for addressing climate change; and
7) Join the California Climate Registry and encourage local industry participation.
As of November 2008, the APCD has initiated, promoted, or supported all of the implementation
actions to address climate change and reduction of greenhouse gas emissions in the county.
The APCD joined the California Climate Registry and conducted its greenhouse gas emissions
inventory in the fall of 2008. The APCD facilitates regular meetings of Climate Change
Stakeholders, a local group of city and county representatives that shares resources to address
climate change. To encourage and support local greenhouse gas emissions inventories, the
APCD is providing technical assistance to all of the incorporated cities to assist or perform GHG
government operations and community-wide emissions inventories, similar to this Inventory, for
all of the incorporated cities in San Luis Obispo County.
COMMUNITY-WIDE AND
GOVERNMENT OPERATIONS 2005
Page 14 City of Atascadero
The APCD also coordinates the Central Coast Clean Cities Coalition (C5). C5 is a partnership of
public/private entities whose goal is to promote the use of alternative fuels vehicles (AFV) on the
Central Coast. By working with area fleet operators, C5 sponsors training seminars, public
events, and grant funding workshops related to use of alternative fuels.
The City of Atascadero has been pursuing energy efficiencies through such measures as:
Construction of new and improvement of existing bike lanes and sidewalks through the
Safe Routes to School Program to encourage walking and biking to schools (ongoing);
The construction of bicycle lanes, sidewalks, and multi-use trails throughout the City
Adoption of Native Tree Ordinance (1998);
Native tree reforestation projects at various sites throughout the City;
Partnership with SLO Green Build to promote energy efficiency in new development;
Joined PG&E‟s Climate Smart Program to purchase carbon credits to offset emissions
from City Hall;
Replacement of high pressure sodium light bulbs with energy efficient light emitting
diodes (LED) bulbs in street and traffic lights;
Development of a solar financing district through AB 811 to encourage the installation of
solar panels and reduce dependence on traditional energy sources (ongoing); and
Development of a Water Conservation Landscape Ordinance (2009).
BASELINE GREENHOUSE GAS
EMISSIONS INVENTORY
City of Atascadero Page 15
2. Community and Government Operations Inventory
Methodology
The first step toward reducing greenhouse gas emissions is to identify baseline levels and
sources of emissions in the city. This information can later inform the selection of a reduction
target and possible reduction measures to be included in a climate action plan.
This section outlines the methodology used to calculate the community and City government
operations10 inventories, including the difference between the two inventories, and the data
collection process, data sources, GHG emission scopes, data limitations, and means of
calculation.
2.1 BASELINE AND FORECAST YEARS
The year 2005 was selected as the baseline year for the Inventory due to the availability of
reliable data and consistency with other cities in San Luis Obispo County. The State of
California uses 1990 as a reference year to remain consistent with the Kyoto Protocol, and also
because it has well-kept records of transportation trends and energy consumption in that year.
However, cities and counties throughout California typically elect to use 2005 or 2006 as a
baseline year because of the more reliable recordkeeping from those years and because of the
large amount of growth that has occurred since 1990.
This Inventory uses a forecast year of 2020 to be consistent with the State of California GHG
Inventory11 forecast year and AB 32 target, both of which reference 2020. In addition, it is likely
that any forecast beyond 2020 would have a significant margin of error because of unknown
population growth rates and new technology. The business-as-usual forecast has also been
extended to 2025 in consideration of the City‟s General Plan Horizon.
2.2 THE TWO INVENTORIES: COMMUNITY-WIDE AND CITY GOVERNMENT
OPERATIONS
This Inventory is separated into two sections, community-wide and City government operations.
Per ICLEI protocol, the City has completed an assessment of activities throughout the
community and a more detailed analysis of City government operations including streetlights,
10 In this report, the term “city” refers to the incorporated area (the jurisdictional boundary of the City of
Atascadero), whereas “City” refers to those activities that are under the operational control of City agencies. “Community-wide” or “community” refers to all activities within the city (as defined above), including those from businesses, industrial processes, residents, vehicles, and City government operations.
11 California Greenhouse Gas Inventory, http://www.arb.ca.gov/cc/inventory/inventory.htm
COMMUNITY-WIDE AND
GOVERNMENT OPERATIONS 2005
Page 16 City of Atascadero
building energy use, fleet vehicles, and more. The City government operations inventory was
conducted consistent with the Local Government Operations Protocol developed by the
California Air Resources Board (CARB), ICLEI, The Climate Registry, and the California Climate
Action Registry (CCAR).
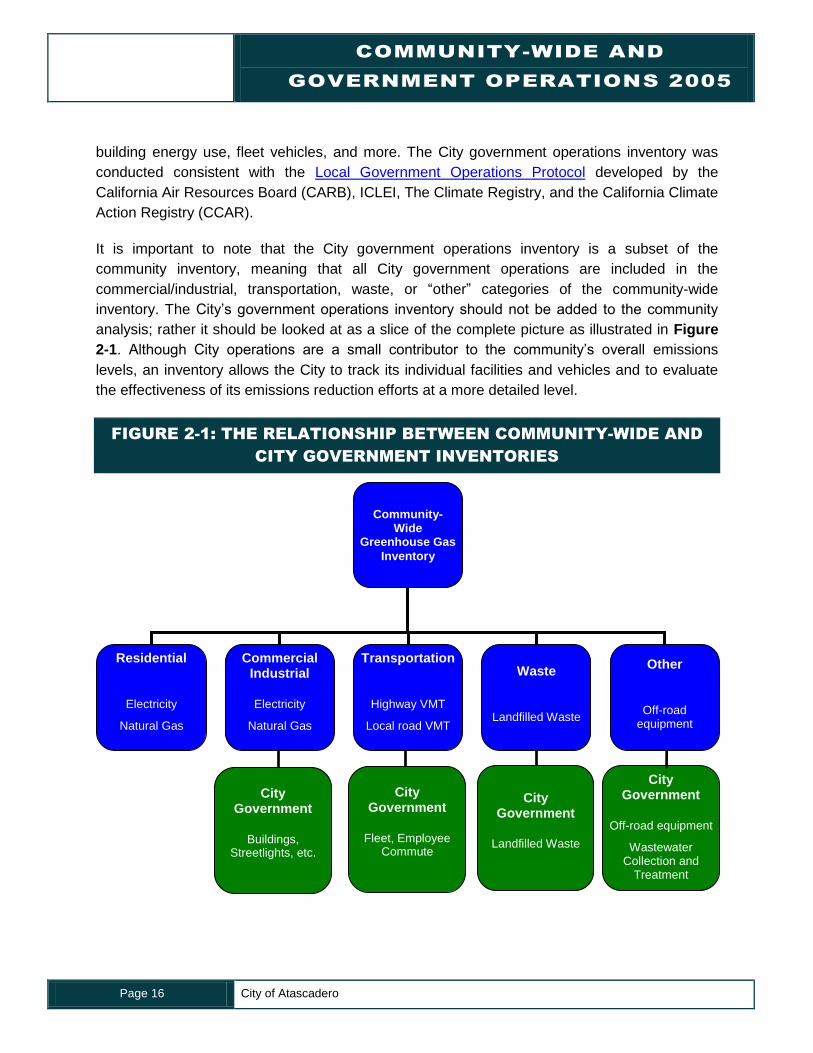
It is important to note that the City government operations inventory is a subset of the
community inventory, meaning that all City government operations are included in the
commercial/industrial, transportation, waste, or “other” categories of the community-wide
inventory. The City‟s government operations inventory should not be added to the community
analysis; rather it should be looked at as a slice of the complete picture as illustrated in Figure
2-1. Although City operations are a small contributor to the community‟s overall emissions
levels, an inventory allows the City to track its individual facilities and vehicles and to evaluate
the effectiveness of its emissions reduction efforts at a more detailed level.
FIGURE 2-1: THE RELATIONSHIP BETWEEN COMMUNITY-WIDE AND
CITY GOVERNMENT INVENTORIES
City Government
Off-road equipment
Wastewater Collection and
Treatment
City Government
Fleet, Employee Commute
City Government
Landfilled Waste
City Government
Buildings, Streetlights, etc.
Community-Wide
Greenhouse Gas
Inventory
Residential
Electricity
Natural Gas
Commercial Industrial
Electricity
Natural Gas
Waste
Landfilled Waste
Transportation
Highway VMT
Local road VMT
Other
Off-road equipment
BASELINE GREENHOUSE GAS
EMISSIONS INVENTORY
City of Atascadero Page 17
Once completed, these inventories provide the basis for policy development, the quantification
of emissions reductions associated with proposed measures, the creation of an emissions
forecast, and the establishment of an informed emissions reduction target.
2.3 DATA COLLECTION AND METHODOLOGY
Creating the community and City government operations emissions inventories required the
collection of information from a variety of sources. Sources for community data included the
Pacific Gas and Electric Company (PG&E), the Southern California Gas Company, Caltrans, the
California Air Resources Board the California Integrated Waste Management Board, and the
County of San Luis Obispo. City government operations data sources included PG&E, the
Southern California Gas Company, Atascadero Waste Alternatives, and documentation from
multiple City departments including Planning, Public Works, Finance, Police, Fire, and more.
Data from the year 2005 were used in both inventories, with the following exceptions:
A subset of waste data by type was not available for 2005, therefore this study utilizes a
California statewide waste characterization study conducted in 2003-2004;
City employee commuting trips were calculated using an employee survey conducted in
2009; and
Propane, wind and solar power used in both the community-wide and City government
inventories.
For community activities and City operations, emissions sources are categorized by scope.
Scopes help us identify where emissions originate from and what entity retains regulatory
control and the ability to implement efficiency measures. The scopes are illustrated in Figure 2-
2 and defined as follows:
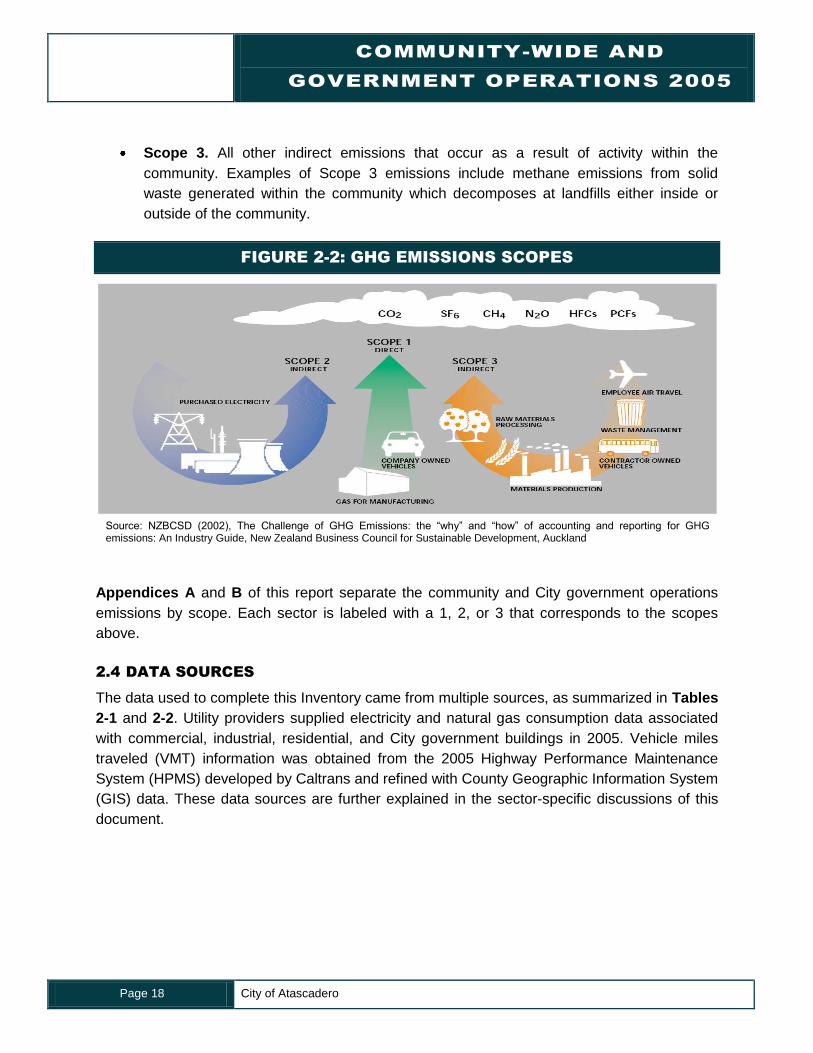
Scope 1. Direct emissions sources located within the community, mostly from the
combustion of fuels. Examples of Scope 1 sources include use of fuels such as gasoline
and natural gas.
Scope 2. Indirect emissions that result because of activities within the community,
limited to electricity, district heating, steam and cooling consumption. An example of a
Scope 2 source is purchased electricity used within the community. These emissions
should be included in the community-wide analysis, as they are the result of the
community's electricity consumption.
COMMUNITY-WIDE AND
GOVERNMENT OPERATIONS 2005
Page 18 City of Atascadero
Scope 3. All other indirect emissions that occur as a result of activity within the
community. Examples of Scope 3 emissions include methane emissions from solid
waste generated within the community which decomposes at landfills either inside or
outside of the community.
FIGURE 2-2: GHG EMISSIONS SCOPES
Appendices A and B of this report separate the community and City government operations
emissions by scope. Each sector is labeled with a 1, 2, or 3 that corresponds to the scopes
above.
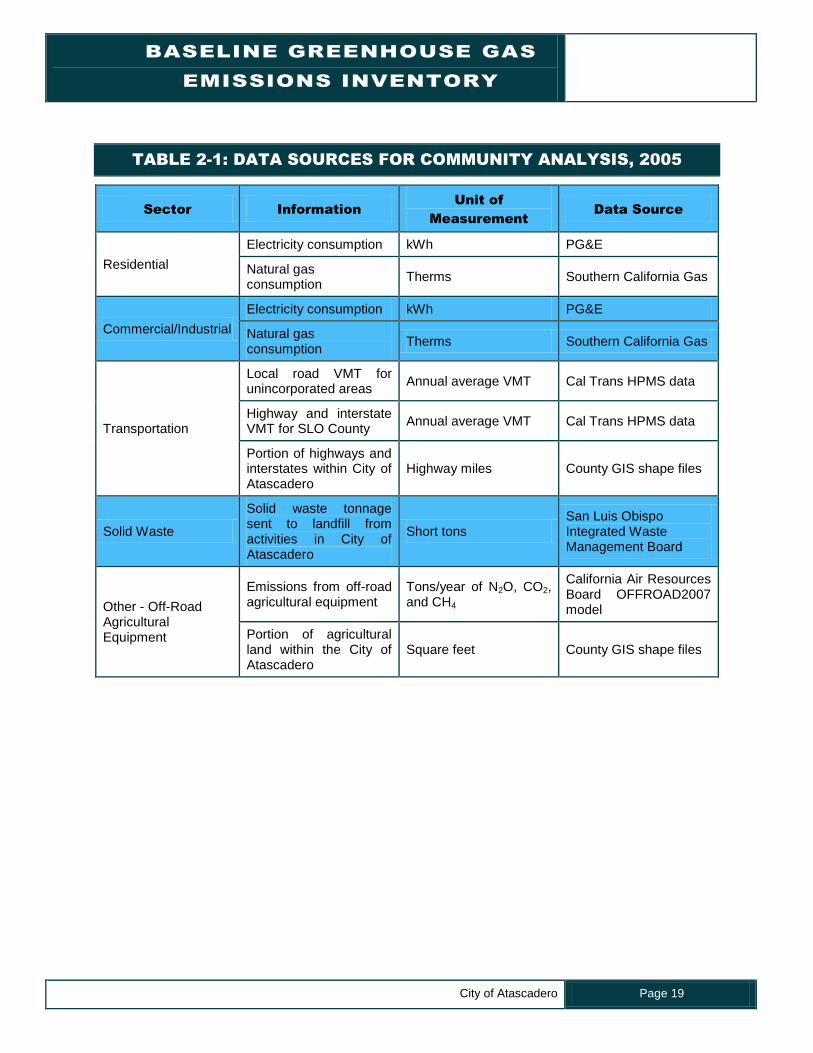
2.4 DATA SOURCES
The data used to complete this Inventory came from multiple sources, as summarized in Tables
2-1 and 2-2. Utility providers supplied electricity and natural gas consumption data associated
with commercial, industrial, residential, and City government buildings in 2005. Vehicle miles
traveled (VMT) information was obtained from the 2005 Highway Performance Maintenance
System (HPMS) developed by Caltrans and refined with County Geographic Information System
(GIS) data. These data sources are further explained in the sector-specific discussions of this
document.
Source: NZBCSD (2002), The Challenge of GHG Emissions: the “why” and “how” of accounting and reporting for GHG emissions: An Industry Guide, New Zealand Business Council for Sustainable Development, Auckland
BASELINE GREENHOUSE GAS
EMISSIONS INVENTORY
City of Atascadero Page 19
TABLE 2-1: DATA SOURCES FOR COMMUNITY ANALYSIS, 2005
Sector Information
Unit of
Measurement
Data Source
Residential
Electricity consumption kWh PG&E
Natural gas consumption
Therms Southern California Gas
Commercial/Industrial
Electricity consumption kWh PG&E
Natural gas consumption
Therms Southern California Gas
Transportation
Local road VMT for unincorporated areas
Annual average VMT Cal Trans HPMS data
Highway and interstate VMT for SLO County
Annual average VMT Cal Trans HPMS data
Portion of highways and interstates within City of Atascadero
Highway miles County GIS shape files
Solid Waste
Solid waste tonnage sent to landfill from activities in City of Atascadero
Short tons San Luis Obispo Integrated Waste Management Board
Other - Off-Road Agricultural Equipment
Emissions from off-road agricultural equipment
Tons/year of N2O, CO2, and CH4
California Air Resources Board OFFROAD2007 model
Portion of agricultural land within the City of Atascadero
Square feet County GIS shape files
COMMUNITY-WIDE AND
GOVERNMENT OPERATIONS 2005
Page 20 City of Atascadero
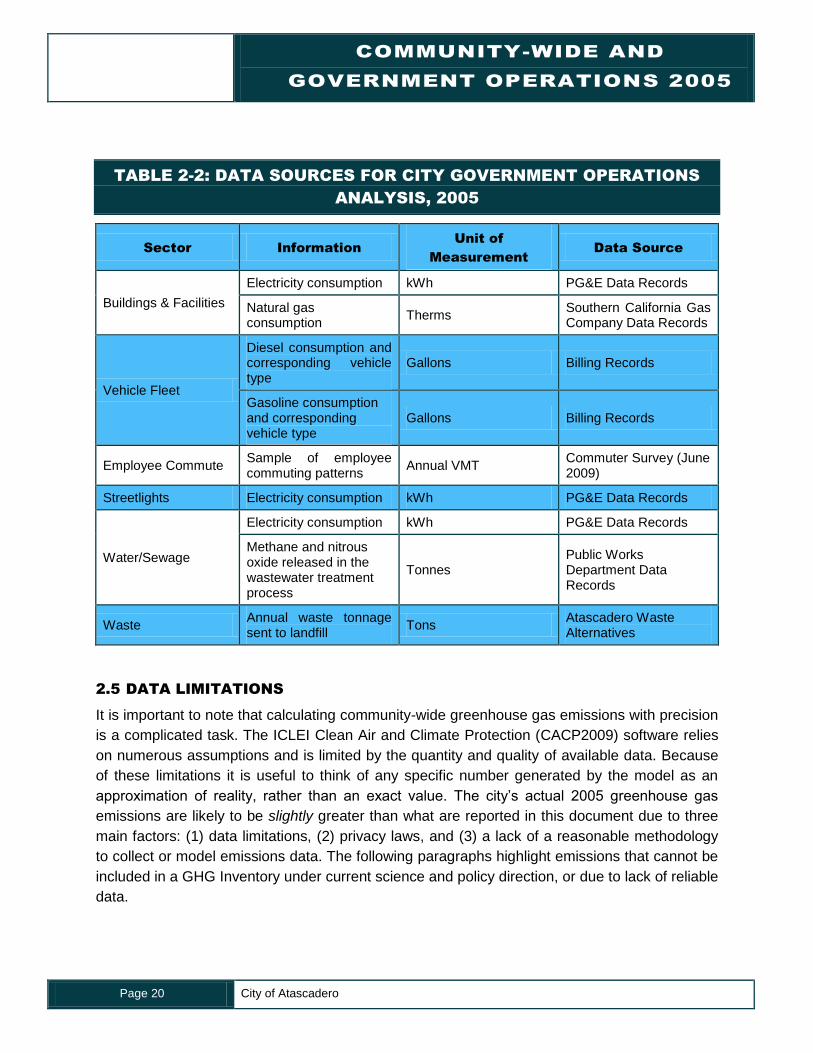
TABLE 2-2: DATA SOURCES FOR CITY GOVERNMENT OPERATIONS
ANALYSIS, 2005
Sector Information
Unit of
Measurement
Data Source
Buildings & Facilities
Electricity consumption kWh PG&E Data Records
Natural gas consumption
Therms Southern California Gas Company Data Records
Vehicle Fleet
Diesel consumption and corresponding vehicle type
Gallons Billing Records
Gasoline consumption and corresponding vehicle type
Gallons Billing Records
Employee Commute Sample of employee commuting patterns
Annual VMT Commuter Survey (June 2009)
Streetlights Electricity consumption kWh PG&E Data Records
Water/Sewage
Electricity consumption kWh PG&E Data Records
Methane and nitrous oxide released in the wastewater treatment process
Tonnes Public Works Department Data Records
Waste Annual waste tonnage sent to landfill
Tons Atascadero Waste Alternatives
2.5 DATA LIMITATIONS
It is important to note that calculating community-wide greenhouse gas emissions with precision
is a complicated task. The ICLEI Clean Air and Climate Protection (CACP2009) software relies
on numerous assumptions and is limited by the quantity and quality of available data. Because
of these limitations it is useful to think of any specific number generated by the model as an
approximation of reality, rather than an exact value. The city‟s actual 2005 greenhouse gas
emissions are likely to be slightly greater than what are reported in this document due to three
main factors: (1) data limitations, (2) privacy laws, and (3) a lack of a reasonable methodology
to collect or model emissions data. The following paragraphs highlight emissions that cannot be
included in a GHG Inventory under current science and policy direction, or due to lack of reliable
data.
BASELINE GREENHOUSE GAS
EMISSIONS INVENTORY
City of Atascadero Page 21
Data Limitations
Lack of available data prevented the calculation of emissions from community-wide freight and
passenger trains, off-road vehicles and equipment, propane use, and City government
operations refrigerants. For rail, port, and other off-road vehicles, as well as equipment
emissions, the California Air Resources Board OFFROAD 2007 software provides emissions
from rail activities; however, these numbers are aggregated for the entire San Luis Obispo
County area, including incorporated, unincorporated, and state or federally owned land.
Lack of data availability also prevents the calculation of emissions from propane (liquefied
petroleum gas, or LPG) created within the city‟s boundaries. Propane is basically an
unregulated fuel in California (except for storage and safety issues which are regulated).
Because it is an unregulated commodity, no data is collected by the state on propane sales or
usage. Another sector that was excluded from the inventory is City government operations
refrigerants.
The City of Atascadero made a best effort to gather data on the amount of refrigerants
consumed by fleet vehicles, HVAC systems, and City government operations facilities; however
City records were not suited to this purpose. It is recommended that the City look into amending
its record keeping so that the amount of refrigerants purchased and consumed within a year is
recorded.
Privacy Laws
This Inventory does not separately analyze site-level emissions from specific sources such as
refineries or large industrial emitters. The emissions from industrial energy consumption and
related transportation are included under the commercial/industrial category, but will not be
analyzed independently as part of this Inventory for two reasons:
1) State privacy laws prevent us from obtaining site-level energy consumption data from
utility providers. Notably the California Public Utilities Commission 15/15 rule,12 prevents
us from analyzing industrial emissions separately from commercial emissions.
2) It is the responsibility of the emitter, whether it is a large refinery or household, to
perform their own energy audit and subsequent reduction process. Efforts to require site-
level energy audits and greenhouse gas emissions reporting are being continually
12 Commercial and Industrial Electricity and Natural Gas were combined into one section due to the
California 15/15 rule. The 15/15 rule was adopted by the California Public Utilities Commission in the Direct Access Proceeding (CPUC Decision 97-10-031) to protect customer confidentiality.
COMMUNITY-WIDE AND
GOVERNMENT OPERATIONS 2005
Page 22 City of Atascadero
expanded and required by the California Climate Action Registry, U.S. Environmental
Protection Agency, and California Air Resources Board.
Lack of a Reasonable Methodology
There is a lack of reasonable methodology for estimating life cycle emissions for the community
and, therefore, emissions associated with the production and disposal of items consumed by a
community are not included in the Inventory. For instance, a life cycle assessment would
estimate the emissions associated with the planning, production, delivery, and disposal of each
car currently in the city. In contrast, this analysis only captures how much that car drives within
the city.
Despite these limitations, the Clean Air and Climate Protection (CACP) software 200913 and
ICLEI methodology provide the best-available snapshot of the city‟s greenhouse gas emissions.
Additionally, the CACP2009 tool is utilized to promote consistency among municipalities
throughout the country and the world. Sector-specific data limitations or methodological issues
are explained thoroughly in Appendices C and D.
However, it is important to note that the emissions identified in
this report are primarily greenhouse gases that the community
has directly caused and has the ability to reduce through
implementation of conservation actions, a Climate Action Plan,
or corresponding efforts.
2.6 CLEAN AIR AND CLIMATE PROTECTION
SOFTWARE 2009
The City government operations and community-wide inventories
use the Clean Air and Climate Protection 2009 (CACP2009)
software package developed by ICLEI in partnership with the
National Association of Clean Air Agencies (NACAA) and Torrie
Smith Associates. This software calculates emissions resulting
from energy consumption, vehicle miles traveled, and waste
generation. The CACP2009 software calculates emissions using
specific factors (or coefficients) according to the type of fuel
used.
13 The Clean Air and Climate Protection (CACP2009) software 2009 was developed by the State and
Territorial Air Pollution Program Administrators and the Association of Local Air Pollution Control Officials (SAPPA/ALAPCO), the International Council for Local Environmental Issues (ICLEI), and Torrie Smith Associates.
What are Scopes?
The key principles to remember are that Scope 1 emissions are caused by activities within the city and emitted within the city (fuel combustion), while Scope 2 emissions are caused by activities within the city, but most likely are emitted outside of the city (electricity). Scope 3 emissions are indirect emissions, such as waste decomposition.
BASELINE GREENHOUSE GAS
EMISSIONS INVENTORY
City of Atascadero Page 23
CACP2009 aggregates and reports the three main greenhouse gas emissions (CO2, CH4, and
N2O) and converts them to equivalent carbon dioxide units, or CO2e. Equalizing the three main
greenhouse gas emissions as CO2e allows for the consideration of different greenhouse gases
in comparable terms. For example, methane (CH4) is 21 times more powerful than carbon
dioxide on a per weight basis in its capacity to trap heat, so the CACP2009 software converts
one metric ton of methane emissions to 21 metric tons of carbon dioxide equivalents.14
The emissions coefficients and quantification method employed by the CACP2009 software are
consistent with national and international inventory standards established by the
Intergovernmental Panel on Climate Change (1996 Revised IPCC Guidelines for the
Preparation of National Inventories) and the U.S. Voluntary Greenhouse Gas Reporting
Guidelines (EIA form1605).
14 The potency of a given gas in heating the atmosphere is defined as its Global Warming Potential, or
GWP. For more information on GWP see: IPCC Fourth Assessment Report, Working Group I, Chapter 2, Section 2.10.
COMMUNITY-WIDE AND
GOVERNMENT OPERATIONS 2005
Page 24 City of Atascadero
3. Community GHG Inventory Results
The City of Atascadero contains primarily residential and commercial land uses. In the 2005
baseline year, there were approximately 27,596 people, 8,550 jobs, and 10,009 households in
the city.15 The following section provides an overview of the emissions caused by activities
within the jurisdictional boundary of the city and analyzes the emissions in terms of scope,
sector, source, and population.
3.1 COMMUNITY-WIDE EMISSIONS BY SCOPE
Although there are countless items that can be included in a community-wide emissions
inventory, as discussed in Chapter 2, this Inventory includes Scope 1, Scope 2, and Scope 3
sources from the following sectors, consistent with the ICLEI protocol:
Residential
Commercial / Industrial
Transportation
Waste
Other – Off-Road Agricultural Equipment Emissions.
Table 3-1 summarizes the scopes of each sector in this analysis.
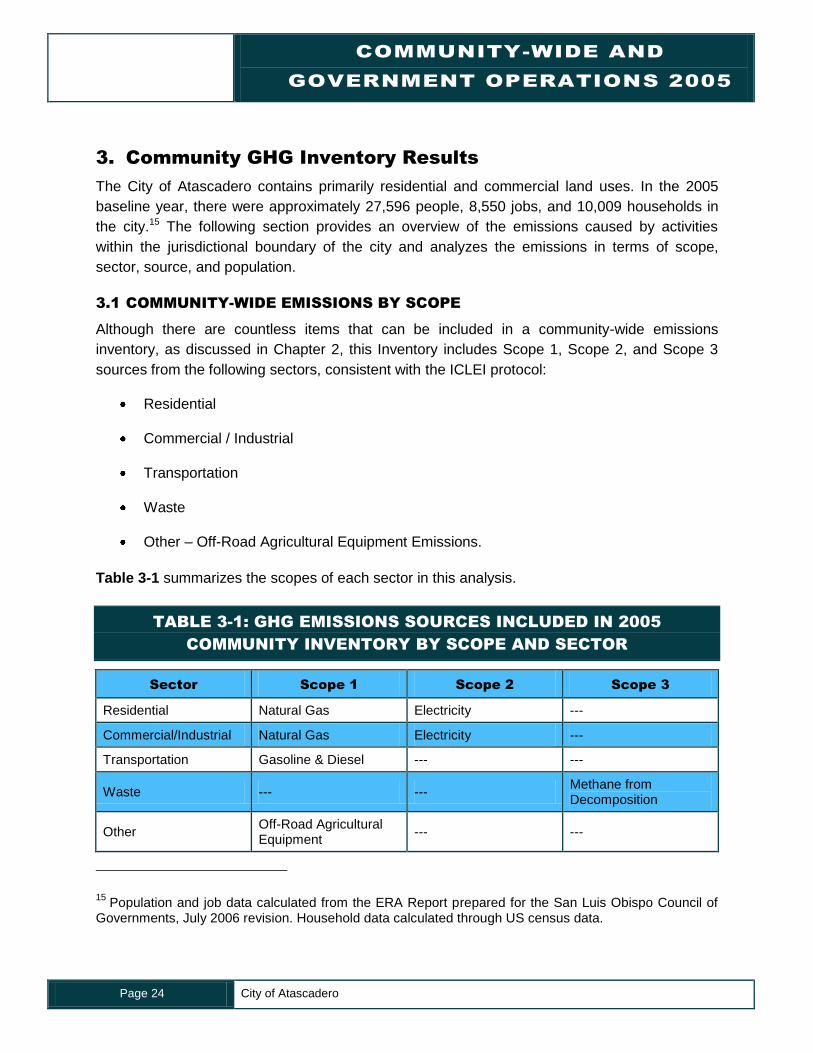
TABLE 3-1: GHG EMISSIONS SOURCES INCLUDED IN 2005
COMMUNITY INVENTORY BY SCOPE AND SECTOR
Sector Scope 1 Scope 2 Scope 3
Residential Natural Gas Electricity ---
Commercial/Industrial Natural Gas Electricity ---
Transportation Gasoline & Diesel --- ---
Waste --- --- Methane from Decomposition
Other Off-Road Agricultural Equipment
--- ---
15 Population and job data calculated from the ERA Report prepared for the San Luis Obispo Council of
Governments, July 2006 revision. Household data calculated through US census data.
BASELINE GREENHOUSE GAS
EMISSIONS INVENTORY
City of Atascadero Page 25
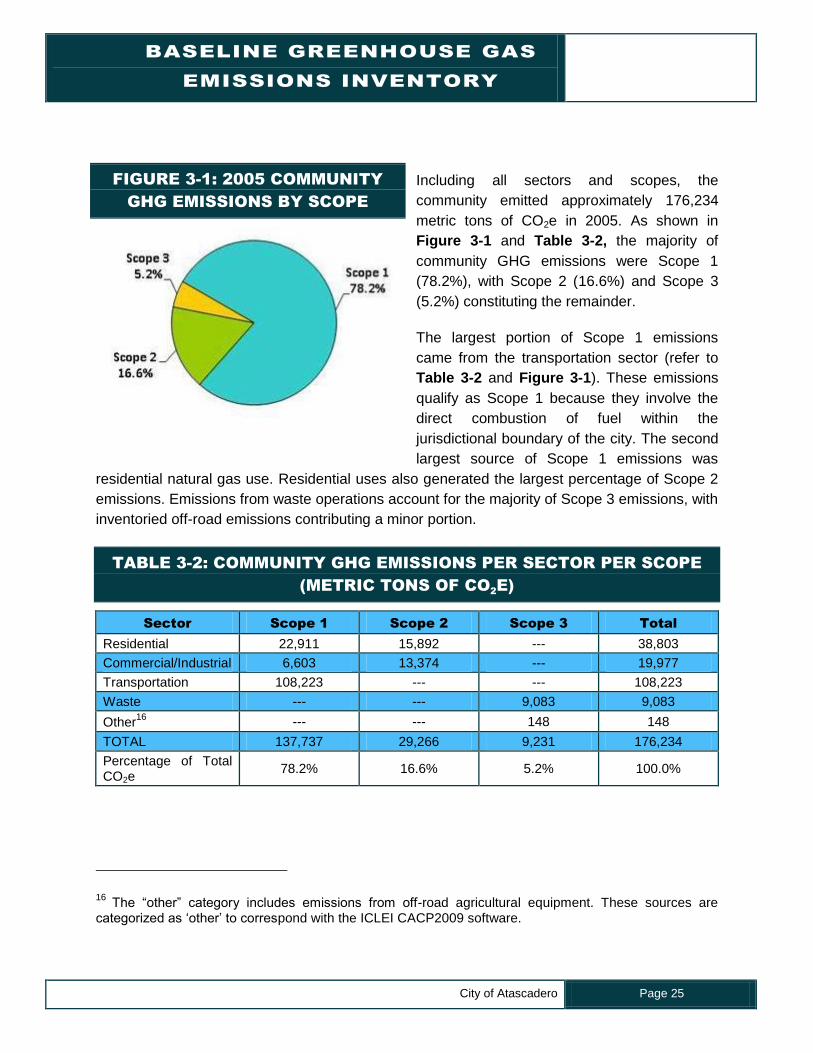
Including all sectors and scopes, the
community emitted approximately 176,234
metric tons of CO2e in 2005. As shown in
Figure 3-1 and Table 3-2, the majority of
community GHG emissions were Scope 1
(78.2%), with Scope 2 (16.6%) and Scope 3
(5.2%) constituting the remainder.
The largest portion of Scope 1 emissions
came from the transportation sector (refer to
Table 3-2 and Figure 3-1). These emissions
qualify as Scope 1 because they involve the
direct combustion of fuel within the
jurisdictional boundary of the city. The second
largest source of Scope 1 emissions was
residential natural gas use. Residential uses also generated the largest percentage of Scope 2
emissions. Emissions from waste operations account for the majority of Scope 3 emissions, with
inventoried off-road emissions contributing a minor portion.
TABLE 3-2: COMMUNITY GHG EMISSIONS PER SECTOR PER SCOPE
(METRIC TONS OF CO2E)
Sector Scope 1 Scope 2 Scope 3 Total
Residential 22,911 15,892 --- 38,803
Commercial/Industrial 6,603 13,374 --- 19,977
Transportation 108,223 --- --- 108,223
Waste --- --- 9,083 9,083
Other16
--- --- 148 148
TOTAL 137,737 29,266 9,231 176,234
Percentage of Total CO2e
78.2% 16.6% 5.2% 100.0%
16 The “other” category includes emissions from off-road agricultural equipment. These sources are
categorized as „other‟ to correspond with the ICLEI CACP2009 software.
FIGURE 3-1: 2005 COMMUNITY
GHG EMISSIONS BY SCOPE
COMMUNITY-WIDE AND
GOVERNMENT OPERATIONS 2005
Page 26 City of Atascadero
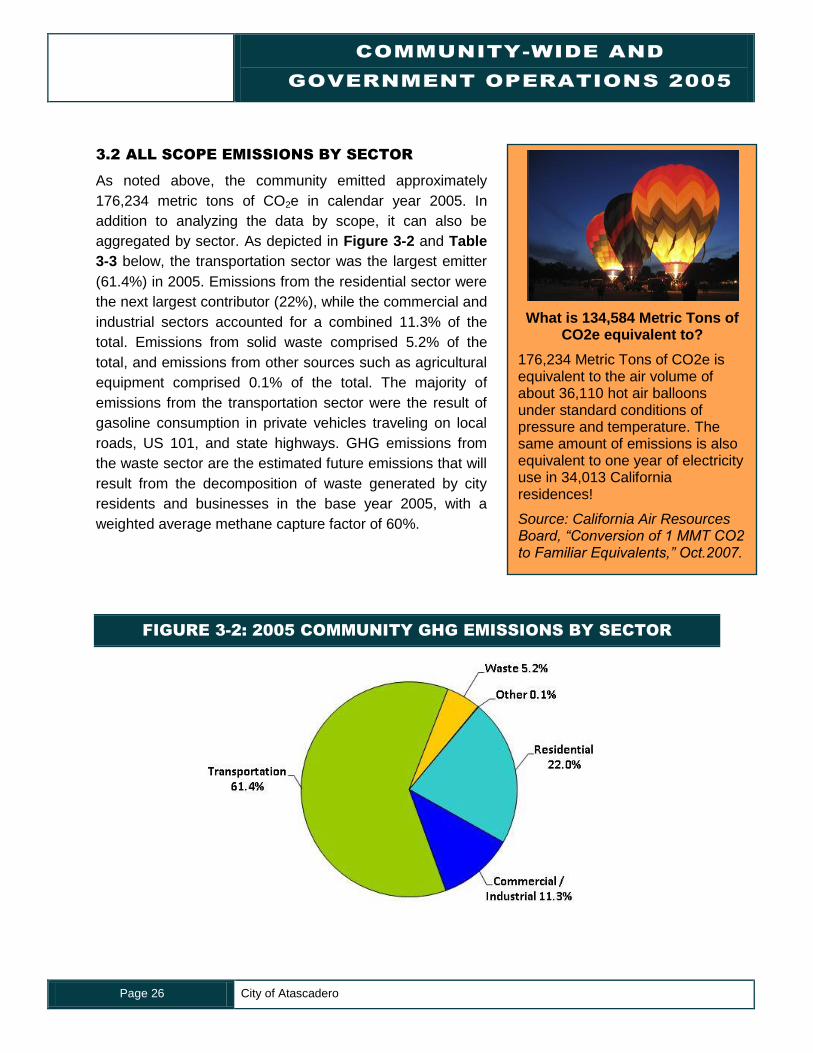
3.2 ALL SCOPE EMISSIONS BY SECTOR
As noted above, the community emitted approximately
176,234 metric tons of CO2e in calendar year 2005. In
addition to analyzing the data by scope, it can also be
aggregated by sector. As depicted in Figure 3-2 and Table
3-3 below, the transportation sector was the largest emitter
(61.4%) in 2005. Emissions from the residential sector were
the next largest contributor (22%), while the commercial and
industrial sectors accounted for a combined 11.3% of the
total. Emissions from solid waste comprised 5.2% of the
total, and emissions from other sources such as agricultural
equipment comprised 0.1% of the total. The majority of
emissions from the transportation sector were the result of
gasoline consumption in private vehicles traveling on local
roads, US 101, and state highways. GHG emissions from
the waste sector are the estimated future emissions that will
result from the decomposition of waste generated by city
residents and businesses in the base year 2005, with a
weighted average methane capture factor of 60%.
FIGURE 3-2: 2005 COMMUNITY GHG EMISSIONS BY SECTOR
What is 134,584 Metric Tons of CO2e equivalent to?
176,234 Metric Tons of CO2e is equivalent to the air volume of about 36,110 hot air balloons under standard conditions of pressure and temperature. The same amount of emissions is also equivalent to one year of electricity use in 34,013 California residences!
Source: California Air Resources Board, “Conversion of 1 MMT CO2 to Familiar Equivalents,” Oct.2007.
BASELINE GREENHOUSE GAS
EMISSIONS INVENTORY
City of Atascadero Page 27
TABLE 3-3: COMMUNITY GHG EMISSIONS BY SECTOR
(METRIC TONS OF CO2E)
2005
Community
Emissions
by Sector
Residential
Commercial/
Industrial
Trans-
portation
Waste Other17
TOTAL
CO2e (metric tons)
38,803 19,977 108,223 9,083 148 176,234
Percentage of Total CO2e
22.0% 11.3% 61.4% 5.2% 0.1% 100.0%
Energy Use (MMBtu)
670,824 327,542 1,540,285 n/a n/a 2,538,651
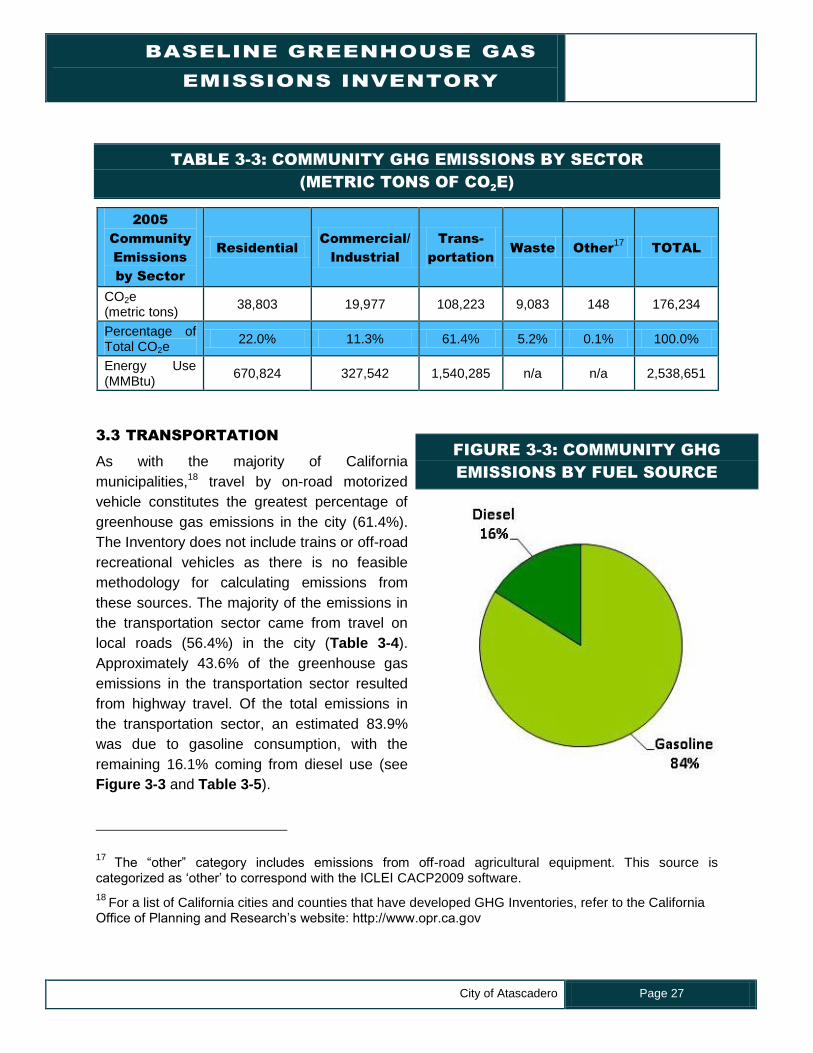
3.3 TRANSPORTATION
As with the majority of California
municipalities,18 travel by on-road motorized
vehicle constitutes the greatest percentage of
greenhouse gas emissions in the city (61.4%).
The Inventory does not include trains or off-road
recreational vehicles as there is no feasible
methodology for calculating emissions from
these sources. The majority of the emissions in
the transportation sector came from travel on
local roads (56.4%) in the city (Table 3-4).
Approximately 43.6% of the greenhouse gas
emissions in the transportation sector resulted
from highway travel. Of the total emissions in
the transportation sector, an estimated 83.9%
was due to gasoline consumption, with the
remaining 16.1% coming from diesel use (see
Figure 3-3 and Table 3-5).
17 The “other” category includes emissions from off-road agricultural equipment. This source is
categorized as „other‟ to correspond with the ICLEI CACP2009 software.
18 For a list of California cities and counties that have developed GHG Inventories, refer to the California
Office of Planning and Research‟s website: http://www.opr.ca.gov
FIGURE 3-3: COMMUNITY GHG
EMISSIONS BY FUEL SOURCE
COMMUNITY-WIDE AND
GOVERNMENT OPERATIONS 2005
Page 28 City of Atascadero
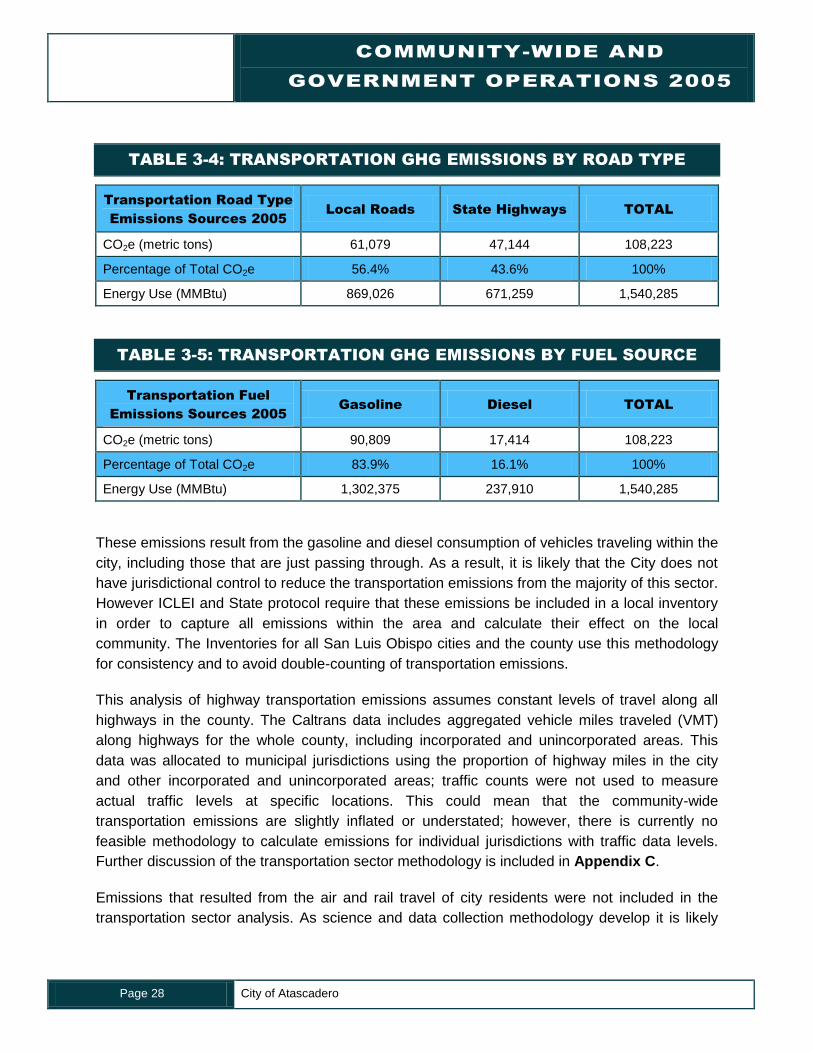
TABLE 3-4: TRANSPORTATION GHG EMISSIONS BY ROAD TYPE
Transportation Road Type
Emissions Sources 2005
Local Roads State Highways TOTAL
CO2e (metric tons) 61,079 47,144 108,223
Percentage of Total CO2e 56.4% 43.6% 100%
Energy Use (MMBtu) 869,026 671,259 1,540,285
TABLE 3-5: TRANSPORTATION GHG EMISSIONS BY FUEL SOURCE
Transportation Fuel
Emissions Sources 2005
Gasoline Diesel TOTAL
CO2e (metric tons) 90,809 17,414 108,223
Percentage of Total CO2e 83.9% 16.1% 100%
Energy Use (MMBtu) 1,302,375 237,910 1,540,285
These emissions result from the gasoline and diesel consumption of vehicles traveling within the
city, including those that are just passing through. As a result, it is likely that the City does not
have jurisdictional control to reduce the transportation emissions from the majority of this sector.
However ICLEI and State protocol require that these emissions be included in a local inventory
in order to capture all emissions within the area and calculate their effect on the local
community. The Inventories for all San Luis Obispo cities and the county use this methodology
for consistency and to avoid double-counting of transportation emissions.
This analysis of highway transportation emissions assumes constant levels of travel along all
highways in the county. The Caltrans data includes aggregated vehicle miles traveled (VMT)
along highways for the whole county, including incorporated and unincorporated areas. This
data was allocated to municipal jurisdictions using the proportion of highway miles in the city
and other incorporated and unincorporated areas; traffic counts were not used to measure
actual traffic levels at specific locations. This could mean that the community-wide
transportation emissions are slightly inflated or understated; however, there is currently no
feasible methodology to calculate emissions for individual jurisdictions with traffic data levels.
Further discussion of the transportation sector methodology is included in Appendix C.
Emissions that resulted from the air and rail travel of city residents were not included in the
transportation sector analysis. As science and data collection methodology develop it is likely
BASELINE GREENHOUSE GAS
EMISSIONS INVENTORY
City of Atascadero Page 29
that the greenhouse gas emissions from air, rail and boat travel could be estimated as a Scope
3 items. Please see Appendix C for more detail on methods and emissions factors used in
calculating emissions from the transportation sector.
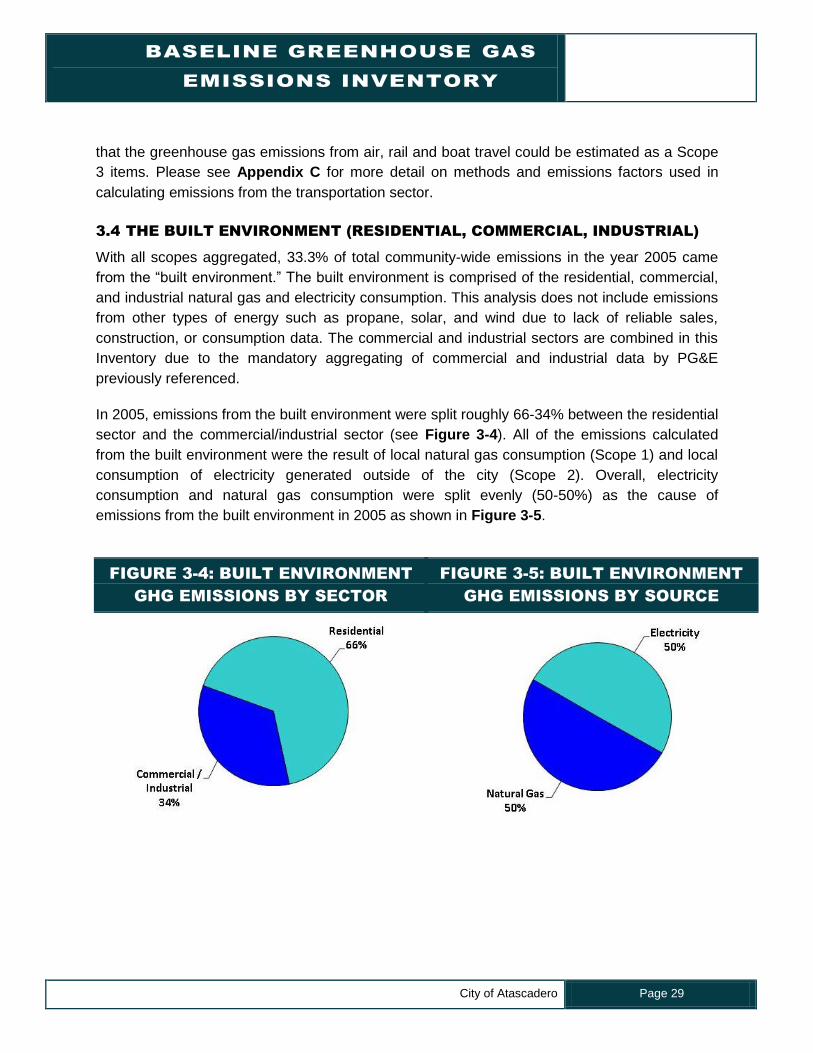
3.4 THE BUILT ENVIRONMENT (RESIDENTIAL, COMMERCIAL, INDUSTRIAL)
With all scopes aggregated, 33.3% of total community-wide emissions in the year 2005 came
from the “built environment.” The built environment is comprised of the residential, commercial,
and industrial natural gas and electricity consumption. This analysis does not include emissions
from other types of energy such as propane, solar, and wind due to lack of reliable sales,
construction, or consumption data. The commercial and industrial sectors are combined in this
Inventory due to the mandatory aggregating of commercial and industrial data by PG&E
previously referenced.
In 2005, emissions from the built environment were split roughly 66-34% between the residential
sector and the commercial/industrial sector (see Figure 3-4). All of the emissions calculated
from the built environment were the result of local natural gas consumption (Scope 1) and local
consumption of electricity generated outside of the city (Scope 2). Overall, electricity
consumption and natural gas consumption were split evenly (50-50%) as the cause of
emissions from the built environment in 2005 as shown in Figure 3-5.
FIGURE 3-4: BUILT ENVIRONMENT
GHG EMISSIONS BY SECTOR
FIGURE 3-5: BUILT ENVIRONMENT
GHG EMISSIONS BY SOURCE
COMMUNITY-WIDE AND
GOVERNMENT OPERATIONS 2005
Page 30 City of Atascadero
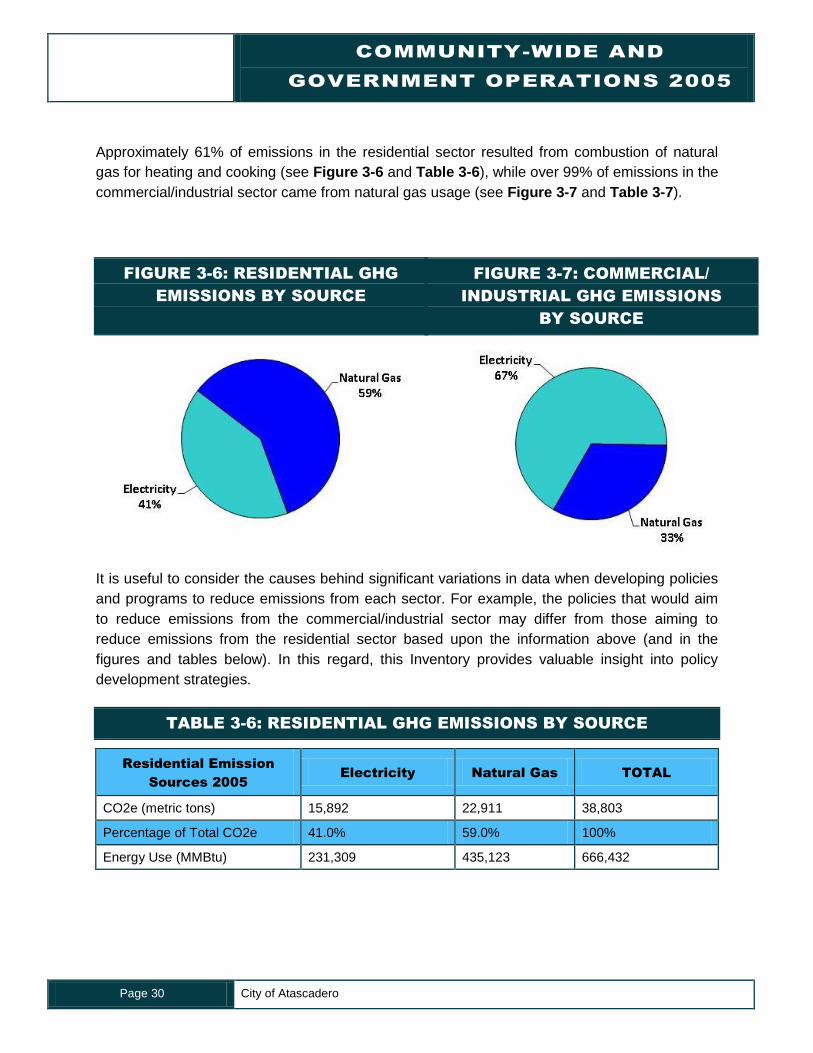
Approximately 61% of emissions in the residential sector resulted from combustion of natural
gas for heating and cooking (see Figure 3-6 and Table 3-6), while over 99% of emissions in the
commercial/industrial sector came from natural gas usage (see Figure 3-7 and Table 3-7).
It is useful to consider the causes behind significant variations in data when developing policies
and programs to reduce emissions from each sector. For example, the policies that would aim
to reduce emissions from the commercial/industrial sector may differ from those aiming to
reduce emissions from the residential sector based upon the information above (and in the
figures and tables below). In this regard, this Inventory provides valuable insight into policy
development strategies.
TABLE 3-6: RESIDENTIAL GHG EMISSIONS BY SOURCE
Residential Emission
Sources 2005
Electricity Natural Gas TOTAL
CO2e (metric tons) 15,892 22,911 38,803
Percentage of Total CO2e 41.0% 59.0% 100%
Energy Use (MMBtu) 231,309 435,123 666,432
FIGURE 3-6: RESIDENTIAL GHG
EMISSIONS BY SOURCE
FIGURE 3-7: COMMERCIAL/
INDUSTRIAL GHG EMISSIONS
BY SOURCE
BASELINE GREENHOUSE GAS
EMISSIONS INVENTORY
City of Atascadero Page 31
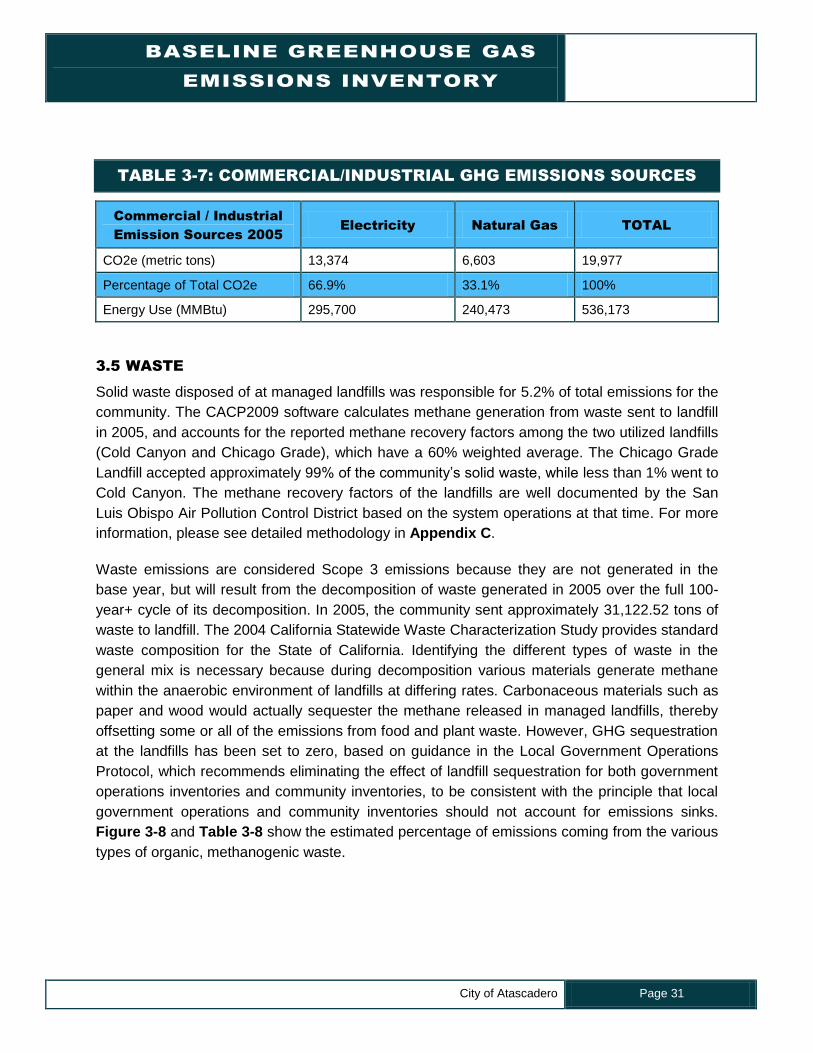
TABLE 3-7: COMMERCIAL/INDUSTRIAL GHG EMISSIONS SOURCES
Commercial / Industrial
Emission Sources 2005
Electricity Natural Gas TOTAL
CO2e (metric tons) 13,374 6,603 19,977
Percentage of Total CO2e 66.9% 33.1% 100%
Energy Use (MMBtu) 295,700 240,473 536,173
3.5 WASTE
Solid waste disposed of at managed landfills was responsible for 5.2% of total emissions for the
community. The CACP2009 software calculates methane generation from waste sent to landfill
in 2005, and accounts for the reported methane recovery factors among the two utilized landfills
(Cold Canyon and Chicago Grade), which have a 60% weighted average. The Chicago Grade
Landfill accepted approximately 99% of the community‟s solid waste, while less than 1% went to
Cold Canyon. The methane recovery factors of the landfills are well documented by the San
Luis Obispo Air Pollution Control District based on the system operations at that time. For more
information, please see detailed methodology in Appendix C.
Waste emissions are considered Scope 3 emissions because they are not generated in the
base year, but will result from the decomposition of waste generated in 2005 over the full 100-
year+ cycle of its decomposition. In 2005, the community sent approximately 31,122.52 tons of
waste to landfill. The 2004 California Statewide Waste Characterization Study provides standard
waste composition for the State of California. Identifying the different types of waste in the
general mix is necessary because during decomposition various materials generate methane
within the anaerobic environment of landfills at differing rates. Carbonaceous materials such as
paper and wood would actually sequester the methane released in managed landfills, thereby
offsetting some or all of the emissions from food and plant waste. However, GHG sequestration
at the landfills has been set to zero, based on guidance in the Local Government Operations
Protocol, which recommends eliminating the effect of landfill sequestration for both government
operations inventories and community inventories, to be consistent with the principle that local
government operations and community inventories should not account for emissions sinks.
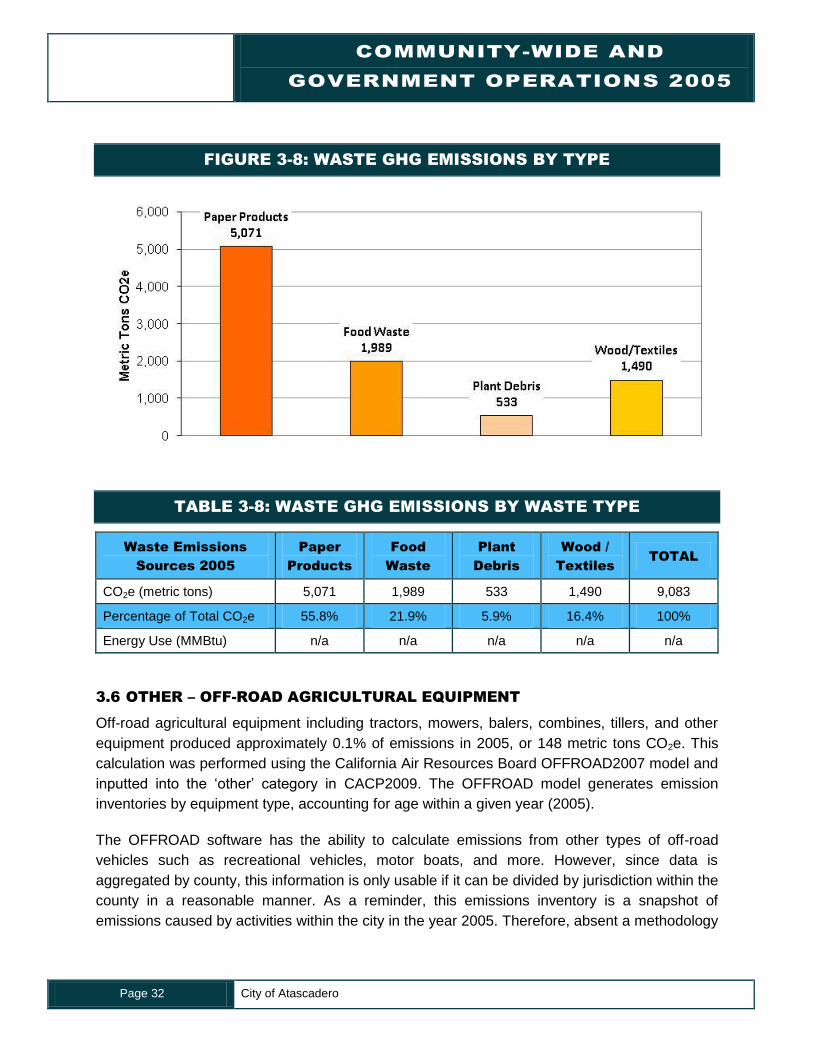
Figure 3-8 and Table 3-8 show the estimated percentage of emissions coming from the various
types of organic, methanogenic waste.
COMMUNITY-WIDE AND
GOVERNMENT OPERATIONS 2005
Page 32 City of Atascadero
FIGURE 3-8: WASTE GHG EMISSIONS BY TYPE
TABLE 3-8: WASTE GHG EMISSIONS BY WASTE TYPE
Waste Emissions
Sources 2005
Paper
Products
Food
Waste
Plant
Debris
Wood /
Textiles
TOTAL
CO2e (metric tons) 5,071 1,989 533 1,490 9,083
Percentage of Total CO2e 55.8% 21.9% 5.9% 16.4% 100%
Energy Use (MMBtu) n/a n/a n/a n/a n/a
3.6 OTHER – OFF-ROAD AGRICULTURAL EQUIPMENT
Off-road agricultural equipment including tractors, mowers, balers, combines, tillers, and other
equipment produced approximately 0.1% of emissions in 2005, or 148 metric tons CO2e. This
calculation was performed using the California Air Resources Board OFFROAD2007 model and
inputted into the „other‟ category in CACP2009. The OFFROAD model generates emission
inventories by equipment type, accounting for age within a given year (2005).
The OFFROAD software has the ability to calculate emissions from other types of off-road
vehicles such as recreational vehicles, motor boats, and more. However, since data is
aggregated by county, this information is only usable if it can be divided by jurisdiction within the
county in a reasonable manner. As a reminder, this emissions inventory is a snapshot of
emissions caused by activities within the city in the year 2005. Therefore, absent a methodology
BASELINE GREENHOUSE GAS
EMISSIONS INVENTORY
City of Atascadero Page 33
for estimating the portion of off-road vehicles driven or used within various jurisdictions,
OFFROAD data cannot be allocated to different jurisdictions. As current practice and
methodology stands, population data is not an acceptable measure of emissions per jurisdiction.
To complete the analysis of impacts associated with agriculture activities, the Inventory
allocated total agricultural emissions by the percentage of agricultural and open space land
contained in each jurisdiction. For consistency, county agriculture and crop GIS data from 2007
was utilized to determine acreage within each jurisdiction. The city held a very minor part of
agricultural land (0.23%) and therefore only a small portion associated off-road agricultural
equipment emissions.
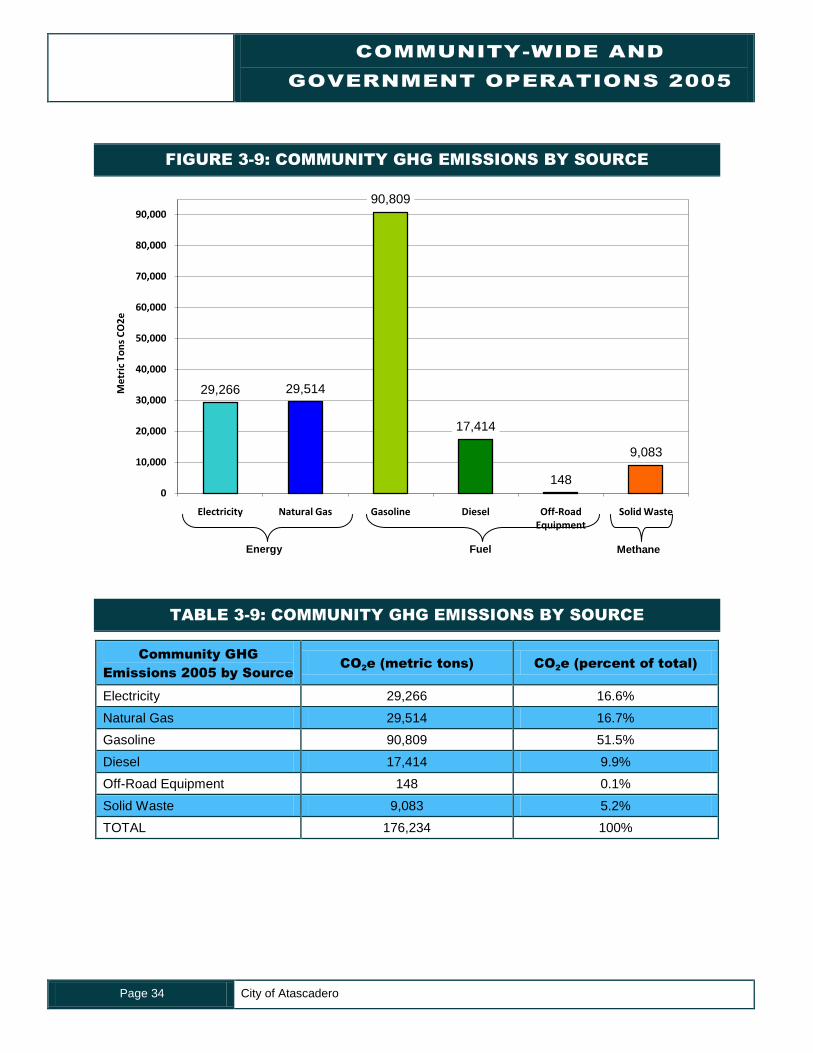
3.7 COMMUNITY EMISSIONS BY SOURCE
In addition to viewing emissions by sector and by scope, policy and programs development can
benefit from an analysis of emissions according to their raw fuel or waste source. Figure 3-9
and Table 3-9 below demonstrates that more than half (51.5%) of all community emissions
come from the consumption of gasoline on local roads and highways. Natural gas (16.7%) and
electricity (16.6%) consumption from the built environment are the next most significant figures,
with the remainder coming from diesel, off-road equipment and various waste products.
Methane released from the City‟s wastewater treatment plant is not included in this figure
because the wastewater treatment plant is considered a point source emitter. Point source
emitters are not captured at the community-wide scale in greenhouse gas emissions
inventories.
Off-Road Emissions in San Luis Obispo County
According to a report by the Center for Biological Diversity, off-road vehicle use in California releases as much GHG as burning 500,000 barrels of oil each year, which is equivalent to more than 1.5 million car trips from San Francisco to Los Angeles. Despite this fact, there is no current methodology to calculate GHGs from off-road vehicles at the local level. The California Air Resources Board OFFROAD2007 model produces countywide figures for San Luis Obispo County which cannot be separated by jurisdiction. This is for two main reasons: 1) Many off-road vehicles, such as motor boats and recreational vehicles, are operated outside of County jurisdiction in State-owned parks or waters, and 2) There are wide degrees of variability in off-road vehicle use and fuel consumption. For instance, if we allocated the emissions from off-road agricultural equipment by population and not by portion of agricultural land, cities that have minimal agricultural lands, would receive an equal portion of agricultural emissions per person as the county, which has 98% of agricultural land in the county. This approach would misrepresent emissions.
Source: Center for Biological Diversity
COMMUNITY-WIDE AND
GOVERNMENT OPERATIONS 2005
Page 34 City of Atascadero
FIGURE 3-9: COMMUNITY GHG EMISSIONS BY SOURCE
TABLE 3-9: COMMUNITY GHG EMISSIONS BY SOURCE
Community GHG
Emissions 2005 by Source
CO2e (metric tons) CO
2e (percent of total)
Electricity 29,266 16.6%
Natural Gas 29,514 16.7%
Gasoline 90,809 51.5%
Diesel 17,414 9.9%
Off-Road Equipment 148 0.1%
Solid Waste 9,083 5.2%
TOTAL 176,234 100%
29,266 29,514
90,809
17,414
148
9,083
0
10,000
20,000
30,000
40,000
50,000
60,000
70,000
80,000
90,000
Electricity Natural Gas Gasoline Diesel Off-Road Equipment
Solid Waste
Me
tric
To
ns
CO
2e
Energy Fuel Methane
BASELINE GREENHOUSE GAS
EMISSIONS INVENTORY
City of Atascadero Page 35
3.8 PER CAPITA EMISSIONS
Per capita emissions can be a useful metric for measuring
progress in reducing greenhouse gases and for comparing one
community‟s emissions with neighboring cities and against
regional and national averages. Currently it is difficult to make
meaningful comparisons between local inventories because of
variations in the scope of inventories conducted. For instance,
this Inventory takes in to account emissions from agricultural off-
road vehicles, which many inventories like the Sonoma County
GHG Inventory do not. Only when ICLEI, the California Air
Resources Board, and other organizations adopt universal
reporting standards will local inventories be prepared in a
consistent manner and therefore be comparable.
Simply dividing total community greenhouse gas emissions by
city population in 2005 (27,596) yields a result of 6.79 metric tons
CO2e per capita.19 It is important to understand that this number
is not the same as the carbon footprint of the average individual
living in the City of Atascadero. It is also important to note that
the per capita emissions number for the city is not directly
comparable to every per capita number produced by other
emissions studies because of differences in emission inventory
methods.
19 Population in 2005 derived from the San Luis Obispo Council of Governments Long Range Socio-
Economic Projections (Year 2025); July 2006 Revision.
What’s the difference between an emissions inventory and a carbon
footprint?
An emissions inventory incorporates emissions directly caused by actions taken within the county that we know how to calculate. A carbon footprint, on the other hand, encompasses greenhouse gas emissions from the entire life cycle of a product or service. This could include the emissions from raising beef for sale at the supermarket or the fuel consumption associated with residents‟ flights out of SBP for vacation. At this time, it is difficult to accurately estimate the community‟s carbon footprint. However, individuals may reduce their carbon footprint by buying locally produced foods and goods, reducing packaging, and other behavioral changes.
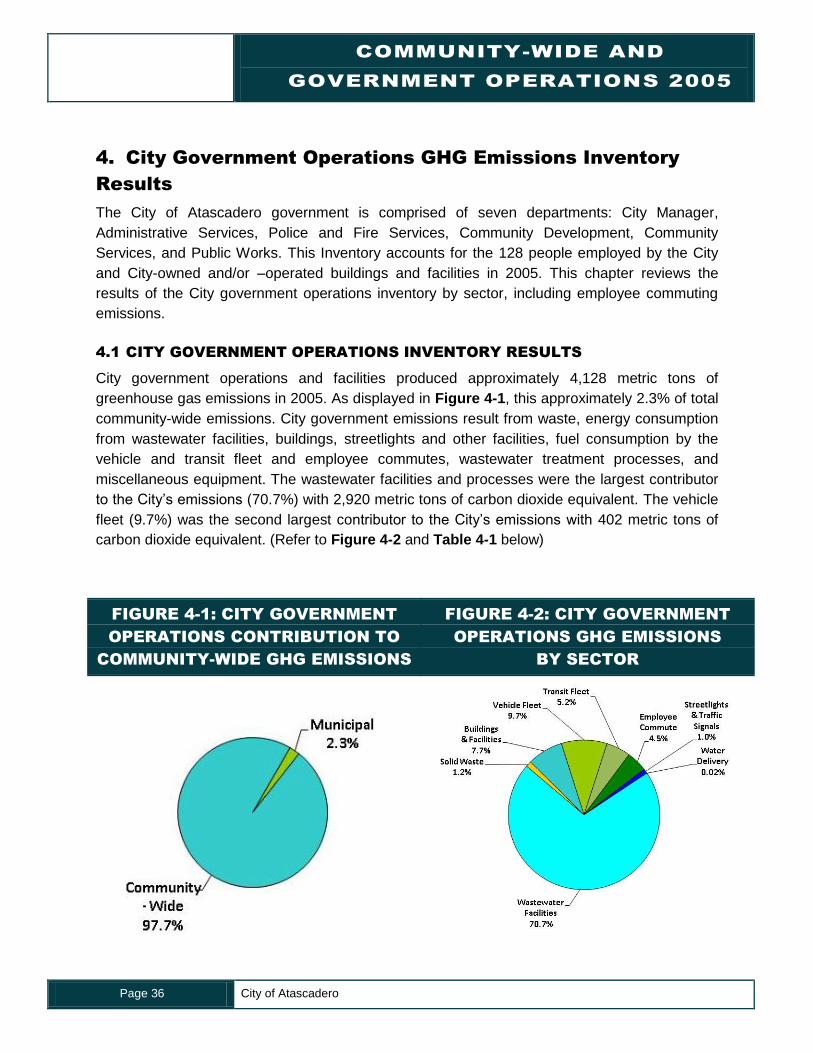
COMMUNITY-WIDE AND
GOVERNMENT OPERATIONS 2005
Page 36 City of Atascadero
4. City Government Operations GHG Emissions Inventory
Results
The City of Atascadero government is comprised of seven departments: City Manager,
Administrative Services, Police and Fire Services, Community Development, Community
Services, and Public Works. This Inventory accounts for the 128 people employed by the City
and City-owned and/or –operated buildings and facilities in 2005. This chapter reviews the
results of the City government operations inventory by sector, including employee commuting
emissions.
4.1 CITY GOVERNMENT OPERATIONS INVENTORY RESULTS
City government operations and facilities produced approximately 4,128 metric tons of
greenhouse gas emissions in 2005. As displayed in Figure 4-1, this approximately 2.3% of total
community-wide emissions. City government emissions result from waste, energy consumption
from wastewater facilities, buildings, streetlights and other facilities, fuel consumption by the
vehicle and transit fleet and employee commutes, wastewater treatment processes, and
miscellaneous equipment. The wastewater facilities and processes were the largest contributor
to the City‟s emissions (70.7%) with 2,920 metric tons of carbon dioxide equivalent. The vehicle
fleet (9.7%) was the second largest contributor to the City‟s emissions with 402 metric tons of
carbon dioxide equivalent. (Refer to Figure 4-2 and Table 4-1 below)
FIGURE 4-2: CITY GOVERNMENT
OPERATIONS GHG EMISSIONS
BY SECTOR
FIGURE 4-1: CITY GOVERNMENT
OPERATIONS CONTRIBUTION TO
COMMUNITY-WIDE GHG EMISSIONS
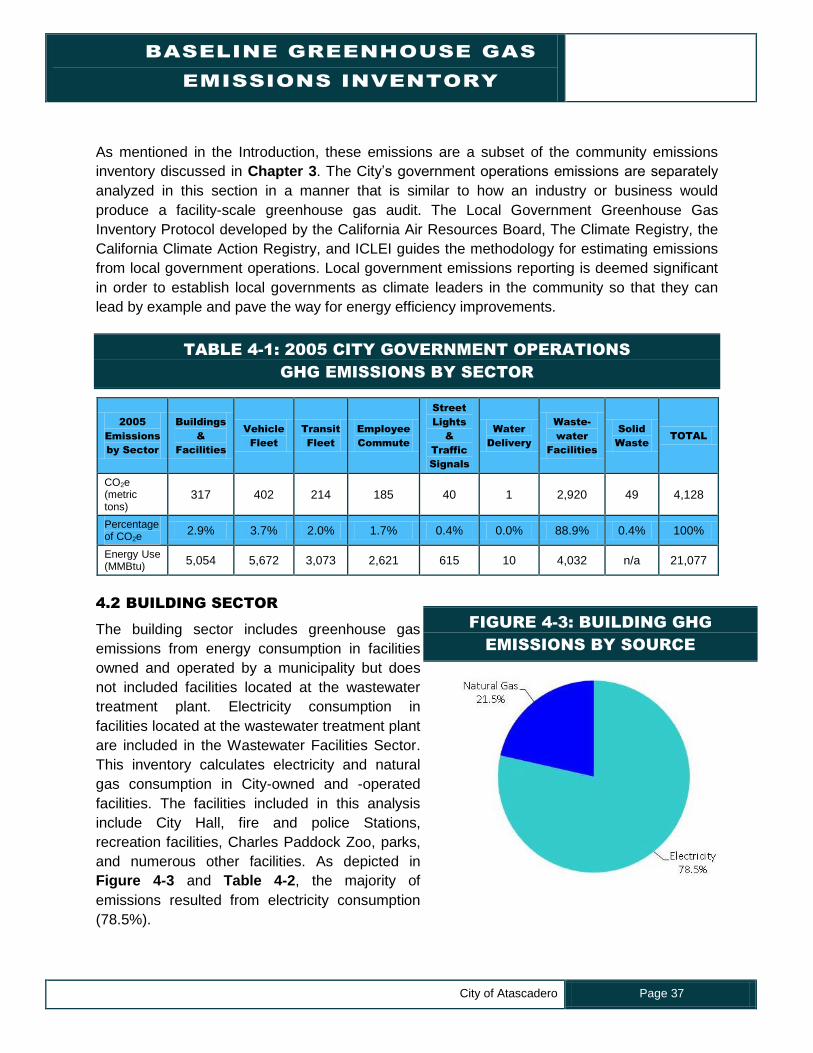
BASELINE GREENHOUSE GAS
EMISSIONS INVENTORY
City of Atascadero Page 37
As mentioned in the Introduction, these emissions are a subset of the community emissions
inventory discussed in Chapter 3. The City‟s government operations emissions are separately
analyzed in this section in a manner that is similar to how an industry or business would
produce a facility-scale greenhouse gas audit. The Local Government Greenhouse Gas
Inventory Protocol developed by the California Air Resources Board, The Climate Registry, the
California Climate Action Registry, and ICLEI guides the methodology for estimating emissions
from local government operations. Local government emissions reporting is deemed significant
in order to establish local governments as climate leaders in the community so that they can
lead by example and pave the way for energy efficiency improvements.
TABLE 4-1: 2005 CITY GOVERNMENT OPERATIONS
GHG EMISSIONS BY SECTOR
2005
Emissions
by Sector
Buildings
&
Facilities
Vehicle
Fleet
Transit
Fleet
Employee
Commute
Street
Lights
&
Traffic
Signals
Water
Delivery
Waste-
water
Facilities
Solid
Waste
TOTAL
CO2e (metric tons)
317 402 214 185 40 1 2,920 49 4,128
Percentage of CO2e
2.9% 3.7% 2.0% 1.7% 0.4% 0.0% 88.9% 0.4% 100%
Energy Use (MMBtu)
5,054 5,672 3,073 2,621 615 10 4,032 n/a 21,077
4.2 BUILDING SECTOR
The building sector includes greenhouse gas
emissions from energy consumption in facilities
owned and operated by a municipality but does
not included facilities located at the wastewater
treatment plant. Electricity consumption in
facilities located at the wastewater treatment plant
are included in the Wastewater Facilities Sector.
This inventory calculates electricity and natural
gas consumption in City-owned and -operated
facilities. The facilities included in this analysis
include City Hall, fire and police Stations,
recreation facilities, Charles Paddock Zoo, parks,
and numerous other facilities. As depicted in
Figure 4-3 and Table 4-2, the majority of
emissions resulted from electricity consumption
(78.5%).
FIGURE 4-3: BUILDING GHG
EMISSIONS BY SOURCE
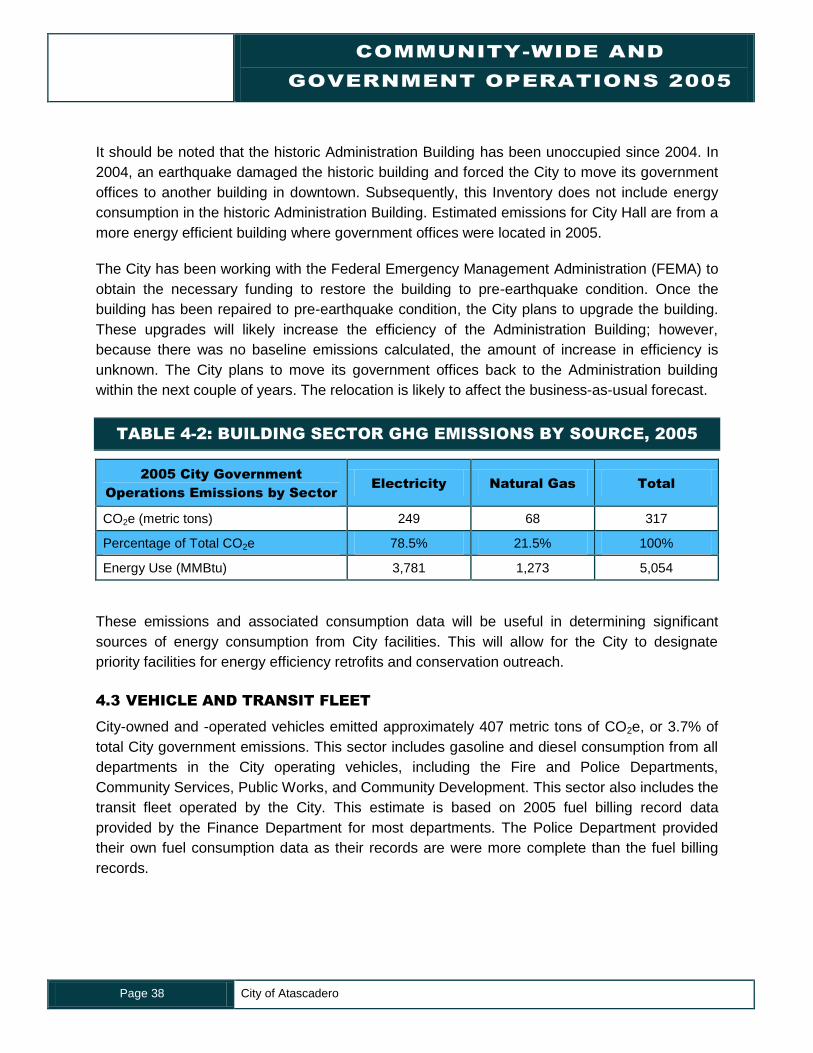
COMMUNITY-WIDE AND
GOVERNMENT OPERATIONS 2005
Page 38 City of Atascadero
It should be noted that the historic Administration Building has been unoccupied since 2004. In
2004, an earthquake damaged the historic building and forced the City to move its government
offices to another building in downtown. Subsequently, this Inventory does not include energy
consumption in the historic Administration Building. Estimated emissions for City Hall are from a
more energy efficient building where government offices were located in 2005.
The City has been working with the Federal Emergency Management Administration (FEMA) to
obtain the necessary funding to restore the building to pre-earthquake condition. Once the
building has been repaired to pre-earthquake condition, the City plans to upgrade the building.
These upgrades will likely increase the efficiency of the Administration Building; however,
because there was no baseline emissions calculated, the amount of increase in efficiency is
unknown. The City plans to move its government offices back to the Administration building
within the next couple of years. The relocation is likely to affect the business-as-usual forecast.
TABLE 4-2: BUILDING SECTOR GHG EMISSIONS BY SOURCE, 2005
2005 City Government
Operations Emissions by Sector
Electricity Natural Gas Total
CO2e (metric tons) 249 68 317
Percentage of Total CO2e 78.5% 21.5% 100%
Energy Use (MMBtu) 3,781 1,273 5,054
These emissions and associated consumption data will be useful in determining significant
sources of energy consumption from City facilities. This will allow for the City to designate
priority facilities for energy efficiency retrofits and conservation outreach.
4.3 VEHICLE AND TRANSIT FLEET
City-owned and -operated vehicles emitted approximately 407 metric tons of CO2e, or 3.7% of
total City government emissions. This sector includes gasoline and diesel consumption from all
departments in the City operating vehicles, including the Fire and Police Departments,
Community Services, Public Works, and Community Development. This sector also includes the
transit fleet operated by the City. This estimate is based on 2005 fuel billing record data
provided by the Finance Department for most departments. The Police Department provided
their own fuel consumption data as their records are were more complete than the fuel billing
records.
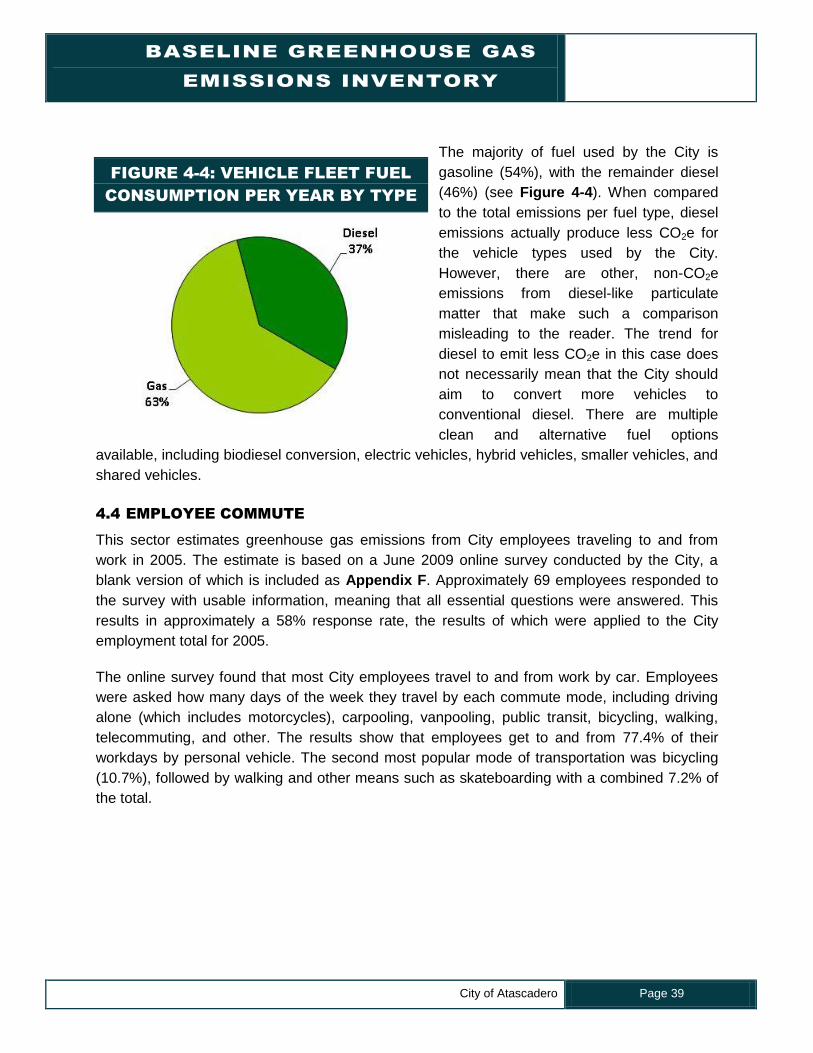
BASELINE GREENHOUSE GAS
EMISSIONS INVENTORY
City of Atascadero Page 39
The majority of fuel used by the City is
gasoline (54%), with the remainder diesel
(46%) (see Figure 4-4). When compared
to the total emissions per fuel type, diesel
emissions actually produce less CO2e for
the vehicle types used by the City.
However, there are other, non-CO2e
emissions from diesel-like particulate
matter that make such a comparison
misleading to the reader. The trend for
diesel to emit less CO2e in this case does
not necessarily mean that the City should
aim to convert more vehicles to
conventional diesel. There are multiple
clean and alternative fuel options
available, including biodiesel conversion, electric vehicles, hybrid vehicles, smaller vehicles, and
shared vehicles.
4.4 EMPLOYEE COMMUTE
This sector estimates greenhouse gas emissions from City employees traveling to and from
work in 2005. The estimate is based on a June 2009 online survey conducted by the City, a
blank version of which is included as Appendix F. Approximately 69 employees responded to
the survey with usable information, meaning that all essential questions were answered. This
results in approximately a 58% response rate, the results of which were applied to the City
employment total for 2005.
The online survey found that most City employees travel to and from work by car. Employees
were asked how many days of the week they travel by each commute mode, including driving
alone (which includes motorcycles), carpooling, vanpooling, public transit, bicycling, walking,
telecommuting, and other. The results show that employees get to and from 77.4% of their
workdays by personal vehicle. The second most popular mode of transportation was bicycling
(10.7%), followed by walking and other means such as skateboarding with a combined 7.2% of
the total.
FIGURE 4-4: VEHICLE FLEET FUEL
CONSUMPTION PER YEAR BY TYPE
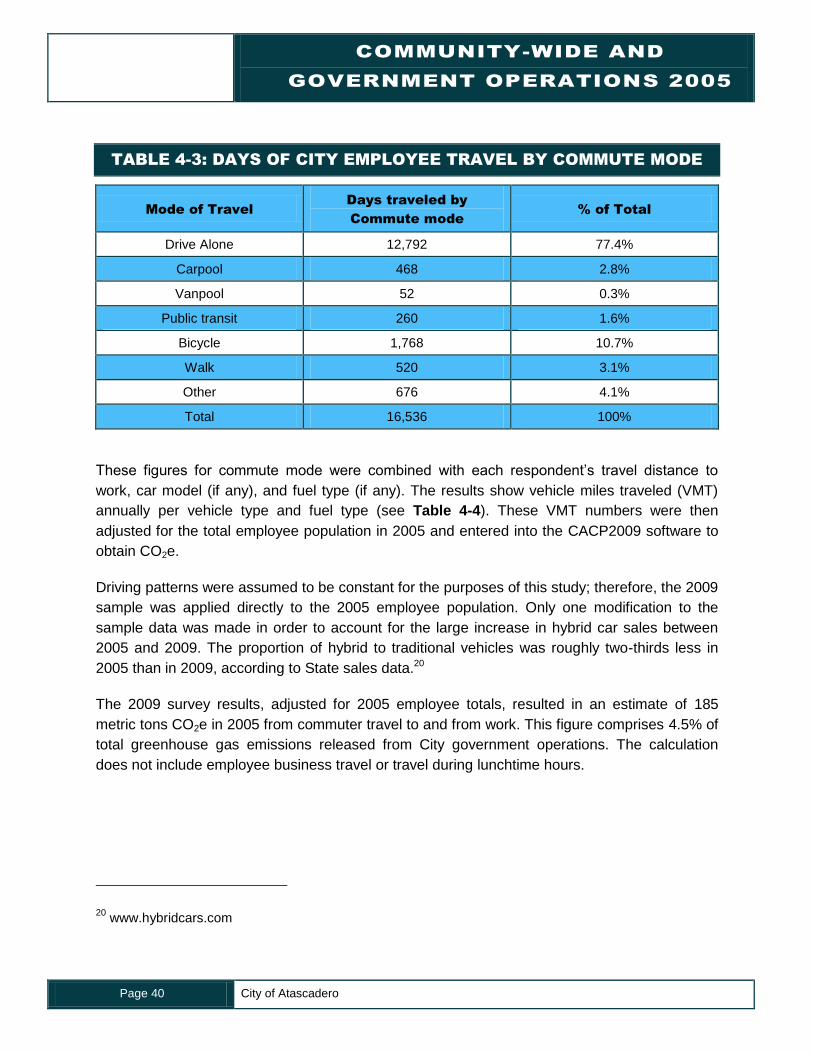
COMMUNITY-WIDE AND
GOVERNMENT OPERATIONS 2005
Page 40 City of Atascadero
TABLE 4-3: DAYS OF CITY EMPLOYEE TRAVEL BY COMMUTE MODE
Mode of Travel
Days traveled by
Commute mode
% of Total
Drive Alone 12,792 77.4%
Carpool 468 2.8%
Vanpool 52 0.3%
Public transit 260 1.6%
Bicycle 1,768 10.7%
Walk 520 3.1%
Other 676 4.1%
Total 16,536 100%
These figures for commute mode were combined with each respondent‟s travel distance to
work, car model (if any), and fuel type (if any). The results show vehicle miles traveled (VMT)
annually per vehicle type and fuel type (see Table 4-4). These VMT numbers were then
adjusted for the total employee population in 2005 and entered into the CACP2009 software to
obtain CO2e.
Driving patterns were assumed to be constant for the purposes of this study; therefore, the 2009
sample was applied directly to the 2005 employee population. Only one modification to the
sample data was made in order to account for the large increase in hybrid car sales between
2005 and 2009. The proportion of hybrid to traditional vehicles was roughly two-thirds less in
2005 than in 2009, according to State sales data.20
The 2009 survey results, adjusted for 2005 employee totals, resulted in an estimate of 185
metric tons CO2e in 2005 from commuter travel to and from work. This figure comprises 4.5% of
total greenhouse gas emissions released from City government operations. The calculation
does not include employee business travel or travel during lunchtime hours.
20 www.hybridcars.com
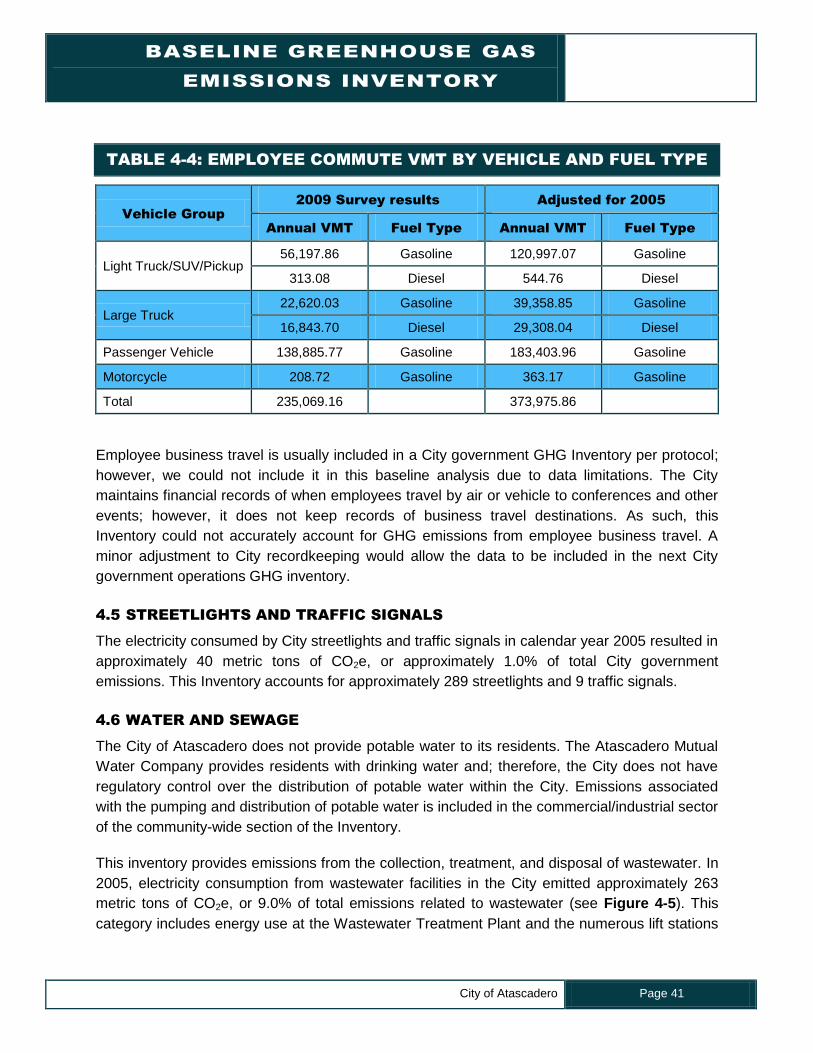
BASELINE GREENHOUSE GAS
EMISSIONS INVENTORY
City of Atascadero Page 41
TABLE 4-4: EMPLOYEE COMMUTE VMT BY VEHICLE AND FUEL TYPE
Vehicle Group
2009 Survey results Adjusted for 2005
Annual VMT Fuel Type Annual VMT Fuel Type
Light Truck/SUV/Pickup 56,197.86 Gasoline 120,997.07 Gasoline
313.08 Diesel 544.76 Diesel
Large Truck 22,620.03 Gasoline 39,358.85 Gasoline
16,843.70 Diesel 29,308.04 Diesel
Passenger Vehicle 138,885.77 Gasoline 183,403.96 Gasoline
Motorcycle 208.72 Gasoline 363.17 Gasoline
Total 235,069.16 373,975.86
Employee business travel is usually included in a City government GHG Inventory per protocol;
however, we could not include it in this baseline analysis due to data limitations. The City
maintains financial records of when employees travel by air or vehicle to conferences and other
events; however, it does not keep records of business travel destinations. As such, this
Inventory could not accurately account for GHG emissions from employee business travel. A
minor adjustment to City recordkeeping would allow the data to be included in the next City
government operations GHG inventory.
4.5 STREETLIGHTS AND TRAFFIC SIGNALS
The electricity consumed by City streetlights and traffic signals in calendar year 2005 resulted in
approximately 40 metric tons of CO2e, or approximately 1.0% of total City government
emissions. This Inventory accounts for approximately 289 streetlights and 9 traffic signals.
4.6 WATER AND SEWAGE
The City of Atascadero does not provide potable water to its residents. The Atascadero Mutual
Water Company provides residents with drinking water and; therefore, the City does not have
regulatory control over the distribution of potable water within the City. Emissions associated
with the pumping and distribution of potable water is included in the commercial/industrial sector
of the community-wide section of the Inventory.
This inventory provides emissions from the collection, treatment, and disposal of wastewater. In
2005, electricity consumption from wastewater facilities in the City emitted approximately 263
metric tons of CO2e, or 9.0% of total emissions related to wastewater (see Figure 4-5). This
category includes energy use at the Wastewater Treatment Plant and the numerous lift stations
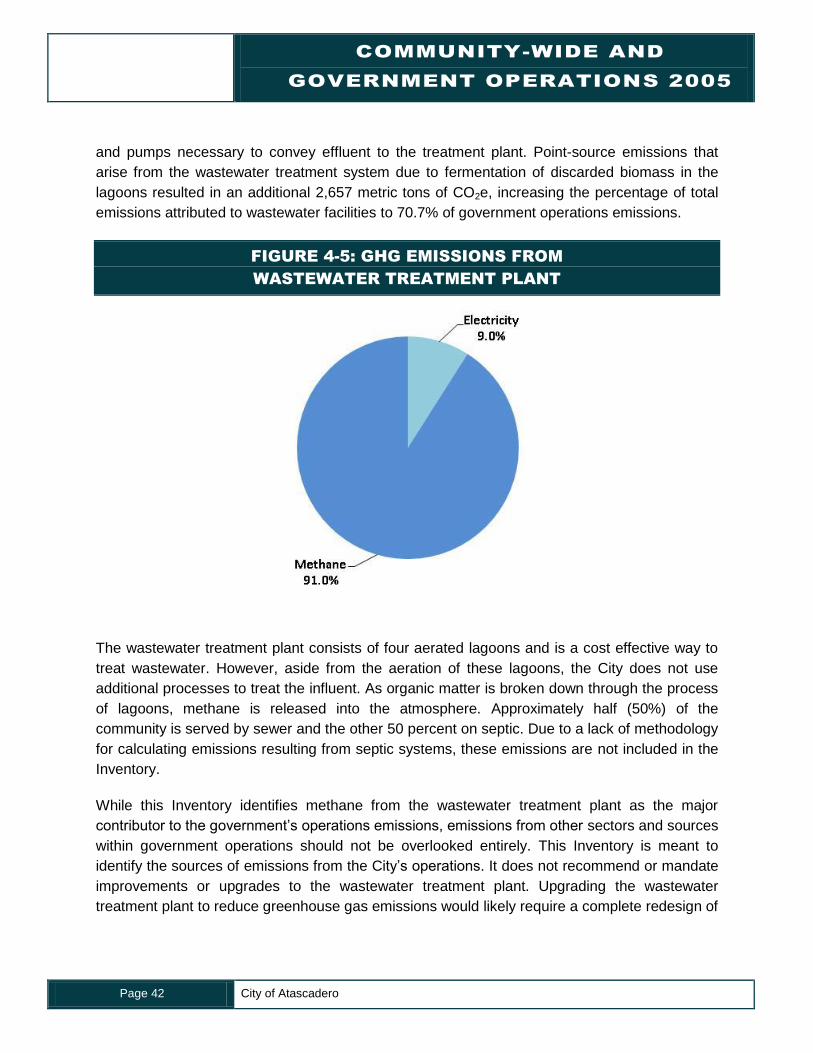
COMMUNITY-WIDE AND
GOVERNMENT OPERATIONS 2005
Page 42 City of Atascadero
and pumps necessary to convey effluent to the treatment plant. Point-source emissions that
arise from the wastewater treatment system due to fermentation of discarded biomass in the
lagoons resulted in an additional 2,657 metric tons of CO2e, increasing the percentage of total
emissions attributed to wastewater facilities to 70.7% of government operations emissions.
FIGURE 4-5: GHG EMISSIONS FROM
WASTEWATER TREATMENT PLANT
The wastewater treatment plant consists of four aerated lagoons and is a cost effective way to
treat wastewater. However, aside from the aeration of these lagoons, the City does not use
additional processes to treat the influent. As organic matter is broken down through the process
of lagoons, methane is released into the atmosphere. Approximately half (50%) of the
community is served by sewer and the other 50 percent on septic. Due to a lack of methodology
for calculating emissions resulting from septic systems, these emissions are not included in the
Inventory.
While this Inventory identifies methane from the wastewater treatment plant as the major
contributor to the government‟s operations emissions, emissions from other sectors and sources
within government operations should not be overlooked entirely. This Inventory is meant to
identify the sources of emissions from the City‟s operations. It does not recommend or mandate
improvements or upgrades to the wastewater treatment plant. Upgrading the wastewater
treatment plant to reduce greenhouse gas emissions would likely require a complete redesign of
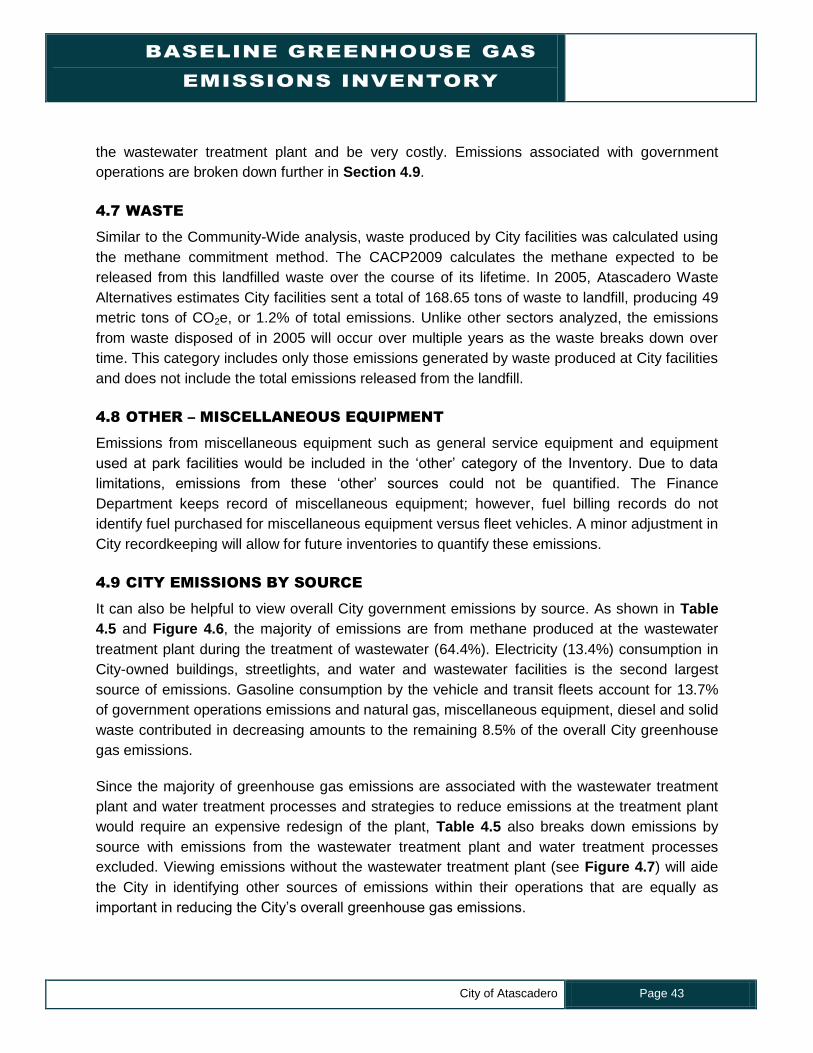
BASELINE GREENHOUSE GAS
EMISSIONS INVENTORY
City of Atascadero Page 43
the wastewater treatment plant and be very costly. Emissions associated with government
operations are broken down further in Section 4.9.
4.7 WASTE
Similar to the Community-Wide analysis, waste produced by City facilities was calculated using
the methane commitment method. The CACP2009 calculates the methane expected to be
released from this landfilled waste over the course of its lifetime. In 2005, Atascadero Waste
Alternatives estimates City facilities sent a total of 168.65 tons of waste to landfill, producing 49
metric tons of CO2e, or 1.2% of total emissions. Unlike other sectors analyzed, the emissions
from waste disposed of in 2005 will occur over multiple years as the waste breaks down over
time. This category includes only those emissions generated by waste produced at City facilities
and does not include the total emissions released from the landfill.
4.8 OTHER – MISCELLANEOUS EQUIPMENT
Emissions from miscellaneous equipment such as general service equipment and equipment
used at park facilities would be included in the „other‟ category of the Inventory. Due to data
limitations, emissions from these „other‟ sources could not be quantified. The Finance
Department keeps record of miscellaneous equipment; however, fuel billing records do not
identify fuel purchased for miscellaneous equipment versus fleet vehicles. A minor adjustment in
City recordkeeping will allow for future inventories to quantify these emissions.
4.9 CITY EMISSIONS BY SOURCE
It can also be helpful to view overall City government emissions by source. As shown in Table
4.5 and Figure 4.6, the majority of emissions are from methane produced at the wastewater
treatment plant during the treatment of wastewater (64.4%). Electricity (13.4%) consumption in
City-owned buildings, streetlights, and water and wastewater facilities is the second largest
source of emissions. Gasoline consumption by the vehicle and transit fleets account for 13.7%
of government operations emissions and natural gas, miscellaneous equipment, diesel and solid
waste contributed in decreasing amounts to the remaining 8.5% of the overall City greenhouse
gas emissions.
Since the majority of greenhouse gas emissions are associated with the wastewater treatment
plant and water treatment processes and strategies to reduce emissions at the treatment plant
would require an expensive redesign of the plant, Table 4.5 also breaks down emissions by
source with emissions from the wastewater treatment plant and water treatment processes
excluded. Viewing emissions without the wastewater treatment plant (see Figure 4.7) will aide
the City in identifying other sources of emissions within their operations that are equally as
important in reducing the City‟s overall greenhouse gas emissions.
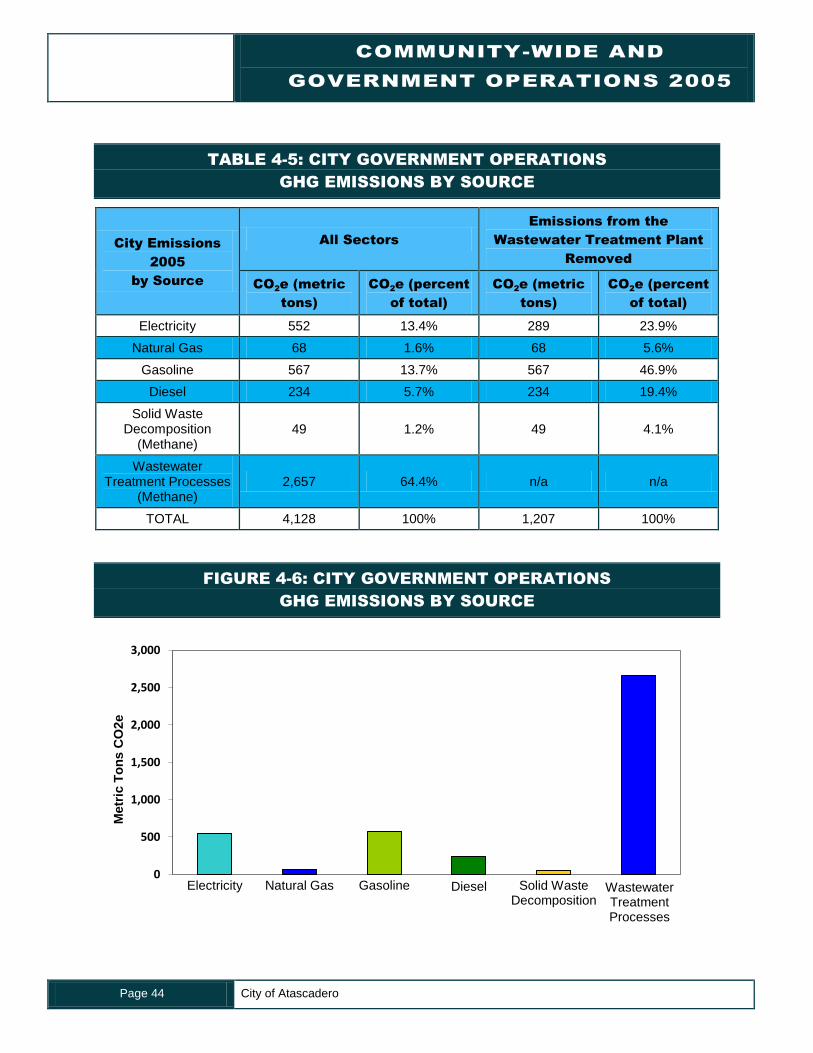
COMMUNITY-WIDE AND
GOVERNMENT OPERATIONS 2005
Page 44 City of Atascadero
TABLE 4-5: CITY GOVERNMENT OPERATIONS
GHG EMISSIONS BY SOURCE
City Emissions
2005
by Source
All Sectors
Emissions from the
Wastewater Treatment Plant
Removed
CO2e (metric
tons)
CO2e (percent
of total)
CO2e (metric
tons)
CO2e (percent
of total)
Electricity 552 13.4% 289 23.9%
Natural Gas 68 1.6% 68 5.6%
Gasoline 567 13.7% 567 46.9%
Diesel 234 5.7% 234 19.4%
Solid Waste Decomposition
(Methane) 49 1.2% 49 4.1%
Wastewater Treatment Processes
(Methane) 2,657 64.4% n/a n/a
TOTAL 4,128 100% 1,207 100%
FIGURE 4-6: CITY GOVERNMENT OPERATIONS
GHG EMISSIONS BY SOURCE
Electricity Natural Gas Gasoline Diesel Solid Waste Decomposition
Wastewater Treatment Processes
0
500
1,000
1,500
2,000
2,500
3,000
Metr
ic T
on
s C
O2e
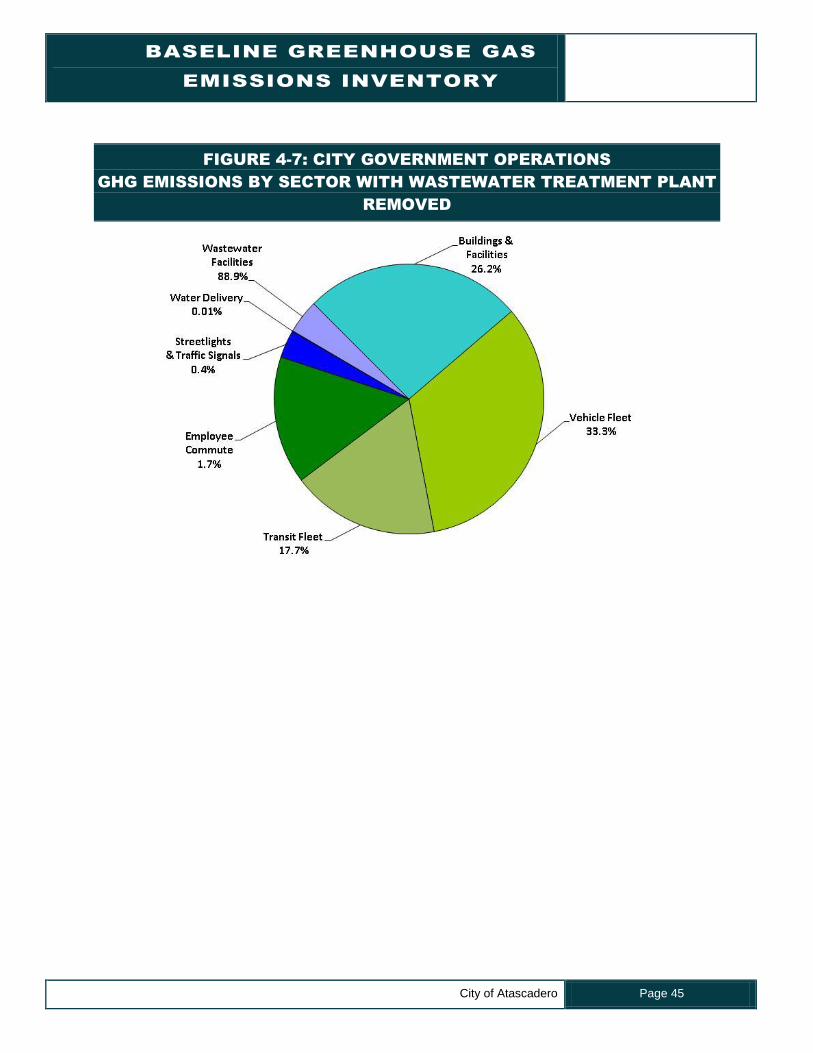
BASELINE GREENHOUSE GAS
EMISSIONS INVENTORY
City of Atascadero Page 45
FIGURE 4-7: CITY GOVERNMENT OPERATIONS
GHG EMISSIONS BY SECTOR WITH WASTEWATER TREATMENT PLANT
REMOVED
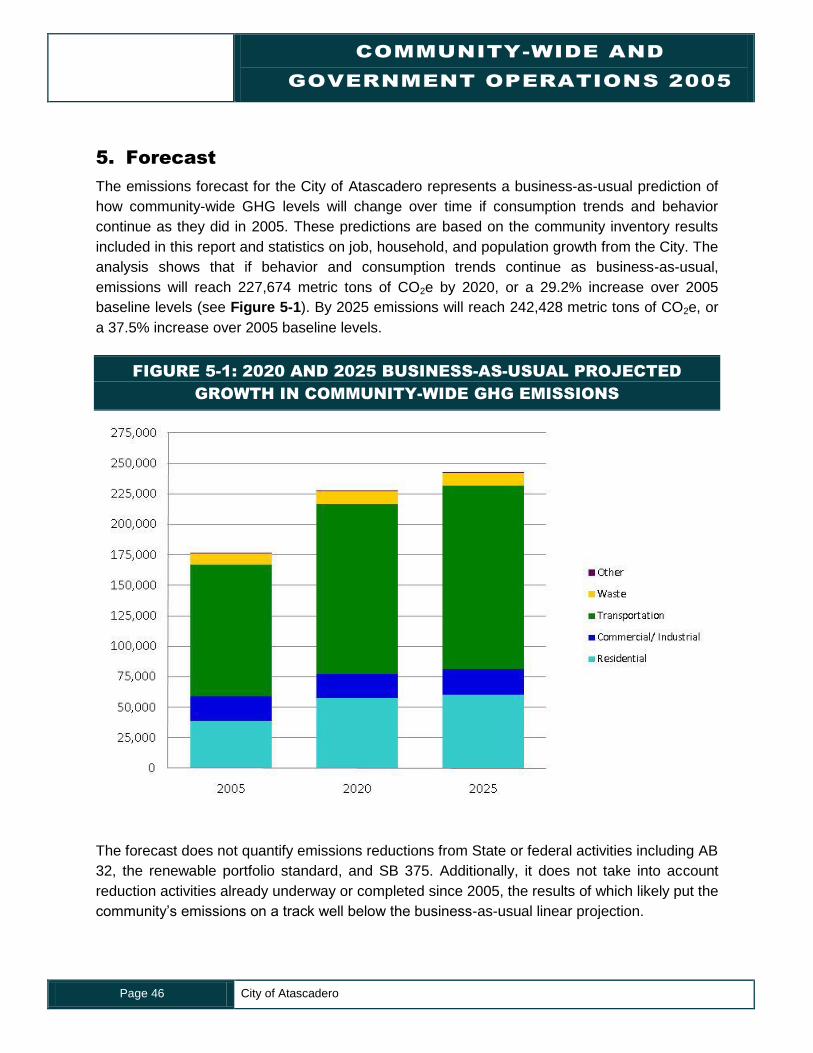
COMMUNITY-WIDE AND
GOVERNMENT OPERATIONS 2005
Page 46 City of Atascadero
5. Forecast
The emissions forecast for the City of Atascadero represents a business-as-usual prediction of
how community-wide GHG levels will change over time if consumption trends and behavior
continue as they did in 2005. These predictions are based on the community inventory results
included in this report and statistics on job, household, and population growth from the City. The
analysis shows that if behavior and consumption trends continue as business-as-usual,
emissions will reach 227,674 metric tons of CO2e by 2020, or a 29.2% increase over 2005
baseline levels (see Figure 5-1). By 2025 emissions will reach 242,428 metric tons of CO2e, or
a 37.5% increase over 2005 baseline levels.
FIGURE 5-1: 2020 AND 2025 BUSINESS-AS-USUAL PROJECTED
GROWTH IN COMMUNITY-WIDE GHG EMISSIONS
The forecast does not quantify emissions reductions from State or federal activities including AB
32, the renewable portfolio standard, and SB 375. Additionally, it does not take into account
reduction activities already underway or completed since 2005, the results of which likely put the
community‟s emissions on a track well below the business-as-usual linear projection.
BASELINE GREENHOUSE GAS
EMISSIONS INVENTORY
City of Atascadero Page 47
Forecasts were performed by applying household, job, and population growth rates to 2005
community-wide greenhouse gas emissions levels. Baseline data and estimated growth were
obtained from a long-range projections report developed by the San Luis Obispo Council of
Governments in 2006, as revised in May 2009. The “mid-range” cases for population, job, and
household growth were used in this forecast estimation.
City government operations emissions are not separately analyzed as part of this forecast due
to a lack of reasonable growth indicators for the City government sector. However, an increase
in emissions is not expected for existing facilities and operations in the City government
operations sector. If anything, the City expects that emissions within the scope of the 2005 City
government operations inventory will decrease because of energy efficiency improvements,
fleet upgrades, and the consolidation of Fire and Police Services with adjacent jurisdictions. At
the same time, it is likely the City will have to expand services and infrastructure to
accommodate the expected growth in the region, which could add new sources of emissions to
the City government operations inventory that did not exist in 2005.
COMMUNITY-WIDE AND
GOVERNMENT OPERATIONS 2005
Page 48 City of Atascadero
6. Conclusion and Next Steps
The City of Atascadero has made a formal commitment to
reduce its greenhouse gas emissions. This report lays the
groundwork for those efforts by estimating baseline emission
levels against which future progress can be demonstrated.
This analysis found that the community was responsible for
emitting 176,234 metric tons of CO2e in the base year 2005, with
the transportation sector contributing the most (61.4%) to this
total. As a component of the community-wide analysis, City
government operations produced 4,128 metric tons of CO2e, or
2.3% of the total. In addition to establishing the baseline for
tracking progress over time, this report serves to identify the
major sources of city emissions, and therefore the greatest
opportunities for emission reductions. In this regard, the
emissions inventory ought to inform the focus of the City‟s
Climate Action Plan. If no action is taken, this report found that
business-as-usual (worst case scenario) emissions will likely rise
by 29.2% by 2020 and 37.5% by 2025.
It is important to note that in order to remain consistent with
greenhouse gas reduction methodology, all future quantifications
of reduction activities must be subtracted from this „business-as-
usual‟ line. Not doing so would be assuming that emissions
remain at constant 2005 levels while reduction activities are underway. In reality, the City‟s
climate action efforts will be working against a rising emissions level due to job, population, and
household growth. Figure 6-1 below shows the business-as-usual emissions forecast in relation
to 2005 baseline levels and the 15% reduction below 2005 levels recommended by the State
Attorney General and Air Resources Board. 21
The difference between the business-as-usual forecast and the reduction targets is actually
44.2% in 2020 and 63.4% in 2025, which makes the State‟s recommended reduction goal
challenging, but still feasible. As noted in the Forecast section, it is likely that the City‟s
21 The AB 32 Climate Change Scoping Plan Document prepared by the Air Resources Board calls for
reducing greenhouse gas emissions to 1990 levels by cutting approximately 30 percent from business-as-usual emission levels projected for 2020, or about 15 percent from today‟s levels.
If the community reduced GHG emissions by
60,249 metric tons of CO2e, what would that be
equivalent to?
13,014 passenger cars not driven for one year
138,573 barrels of oil saved
1,566,472 tree seedlings grown over 10 years
783,236 compact fluorescent bulbs used instead of standard light bulbs for one year.
Source: California Air Resources Board, “Conversion of 1 MMT CO2 to Familiar Equivalents,” Oct. 2007.
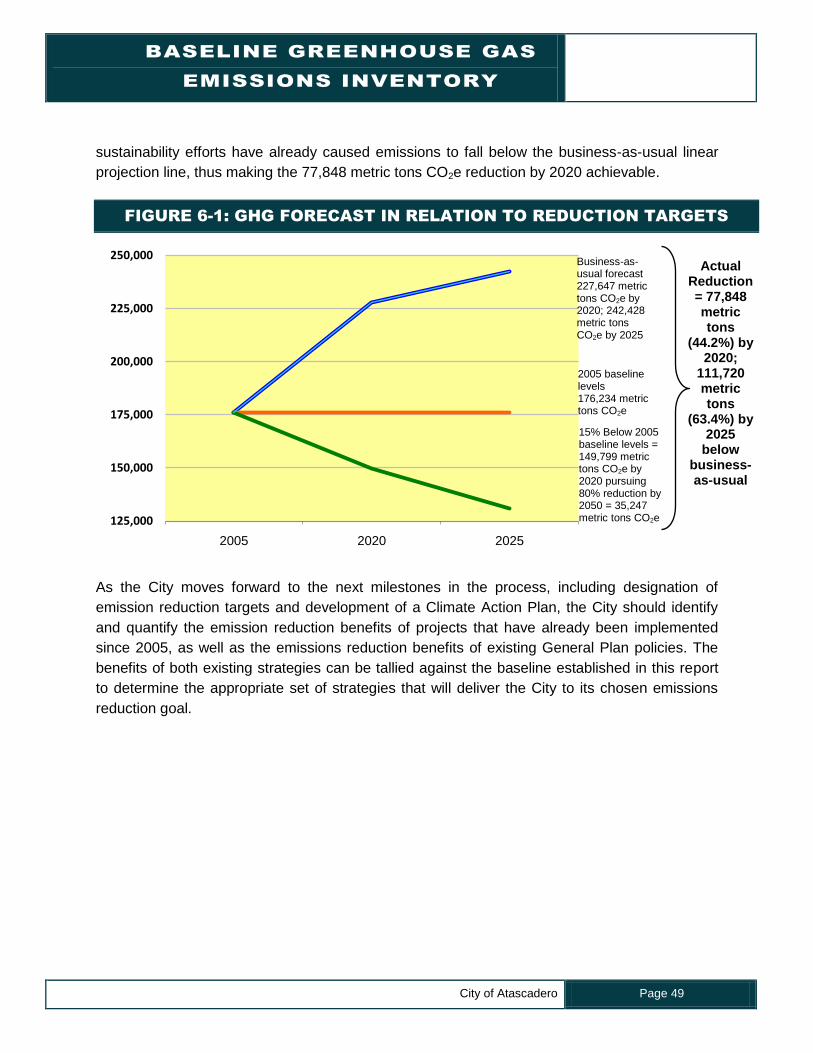
BASELINE GREENHOUSE GAS
EMISSIONS INVENTORY
City of Atascadero Page 49
sustainability efforts have already caused emissions to fall below the business-as-usual linear
projection line, thus making the 77,848 metric tons CO2e reduction by 2020 achievable.
FIGURE 6-1: GHG FORECAST IN RELATION TO REDUCTION TARGETS
As the City moves forward to the next milestones in the process, including designation of
emission reduction targets and development of a Climate Action Plan, the City should identify
and quantify the emission reduction benefits of projects that have already been implemented
since 2005, as well as the emissions reduction benefits of existing General Plan policies. The
benefits of both existing strategies can be tallied against the baseline established in this report
to determine the appropriate set of strategies that will deliver the City to its chosen emissions
reduction goal.
125,000
150,000
175,000
200,000
225,000
250,000
2005 2020 2025
Business-as-usual forecast 227,647 metric tons CO2e by 2020; 242,428 metric tons CO2e by 2025
2005 baseline levels 176,234 metric tons CO2e
15% Below 2005 baseline levels = 149,799 metric tons CO2e by 2020 pursuing 80% reduction by 2050 = 35,247 metric tons CO2e
Actual Reduction = 77,848 metric tons
(44.2%) by 2020;
111,720 metric tons
(63.4%) by 2025
below business-as-usual

APPENDIX A:
CACP DETAILED REPORT FOR COMMUNITY-
WIDE EMISSIONS, 2005

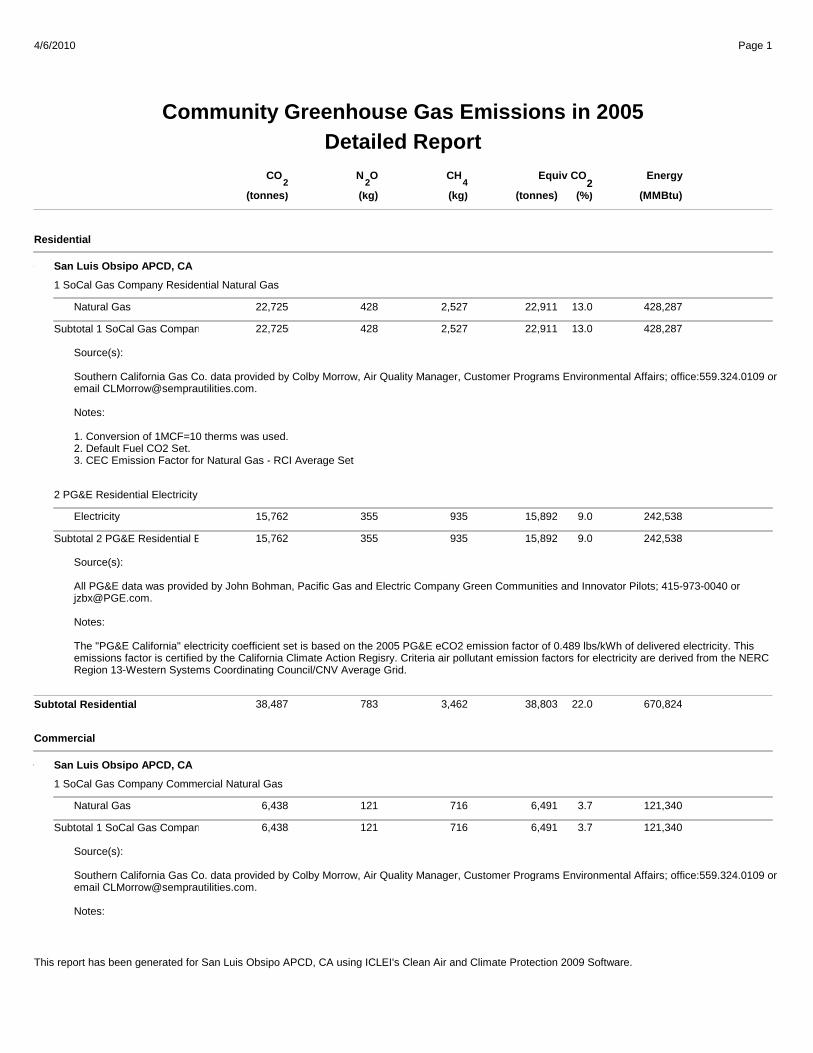
Detailed Report
Page 14/6/2010
Community Greenhouse Gas Emissions in 2005
(%)
Energy
(tonnes) (MMBtu)
Equiv CO 2
CO
(tonnes)
N O
(kg)
CH
(kg)422
Residential
San Luis Obsipo APCD, CA
1 SoCal Gas Company Residential Natural Gas
Natural Gas 22,911 13.0 428,28722,725 428 2,527
22,911 13.0 428,287Subtotal 1 SoCal Gas Company Residential Natural Gas22,725 428 2,527
Source(s): Source(s): Source(s):
Southern California Gas Co. data provided by Colby Morrow, Air Quality Manager, Customer Programs Environmental Affairs; office:559.324.0109 or email [email protected].
Source(s):
Southern California Gas Co. data provided by Colby Morrow, Air Quality Manager, Customer Programs Environmental Affairs; office:559.324.0109 or email [email protected].
Notes:
Source(s):
Southern California Gas Co. data provided by Colby Morrow, Air Quality Manager, Customer Programs Environmental Affairs; office:559.324.0109 or email [email protected].
Notes:
Source(s):
Southern California Gas Co. data provided by Colby Morrow, Air Quality Manager, Customer Programs Environmental Affairs; office:559.324.0109 or email [email protected].
Notes:
1. Conversion of 1MCF=10 therms was used. 2. Default Fuel CO2 Set.
Source(s):
Southern California Gas Co. data provided by Colby Morrow, Air Quality Manager, Customer Programs Environmental Affairs; office:559.324.0109 or email [email protected].
Notes:
1. Conversion of 1MCF=10 therms was used. 2. Default Fuel CO2 Set. 3. CEC Emission Factor for Natural Gas - RCI Average Set
2 PG&E Residential Electricity
Electricity 15,892 9.0 242,53815,762 355 935
15,892 9.0 242,538Subtotal 2 PG&E Residential Electricity 15,762 355 935
Source(s): Source(s):
All PG&E data was provided by John Bohman, Pacific Gas and Electric Company Green Communities and Innovator Pilots; 415-973-0040 or
Source(s):
All PG&E data was provided by John Bohman, Pacific Gas and Electric Company Green Communities and Innovator Pilots; 415-973-0040 or [email protected].
Source(s):
All PG&E data was provided by John Bohman, Pacific Gas and Electric Company Green Communities and Innovator Pilots; 415-973-0040 or [email protected].
Notes:
Source(s):
All PG&E data was provided by John Bohman, Pacific Gas and Electric Company Green Communities and Innovator Pilots; 415-973-0040 or [email protected].
Notes:
Source(s):
All PG&E data was provided by John Bohman, Pacific Gas and Electric Company Green Communities and Innovator Pilots; 415-973-0040 or [email protected].
Notes:
The "PG&E California" electricity coefficient set is based on the 2005 PG&E eCO2 emission factor of 0.489 lbs/kWh of delivered electricity. This emissions factor is certified by the California Climate Action Regisry. Criteria air pollutant emission factors for electricity are derived from the NERC
Source(s):
All PG&E data was provided by John Bohman, Pacific Gas and Electric Company Green Communities and Innovator Pilots; 415-973-0040 or [email protected].
Notes:
The "PG&E California" electricity coefficient set is based on the 2005 PG&E eCO2 emission factor of 0.489 lbs/kWh of delivered electricity. This emissions factor is certified by the California Climate Action Regisry. Criteria air pollutant emission factors for electricity are derived from the NERC Region 13-Western Systems Coordinating Council/CNV Average Grid.
38,803 670,82422.0Subtotal Residential 38,487 783 3,462
Commercial
San Luis Obsipo APCD, CA
1 SoCal Gas Company Commercial Natural Gas
Natural Gas 6,491 3.7 121,3406,438 121 716
6,491 3.7 121,340Subtotal 1 SoCal Gas Company Commercial Natural Gas6,438 121 716
Source(s): Source(s): Source(s):
Southern California Gas Co. data provided by Colby Morrow, Air Quality Manager, Customer Programs Environmental Affairs; office:559.324.0109 or email [email protected].
Source(s):
Southern California Gas Co. data provided by Colby Morrow, Air Quality Manager, Customer Programs Environmental Affairs; office:559.324.0109 or email [email protected].
Notes:
Source(s):
Southern California Gas Co. data provided by Colby Morrow, Air Quality Manager, Customer Programs Environmental Affairs; office:559.324.0109 or email [email protected].
Notes:
This report has been generated for San Luis Obsipo APCD, CA using ICLEI's Clean Air and Climate Protection 2009 Software.
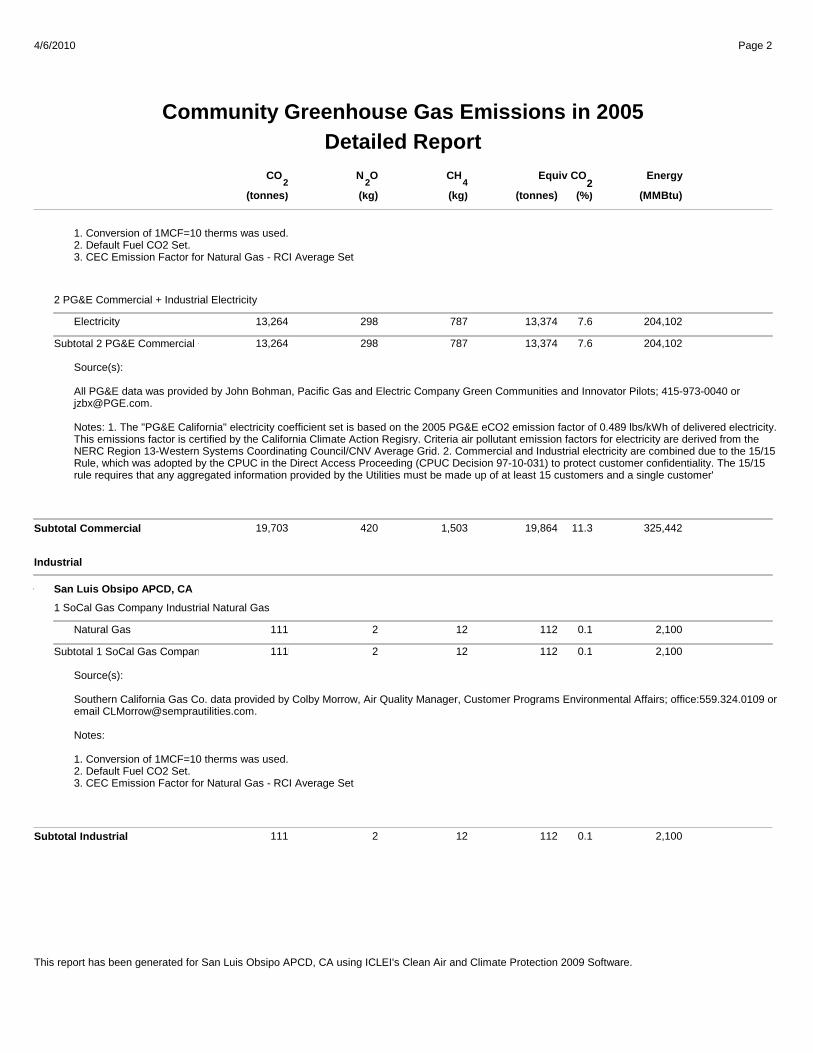
Detailed Report
Page 24/6/2010
Community Greenhouse Gas Emissions in 2005
(%)
Energy
(tonnes) (MMBtu)
Equiv CO 2
CO
(tonnes)
N O
(kg)
CH
(kg)422
1. Conversion of 1MCF=10 therms was used. 1. Conversion of 1MCF=10 therms was used. 2. Default Fuel CO2 Set. 1. Conversion of 1MCF=10 therms was used. 2. Default Fuel CO2 Set. 3. CEC Emission Factor for Natural Gas - RCI Average Set
2 PG&E Commercial + Industrial Electricity
Electricity 13,374 7.6 204,10213,264 298 787
13,374 7.6 204,102Subtotal 2 PG&E Commercial + Industrial Electricity13,264 298 787
Source(s): Source(s): Source(s):
All PG&E data was provided by John Bohman, Pacific Gas and Electric Company Green Communities and Innovator Pilots; 415-973-0040 or [email protected].
Source(s):
All PG&E data was provided by John Bohman, Pacific Gas and Electric Company Green Communities and Innovator Pilots; 415-973-0040 or [email protected].
Notes: 1. The "PG&E California" electricity coefficient set is based on the 2005 PG&E eCO2 emission factor of 0.489 lbs/kWh of delivered electricity.
Source(s):
All PG&E data was provided by John Bohman, Pacific Gas and Electric Company Green Communities and Innovator Pilots; 415-973-0040 or [email protected].
Notes: 1. The "PG&E California" electricity coefficient set is based on the 2005 PG&E eCO2 emission factor of 0.489 lbs/kWh of delivered electricity. This emissions factor is certified by the California Climate Action Regisry. Criteria air pollutant emission factors for electricity are derived from the
Source(s):
All PG&E data was provided by John Bohman, Pacific Gas and Electric Company Green Communities and Innovator Pilots; 415-973-0040 or [email protected].
Notes: 1. The "PG&E California" electricity coefficient set is based on the 2005 PG&E eCO2 emission factor of 0.489 lbs/kWh of delivered electricity. This emissions factor is certified by the California Climate Action Regisry. Criteria air pollutant emission factors for electricity are derived from the NERC Region 13-Western Systems Coordinating Council/CNV Average Grid. 2. Commercial and Industrial electricity are combined due to the 15/15 Rule, which was adopted by the CPUC in the Direct Access Proceeding (CPUC Decision 97-10-031) to protect customer confidentiality. The 15/15
Source(s):
All PG&E data was provided by John Bohman, Pacific Gas and Electric Company Green Communities and Innovator Pilots; 415-973-0040 or [email protected].
Notes: 1. The "PG&E California" electricity coefficient set is based on the 2005 PG&E eCO2 emission factor of 0.489 lbs/kWh of delivered electricity. This emissions factor is certified by the California Climate Action Regisry. Criteria air pollutant emission factors for electricity are derived from the NERC Region 13-Western Systems Coordinating Council/CNV Average Grid. 2. Commercial and Industrial electricity are combined due to the 15/15 Rule, which was adopted by the CPUC in the Direct Access Proceeding (CPUC Decision 97-10-031) to protect customer confidentiality. The 15/15 rule requires that any aggregated information provided by the Utilities must be made up of at least 15 customers and a single customer'
19,864 325,44211.3Subtotal Commercial 19,703 420 1,503
Industrial
San Luis Obsipo APCD, CA
1 SoCal Gas Company Industrial Natural Gas
Natural Gas 112 0.1 2,100111 2 12
112 0.1 2,100Subtotal 1 SoCal Gas Company Industrial Natural Gas111 2 12
Source(s): Source(s): Source(s):
Southern California Gas Co. data provided by Colby Morrow, Air Quality Manager, Customer Programs Environmental Affairs; office:559.324.0109 or email [email protected].
Source(s):
Southern California Gas Co. data provided by Colby Morrow, Air Quality Manager, Customer Programs Environmental Affairs; office:559.324.0109 or email [email protected].
Notes:
Source(s):
Southern California Gas Co. data provided by Colby Morrow, Air Quality Manager, Customer Programs Environmental Affairs; office:559.324.0109 or email [email protected].
Notes:
Source(s):
Southern California Gas Co. data provided by Colby Morrow, Air Quality Manager, Customer Programs Environmental Affairs; office:559.324.0109 or email [email protected].
Notes:
1. Conversion of 1MCF=10 therms was used. 2. Default Fuel CO2 Set.
Source(s):
Southern California Gas Co. data provided by Colby Morrow, Air Quality Manager, Customer Programs Environmental Affairs; office:559.324.0109 or email [email protected].
Notes:
1. Conversion of 1MCF=10 therms was used. 2. Default Fuel CO2 Set. 3. CEC Emission Factor for Natural Gas - RCI Average Set
112 2,1000.1Subtotal Industrial 111 2 12
This report has been generated for San Luis Obsipo APCD, CA using ICLEI's Clean Air and Climate Protection 2009 Software.
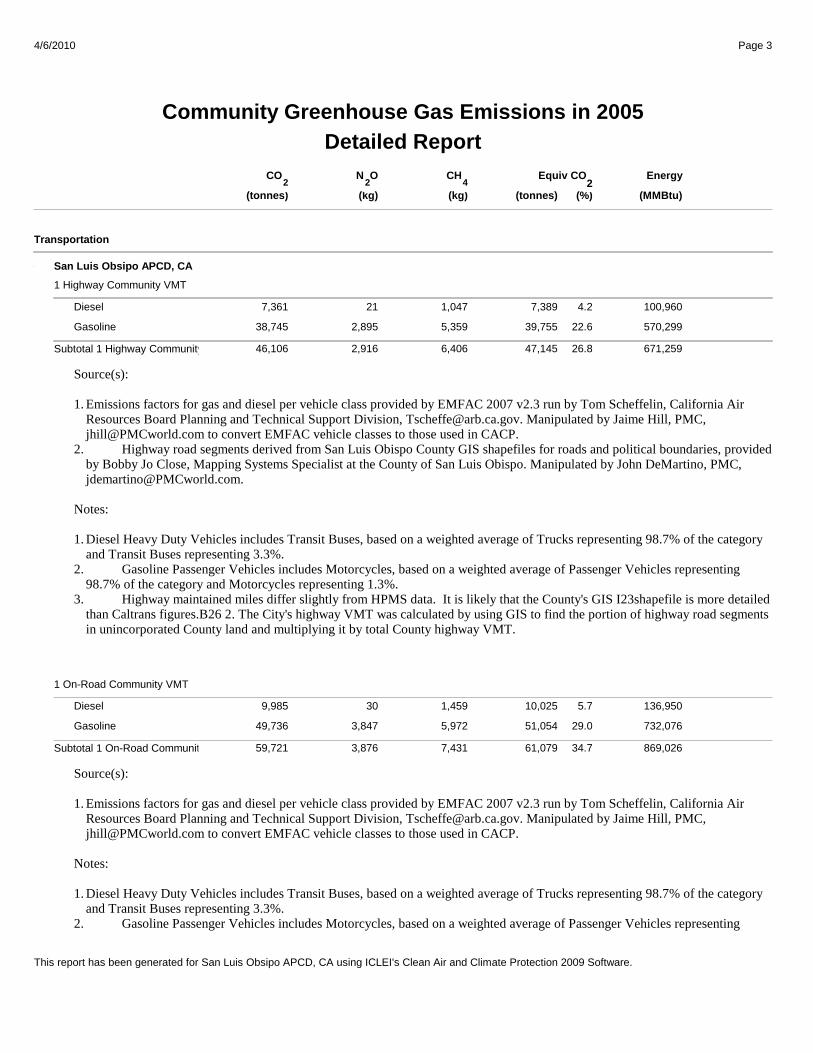
Detailed Report
Page 34/6/2010
Community Greenhouse Gas Emissions in 2005
(%)
Energy
(tonnes) (MMBtu)
Equiv CO 2
CO
(tonnes)
N O
(kg)
CH
(kg)422
Transportation
San Luis Obsipo APCD, CA
1 Highway Community VMT
Diesel 7,389 4.2 100,9607,361 21 1,047
Gasoline 39,755 22.6 570,29938,745 2,895 5,359
47,145 26.8 671,259Subtotal 1 Highway Community VMT 46,106 2,916 6,406
Source(s):Source(s):Source(s):
1. Emissions factors for gas and diesel per vehicle class provided by EMFAC 2007 v2.3 run by Tom Scheffelin, California Air
Source(s):
1. Emissions factors for gas and diesel per vehicle class provided by EMFAC 2007 v2.3 run by Tom Scheffelin, California Air Resources Board Planning and Technical Support Division, [email protected]. Manipulated by Jaime Hill, PMC,
Source(s):
1. Emissions factors for gas and diesel per vehicle class provided by EMFAC 2007 v2.3 run by Tom Scheffelin, California Air Resources Board Planning and Technical Support Division, [email protected]. Manipulated by Jaime Hill, PMC, [email protected] to convert EMFAC vehicle classes to those used in CACP.
2. Highway road segments derived from San Luis Obispo County GIS shapefiles for roads and political boundaries, provided
Source(s):
1. Emissions factors for gas and diesel per vehicle class provided by EMFAC 2007 v2.3 run by Tom Scheffelin, California Air Resources Board Planning and Technical Support Division, [email protected]. Manipulated by Jaime Hill, PMC, [email protected] to convert EMFAC vehicle classes to those used in CACP.
2. Highway road segments derived from San Luis Obispo County GIS shapefiles for roads and political boundaries, provided by Bobby Jo Close, Mapping Systems Specialist at the County of San Luis Obispo. Manipulated by John DeMartino, PMC,
Source(s):
1. Emissions factors for gas and diesel per vehicle class provided by EMFAC 2007 v2.3 run by Tom Scheffelin, California Air Resources Board Planning and Technical Support Division, [email protected]. Manipulated by Jaime Hill, PMC, [email protected] to convert EMFAC vehicle classes to those used in CACP.
2. Highway road segments derived from San Luis Obispo County GIS shapefiles for roads and political boundaries, provided by Bobby Jo Close, Mapping Systems Specialist at the County of San Luis Obispo. Manipulated by John DeMartino, PMC, [email protected].
Notes:
1. Diesel Heavy Duty Vehicles includes Transit Buses, based on a weighted average of Trucks representing 98.7% of the category
Source(s):
1. Emissions factors for gas and diesel per vehicle class provided by EMFAC 2007 v2.3 run by Tom Scheffelin, California Air Resources Board Planning and Technical Support Division, [email protected]. Manipulated by Jaime Hill, PMC, [email protected] to convert EMFAC vehicle classes to those used in CACP.
2. Highway road segments derived from San Luis Obispo County GIS shapefiles for roads and political boundaries, provided by Bobby Jo Close, Mapping Systems Specialist at the County of San Luis Obispo. Manipulated by John DeMartino, PMC, [email protected].
Notes:
1. Diesel Heavy Duty Vehicles includes Transit Buses, based on a weighted average of Trucks representing 98.7% of the category and Transit Buses representing 3.3%.
2. Gasoline Passenger Vehicles includes Motorcycles, based on a weighted average of Passenger Vehicles representing
Source(s):
1. Emissions factors for gas and diesel per vehicle class provided by EMFAC 2007 v2.3 run by Tom Scheffelin, California Air Resources Board Planning and Technical Support Division, [email protected]. Manipulated by Jaime Hill, PMC, [email protected] to convert EMFAC vehicle classes to those used in CACP.
2. Highway road segments derived from San Luis Obispo County GIS shapefiles for roads and political boundaries, provided by Bobby Jo Close, Mapping Systems Specialist at the County of San Luis Obispo. Manipulated by John DeMartino, PMC, [email protected].
Notes:
1. Diesel Heavy Duty Vehicles includes Transit Buses, based on a weighted average of Trucks representing 98.7% of the category and Transit Buses representing 3.3%.
2. Gasoline Passenger Vehicles includes Motorcycles, based on a weighted average of Passenger Vehicles representing 98.7% of the category and Motorcycles representing 1.3%.
3. Highway maintained miles differ slightly from HPMS data. It is likely that the County's GIS I23shapefile is more detailed
Source(s):
1. Emissions factors for gas and diesel per vehicle class provided by EMFAC 2007 v2.3 run by Tom Scheffelin, California Air Resources Board Planning and Technical Support Division, [email protected]. Manipulated by Jaime Hill, PMC, [email protected] to convert EMFAC vehicle classes to those used in CACP.
2. Highway road segments derived from San Luis Obispo County GIS shapefiles for roads and political boundaries, provided by Bobby Jo Close, Mapping Systems Specialist at the County of San Luis Obispo. Manipulated by John DeMartino, PMC, [email protected].
Notes:
1. Diesel Heavy Duty Vehicles includes Transit Buses, based on a weighted average of Trucks representing 98.7% of the category and Transit Buses representing 3.3%.
2. Gasoline Passenger Vehicles includes Motorcycles, based on a weighted average of Passenger Vehicles representing 98.7% of the category and Motorcycles representing 1.3%.
3. Highway maintained miles differ slightly from HPMS data. It is likely that the County's GIS I23shapefile is more detailed than Caltrans figures.B26 2. The City's highway VMT was calculated by using GIS to find the portion of highway road segments
Source(s):
1. Emissions factors for gas and diesel per vehicle class provided by EMFAC 2007 v2.3 run by Tom Scheffelin, California Air Resources Board Planning and Technical Support Division, [email protected]. Manipulated by Jaime Hill, PMC, [email protected] to convert EMFAC vehicle classes to those used in CACP.
2. Highway road segments derived from San Luis Obispo County GIS shapefiles for roads and political boundaries, provided by Bobby Jo Close, Mapping Systems Specialist at the County of San Luis Obispo. Manipulated by John DeMartino, PMC, [email protected].
Notes:
1. Diesel Heavy Duty Vehicles includes Transit Buses, based on a weighted average of Trucks representing 98.7% of the category and Transit Buses representing 3.3%.
2. Gasoline Passenger Vehicles includes Motorcycles, based on a weighted average of Passenger Vehicles representing 98.7% of the category and Motorcycles representing 1.3%.
3. Highway maintained miles differ slightly from HPMS data. It is likely that the County's GIS I23shapefile is more detailed than Caltrans figures.B26 2. The City's highway VMT was calculated by using GIS to find the portion of highway road segments in unincorporated County land and multiplying it by total County highway VMT.
1 On-Road Community VMT
Diesel 10,025 5.7 136,9509,985 30 1,459
Gasoline 51,054 29.0 732,07649,736 3,847 5,972
61,079 34.7 869,026Subtotal 1 On-Road Community VMT 59,721 3,876 7,431
Source(s):Source(s):Source(s):
1. Emissions factors for gas and diesel per vehicle class provided by EMFAC 2007 v2.3 run by Tom Scheffelin, California Air
Source(s):
1. Emissions factors for gas and diesel per vehicle class provided by EMFAC 2007 v2.3 run by Tom Scheffelin, California Air Resources Board Planning and Technical Support Division, [email protected]. Manipulated by Jaime Hill, PMC,
Source(s):
1. Emissions factors for gas and diesel per vehicle class provided by EMFAC 2007 v2.3 run by Tom Scheffelin, California Air Resources Board Planning and Technical Support Division, [email protected]. Manipulated by Jaime Hill, PMC, [email protected] to convert EMFAC vehicle classes to those used in CACP.
Notes:
1. Diesel Heavy Duty Vehicles includes Transit Buses, based on a weighted average of Trucks representing 98.7% of the category
Source(s):
1. Emissions factors for gas and diesel per vehicle class provided by EMFAC 2007 v2.3 run by Tom Scheffelin, California Air Resources Board Planning and Technical Support Division, [email protected]. Manipulated by Jaime Hill, PMC, [email protected] to convert EMFAC vehicle classes to those used in CACP.
Notes:
1. Diesel Heavy Duty Vehicles includes Transit Buses, based on a weighted average of Trucks representing 98.7% of the category and Transit Buses representing 3.3%.
2. Gasoline Passenger Vehicles includes Motorcycles, based on a weighted average of Passenger Vehicles representing
This report has been generated for San Luis Obsipo APCD, CA using ICLEI's Clean Air and Climate Protection 2009 Software.
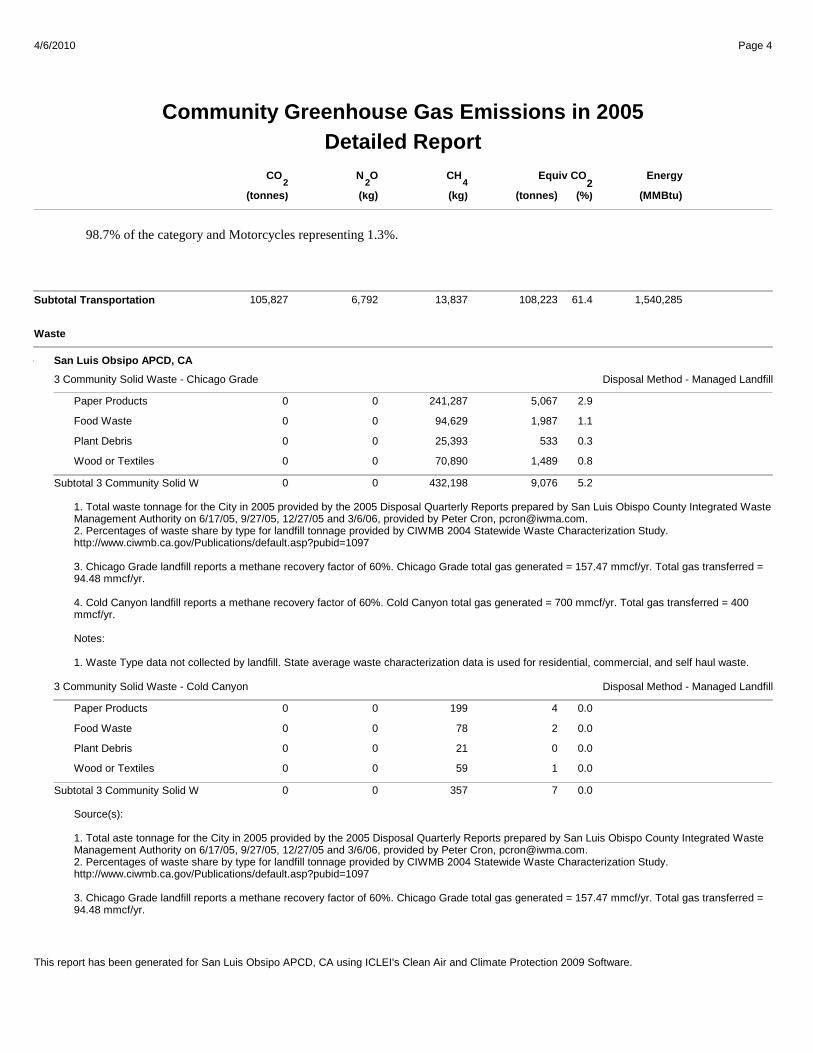
Detailed Report
Page 44/6/2010
Community Greenhouse Gas Emissions in 2005
(%)
Energy
(tonnes) (MMBtu)
Equiv CO 2
CO
(tonnes)
N O
(kg)
CH
(kg)422
98.7% of the category and Motorcycles representing 1.3%.98.7% of the category and Motorcycles representing 1.3%.98.7% of the category and Motorcycles representing 1.3%.
108,223 1,540,28561.4Subtotal Transportation 105,827 6,792 13,837
Waste
San Luis Obsipo APCD, CA
3 Community Solid Waste - Chicago Grade Disposal Method - Managed Landfill
Paper Products 5,067 2.90 0 241,287
Food Waste 1,987 1.10 0 94,629
Plant Debris 533 0.30 0 25,393
Wood or Textiles 1,489 0.80 0 70,890
9,076 5.2Subtotal 3 Community Solid Waste - Chicago Grade0 0 432,198
1. Total waste tonnage for the City in 2005 provided by the 2005 Disposal Quarterly Reports prepared by San Luis Obispo County Integrated Waste 1. Total waste tonnage for the City in 2005 provided by the 2005 Disposal Quarterly Reports prepared by San Luis Obispo County Integrated Waste Management Authority on 6/17/05, 9/27/05, 12/27/05 and 3/6/06, provided by Peter Cron, [email protected]. Total waste tonnage for the City in 2005 provided by the 2005 Disposal Quarterly Reports prepared by San Luis Obispo County Integrated Waste Management Authority on 6/17/05, 9/27/05, 12/27/05 and 3/6/06, provided by Peter Cron, [email protected]. Percentages of waste share by type for landfill tonnage provided by CIWMB 2004 Statewide Waste Characterization Study. http://www.ciwmb.ca.gov/Publications/default.asp?pubid=1097
1. Total waste tonnage for the City in 2005 provided by the 2005 Disposal Quarterly Reports prepared by San Luis Obispo County Integrated Waste Management Authority on 6/17/05, 9/27/05, 12/27/05 and 3/6/06, provided by Peter Cron, [email protected]. Percentages of waste share by type for landfill tonnage provided by CIWMB 2004 Statewide Waste Characterization Study. http://www.ciwmb.ca.gov/Publications/default.asp?pubid=1097
3. Chicago Grade landfill reports a methane recovery factor of 60%. Chicago Grade total gas generated = 157.47 mmcf/yr. Total gas transferred =
1. Total waste tonnage for the City in 2005 provided by the 2005 Disposal Quarterly Reports prepared by San Luis Obispo County Integrated Waste Management Authority on 6/17/05, 9/27/05, 12/27/05 and 3/6/06, provided by Peter Cron, [email protected]. Percentages of waste share by type for landfill tonnage provided by CIWMB 2004 Statewide Waste Characterization Study. http://www.ciwmb.ca.gov/Publications/default.asp?pubid=1097
3. Chicago Grade landfill reports a methane recovery factor of 60%. Chicago Grade total gas generated = 157.47 mmcf/yr. Total gas transferred = 94.48 mmcf/yr.
4. Cold Canyon landfill reports a methane recovery factor of 60%. Cold Canyon total gas generated = 700 mmcf/yr. Total gas transferred = 400
1. Total waste tonnage for the City in 2005 provided by the 2005 Disposal Quarterly Reports prepared by San Luis Obispo County Integrated Waste Management Authority on 6/17/05, 9/27/05, 12/27/05 and 3/6/06, provided by Peter Cron, [email protected]. Percentages of waste share by type for landfill tonnage provided by CIWMB 2004 Statewide Waste Characterization Study. http://www.ciwmb.ca.gov/Publications/default.asp?pubid=1097
3. Chicago Grade landfill reports a methane recovery factor of 60%. Chicago Grade total gas generated = 157.47 mmcf/yr. Total gas transferred = 94.48 mmcf/yr.
4. Cold Canyon landfill reports a methane recovery factor of 60%. Cold Canyon total gas generated = 700 mmcf/yr. Total gas transferred = 400 mmcf/yr.
Notes:
1. Waste Type data not collected by landfill. State average waste characterization data is used for residential, commercial, and self haul waste.
3 Community Solid Waste - Cold Canyon Disposal Method - Managed Landfill
Paper Products 4 0.00 0 199
Food Waste 2 0.00 0 78
Plant Debris 0 0.00 0 21
Wood or Textiles 1 0.00 0 59
7 0.0Subtotal 3 Community Solid Waste - Cold Canyon0 0 357
Source(s):Source(s):
1. Total aste tonnage for the City in 2005 provided by the 2005 Disposal Quarterly Reports prepared by San Luis Obispo County Integrated Waste
Source(s):
1. Total aste tonnage for the City in 2005 provided by the 2005 Disposal Quarterly Reports prepared by San Luis Obispo County Integrated Waste Management Authority on 6/17/05, 9/27/05, 12/27/05 and 3/6/06, provided by Peter Cron, [email protected].
Source(s):
1. Total aste tonnage for the City in 2005 provided by the 2005 Disposal Quarterly Reports prepared by San Luis Obispo County Integrated Waste Management Authority on 6/17/05, 9/27/05, 12/27/05 and 3/6/06, provided by Peter Cron, [email protected]. Percentages of waste share by type for landfill tonnage provided by CIWMB 2004 Statewide Waste Characterization Study. http://www.ciwmb.ca.gov/Publications/default.asp?pubid=1097
3. Chicago Grade landfill reports a methane recovery factor of 60%. Chicago Grade total gas generated = 157.47 mmcf/yr. Total gas transferred = 94.48 mmcf/yr.
This report has been generated for San Luis Obsipo APCD, CA using ICLEI's Clean Air and Climate Protection 2009 Software.
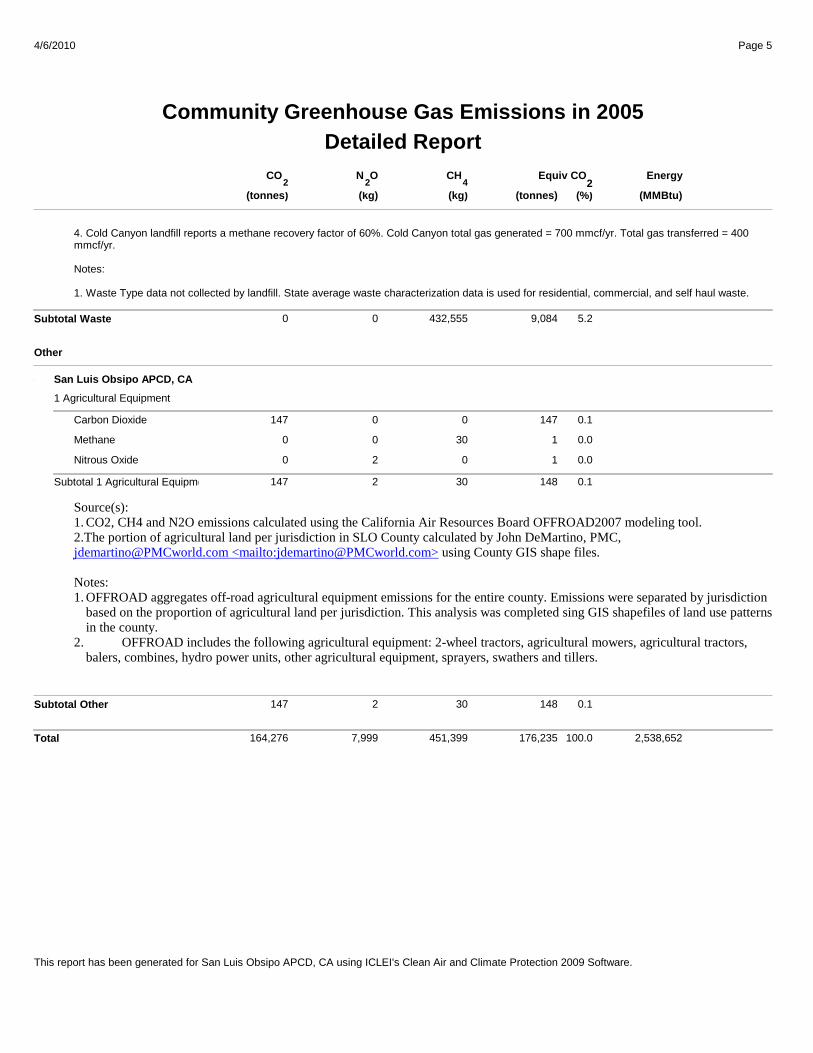
Detailed Report
Page 54/6/2010
Community Greenhouse Gas Emissions in 2005
(%)
Energy
(tonnes) (MMBtu)
Equiv CO 2
CO
(tonnes)
N O
(kg)
CH
(kg)422
4. Cold Canyon landfill reports a methane recovery factor of 60%. Cold Canyon total gas generated = 700 mmcf/yr. Total gas transferred = 400 4. Cold Canyon landfill reports a methane recovery factor of 60%. Cold Canyon total gas generated = 700 mmcf/yr. Total gas transferred = 400 mmcf/yr.4. Cold Canyon landfill reports a methane recovery factor of 60%. Cold Canyon total gas generated = 700 mmcf/yr. Total gas transferred = 400 mmcf/yr.
Notes:
4. Cold Canyon landfill reports a methane recovery factor of 60%. Cold Canyon total gas generated = 700 mmcf/yr. Total gas transferred = 400 mmcf/yr.
Notes:
1. Waste Type data not collected by landfill. State average waste characterization data is used for residential, commercial, and self haul waste.
9,084 5.2Subtotal Waste 0 0 432,555
Other
San Luis Obsipo APCD, CA
1 Agricultural Equipment
Carbon Dioxide 147 0.1147 0 0
Methane 1 0.00 0 30
Nitrous Oxide 1 0.00 2 0
148 0.1Subtotal 1 Agricultural Equipment 147 2 30
Source(s):Source(s):1. CO2, CH4 and N2O emissions calculated using the California Air Resources Board OFFROAD2007 modeling tool. Source(s):1. CO2, CH4 and N2O emissions calculated using the California Air Resources Board OFFROAD2007 modeling tool. 2.The portion of agricultural land per jurisdiction in SLO County calculated by John DeMartino, PMC,
Source(s):1. CO2, CH4 and N2O emissions calculated using the California Air Resources Board OFFROAD2007 modeling tool. 2.The portion of agricultural land per jurisdiction in SLO County calculated by John DeMartino, PMC, [email protected] <mailto:[email protected]> using County GIS shape files.
Source(s):1. CO2, CH4 and N2O emissions calculated using the California Air Resources Board OFFROAD2007 modeling tool. 2.The portion of agricultural land per jurisdiction in SLO County calculated by John DeMartino, PMC, [email protected] <mailto:[email protected]> using County GIS shape files.
Notes:
Source(s):1. CO2, CH4 and N2O emissions calculated using the California Air Resources Board OFFROAD2007 modeling tool. 2.The portion of agricultural land per jurisdiction in SLO County calculated by John DeMartino, PMC, [email protected] <mailto:[email protected]> using County GIS shape files.
Notes:1. OFFROAD aggregates off-road agricultural equipment emissions for the entire county. Emissions were separated by jurisdiction
based on the proportion of agricultural land per jurisdiction. This analysis was completed sing GIS shapefiles of land use patterns
Source(s):1. CO2, CH4 and N2O emissions calculated using the California Air Resources Board OFFROAD2007 modeling tool. 2.The portion of agricultural land per jurisdiction in SLO County calculated by John DeMartino, PMC, [email protected] <mailto:[email protected]> using County GIS shape files.
Notes:1. OFFROAD aggregates off-road agricultural equipment emissions for the entire county. Emissions were separated by jurisdiction
based on the proportion of agricultural land per jurisdiction. This analysis was completed sing GIS shapefiles of land use patterns in the county.
2. OFFROAD includes the following agricultural equipment: 2-wheel tractors, agricultural mowers, agricultural tractors, balers, combines, hydro power units, other agricultural equipment, sprayers, swathers and tillers.
148 0.1Subtotal Other 147 2 30
Total 176,235 2,538,652100.0164,276 7,999 451,399
This report has been generated for San Luis Obsipo APCD, CA using ICLEI's Clean Air and Climate Protection 2009 Software.

APPENDIX B:
CACP DETAILED REPORT FOR CITY
GOVERNMENT OPERATIONS EMISSIONS,
2005

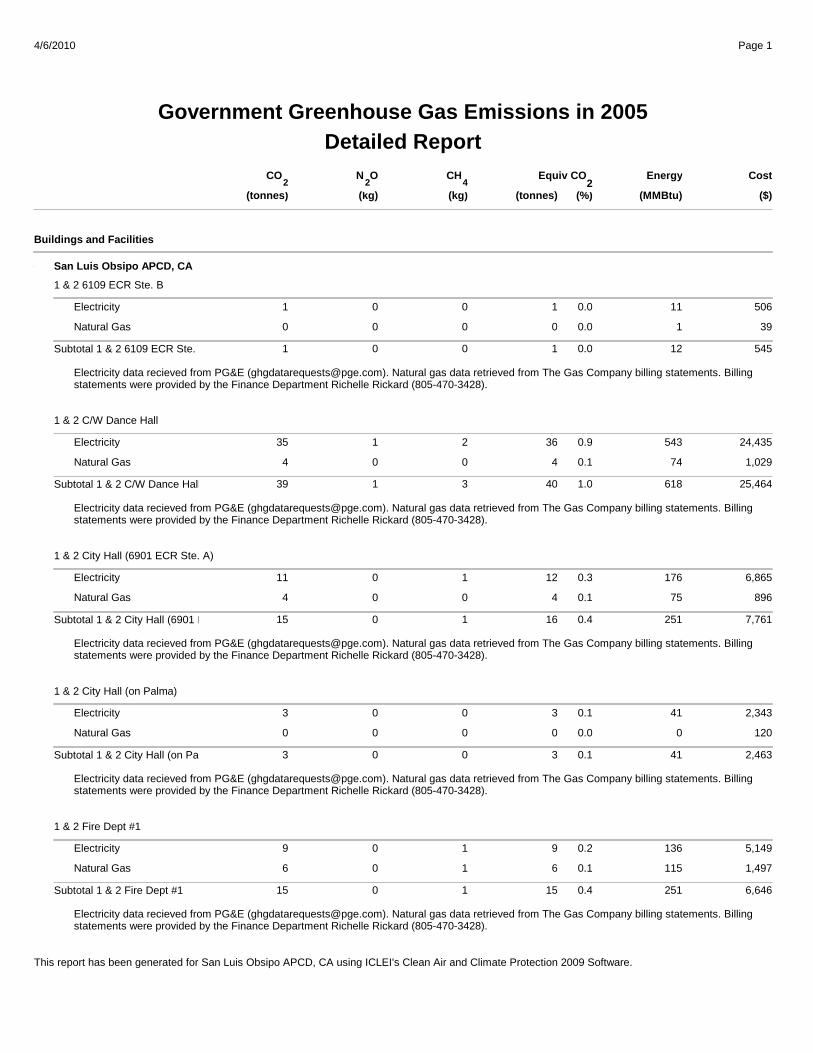
Detailed Report
Page 14/6/2010
Government Greenhouse Gas Emissions in 2005
(%)
Energy Cost
(tonnes) (MMBtu)
Equiv CO
($)2
CO
(tonnes)
N O
(kg)
CH
(kg)422
Buildings and Facilities
San Luis Obsipo APCD, CA
1 & 2 6109 ECR Ste. B
Electricity 1 0.0 11 5061 0 0
Natural Gas 0 0.0 1 390 0 0
1 0.0 12 545Subtotal 1 & 2 6109 ECR Ste. B 1 0 0
Electricity data recieved from PG&E ([email protected]). Natural gas data retrieved from The Gas Company billing statements. Billing Electricity data recieved from PG&E ([email protected]). Natural gas data retrieved from The Gas Company billing statements. Billing statements were provided by the Finance Department Richelle Rickard (805-470-3428).
1 & 2 C/W Dance Hall
Electricity 36 0.9 543 24,43535 1 2
Natural Gas 4 0.1 74 1,0294 0 0
40 1.0 618 25,464Subtotal 1 & 2 C/W Dance Hall 39 1 3
Electricity data recieved from PG&E ([email protected]). Natural gas data retrieved from The Gas Company billing statements. Billing Electricity data recieved from PG&E ([email protected]). Natural gas data retrieved from The Gas Company billing statements. Billing statements were provided by the Finance Department Richelle Rickard (805-470-3428).
1 & 2 City Hall (6901 ECR Ste. A)
Electricity 12 0.3 176 6,86511 0 1
Natural Gas 4 0.1 75 8964 0 0
16 0.4 251 7,761Subtotal 1 & 2 City Hall (6901 ECR Ste. A) 15 0 1
Electricity data recieved from PG&E ([email protected]). Natural gas data retrieved from The Gas Company billing statements. Billing Electricity data recieved from PG&E ([email protected]). Natural gas data retrieved from The Gas Company billing statements. Billing statements were provided by the Finance Department Richelle Rickard (805-470-3428).
1 & 2 City Hall (on Palma)
Electricity 3 0.1 41 2,3433 0 0
Natural Gas 0 0.0 0 1200 0 0
3 0.1 41 2,463Subtotal 1 & 2 City Hall (on Palma) 3 0 0
Electricity data recieved from PG&E ([email protected]). Natural gas data retrieved from The Gas Company billing statements. Billing Electricity data recieved from PG&E ([email protected]). Natural gas data retrieved from The Gas Company billing statements. Billing statements were provided by the Finance Department Richelle Rickard (805-470-3428).
1 & 2 Fire Dept #1
Electricity 9 0.2 136 5,1499 0 1
Natural Gas 6 0.1 115 1,4976 0 1
15 0.4 251 6,646Subtotal 1 & 2 Fire Dept #1 15 0 1
Electricity data recieved from PG&E ([email protected]). Natural gas data retrieved from The Gas Company billing statements. Billing Electricity data recieved from PG&E ([email protected]). Natural gas data retrieved from The Gas Company billing statements. Billing statements were provided by the Finance Department Richelle Rickard (805-470-3428).
This report has been generated for San Luis Obsipo APCD, CA using ICLEI's Clean Air and Climate Protection 2009 Software.
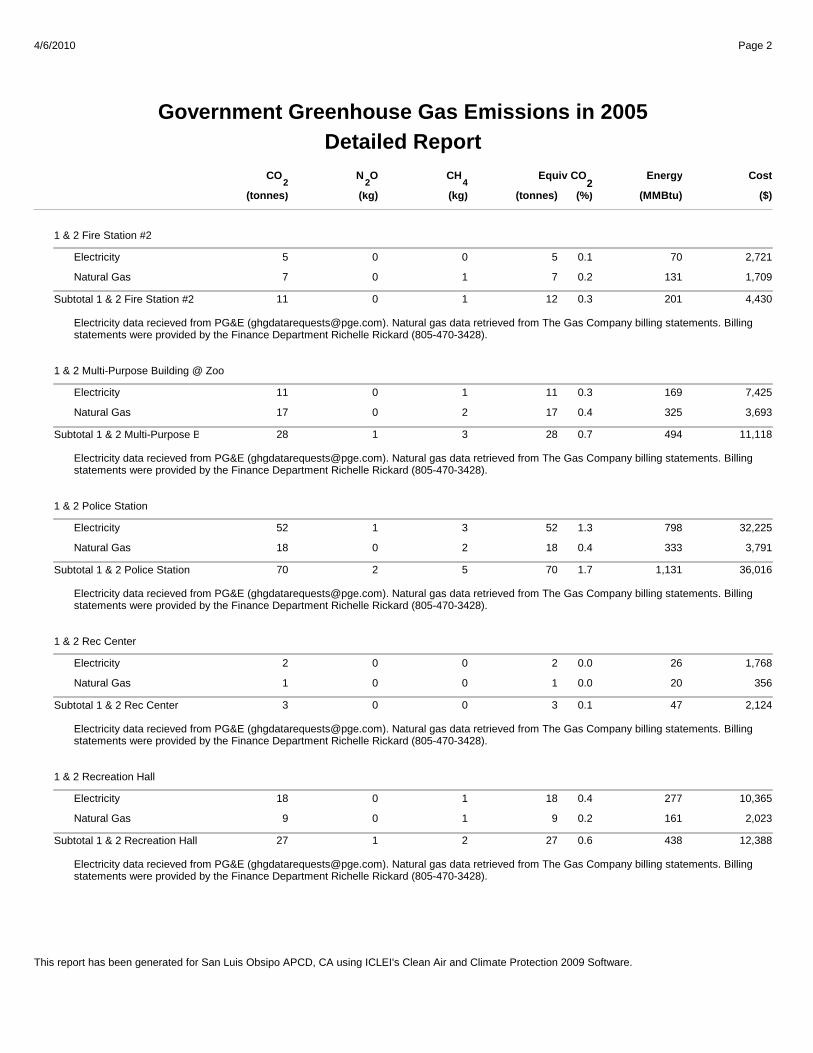
Detailed Report
Page 24/6/2010
Government Greenhouse Gas Emissions in 2005
(%)
Energy Cost
(tonnes) (MMBtu)
Equiv CO
($)2
CO
(tonnes)
N O
(kg)
CH
(kg)422
1 & 2 Fire Station #2
Electricity 5 0.1 70 2,7215 0 0
Natural Gas 7 0.2 131 1,7097 0 1
12 0.3 201 4,430Subtotal 1 & 2 Fire Station #2 11 0 1
Electricity data recieved from PG&E ([email protected]). Natural gas data retrieved from The Gas Company billing statements. Billing Electricity data recieved from PG&E ([email protected]). Natural gas data retrieved from The Gas Company billing statements. Billing statements were provided by the Finance Department Richelle Rickard (805-470-3428).
1 & 2 Multi-Purpose Building @ Zoo
Electricity 11 0.3 169 7,42511 0 1
Natural Gas 17 0.4 325 3,69317 0 2
28 0.7 494 11,118Subtotal 1 & 2 Multi-Purpose Building @ Zoo 28 1 3
Electricity data recieved from PG&E ([email protected]). Natural gas data retrieved from The Gas Company billing statements. Billing Electricity data recieved from PG&E ([email protected]). Natural gas data retrieved from The Gas Company billing statements. Billing statements were provided by the Finance Department Richelle Rickard (805-470-3428).
1 & 2 Police Station
Electricity 52 1.3 798 32,22552 1 3
Natural Gas 18 0.4 333 3,79118 0 2
70 1.7 1,131 36,016Subtotal 1 & 2 Police Station 70 2 5
Electricity data recieved from PG&E ([email protected]). Natural gas data retrieved from The Gas Company billing statements. Billing Electricity data recieved from PG&E ([email protected]). Natural gas data retrieved from The Gas Company billing statements. Billing statements were provided by the Finance Department Richelle Rickard (805-470-3428).
1 & 2 Rec Center
Electricity 2 0.0 26 1,7682 0 0
Natural Gas 1 0.0 20 3561 0 0
3 0.1 47 2,124Subtotal 1 & 2 Rec Center 3 0 0
Electricity data recieved from PG&E ([email protected]). Natural gas data retrieved from The Gas Company billing statements. Billing Electricity data recieved from PG&E ([email protected]). Natural gas data retrieved from The Gas Company billing statements. Billing statements were provided by the Finance Department Richelle Rickard (805-470-3428).
1 & 2 Recreation Hall
Electricity 18 0.4 277 10,36518 0 1
Natural Gas 9 0.2 161 2,0239 0 1
27 0.6 438 12,388Subtotal 1 & 2 Recreation Hall 27 1 2
Electricity data recieved from PG&E ([email protected]). Natural gas data retrieved from The Gas Company billing statements. Billing Electricity data recieved from PG&E ([email protected]). Natural gas data retrieved from The Gas Company billing statements. Billing statements were provided by the Finance Department Richelle Rickard (805-470-3428).
This report has been generated for San Luis Obsipo APCD, CA using ICLEI's Clean Air and Climate Protection 2009 Software.
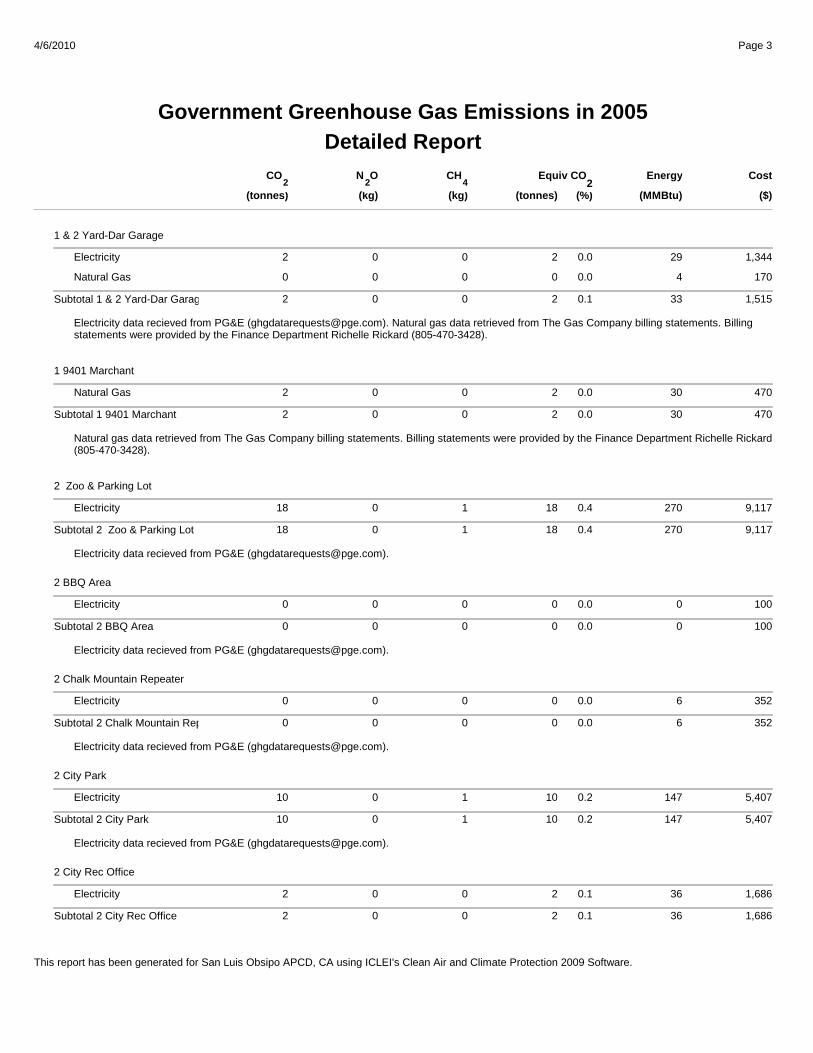
Detailed Report
Page 34/6/2010
Government Greenhouse Gas Emissions in 2005
(%)
Energy Cost
(tonnes) (MMBtu)
Equiv CO
($)2
CO
(tonnes)
N O
(kg)
CH
(kg)422
1 & 2 Yard-Dar Garage
Electricity 2 0.0 29 1,3442 0 0
Natural Gas 0 0.0 4 1700 0 0
2 0.1 33 1,515Subtotal 1 & 2 Yard-Dar Garage 2 0 0
Electricity data recieved from PG&E ([email protected]). Natural gas data retrieved from The Gas Company billing statements. Billing Electricity data recieved from PG&E ([email protected]). Natural gas data retrieved from The Gas Company billing statements. Billing statements were provided by the Finance Department Richelle Rickard (805-470-3428).
1 9401 Marchant
Natural Gas 2 0.0 30 4702 0 0
2 0.0 30 470Subtotal 1 9401 Marchant 2 0 0
Natural gas data retrieved from The Gas Company billing statements. Billing statements were provided by the Finance Department Richelle Rickard Natural gas data retrieved from The Gas Company billing statements. Billing statements were provided by the Finance Department Richelle Rickard (805-470-3428).
2 Zoo & Parking Lot
Electricity 18 0.4 270 9,11718 0 1
18 0.4 270 9,117Subtotal 2 Zoo & Parking Lot 18 0 1
Electricity data recieved from PG&E ([email protected]).
2 BBQ Area
Electricity 0 0.0 0 1000 0 0
0 0.0 0 100Subtotal 2 BBQ Area 0 0 0
Electricity data recieved from PG&E ([email protected]).
2 Chalk Mountain Repeater
Electricity 0 0.0 6 3520 0 0
0 0.0 6 352Subtotal 2 Chalk Mountain Repeater 0 0 0
Electricity data recieved from PG&E ([email protected]).
2 City Park
Electricity 10 0.2 147 5,40710 0 1
10 0.2 147 5,407Subtotal 2 City Park 10 0 1
Electricity data recieved from PG&E ([email protected]).
2 City Rec Office
Electricity 2 0.1 36 1,6862 0 0
2 0.1 36 1,686Subtotal 2 City Rec Office 2 0 0
This report has been generated for San Luis Obsipo APCD, CA using ICLEI's Clean Air and Climate Protection 2009 Software.
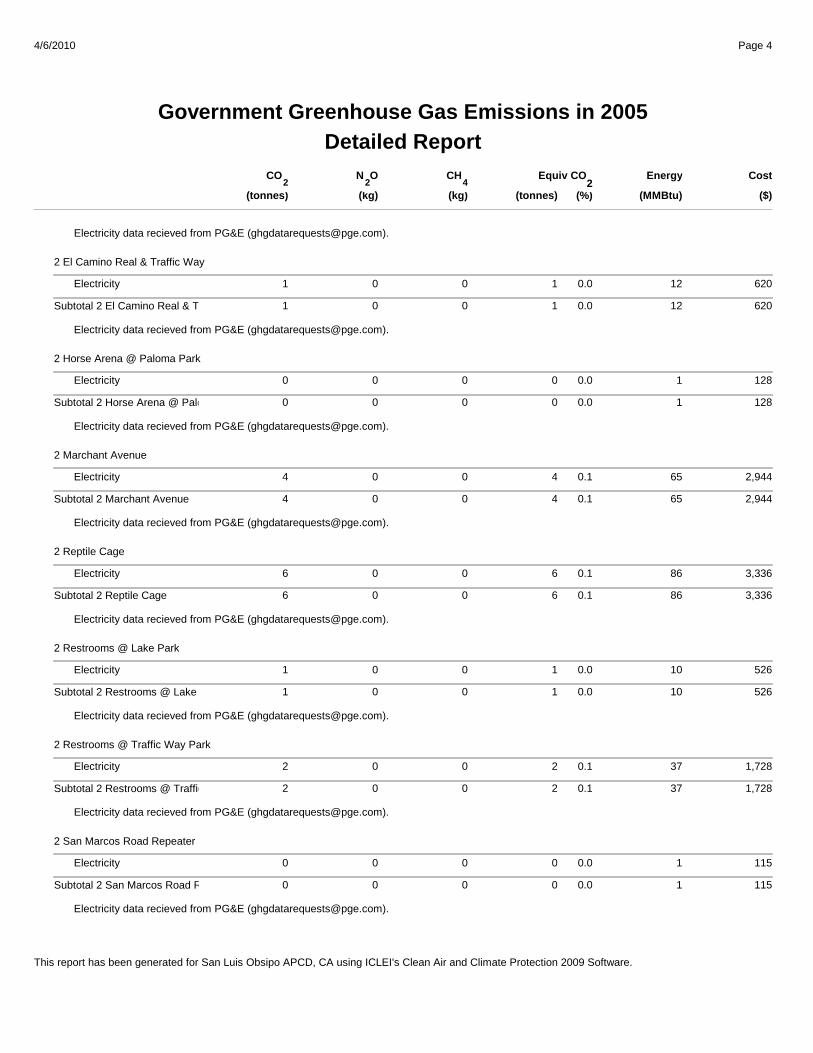
Detailed Report
Page 44/6/2010
Government Greenhouse Gas Emissions in 2005
(%)
Energy Cost
(tonnes) (MMBtu)
Equiv CO
($)2
CO
(tonnes)
N O
(kg)
CH
(kg)422
Electricity data recieved from PG&E ([email protected]).
2 El Camino Real & Traffic Way
Electricity 1 0.0 12 6201 0 0
1 0.0 12 620Subtotal 2 El Camino Real & Traffic Way 1 0 0
Electricity data recieved from PG&E ([email protected]).
2 Horse Arena @ Paloma Park
Electricity 0 0.0 1 1280 0 0
0 0.0 1 128Subtotal 2 Horse Arena @ Paloma Park 0 0 0
Electricity data recieved from PG&E ([email protected]).
2 Marchant Avenue
Electricity 4 0.1 65 2,9444 0 0
4 0.1 65 2,944Subtotal 2 Marchant Avenue 4 0 0
Electricity data recieved from PG&E ([email protected]).
2 Reptile Cage
Electricity 6 0.1 86 3,3366 0 0
6 0.1 86 3,336Subtotal 2 Reptile Cage 6 0 0
Electricity data recieved from PG&E ([email protected]).
2 Restrooms @ Lake Park
Electricity 1 0.0 10 5261 0 0
1 0.0 10 526Subtotal 2 Restrooms @ Lake Park 1 0 0
Electricity data recieved from PG&E ([email protected]).
2 Restrooms @ Traffic Way Park
Electricity 2 0.1 37 1,7282 0 0
2 0.1 37 1,728Subtotal 2 Restrooms @ Traffic Way Park 2 0 0
Electricity data recieved from PG&E ([email protected]).
2 San Marcos Road Repeater
Electricity 0 0.0 1 1150 0 0
0 0.0 1 115Subtotal 2 San Marcos Road Repeater 0 0 0
Electricity data recieved from PG&E ([email protected]).
This report has been generated for San Luis Obsipo APCD, CA using ICLEI's Clean Air and Climate Protection 2009 Software.
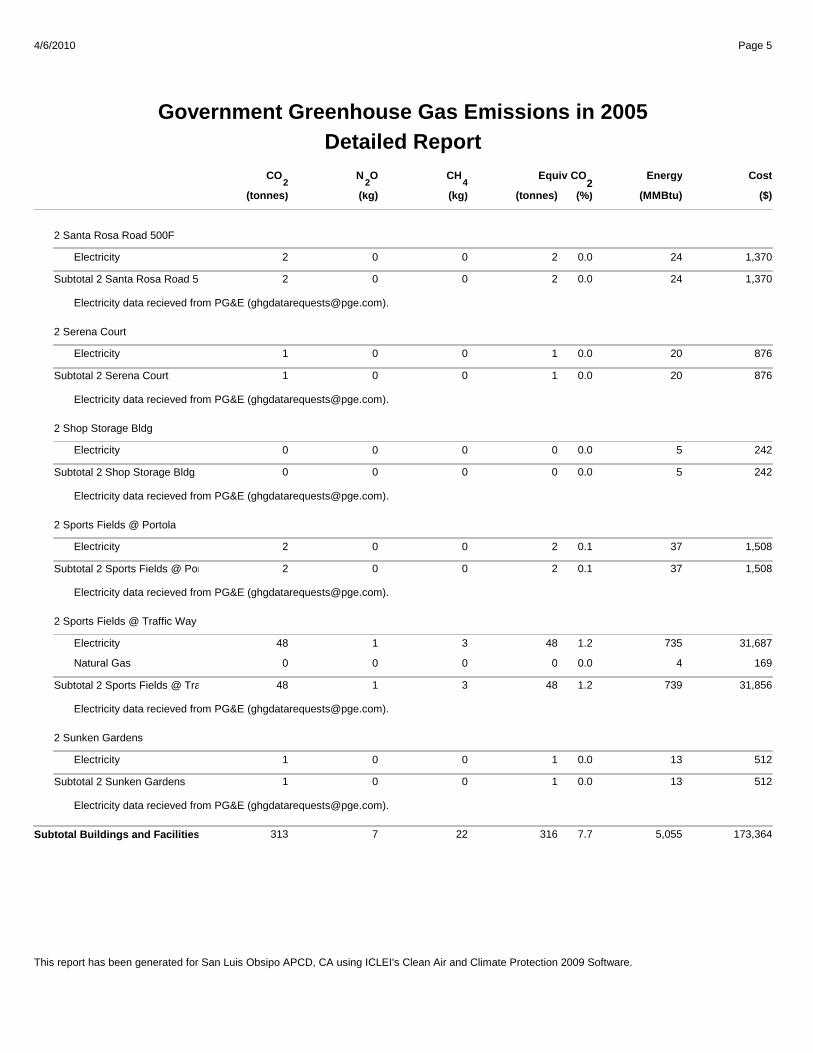
Detailed Report
Page 54/6/2010
Government Greenhouse Gas Emissions in 2005
(%)
Energy Cost
(tonnes) (MMBtu)
Equiv CO
($)2
CO
(tonnes)
N O
(kg)
CH
(kg)422
2 Santa Rosa Road 500F
Electricity 2 0.0 24 1,3702 0 0
2 0.0 24 1,370Subtotal 2 Santa Rosa Road 500F 2 0 0
Electricity data recieved from PG&E ([email protected]).
2 Serena Court
Electricity 1 0.0 20 8761 0 0
1 0.0 20 876Subtotal 2 Serena Court 1 0 0
Electricity data recieved from PG&E ([email protected]).
2 Shop Storage Bldg
Electricity 0 0.0 5 2420 0 0
0 0.0 5 242Subtotal 2 Shop Storage Bldg 0 0 0
Electricity data recieved from PG&E ([email protected]).
2 Sports Fields @ Portola
Electricity 2 0.1 37 1,5082 0 0
2 0.1 37 1,508Subtotal 2 Sports Fields @ Portola 2 0 0
Electricity data recieved from PG&E ([email protected]).
2 Sports Fields @ Traffic Way
Electricity 48 1.2 735 31,68748 1 3
Natural Gas 0 0.0 4 1690 0 0
48 1.2 739 31,856Subtotal 2 Sports Fields @ Traffic Way 48 1 3
Electricity data recieved from PG&E ([email protected]).
2 Sunken Gardens
Electricity 1 0.0 13 5121 0 0
1 0.0 13 512Subtotal 2 Sunken Gardens 1 0 0
Electricity data recieved from PG&E ([email protected]).
316 5,055 173,3647.7Subtotal Buildings and Facilities 313 7 22
This report has been generated for San Luis Obsipo APCD, CA using ICLEI's Clean Air and Climate Protection 2009 Software.
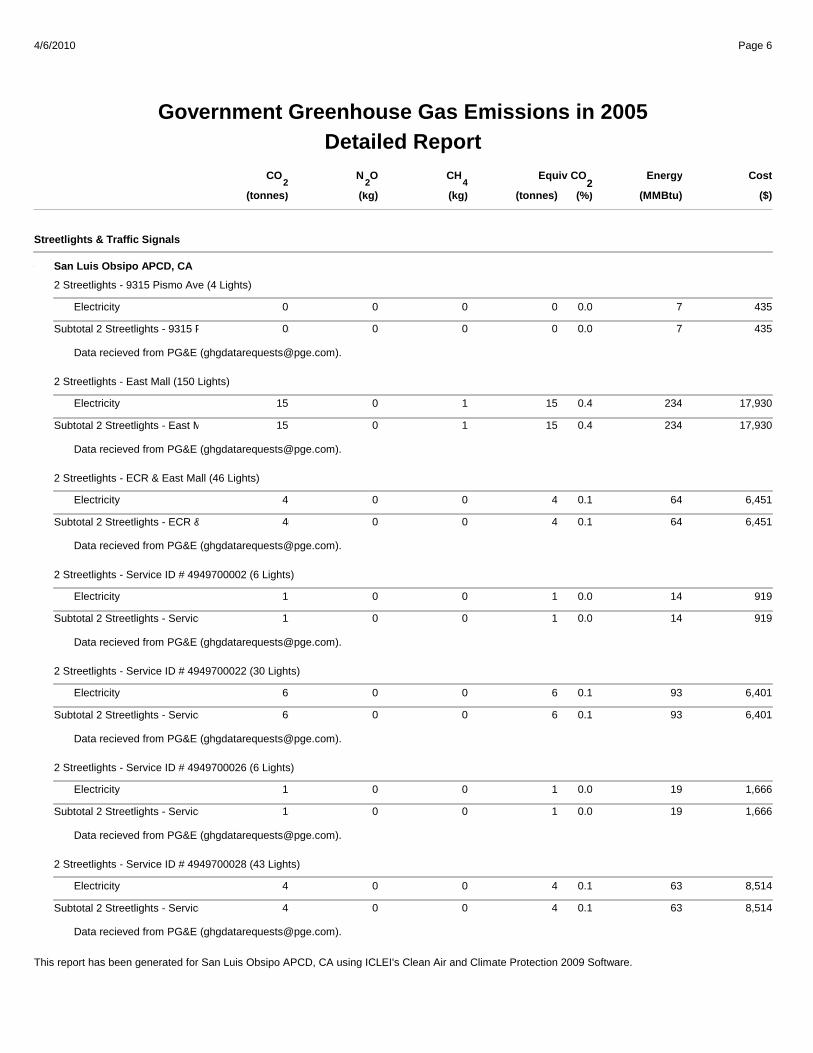
Detailed Report
Page 64/6/2010
Government Greenhouse Gas Emissions in 2005
(%)
Energy Cost
(tonnes) (MMBtu)
Equiv CO
($)2
CO
(tonnes)
N O
(kg)
CH
(kg)422
Streetlights & Traffic Signals
San Luis Obsipo APCD, CA
2 Streetlights - 9315 Pismo Ave (4 Lights)
Electricity 0 0.0 7 4350 0 0
0 0.0 7 435Subtotal 2 Streetlights - 9315 Pismo Ave (4 Lights)0 0 0
Data recieved from PG&E ([email protected]).
2 Streetlights - East Mall (150 Lights)
Electricity 15 0.4 234 17,93015 0 1
15 0.4 234 17,930Subtotal 2 Streetlights - East Mall (150 Lights) 15 0 1
Data recieved from PG&E ([email protected]).
2 Streetlights - ECR & East Mall (46 Lights)
Electricity 4 0.1 64 6,4514 0 0
4 0.1 64 6,451Subtotal 2 Streetlights - ECR & East Mall (46 Lights)4 0 0
Data recieved from PG&E ([email protected]).
2 Streetlights - Service ID # 4949700002 (6 Lights)
Electricity 1 0.0 14 9191 0 0
1 0.0 14 919Subtotal 2 Streetlights - Service ID # 4949700002 (6 Lights)1 0 0
Data recieved from PG&E ([email protected]).
2 Streetlights - Service ID # 4949700022 (30 Lights)
Electricity 6 0.1 93 6,4016 0 0
6 0.1 93 6,401Subtotal 2 Streetlights - Service ID # 4949700022 (30 Lights)6 0 0
Data recieved from PG&E ([email protected]).
2 Streetlights - Service ID # 4949700026 (6 Lights)
Electricity 1 0.0 19 1,6661 0 0
1 0.0 19 1,666Subtotal 2 Streetlights - Service ID # 4949700026 (6 Lights)1 0 0
Data recieved from PG&E ([email protected]).
2 Streetlights - Service ID # 4949700028 (43 Lights)
Electricity 4 0.1 63 8,5144 0 0
4 0.1 63 8,514Subtotal 2 Streetlights - Service ID # 4949700028 (43 Lights)4 0 0
Data recieved from PG&E ([email protected]).
This report has been generated for San Luis Obsipo APCD, CA using ICLEI's Clean Air and Climate Protection 2009 Software.
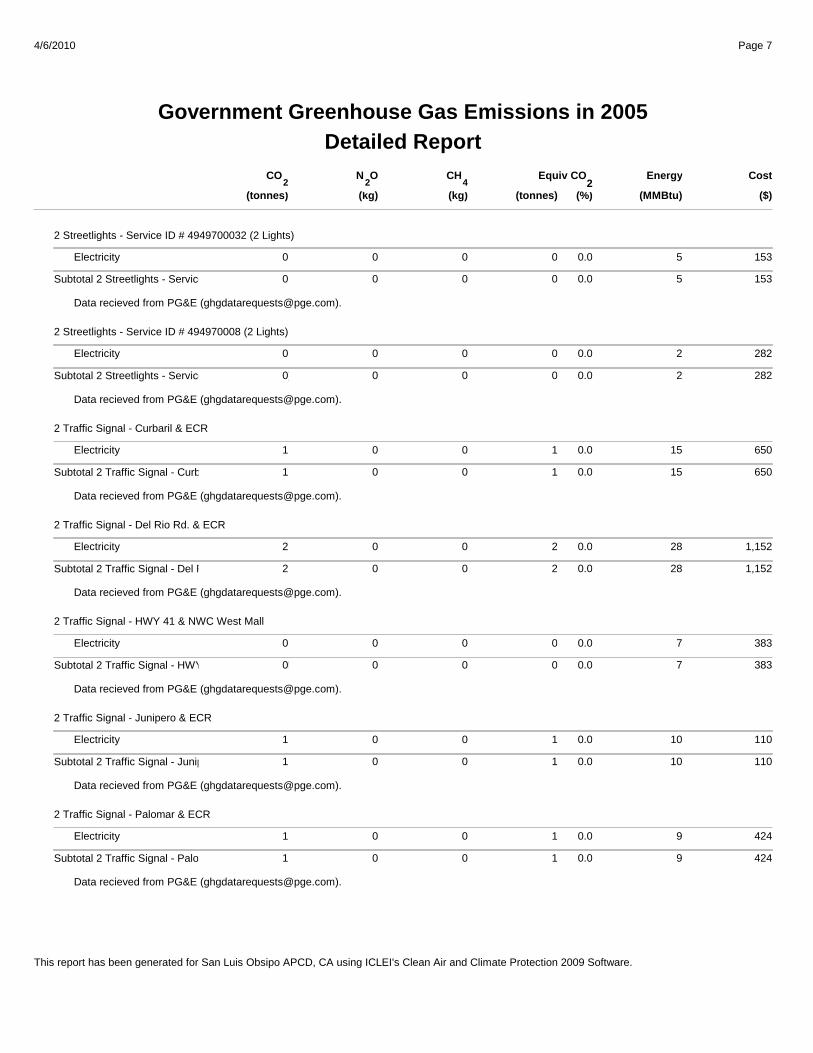
Detailed Report
Page 74/6/2010
Government Greenhouse Gas Emissions in 2005
(%)
Energy Cost
(tonnes) (MMBtu)
Equiv CO
($)2
CO
(tonnes)
N O
(kg)
CH
(kg)422
2 Streetlights - Service ID # 4949700032 (2 Lights)
Electricity 0 0.0 5 1530 0 0
0 0.0 5 153Subtotal 2 Streetlights - Service ID # 4949700032 (2 Lights)0 0 0
Data recieved from PG&E ([email protected]).
2 Streetlights - Service ID # 494970008 (2 Lights)
Electricity 0 0.0 2 2820 0 0
0 0.0 2 282Subtotal 2 Streetlights - Service ID # 494970008 (2 Lights)0 0 0
Data recieved from PG&E ([email protected]).
2 Traffic Signal - Curbaril & ECR
Electricity 1 0.0 15 6501 0 0
1 0.0 15 650Subtotal 2 Traffic Signal - Curbaril & ECR 1 0 0
Data recieved from PG&E ([email protected]).
2 Traffic Signal - Del Rio Rd. & ECR
Electricity 2 0.0 28 1,1522 0 0
2 0.0 28 1,152Subtotal 2 Traffic Signal - Del Rio Rd. & ECR 2 0 0
Data recieved from PG&E ([email protected]).
2 Traffic Signal - HWY 41 & NWC West Mall
Electricity 0 0.0 7 3830 0 0
0 0.0 7 383Subtotal 2 Traffic Signal - HWY 41 & NWC West Mall0 0 0
Data recieved from PG&E ([email protected]).
2 Traffic Signal - Junipero & ECR
Electricity 1 0.0 10 1101 0 0
1 0.0 10 110Subtotal 2 Traffic Signal - Junipero & ECR 1 0 0
Data recieved from PG&E ([email protected]).
2 Traffic Signal - Palomar & ECR
Electricity 1 0.0 9 4241 0 0
1 0.0 9 424Subtotal 2 Traffic Signal - Palomar & ECR 1 0 0
Data recieved from PG&E ([email protected]).
This report has been generated for San Luis Obsipo APCD, CA using ICLEI's Clean Air and Climate Protection 2009 Software.
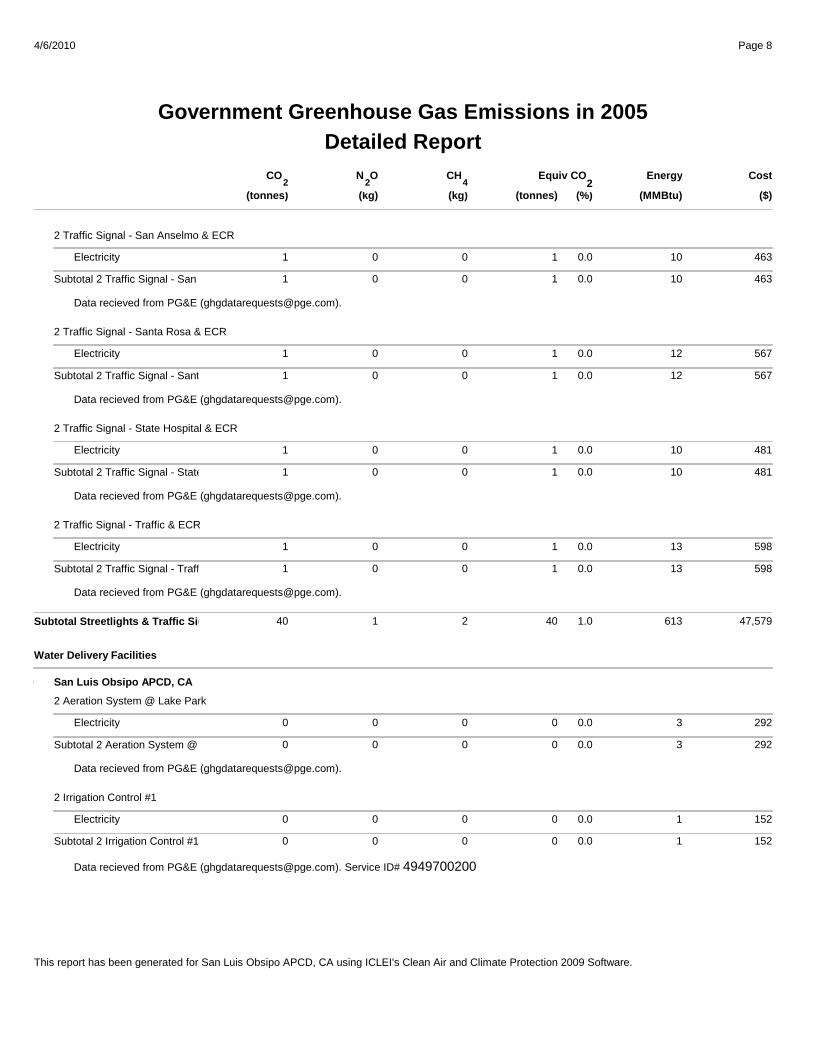
Detailed Report
Page 84/6/2010
Government Greenhouse Gas Emissions in 2005
(%)
Energy Cost
(tonnes) (MMBtu)
Equiv CO
($)2
CO
(tonnes)
N O
(kg)
CH
(kg)422
2 Traffic Signal - San Anselmo & ECR
Electricity 1 0.0 10 4631 0 0
1 0.0 10 463Subtotal 2 Traffic Signal - San Anselmo & ECR 1 0 0
Data recieved from PG&E ([email protected]).
2 Traffic Signal - Santa Rosa & ECR
Electricity 1 0.0 12 5671 0 0
1 0.0 12 567Subtotal 2 Traffic Signal - Santa Rosa & ECR 1 0 0
Data recieved from PG&E ([email protected]).
2 Traffic Signal - State Hospital & ECR
Electricity 1 0.0 10 4811 0 0
1 0.0 10 481Subtotal 2 Traffic Signal - State Hospital & ECR 1 0 0
Data recieved from PG&E ([email protected]).
2 Traffic Signal - Traffic & ECR
Electricity 1 0.0 13 5981 0 0
1 0.0 13 598Subtotal 2 Traffic Signal - Traffic & ECR 1 0 0
Data recieved from PG&E ([email protected]).
40 613 47,5791.0Subtotal Streetlights & Traffic Signals 40 1 2
Water Delivery Facilities
San Luis Obsipo APCD, CA
2 Aeration System @ Lake Park
Electricity 0 0.0 3 2920 0 0
0 0.0 3 292Subtotal 2 Aeration System @ Lake Park 0 0 0
Data recieved from PG&E ([email protected]).
2 Irrigation Control #1
Electricity 0 0.0 1 1520 0 0
0 0.0 1 152Subtotal 2 Irrigation Control #1 0 0 0
Data recieved from PG&E ([email protected]). Service ID# 4949700200
This report has been generated for San Luis Obsipo APCD, CA using ICLEI's Clean Air and Climate Protection 2009 Software.
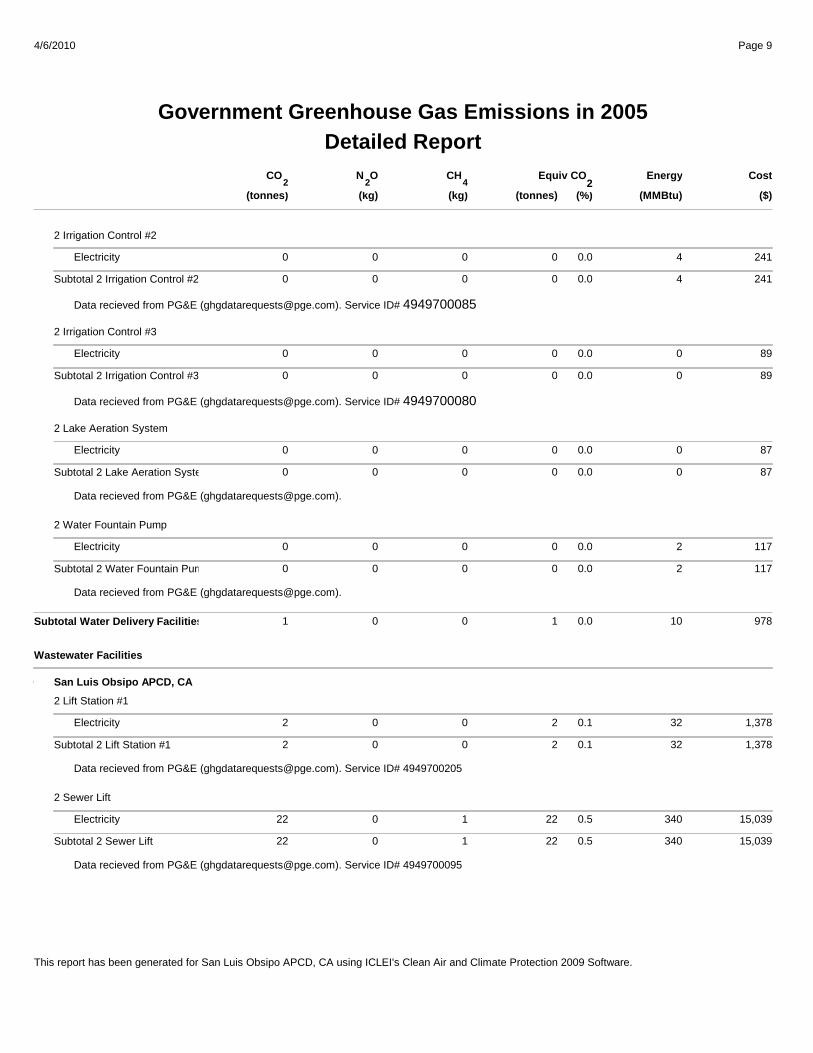
Detailed Report
Page 94/6/2010
Government Greenhouse Gas Emissions in 2005
(%)
Energy Cost
(tonnes) (MMBtu)
Equiv CO
($)2
CO
(tonnes)
N O
(kg)
CH
(kg)422
2 Irrigation Control #2
Electricity 0 0.0 4 2410 0 0
0 0.0 4 241Subtotal 2 Irrigation Control #2 0 0 0
Data recieved from PG&E ([email protected]). Service ID# 4949700085
2 Irrigation Control #3
Electricity 0 0.0 0 890 0 0
0 0.0 0 89Subtotal 2 Irrigation Control #3 0 0 0
Data recieved from PG&E ([email protected]). Service ID# 4949700080
2 Lake Aeration System
Electricity 0 0.0 0 870 0 0
0 0.0 0 87Subtotal 2 Lake Aeration System 0 0 0
Data recieved from PG&E ([email protected]).
2 Water Fountain Pump
Electricity 0 0.0 2 1170 0 0
0 0.0 2 117Subtotal 2 Water Fountain Pump 0 0 0
Data recieved from PG&E ([email protected]).
1 10 9780.0Subtotal Water Delivery Facilities 1 0 0
Wastewater Facilities
San Luis Obsipo APCD, CA
2 Lift Station #1
Electricity 2 0.1 32 1,3782 0 0
2 0.1 32 1,378Subtotal 2 Lift Station #1 2 0 0
Data recieved from PG&E ([email protected]). Service ID# 4949700205
2 Sewer Lift
Electricity 22 0.5 340 15,03922 0 1
22 0.5 340 15,039Subtotal 2 Sewer Lift 22 0 1
Data recieved from PG&E ([email protected]). Service ID# 4949700095
This report has been generated for San Luis Obsipo APCD, CA using ICLEI's Clean Air and Climate Protection 2009 Software.
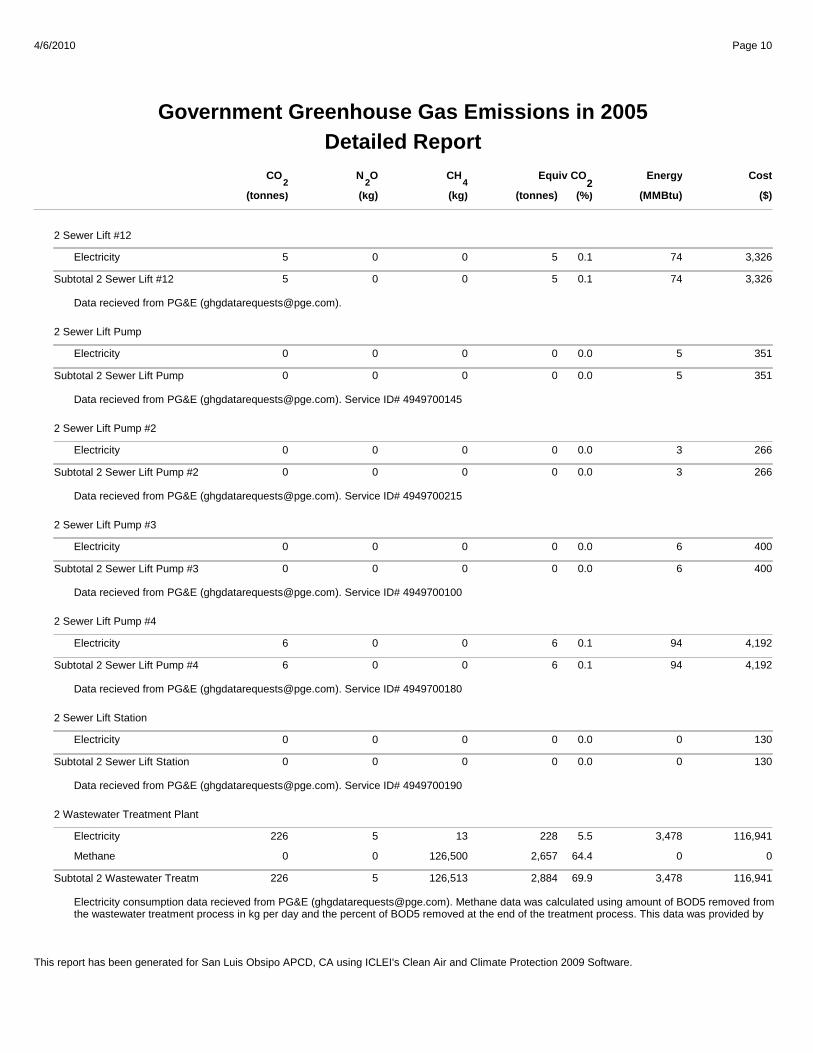
Detailed Report
Page 104/6/2010
Government Greenhouse Gas Emissions in 2005
(%)
Energy Cost
(tonnes) (MMBtu)
Equiv CO
($)2
CO
(tonnes)
N O
(kg)
CH
(kg)422
2 Sewer Lift #12
Electricity 5 0.1 74 3,3265 0 0
5 0.1 74 3,326Subtotal 2 Sewer Lift #12 5 0 0
Data recieved from PG&E ([email protected]).
2 Sewer Lift Pump
Electricity 0 0.0 5 3510 0 0
0 0.0 5 351Subtotal 2 Sewer Lift Pump 0 0 0
Data recieved from PG&E ([email protected]). Service ID# 4949700145
2 Sewer Lift Pump #2
Electricity 0 0.0 3 2660 0 0
0 0.0 3 266Subtotal 2 Sewer Lift Pump #2 0 0 0
Data recieved from PG&E ([email protected]). Service ID# 4949700215
2 Sewer Lift Pump #3
Electricity 0 0.0 6 4000 0 0
0 0.0 6 400Subtotal 2 Sewer Lift Pump #3 0 0 0
Data recieved from PG&E ([email protected]). Service ID# 4949700100
2 Sewer Lift Pump #4
Electricity 6 0.1 94 4,1926 0 0
6 0.1 94 4,192Subtotal 2 Sewer Lift Pump #4 6 0 0
Data recieved from PG&E ([email protected]). Service ID# 4949700180
2 Sewer Lift Station
Electricity 0 0.0 0 1300 0 0
0 0.0 0 130Subtotal 2 Sewer Lift Station 0 0 0
Data recieved from PG&E ([email protected]). Service ID# 4949700190
2 Wastewater Treatment Plant
Electricity 228 5.5 3,478 116,941226 5 13
Methane 2,657 64.4 0 00 0 126,500
2,884 69.9 3,478 116,941Subtotal 2 Wastewater Treatment Plant 226 5 126,513
Electricity consumption data recieved from PG&E ([email protected]). Methane data was calculated using amount of BOD5 removed from Electricity consumption data recieved from PG&E ([email protected]). Methane data was calculated using amount of BOD5 removed from the wastewater treatment process in kg per day and the percent of BOD5 removed at the end of the treatment process. This data was provided by
This report has been generated for San Luis Obsipo APCD, CA using ICLEI's Clean Air and Climate Protection 2009 Software.
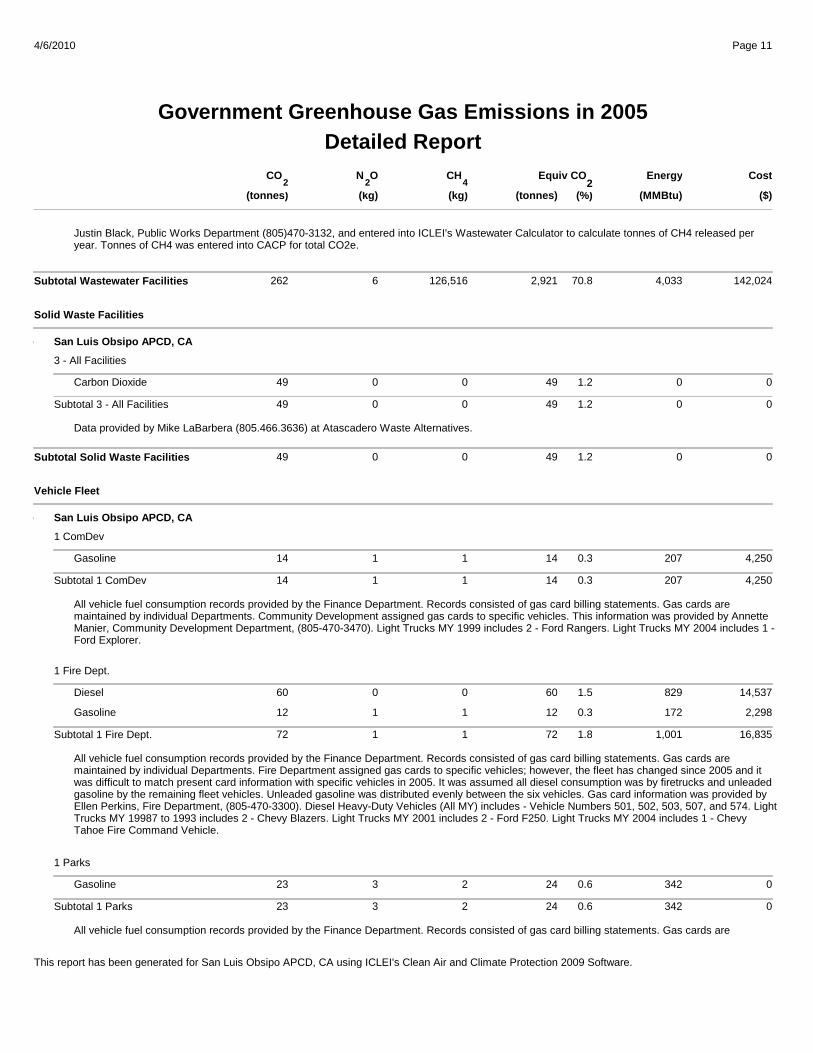
Detailed Report
Page 114/6/2010
Government Greenhouse Gas Emissions in 2005
(%)
Energy Cost
(tonnes) (MMBtu)
Equiv CO
($)2
CO
(tonnes)
N O
(kg)
CH
(kg)422
Justin Black, Public Works Department (805)470-3132, and entered into ICLEI's Wastewater Calculator to calculate tonnes of CH4 released per Justin Black, Public Works Department (805)470-3132, and entered into ICLEI's Wastewater Calculator to calculate tonnes of CH4 released per year. Tonnes of CH4 was entered into CACP for total CO2e.
2,921 4,033 142,02470.8Subtotal Wastewater Facilities 262 6 126,516
Solid Waste Facilities
San Luis Obsipo APCD, CA
3 - All Facilities
Carbon Dioxide 49 1.2 0 049 0 0
49 1.2 0 0Subtotal 3 - All Facilities 49 0 0
Data provided by Mike LaBarbera (805.466.3636) at Atascadero Waste Alternatives.
49 0 01.2Subtotal Solid Waste Facilities 49 0 0
Vehicle Fleet
San Luis Obsipo APCD, CA
1 ComDev
Gasoline 14 0.3 207 4,25014 1 1
14 0.3 207 4,250Subtotal 1 ComDev 14 1 1
All vehicle fuel consumption records provided by the Finance Department. Records consisted of gas card billing statements. Gas cards are All vehicle fuel consumption records provided by the Finance Department. Records consisted of gas card billing statements. Gas cards are maintained by individual Departments. Community Development assigned gas cards to specific vehicles. This information was provided by Annette All vehicle fuel consumption records provided by the Finance Department. Records consisted of gas card billing statements. Gas cards are maintained by individual Departments. Community Development assigned gas cards to specific vehicles. This information was provided by Annette Manier, Community Development Department, (805-470-3470). Light Trucks MY 1999 includes 2 - Ford Rangers. Light Trucks MY 2004 includes 1 - Ford Explorer.
1 Fire Dept.
Diesel 60 1.5 829 14,53760 0 0
Gasoline 12 0.3 172 2,29812 1 1
72 1.8 1,001 16,835Subtotal 1 Fire Dept. 72 1 1
All vehicle fuel consumption records provided by the Finance Department. Records consisted of gas card billing statements. Gas cards are All vehicle fuel consumption records provided by the Finance Department. Records consisted of gas card billing statements. Gas cards are maintained by individual Departments. Fire Department assigned gas cards to specific vehicles; however, the fleet has changed since 2005 and it All vehicle fuel consumption records provided by the Finance Department. Records consisted of gas card billing statements. Gas cards are maintained by individual Departments. Fire Department assigned gas cards to specific vehicles; however, the fleet has changed since 2005 and it was difficult to match present card information with specific vehicles in 2005. It was assumed all diesel consumption was by firetrucks and unleaded gasoline by the remaining fleet vehicles. Unleaded gasoline was distributed evenly between the six vehicles. Gas card information was provided by
All vehicle fuel consumption records provided by the Finance Department. Records consisted of gas card billing statements. Gas cards are maintained by individual Departments. Fire Department assigned gas cards to specific vehicles; however, the fleet has changed since 2005 and it was difficult to match present card information with specific vehicles in 2005. It was assumed all diesel consumption was by firetrucks and unleaded gasoline by the remaining fleet vehicles. Unleaded gasoline was distributed evenly between the six vehicles. Gas card information was provided by Ellen Perkins, Fire Department, (805-470-3300). Diesel Heavy-Duty Vehicles (All MY) includes - Vehicle Numbers 501, 502, 503, 507, and 574. Light Trucks MY 19987 to 1993 includes 2 - Chevy Blazers. Light Trucks MY 2001 includes 2 - Ford F250. Light Trucks MY 2004 includes 1 - Chevy
All vehicle fuel consumption records provided by the Finance Department. Records consisted of gas card billing statements. Gas cards are maintained by individual Departments. Fire Department assigned gas cards to specific vehicles; however, the fleet has changed since 2005 and it was difficult to match present card information with specific vehicles in 2005. It was assumed all diesel consumption was by firetrucks and unleaded gasoline by the remaining fleet vehicles. Unleaded gasoline was distributed evenly between the six vehicles. Gas card information was provided by Ellen Perkins, Fire Department, (805-470-3300). Diesel Heavy-Duty Vehicles (All MY) includes - Vehicle Numbers 501, 502, 503, 507, and 574. Light Trucks MY 19987 to 1993 includes 2 - Chevy Blazers. Light Trucks MY 2001 includes 2 - Ford F250. Light Trucks MY 2004 includes 1 - Chevy Tahoe Fire Command Vehicle.
1 Parks
Gasoline 24 0.6 342 023 3 2
24 0.6 342 0Subtotal 1 Parks 23 3 2
All vehicle fuel consumption records provided by the Finance Department. Records consisted of gas card billing statements. Gas cards are
This report has been generated for San Luis Obsipo APCD, CA using ICLEI's Clean Air and Climate Protection 2009 Software.
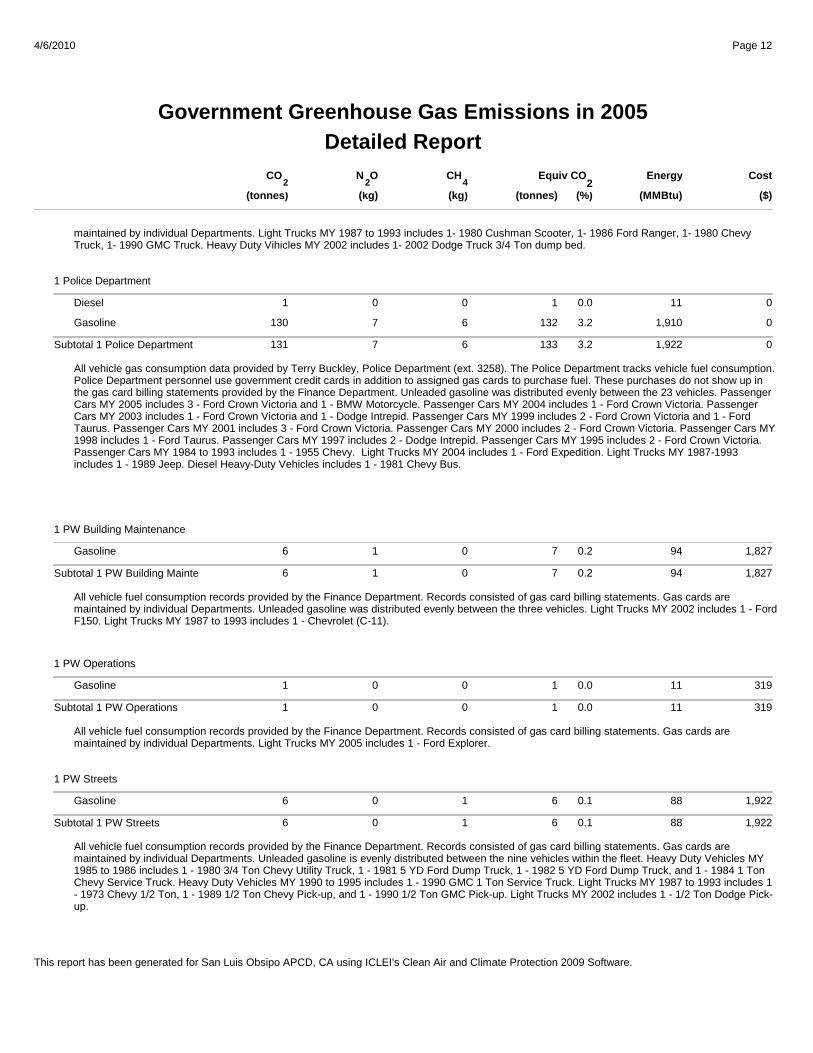
Detailed Report
Page 124/6/2010
Government Greenhouse Gas Emissions in 2005
(%)
Energy Cost
(tonnes) (MMBtu)
Equiv CO
($)2
CO
(tonnes)
N O
(kg)
CH
(kg)422
maintained by individual Departments. Light Trucks MY 1987 to 1993 includes 1- 1980 Cushman Scooter, 1- 1986 Ford Ranger, 1- 1980 Chevy maintained by individual Departments. Light Trucks MY 1987 to 1993 includes 1- 1980 Cushman Scooter, 1- 1986 Ford Ranger, 1- 1980 Chevy Truck, 1- 1990 GMC Truck. Heavy Duty Vihicles MY 2002 includes 1- 2002 Dodge Truck 3/4 Ton dump bed.
1 Police Department
Diesel 1 0.0 11 01 0 0
Gasoline 132 3.2 1,910 0130 7 6
133 3.2 1,922 0Subtotal 1 Police Department 131 7 6
All vehicle gas consumption data provided by Terry Buckley, Police Department (ext. 3258). The Police Department tracks vehicle fuel consumption. All vehicle gas consumption data provided by Terry Buckley, Police Department (ext. 3258). The Police Department tracks vehicle fuel consumption. Police Department personnel use government credit cards in addition to assigned gas cards to purchase fuel. These purchases do not show up in All vehicle gas consumption data provided by Terry Buckley, Police Department (ext. 3258). The Police Department tracks vehicle fuel consumption. Police Department personnel use government credit cards in addition to assigned gas cards to purchase fuel. These purchases do not show up in the gas card billing statements provided by the Finance Department. Unleaded gasoline was distributed evenly between the 23 vehicles. Passenger Cars MY 2005 includes 3 - Ford Crown Victoria and 1 - BMW Motorcycle. Passenger Cars MY 2004 includes 1 - Ford Crown Victoria. Passenger
All vehicle gas consumption data provided by Terry Buckley, Police Department (ext. 3258). The Police Department tracks vehicle fuel consumption. Police Department personnel use government credit cards in addition to assigned gas cards to purchase fuel. These purchases do not show up in the gas card billing statements provided by the Finance Department. Unleaded gasoline was distributed evenly between the 23 vehicles. Passenger Cars MY 2005 includes 3 - Ford Crown Victoria and 1 - BMW Motorcycle. Passenger Cars MY 2004 includes 1 - Ford Crown Victoria. Passenger Cars MY 2003 includes 1 - Ford Crown Victoria and 1 - Dodge Intrepid. Passenger Cars MY 1999 includes 2 - Ford Crown Victoria and 1 - Ford Taurus. Passenger Cars MY 2001 includes 3 - Ford Crown Victoria. Passenger Cars MY 2000 includes 2 - Ford Crown Victoria. Passenger Cars MY
All vehicle gas consumption data provided by Terry Buckley, Police Department (ext. 3258). The Police Department tracks vehicle fuel consumption. Police Department personnel use government credit cards in addition to assigned gas cards to purchase fuel. These purchases do not show up in the gas card billing statements provided by the Finance Department. Unleaded gasoline was distributed evenly between the 23 vehicles. Passenger Cars MY 2005 includes 3 - Ford Crown Victoria and 1 - BMW Motorcycle. Passenger Cars MY 2004 includes 1 - Ford Crown Victoria. Passenger Cars MY 2003 includes 1 - Ford Crown Victoria and 1 - Dodge Intrepid. Passenger Cars MY 1999 includes 2 - Ford Crown Victoria and 1 - Ford Taurus. Passenger Cars MY 2001 includes 3 - Ford Crown Victoria. Passenger Cars MY 2000 includes 2 - Ford Crown Victoria. Passenger Cars MY 1998 includes 1 - Ford Taurus. Passenger Cars MY 1997 includes 2 - Dodge Intrepid. Passenger Cars MY 1995 includes 2 - Ford Crown Victoria.
All vehicle gas consumption data provided by Terry Buckley, Police Department (ext. 3258). The Police Department tracks vehicle fuel consumption. Police Department personnel use government credit cards in addition to assigned gas cards to purchase fuel. These purchases do not show up in the gas card billing statements provided by the Finance Department. Unleaded gasoline was distributed evenly between the 23 vehicles. Passenger Cars MY 2005 includes 3 - Ford Crown Victoria and 1 - BMW Motorcycle. Passenger Cars MY 2004 includes 1 - Ford Crown Victoria. Passenger Cars MY 2003 includes 1 - Ford Crown Victoria and 1 - Dodge Intrepid. Passenger Cars MY 1999 includes 2 - Ford Crown Victoria and 1 - Ford Taurus. Passenger Cars MY 2001 includes 3 - Ford Crown Victoria. Passenger Cars MY 2000 includes 2 - Ford Crown Victoria. Passenger Cars MY 1998 includes 1 - Ford Taurus. Passenger Cars MY 1997 includes 2 - Dodge Intrepid. Passenger Cars MY 1995 includes 2 - Ford Crown Victoria. Passenger Cars MY 1984 to 1993 includes 1 - 1955 Chevy. Light Trucks MY 2004 includes 1 - Ford Expedition. Light Trucks MY 1987-1993 includes 1 - 1989 Jeep. Diesel Heavy-Duty Vehicles includes 1 - 1981 Chevy Bus.
All vehicle gas consumption data provided by Terry Buckley, Police Department (ext. 3258). The Police Department tracks vehicle fuel consumption. Police Department personnel use government credit cards in addition to assigned gas cards to purchase fuel. These purchases do not show up in the gas card billing statements provided by the Finance Department. Unleaded gasoline was distributed evenly between the 23 vehicles. Passenger Cars MY 2005 includes 3 - Ford Crown Victoria and 1 - BMW Motorcycle. Passenger Cars MY 2004 includes 1 - Ford Crown Victoria. Passenger Cars MY 2003 includes 1 - Ford Crown Victoria and 1 - Dodge Intrepid. Passenger Cars MY 1999 includes 2 - Ford Crown Victoria and 1 - Ford Taurus. Passenger Cars MY 2001 includes 3 - Ford Crown Victoria. Passenger Cars MY 2000 includes 2 - Ford Crown Victoria. Passenger Cars MY 1998 includes 1 - Ford Taurus. Passenger Cars MY 1997 includes 2 - Dodge Intrepid. Passenger Cars MY 1995 includes 2 - Ford Crown Victoria. Passenger Cars MY 1984 to 1993 includes 1 - 1955 Chevy. Light Trucks MY 2004 includes 1 - Ford Expedition. Light Trucks MY 1987-1993 includes 1 - 1989 Jeep. Diesel Heavy-Duty Vehicles includes 1 - 1981 Chevy Bus.
All vehicle gas consumption data provided by Terry Buckley, Police Department (ext. 3258). The Police Department tracks vehicle fuel consumption. Police Department personnel use government credit cards in addition to assigned gas cards to purchase fuel. These purchases do not show up in the gas card billing statements provided by the Finance Department. Unleaded gasoline was distributed evenly between the 23 vehicles. Passenger Cars MY 2005 includes 3 - Ford Crown Victoria and 1 - BMW Motorcycle. Passenger Cars MY 2004 includes 1 - Ford Crown Victoria. Passenger Cars MY 2003 includes 1 - Ford Crown Victoria and 1 - Dodge Intrepid. Passenger Cars MY 1999 includes 2 - Ford Crown Victoria and 1 - Ford Taurus. Passenger Cars MY 2001 includes 3 - Ford Crown Victoria. Passenger Cars MY 2000 includes 2 - Ford Crown Victoria. Passenger Cars MY 1998 includes 1 - Ford Taurus. Passenger Cars MY 1997 includes 2 - Dodge Intrepid. Passenger Cars MY 1995 includes 2 - Ford Crown Victoria. Passenger Cars MY 1984 to 1993 includes 1 - 1955 Chevy. Light Trucks MY 2004 includes 1 - Ford Expedition. Light Trucks MY 1987-1993 includes 1 - 1989 Jeep. Diesel Heavy-Duty Vehicles includes 1 - 1981 Chevy Bus.
1 PW Building Maintenance
Gasoline 7 0.2 94 1,8276 1 0
7 0.2 94 1,827Subtotal 1 PW Building Maintenance 6 1 0
All vehicle fuel consumption records provided by the Finance Department. Records consisted of gas card billing statements. Gas cards are All vehicle fuel consumption records provided by the Finance Department. Records consisted of gas card billing statements. Gas cards are maintained by individual Departments. Unleaded gasoline was distributed evenly between the three vehicles. Light Trucks MY 2002 includes 1 - FordAll vehicle fuel consumption records provided by the Finance Department. Records consisted of gas card billing statements. Gas cards are maintained by individual Departments. Unleaded gasoline was distributed evenly between the three vehicles. Light Trucks MY 2002 includes 1 - FordF150. Light Trucks MY 1987 to 1993 includes 1 - Chevrolet (C-11).
1 PW Operations
Gasoline 1 0.0 11 3191 0 0
1 0.0 11 319Subtotal 1 PW Operations 1 0 0
All vehicle fuel consumption records provided by the Finance Department. Records consisted of gas card billing statements. Gas cards are All vehicle fuel consumption records provided by the Finance Department. Records consisted of gas card billing statements. Gas cards are maintained by individual Departments. Light Trucks MY 2005 includes 1 - Ford Explorer.
1 PW Streets
Gasoline 6 0.1 88 1,9226 0 1
6 0.1 88 1,922Subtotal 1 PW Streets 6 0 1
All vehicle fuel consumption records provided by the Finance Department. Records consisted of gas card billing statements. Gas cards are All vehicle fuel consumption records provided by the Finance Department. Records consisted of gas card billing statements. Gas cards are maintained by individual Departments. Unleaded gasoline is evenly distributed between the nine vehicles within the fleet. Heavy Duty Vehicles MY 1985 to 1986 includes 1 - 1980 3/4 Ton Chevy Utility Truck, 1 - 1981 5 YD Ford Dump Truck, 1 - 1982 5 YD Ford Dump Truck, and 1 - 1984 1 Ton
All vehicle fuel consumption records provided by the Finance Department. Records consisted of gas card billing statements. Gas cards are maintained by individual Departments. Unleaded gasoline is evenly distributed between the nine vehicles within the fleet. Heavy Duty Vehicles MY 1985 to 1986 includes 1 - 1980 3/4 Ton Chevy Utility Truck, 1 - 1981 5 YD Ford Dump Truck, 1 - 1982 5 YD Ford Dump Truck, and 1 - 1984 1 Ton Chevy Service Truck. Heavy Duty Vehicles MY 1990 to 1995 includes 1 - 1990 GMC 1 Ton Service Truck. Light Trucks MY 1987 to 1993 includes 1
All vehicle fuel consumption records provided by the Finance Department. Records consisted of gas card billing statements. Gas cards are maintained by individual Departments. Unleaded gasoline is evenly distributed between the nine vehicles within the fleet. Heavy Duty Vehicles MY 1985 to 1986 includes 1 - 1980 3/4 Ton Chevy Utility Truck, 1 - 1981 5 YD Ford Dump Truck, 1 - 1982 5 YD Ford Dump Truck, and 1 - 1984 1 Ton Chevy Service Truck. Heavy Duty Vehicles MY 1990 to 1995 includes 1 - 1990 GMC 1 Ton Service Truck. Light Trucks MY 1987 to 1993 includes 1 - 1973 Chevy 1/2 Ton, 1 - 1989 1/2 Ton Chevy Pick-up, and 1 - 1990 1/2 Ton GMC Pick-up. Light Trucks MY 2002 includes 1 - 1/2 Ton Dodge Pick-up.
This report has been generated for San Luis Obsipo APCD, CA using ICLEI's Clean Air and Climate Protection 2009 Software.
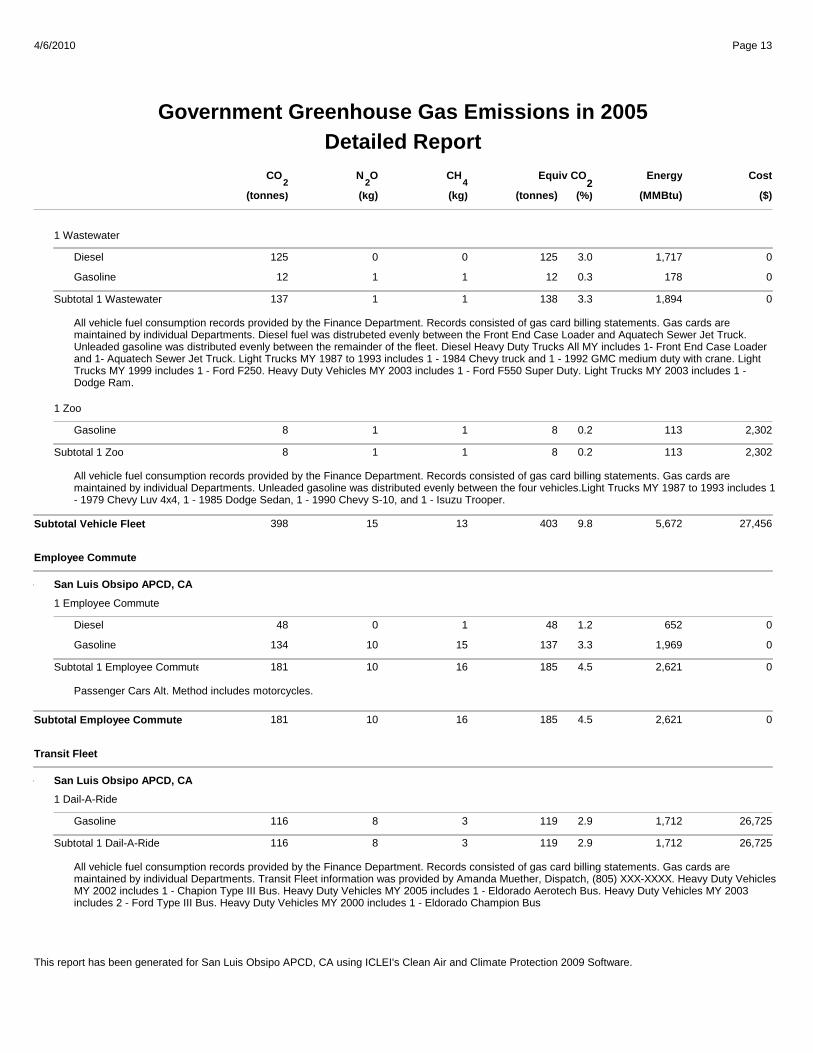
Detailed Report
Page 134/6/2010
Government Greenhouse Gas Emissions in 2005
(%)
Energy Cost
(tonnes) (MMBtu)
Equiv CO
($)2
CO
(tonnes)
N O
(kg)
CH
(kg)422
1 Wastewater
Diesel 125 3.0 1,717 0125 0 0
Gasoline 12 0.3 178 012 1 1
138 3.3 1,894 0Subtotal 1 Wastewater 137 1 1
All vehicle fuel consumption records provided by the Finance Department. Records consisted of gas card billing statements. Gas cards are All vehicle fuel consumption records provided by the Finance Department. Records consisted of gas card billing statements. Gas cards are maintained by individual Departments. Diesel fuel was distrubeted evenly between the Front End Case Loader and Aquatech Sewer Jet Truck. Unleaded gasoline was distributed evenly between the remainder of the fleet. Diesel Heavy Duty Trucks All MY includes 1- Front End Case Loader
All vehicle fuel consumption records provided by the Finance Department. Records consisted of gas card billing statements. Gas cards are maintained by individual Departments. Diesel fuel was distrubeted evenly between the Front End Case Loader and Aquatech Sewer Jet Truck. Unleaded gasoline was distributed evenly between the remainder of the fleet. Diesel Heavy Duty Trucks All MY includes 1- Front End Case Loader and 1- Aquatech Sewer Jet Truck. Light Trucks MY 1987 to 1993 includes 1 - 1984 Chevy truck and 1 - 1992 GMC medium duty with crane. Light
All vehicle fuel consumption records provided by the Finance Department. Records consisted of gas card billing statements. Gas cards are maintained by individual Departments. Diesel fuel was distrubeted evenly between the Front End Case Loader and Aquatech Sewer Jet Truck. Unleaded gasoline was distributed evenly between the remainder of the fleet. Diesel Heavy Duty Trucks All MY includes 1- Front End Case Loader and 1- Aquatech Sewer Jet Truck. Light Trucks MY 1987 to 1993 includes 1 - 1984 Chevy truck and 1 - 1992 GMC medium duty with crane. Light Trucks MY 1999 includes 1 - Ford F250. Heavy Duty Vehicles MY 2003 includes 1 - Ford F550 Super Duty. Light Trucks MY 2003 includes 1 - Dodge Ram.
1 Zoo
Gasoline 8 0.2 113 2,3028 1 1
8 0.2 113 2,302Subtotal 1 Zoo 8 1 1
All vehicle fuel consumption records provided by the Finance Department. Records consisted of gas card billing statements. Gas cards are All vehicle fuel consumption records provided by the Finance Department. Records consisted of gas card billing statements. Gas cards are maintained by individual Departments. Unleaded gasoline was distributed evenly between the four vehicles.Light Trucks MY 1987 to 1993 includes 1 - 1979 Chevy Luv 4x4, 1 - 1985 Dodge Sedan, 1 - 1990 Chevy S-10, and 1 - Isuzu Trooper.
403 5,672 27,4569.8Subtotal Vehicle Fleet 398 15 13
Employee Commute
San Luis Obsipo APCD, CA
1 Employee Commute
Diesel 48 1.2 652 048 0 1
Gasoline 137 3.3 1,969 0134 10 15
185 4.5 2,621 0Subtotal 1 Employee Commute 181 10 16
Passenger Cars Alt. Method includes motorcycles.
185 2,621 04.5Subtotal Employee Commute 181 10 16
Transit Fleet
San Luis Obsipo APCD, CA
1 Dail-A-Ride
Gasoline 119 2.9 1,712 26,725116 8 3
119 2.9 1,712 26,725Subtotal 1 Dail-A-Ride 116 8 3
All vehicle fuel consumption records provided by the Finance Department. Records consisted of gas card billing statements. Gas cards are All vehicle fuel consumption records provided by the Finance Department. Records consisted of gas card billing statements. Gas cards are maintained by individual Departments. Transit Fleet information was provided by Amanda Muether, Dispatch, (805) XXX-XXXX. Heavy Duty Vehicles All vehicle fuel consumption records provided by the Finance Department. Records consisted of gas card billing statements. Gas cards are maintained by individual Departments. Transit Fleet information was provided by Amanda Muether, Dispatch, (805) XXX-XXXX. Heavy Duty Vehicles MY 2002 includes 1 - Chapion Type III Bus. Heavy Duty Vehicles MY 2005 includes 1 - Eldorado Aerotech Bus. Heavy Duty Vehicles MY 2003 includes 2 - Ford Type III Bus. Heavy Duty Vehicles MY 2000 includes 1 - Eldorado Champion Bus
This report has been generated for San Luis Obsipo APCD, CA using ICLEI's Clean Air and Climate Protection 2009 Software.
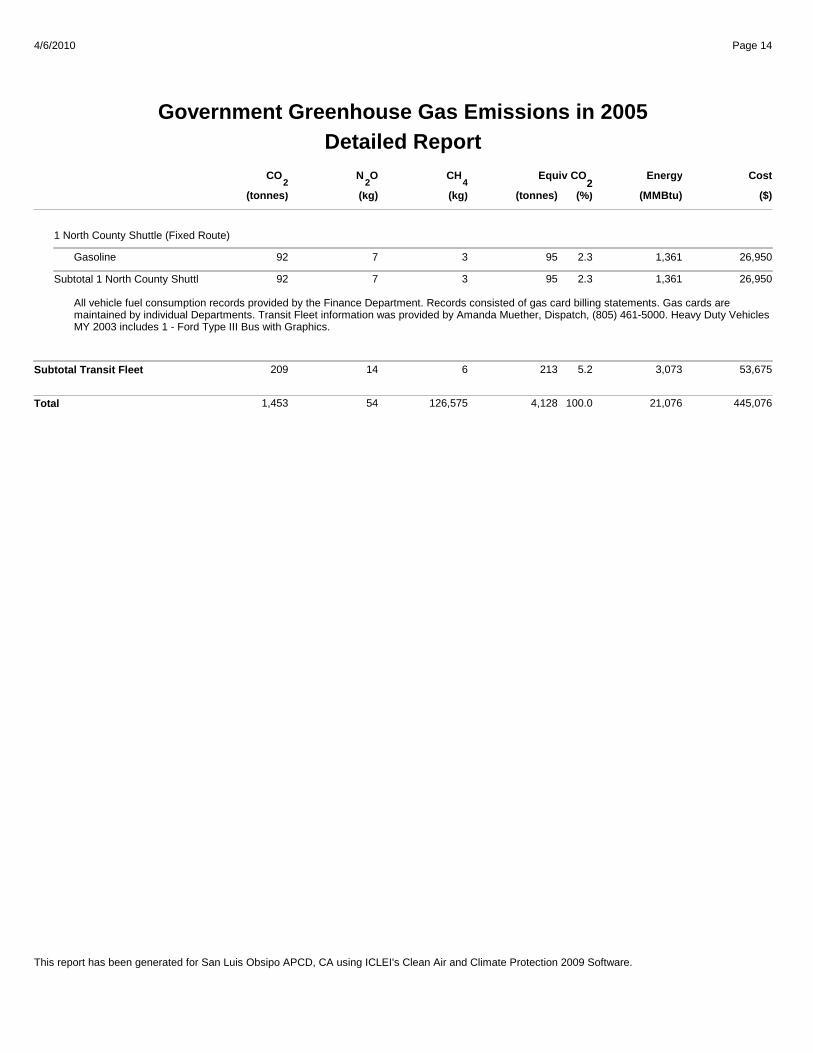
Detailed Report
Page 144/6/2010
Government Greenhouse Gas Emissions in 2005
(%)
Energy Cost
(tonnes) (MMBtu)
Equiv CO
($)2
CO
(tonnes)
N O
(kg)
CH
(kg)422
1 North County Shuttle (Fixed Route)
Gasoline 95 2.3 1,361 26,95092 7 3
95 2.3 1,361 26,950Subtotal 1 North County Shuttle (Fixed Route) 92 7 3
All vehicle fuel consumption records provided by the Finance Department. Records consisted of gas card billing statements. Gas cards are All vehicle fuel consumption records provided by the Finance Department. Records consisted of gas card billing statements. Gas cards are maintained by individual Departments. Transit Fleet information was provided by Amanda Muether, Dispatch, (805) 461-5000. Heavy Duty Vehicles All vehicle fuel consumption records provided by the Finance Department. Records consisted of gas card billing statements. Gas cards are maintained by individual Departments. Transit Fleet information was provided by Amanda Muether, Dispatch, (805) 461-5000. Heavy Duty Vehicles MY 2003 includes 1 - Ford Type III Bus with Graphics.
213 3,073 53,6755.2Subtotal Transit Fleet 209 14 6
Total 4,128 21,076 445,076100.01,453 54 126,575
This report has been generated for San Luis Obsipo APCD, CA using ICLEI's Clean Air and Climate Protection 2009 Software.
APPENDIX C:
DETAILED METHODOLOGY FOR
COMMUNITY-WIDE INVENTORY

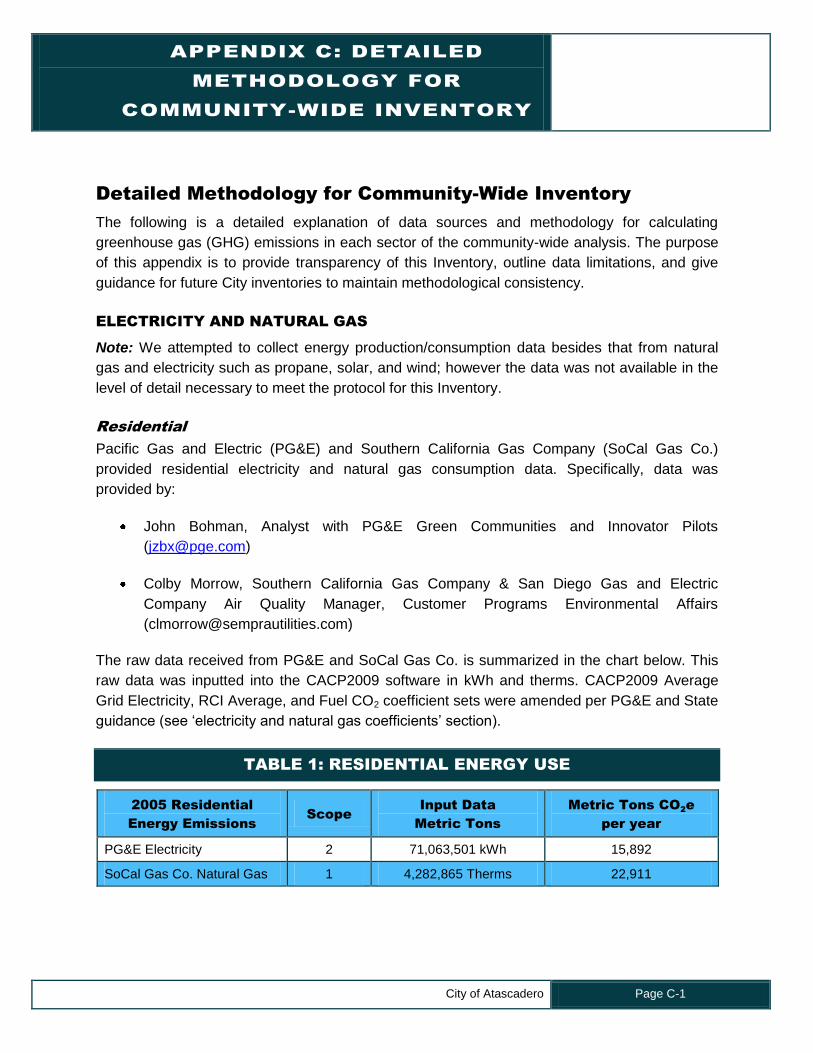
APPENDIX C: DETAILED
METHODOLOGY FOR
COMMUNITY-WIDE INVENTORY
City of Atascadero Page C-1
Detailed Methodology for Community-Wide Inventory
The following is a detailed explanation of data sources and methodology for calculating
greenhouse gas (GHG) emissions in each sector of the community-wide analysis. The purpose
of this appendix is to provide transparency of this Inventory, outline data limitations, and give
guidance for future City inventories to maintain methodological consistency.
ELECTRICITY AND NATURAL GAS
Note: We attempted to collect energy production/consumption data besides that from natural
gas and electricity such as propane, solar, and wind; however the data was not available in the
level of detail necessary to meet the protocol for this Inventory.
Residential
Pacific Gas and Electric (PG&E) and Southern California Gas Company (SoCal Gas Co.)
provided residential electricity and natural gas consumption data. Specifically, data was
provided by:
John Bohman, Analyst with PG&E Green Communities and Innovator Pilots
Colby Morrow, Southern California Gas Company & San Diego Gas and Electric
Company Air Quality Manager, Customer Programs Environmental Affairs
The raw data received from PG&E and SoCal Gas Co. is summarized in the chart below. This
raw data was inputted into the CACP2009 software in kWh and therms. CACP2009 Average
Grid Electricity, RCI Average, and Fuel CO2 coefficient sets were amended per PG&E and State
guidance (see „electricity and natural gas coefficients‟ section).
TABLE 1: RESIDENTIAL ENERGY USE
2005 Residential
Energy Emissions
Scope
Input Data
Metric Tons
Metric Tons CO2e
per year
PG&E Electricity 2 71,063,501 kWh 15,892
SoCal Gas Co. Natural Gas 1 4,282,865 Therms 22,911
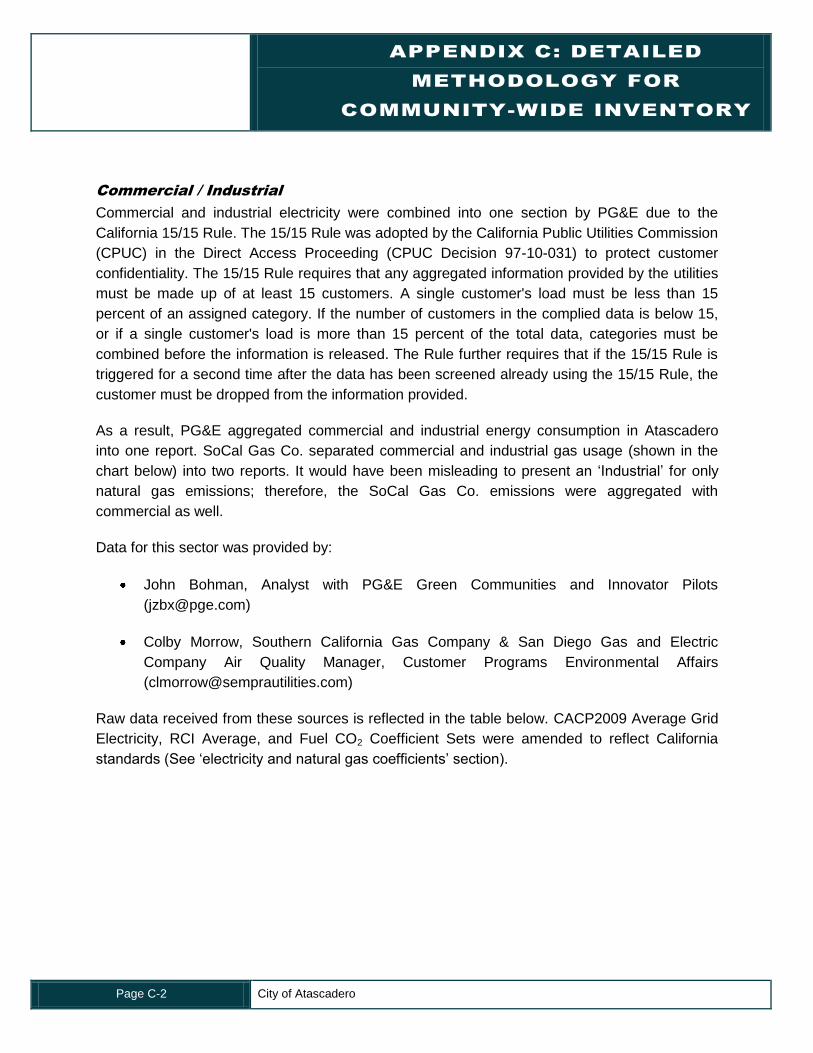
APPENDIX C: DETAILED
METHODOLOGY FOR
COMMUNITY-WIDE INVENTORY
Page C-2 City of Atascadero
Commercial / Industrial
Commercial and industrial electricity were combined into one section by PG&E due to the
California 15/15 Rule. The 15/15 Rule was adopted by the California Public Utilities Commission
(CPUC) in the Direct Access Proceeding (CPUC Decision 97-10-031) to protect customer
confidentiality. The 15/15 Rule requires that any aggregated information provided by the utilities
must be made up of at least 15 customers. A single customer's load must be less than 15
percent of an assigned category. If the number of customers in the complied data is below 15,
or if a single customer's load is more than 15 percent of the total data, categories must be
combined before the information is released. The Rule further requires that if the 15/15 Rule is
triggered for a second time after the data has been screened already using the 15/15 Rule, the
customer must be dropped from the information provided.
As a result, PG&E aggregated commercial and industrial energy consumption in Atascadero
into one report. SoCal Gas Co. separated commercial and industrial gas usage (shown in the
chart below) into two reports. It would have been misleading to present an „Industrial‟ for only
natural gas emissions; therefore, the SoCal Gas Co. emissions were aggregated with
commercial as well.
Data for this sector was provided by:
John Bohman, Analyst with PG&E Green Communities and Innovator Pilots
Colby Morrow, Southern California Gas Company & San Diego Gas and Electric
Company Air Quality Manager, Customer Programs Environmental Affairs
Raw data received from these sources is reflected in the table below. CACP2009 Average Grid
Electricity, RCI Average, and Fuel CO2 Coefficient Sets were amended to reflect California
standards (See „electricity and natural gas coefficients‟ section).
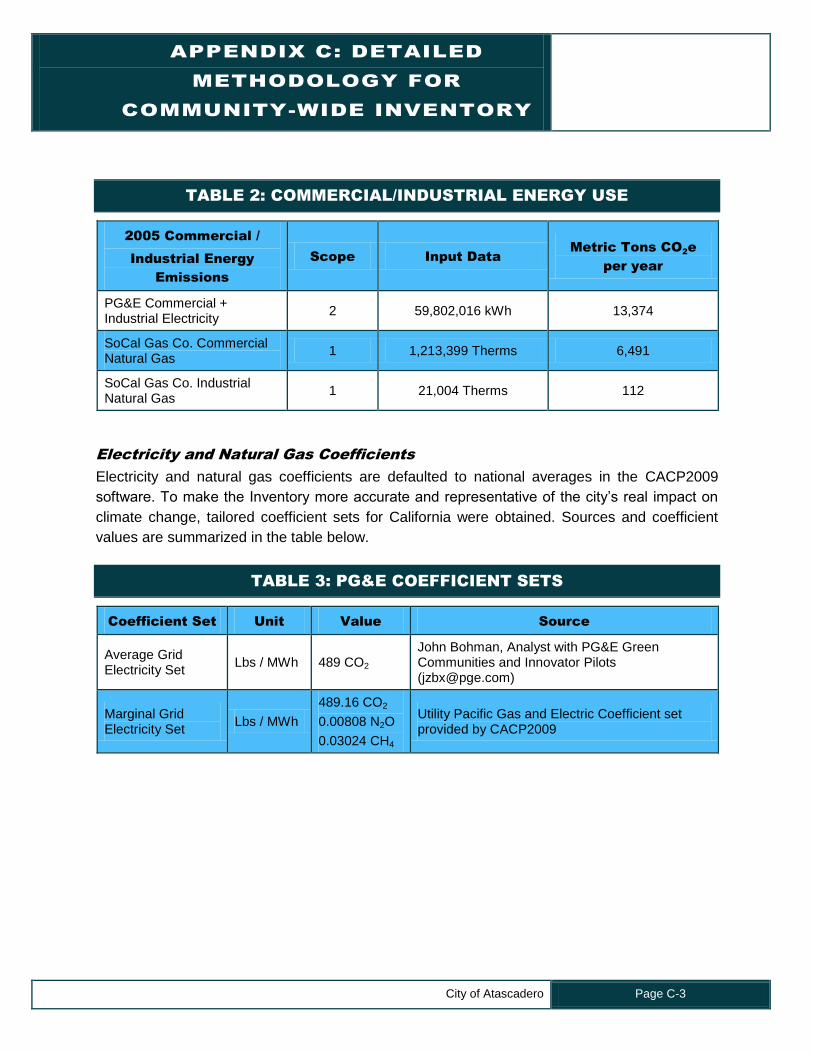
APPENDIX C: DETAILED
METHODOLOGY FOR
COMMUNITY-WIDE INVENTORY
City of Atascadero Page C-3
TABLE 2: COMMERCIAL/INDUSTRIAL ENERGY USE
2005 Commercial /
Industrial Energy
Emissions
Scope Input Data
Metric Tons CO2e
per year
PG&E Commercial + Industrial Electricity
2 59,802,016 kWh 13,374
SoCal Gas Co. Commercial Natural Gas
1 1,213,399 Therms 6,491
SoCal Gas Co. Industrial Natural Gas
1 21,004 Therms 112
Electricity and Natural Gas Coefficients
Electricity and natural gas coefficients are defaulted to national averages in the CACP2009
software. To make the Inventory more accurate and representative of the city‟s real impact on
climate change, tailored coefficient sets for California were obtained. Sources and coefficient
values are summarized in the table below.
TABLE 3: PG&E COEFFICIENT SETS
Coefficient Set Unit Value Source
Average Grid Electricity Set
Lbs / MWh 489 CO2 John Bohman, Analyst with PG&E Green Communities and Innovator Pilots ([email protected])
Marginal Grid Electricity Set
Lbs / MWh
489.16 CO2
0.00808 N2O
0.03024 CH4
Utility Pacific Gas and Electric Coefficient set provided by CACP2009
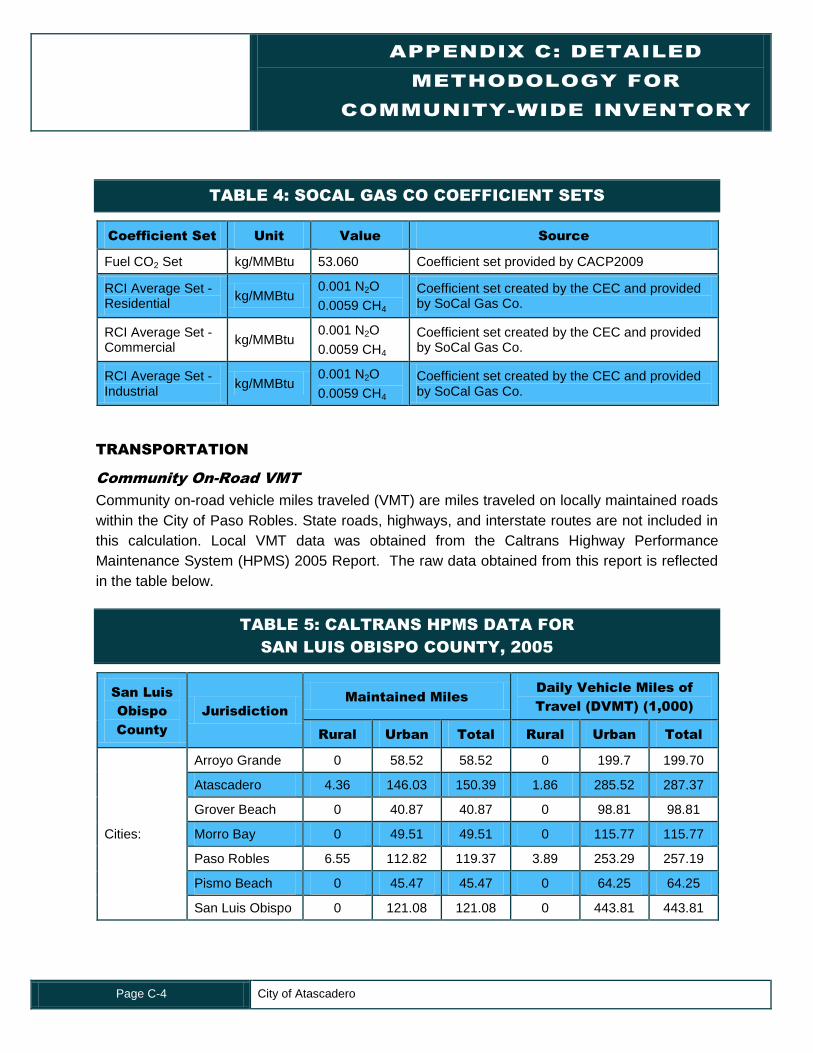
APPENDIX C: DETAILED
METHODOLOGY FOR
COMMUNITY-WIDE INVENTORY
Page C-4 City of Atascadero
TABLE 4: SOCAL GAS CO COEFFICIENT SETS
Coefficient Set Unit Value Source
Fuel CO2 Set kg/MMBtu 53.060 Coefficient set provided by CACP2009
RCI Average Set - Residential
kg/MMBtu 0.001 N2O
0.0059 CH4
Coefficient set created by the CEC and provided by SoCal Gas Co.
RCI Average Set - Commercial
kg/MMBtu 0.001 N2O
0.0059 CH4
Coefficient set created by the CEC and provided by SoCal Gas Co.
RCI Average Set - Industrial
kg/MMBtu 0.001 N2O
0.0059 CH4
Coefficient set created by the CEC and provided by SoCal Gas Co.
TRANSPORTATION
Community On-Road VMT
Community on-road vehicle miles traveled (VMT) are miles traveled on locally maintained roads
within the City of Paso Robles. State roads, highways, and interstate routes are not included in
this calculation. Local VMT data was obtained from the Caltrans Highway Performance
Maintenance System (HPMS) 2005 Report. The raw data obtained from this report is reflected
in the table below.
TABLE 5: CALTRANS HPMS DATA FOR
SAN LUIS OBISPO COUNTY, 2005
San Luis
Obispo
County
Jurisdiction
Maintained Miles
Daily Vehicle Miles of
Travel (DVMT) (1,000)
Rural Urban Total Rural Urban Total
Cities:
Arroyo Grande 0 58.52 58.52 0 199.7 199.70
Atascadero 4.36 146.03 150.39 1.86 285.52 287.37
Grover Beach 0 40.87 40.87 0 98.81 98.81
Morro Bay 0 49.51 49.51 0 115.77 115.77
Paso Robles 6.55 112.82 119.37 3.89 253.29 257.19
Pismo Beach 0 45.47 45.47 0 64.25 64.25
San Luis Obispo 0 121.08 121.08 0 443.81 443.81
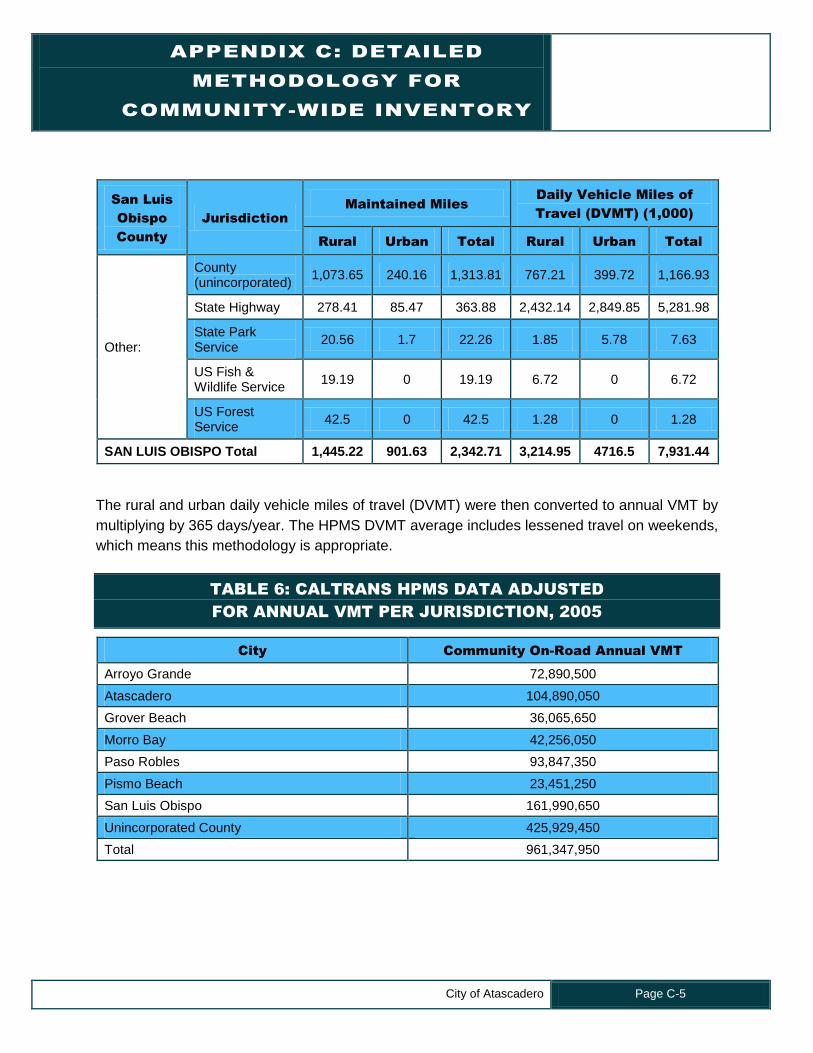
APPENDIX C: DETAILED
METHODOLOGY FOR
COMMUNITY-WIDE INVENTORY
City of Atascadero Page C-5
San Luis
Obispo
County
Jurisdiction
Maintained Miles
Daily Vehicle Miles of
Travel (DVMT) (1,000)
Rural Urban Total Rural Urban Total
Other:
County (unincorporated)
1,073.65 240.16 1,313.81 767.21 399.72 1,166.93
State Highway 278.41 85.47 363.88 2,432.14 2,849.85 5,281.98
State Park Service
20.56 1.7 22.26 1.85 5.78 7.63
US Fish & Wildlife Service
19.19 0 19.19 6.72 0 6.72
US Forest Service
42.5 0 42.5 1.28 0 1.28
SAN LUIS OBISPO Total 1,445.22 901.63 2,342.71 3,214.95 4716.5 7,931.44
The rural and urban daily vehicle miles of travel (DVMT) were then converted to annual VMT by
multiplying by 365 days/year. The HPMS DVMT average includes lessened travel on weekends,
which means this methodology is appropriate.
TABLE 6: CALTRANS HPMS DATA ADJUSTED
FOR ANNUAL VMT PER JURISDICTION, 2005
City Community On-Road Annual VMT
Arroyo Grande 72,890,500
Atascadero 104,890,050
Grover Beach 36,065,650
Morro Bay 42,256,050
Paso Robles 93,847,350
Pismo Beach 23,451,250
San Luis Obispo 161,990,650
Unincorporated County 425,929,450
Total 961,347,950
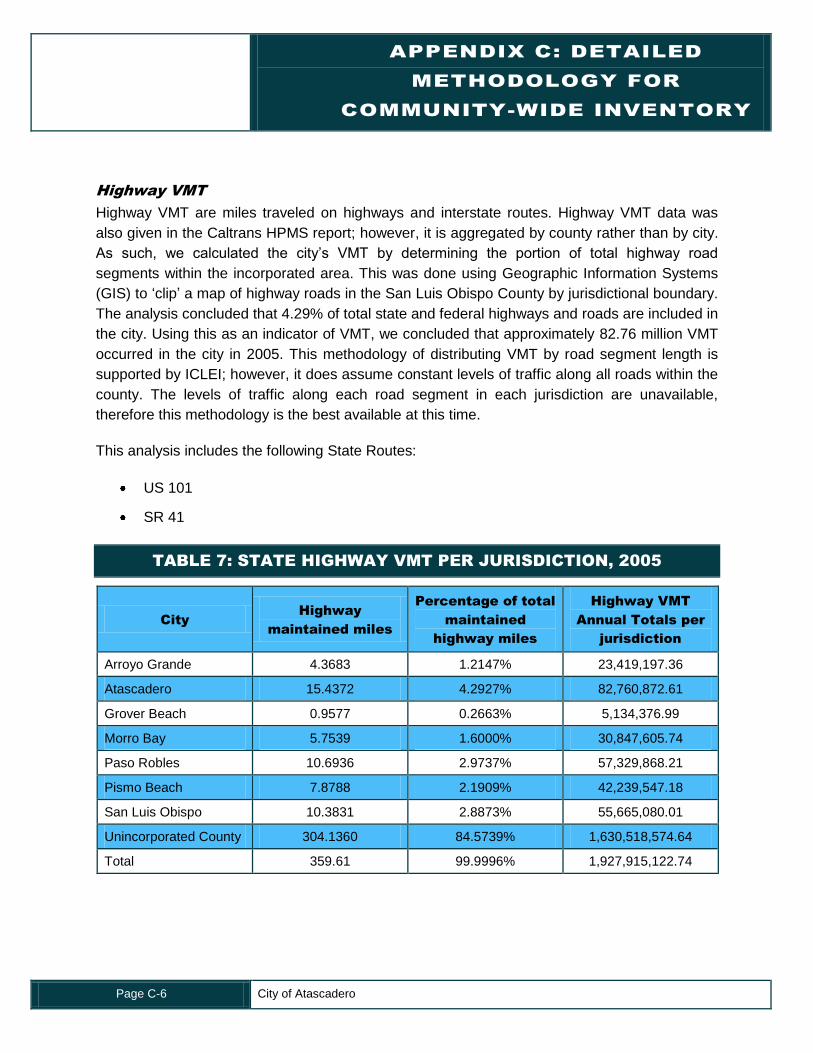
APPENDIX C: DETAILED
METHODOLOGY FOR
COMMUNITY-WIDE INVENTORY
Page C-6 City of Atascadero
Highway VMT
Highway VMT are miles traveled on highways and interstate routes. Highway VMT data was
also given in the Caltrans HPMS report; however, it is aggregated by county rather than by city.
As such, we calculated the city‟s VMT by determining the portion of total highway road
segments within the incorporated area. This was done using Geographic Information Systems
(GIS) to „clip‟ a map of highway roads in the San Luis Obispo County by jurisdictional boundary.
The analysis concluded that 4.29% of total state and federal highways and roads are included in
the city. Using this as an indicator of VMT, we concluded that approximately 82.76 million VMT
occurred in the city in 2005. This methodology of distributing VMT by road segment length is
supported by ICLEI; however, it does assume constant levels of traffic along all roads within the
county. The levels of traffic along each road segment in each jurisdiction are unavailable,
therefore this methodology is the best available at this time.
This analysis includes the following State Routes:
US 101
SR 41
TABLE 7: STATE HIGHWAY VMT PER JURISDICTION, 2005
City
Highway
maintained miles
Percentage of total
maintained
highway miles
Highway VMT
Annual Totals per
jurisdiction
Arroyo Grande 4.3683 1.2147% 23,419,197.36
Atascadero 15.4372 4.2927% 82,760,872.61
Grover Beach 0.9577 0.2663% 5,134,376.99
Morro Bay 5.7539 1.6000% 30,847,605.74
Paso Robles 10.6936 2.9737% 57,329,868.21
Pismo Beach 7.8788 2.1909% 42,239,547.18
San Luis Obispo 10.3831 2.8873% 55,665,080.01
Unincorporated County 304.1360 84.5739% 1,630,518,574.64
Total 359.61 99.9996% 1,927,915,122.74
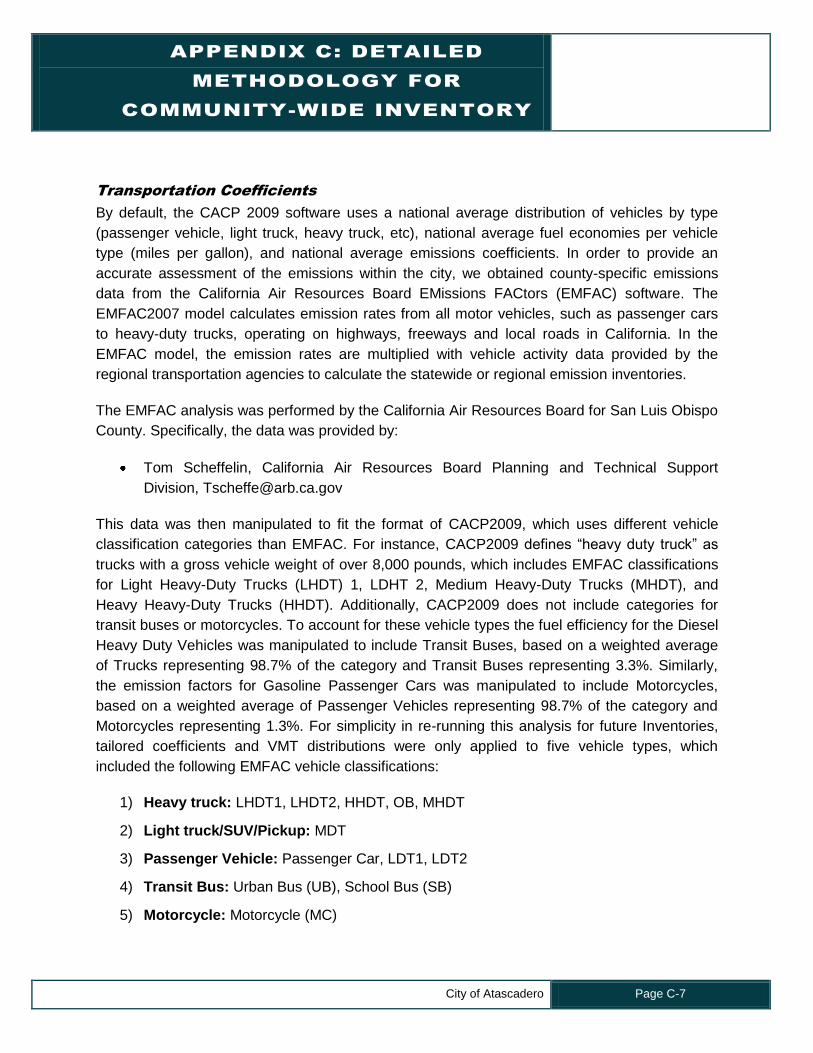
APPENDIX C: DETAILED
METHODOLOGY FOR
COMMUNITY-WIDE INVENTORY
City of Atascadero Page C-7
Transportation Coefficients
By default, the CACP 2009 software uses a national average distribution of vehicles by type
(passenger vehicle, light truck, heavy truck, etc), national average fuel economies per vehicle
type (miles per gallon), and national average emissions coefficients. In order to provide an
accurate assessment of the emissions within the city, we obtained county-specific emissions
data from the California Air Resources Board EMissions FACtors (EMFAC) software. The
EMFAC2007 model calculates emission rates from all motor vehicles, such as passenger cars
to heavy-duty trucks, operating on highways, freeways and local roads in California. In the
EMFAC model, the emission rates are multiplied with vehicle activity data provided by the
regional transportation agencies to calculate the statewide or regional emission inventories.
The EMFAC analysis was performed by the California Air Resources Board for San Luis Obispo
County. Specifically, the data was provided by:
Tom Scheffelin, California Air Resources Board Planning and Technical Support
Division, [email protected]
This data was then manipulated to fit the format of CACP2009, which uses different vehicle
classification categories than EMFAC. For instance, CACP2009 defines “heavy duty truck” as
trucks with a gross vehicle weight of over 8,000 pounds, which includes EMFAC classifications
for Light Heavy-Duty Trucks (LHDT) 1, LDHT 2, Medium Heavy-Duty Trucks (MHDT), and
Heavy Heavy-Duty Trucks (HHDT). Additionally, CACP2009 does not include categories for
transit buses or motorcycles. To account for these vehicle types the fuel efficiency for the Diesel
Heavy Duty Vehicles was manipulated to include Transit Buses, based on a weighted average
of Trucks representing 98.7% of the category and Transit Buses representing 3.3%. Similarly,
the emission factors for Gasoline Passenger Cars was manipulated to include Motorcycles,
based on a weighted average of Passenger Vehicles representing 98.7% of the category and
Motorcycles representing 1.3%. For simplicity in re-running this analysis for future Inventories,
tailored coefficients and VMT distributions were only applied to five vehicle types, which
included the following EMFAC vehicle classifications:
1) Heavy truck: LHDT1, LHDT2, HHDT, OB, MHDT
2) Light truck/SUV/Pickup: MDT
3) Passenger Vehicle: Passenger Car, LDT1, LDT2
4) Transit Bus: Urban Bus (UB), School Bus (SB)
5) Motorcycle: Motorcycle (MC)
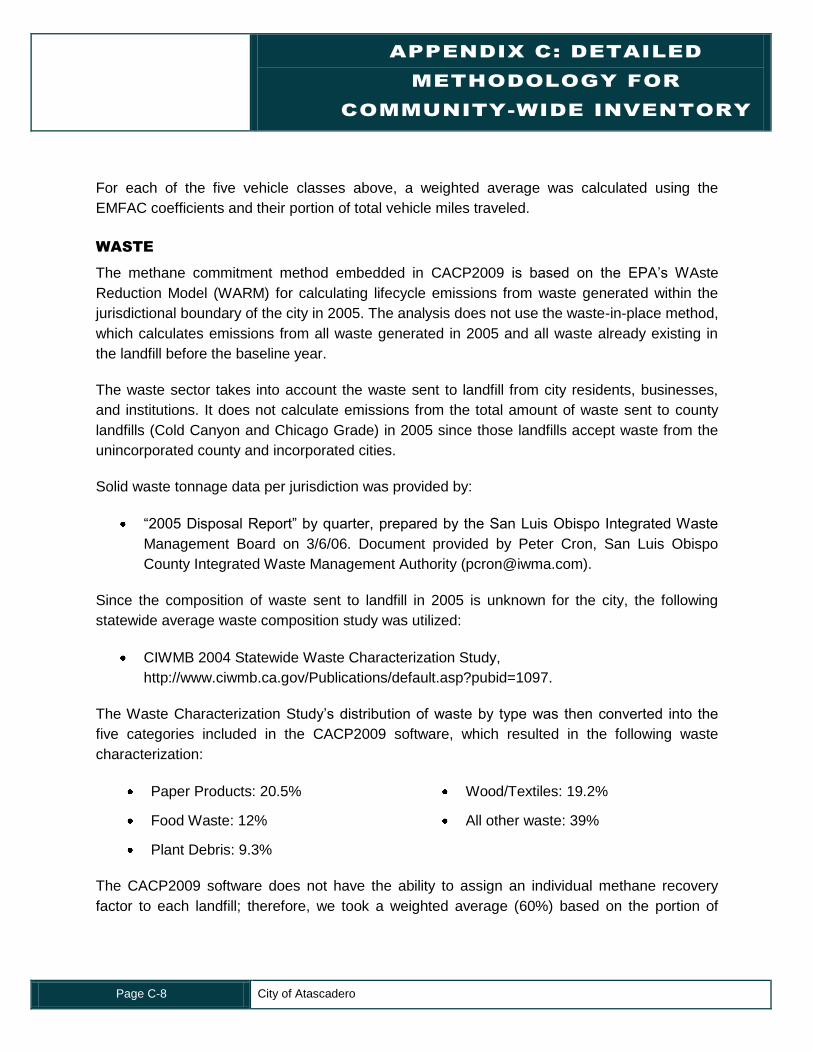
APPENDIX C: DETAILED
METHODOLOGY FOR
COMMUNITY-WIDE INVENTORY
Page C-8 City of Atascadero
For each of the five vehicle classes above, a weighted average was calculated using the
EMFAC coefficients and their portion of total vehicle miles traveled.
WASTE
The methane commitment method embedded in CACP2009 is based on the EPA‟s WAste
Reduction Model (WARM) for calculating lifecycle emissions from waste generated within the
jurisdictional boundary of the city in 2005. The analysis does not use the waste-in-place method,
which calculates emissions from all waste generated in 2005 and all waste already existing in
the landfill before the baseline year.
The waste sector takes into account the waste sent to landfill from city residents, businesses,
and institutions. It does not calculate emissions from the total amount of waste sent to county
landfills (Cold Canyon and Chicago Grade) in 2005 since those landfills accept waste from the
unincorporated county and incorporated cities.
Solid waste tonnage data per jurisdiction was provided by:
“2005 Disposal Report” by quarter, prepared by the San Luis Obispo Integrated Waste
Management Board on 3/6/06. Document provided by Peter Cron, San Luis Obispo
County Integrated Waste Management Authority ([email protected]).
Since the composition of waste sent to landfill in 2005 is unknown for the city, the following
statewide average waste composition study was utilized:
CIWMB 2004 Statewide Waste Characterization Study,
http://www.ciwmb.ca.gov/Publications/default.asp?pubid=1097.
The Waste Characterization Study‟s distribution of waste by type was then converted into the
five categories included in the CACP2009 software, which resulted in the following waste
characterization:
Paper Products: 20.5%
Food Waste: 12%
Plant Debris: 9.3%
Wood/Textiles: 19.2%
All other waste: 39%
The CACP2009 software does not have the ability to assign an individual methane recovery
factor to each landfill; therefore, we took a weighted average (60%) based on the portion of
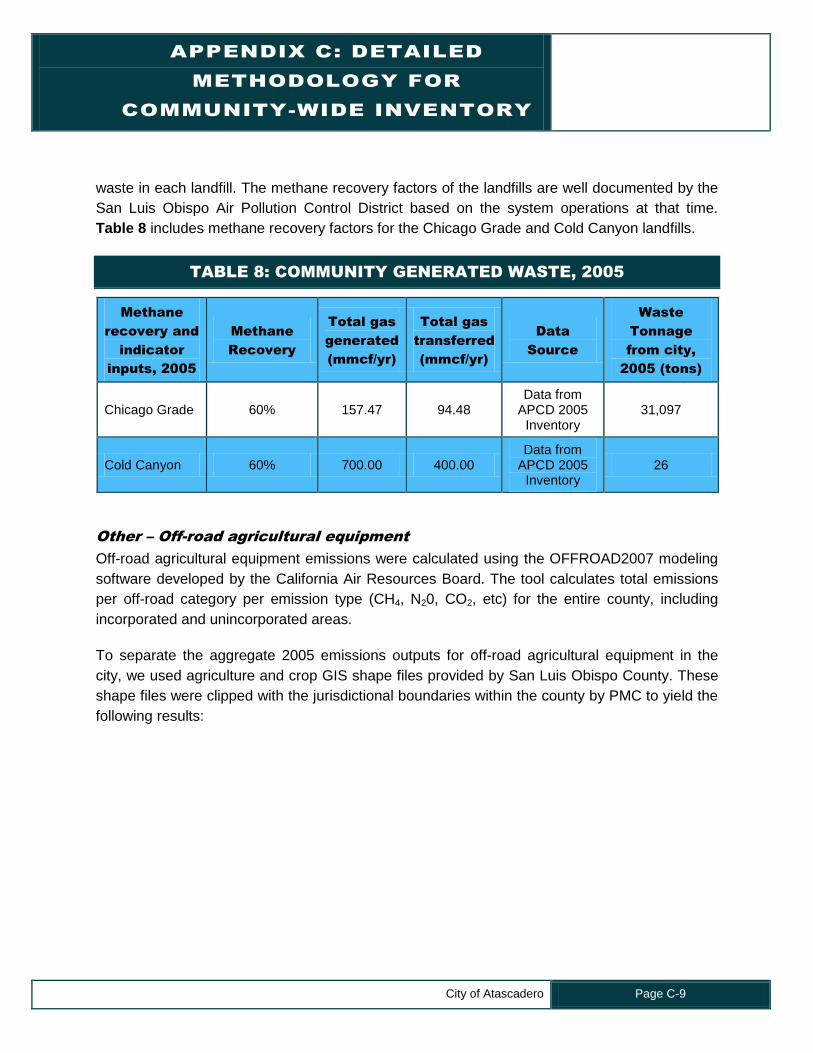
APPENDIX C: DETAILED
METHODOLOGY FOR
COMMUNITY-WIDE INVENTORY
City of Atascadero Page C-9
waste in each landfill. The methane recovery factors of the landfills are well documented by the
San Luis Obispo Air Pollution Control District based on the system operations at that time.
Table 8 includes methane recovery factors for the Chicago Grade and Cold Canyon landfills.
TABLE 8: COMMUNITY GENERATED WASTE, 2005
Methane
recovery and
indicator
inputs, 2005
Methane
Recovery
Total gas
generated
(mmcf/yr)
Total gas
transferred
(mmcf/yr)
Data
Source
Waste
Tonnage
from city,
2005 (tons)
Chicago Grade 60% 157.47 94.48 Data from
APCD 2005 Inventory
31,097
Cold Canyon 60% 700.00 400.00 Data from
APCD 2005 Inventory
26
Other – Off-road agricultural equipment
Off-road agricultural equipment emissions were calculated using the OFFROAD2007 modeling
software developed by the California Air Resources Board. The tool calculates total emissions
per off-road category per emission type (CH4, N20, CO2, etc) for the entire county, including
incorporated and unincorporated areas.
To separate the aggregate 2005 emissions outputs for off-road agricultural equipment in the
city, we used agriculture and crop GIS shape files provided by San Luis Obispo County. These
shape files were clipped with the jurisdictional boundaries within the county by PMC to yield the
following results:
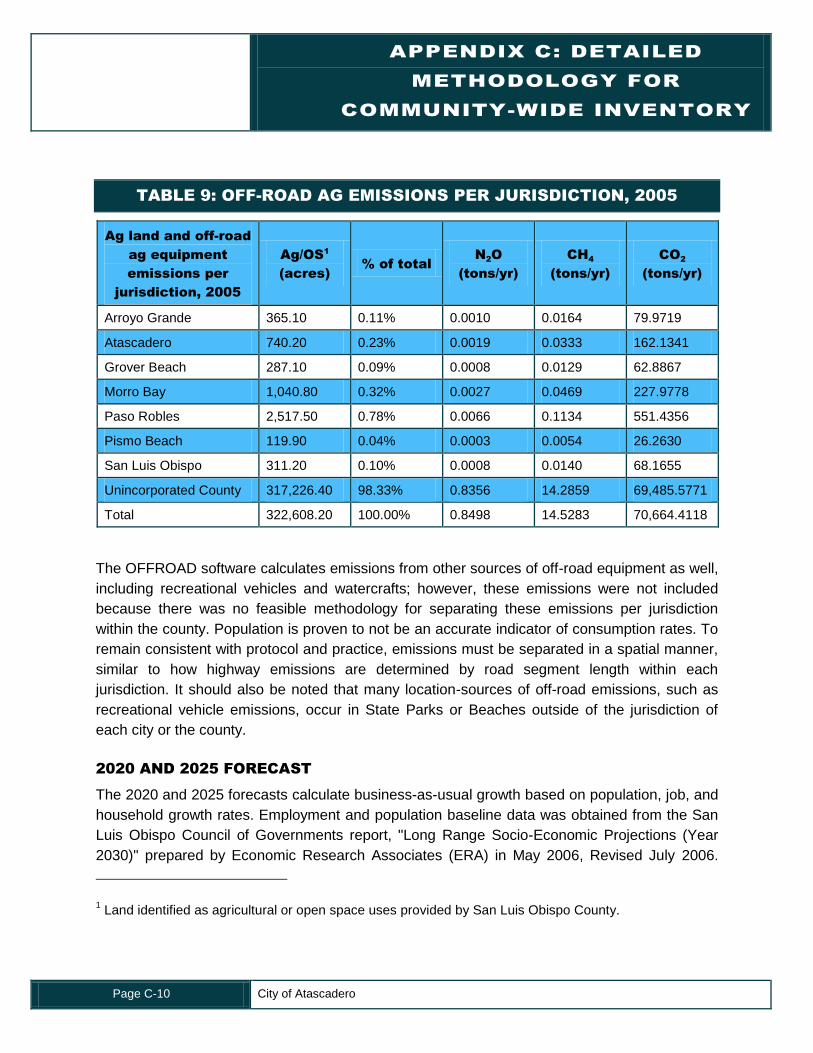
APPENDIX C: DETAILED
METHODOLOGY FOR
COMMUNITY-WIDE INVENTORY
Page C-10 City of Atascadero
TABLE 9: OFF-ROAD AG EMISSIONS PER JURISDICTION, 2005
Ag land and off-road
ag equipment
emissions per
jurisdiction, 2005
Ag/OS1
(acres)
% of total
N2O
(tons/yr)
CH4
(tons/yr)
CO2
(tons/yr)
Arroyo Grande 365.10 0.11% 0.0010 0.0164 79.9719
Atascadero 740.20 0.23% 0.0019 0.0333 162.1341
Grover Beach 287.10 0.09% 0.0008 0.0129 62.8867
Morro Bay 1,040.80 0.32% 0.0027 0.0469 227.9778
Paso Robles 2,517.50 0.78% 0.0066 0.1134 551.4356
Pismo Beach 119.90 0.04% 0.0003 0.0054 26.2630
San Luis Obispo 311.20 0.10% 0.0008 0.0140 68.1655
Unincorporated County 317,226.40 98.33% 0.8356 14.2859 69,485.5771
Total 322,608.20 100.00% 0.8498 14.5283 70,664.4118
The OFFROAD software calculates emissions from other sources of off-road equipment as well,
including recreational vehicles and watercrafts; however, these emissions were not included
because there was no feasible methodology for separating these emissions per jurisdiction
within the county. Population is proven to not be an accurate indicator of consumption rates. To
remain consistent with protocol and practice, emissions must be separated in a spatial manner,
similar to how highway emissions are determined by road segment length within each
jurisdiction. It should also be noted that many location-sources of off-road emissions, such as
recreational vehicle emissions, occur in State Parks or Beaches outside of the jurisdiction of
each city or the county.
2020 AND 2025 FORECAST
The 2020 and 2025 forecasts calculate business-as-usual growth based on population, job, and
household growth rates. Employment and population baseline data was obtained from the San
Luis Obispo Council of Governments report, "Long Range Socio-Economic Projections (Year
2030)" prepared by Economic Research Associates (ERA) in May 2006, Revised July 2006.
1 Land identified as agricultural or open space uses provided by San Luis Obispo County.
APPENDIX C: DETAILED
METHODOLOGY FOR
COMMUNITY-WIDE INVENTORY
City of Atascadero Page C-11
Employment and population projections were obtained from the May 2009 Revision. Mid-range
estimates of growth were used in both instances. It should be noted that these forecasts do not
take into consideration any planned or actual efficiency or conservation measures after 2005.
For example, the State Renewable Energy portfolio has advanced significantly since 2005, but
the forecast calculates 2020 energy emissions by assuming constant emissions factors.

APPENDIX D:
DETAILED METHODOLOGY FOR CITY
GOVERNMENT OPERATIONS INVENTORY

APPENDIX D: DETAILED
METHODOLOGY FOR
GOVERNMENT OPERATIONS
INVENTORY
City of Atascadero Page D-1
Detailed Methodology for Government Operations GHG
Emissions Inventory
The detailed methodology for government operations is much less complex than the
community-wide methodology explanation. Since the government operations GHG emissions
inventory is a facility-scale study, data records are much more reliable and consistent. In
addition, the Local Government Operations Protocol provides us a verified guide for calculating
emissions in each sector.
BUILDING
The building sector includes all emissions from natural gas and electricity consumed in City-
owned and - operated facilities. The kWh of electricity and therms of natural gas were then
entered into the CACP2009 software where they were converted to CO2e. For a complete list of
buildings included in this sector, please see the detailed CACP2009 report in Appendix B.
The building sector used the PG&E verified Average Grid Electricity Set and the CEC Emission
Factor for Natural Gas RCI Average Set, as defined in Appendix C. The analysis did not use
the PG&E natural gas coefficient for the fuel CO2 set because natural gas comes entirely from
the Southern California Gas Company.
VEHICLE FLEET
The vehicle fleet sector includes gasoline and diesel vehicles from the following City
departments:
Community Development
Community Services
Fire
Police
Public Works
Gasoline and diesel consumption for calendar year 2005 was obtained from fuel billing
statements provided by the Finance Department. The Police Department provided their own fuel
usage data as there record keeping was more complete. Specific sources of data within each
organization are outlined in the notes of Appendix B.
APPENDIX D: DETAILED
METHODOLOGY FOR
GOVERNMENT OPERATIONS
INVENTORY
Page D-2 City of Atascadero
For the vehicle fleet, we used the County EMFAC coefficients for gasoline and diesel described
in Appendix C. These are weighted averages per multiple vehicle types in San Luis Obispo
County.
EMPLOYEE COMMUTE
Employees were surveyed in June 2009 using an online survey instrument. The questions,
attached as Appendix E, asked employees about their current commuting patterns. Of those
questions, we used the following for our analysis:
What is your approximate one-way distance to work (in miles)? Please indicate the most
direct distance to work, discounting midway destinations that would be taken whether or
not you drove to work each day (i.e. dropping off children at school).
Please indicate the type of transportation you take to work each day in your average
work week. Please note that there are two types of carpooling.
Drive alone
Carpool with fellow City
employees
Carpool with drivers not
employed by the City
Vanpool
Public transit
Motorcycle
Bicycle
Walk
Telecommute
Other
What type of vehicle do you drive?
What type of fuel does your vehicle use?
If you carpool with fellow City employees, how many City employees ride with you? If
you carpool with a different number each day, please indicate the average.
Approximately 69 employees responded to the survey with usable information, meaning that all
essential questions were answered. Answers with mileage left blank or with highly inconsistent
data (ex: saying they walked three days to work, biked two, and drove five) were omitted. In
APPENDIX D: DETAILED
METHODOLOGY FOR
GOVERNMENT OPERATIONS
INVENTORY
Page D-2 City of Atascadero
addition, if a respondent did not describe their „other‟ category of transportation, the entry was
omitted.
To perform this analysis, we took the following steps:
1) Separate entries by what type of vehicle they own and operate (compact, midsize car,
full-size car, small truck, medium-small truck, large truck, motorcycle or “don‟t drive”).
Within each new group, separate the entries by diesel, gasoline or hybrid.
2) For each group of entries with the same vehicle type and technology, multiply the
number of miles to work by 2 (to get round-trip estimate) and then by the number of
„drive alone‟ days for each entry. Multiply the number of miles to work by the number of
„carpool‟ days (half of the „drive alone‟ emissions). Note: If a respondent entered that
they motorcycle to work, but own a car as well, the motorcycle miles were moved to the
motorcycle category). Adjust for hybrids (see below).
3) Add all miles per vehicle type and technology and multiply by 52.18 work weeks/year.
4) Calculate the multiplier to adjust survey response data to the entire 2005 employee
population. In 2005, there were 128 employees. This, divided by the 69 survey entries,
gives us our multiplier of 1.74.
5) Multiply the mileage per vehicle per technology type by the multiplier.
6) Divide the number of hybrid miles by three and add the difference to the „passenger car‟
category. This is to account for the large increase in hybrid sales between 2005 and
2009 (Source: Hybridcars.com sales statistics).
7) Manipulate the vehicle classes to fit the CACP2009 software categories.
8) Enter final miles into the CACP2009 software per vehicle type and fuel.
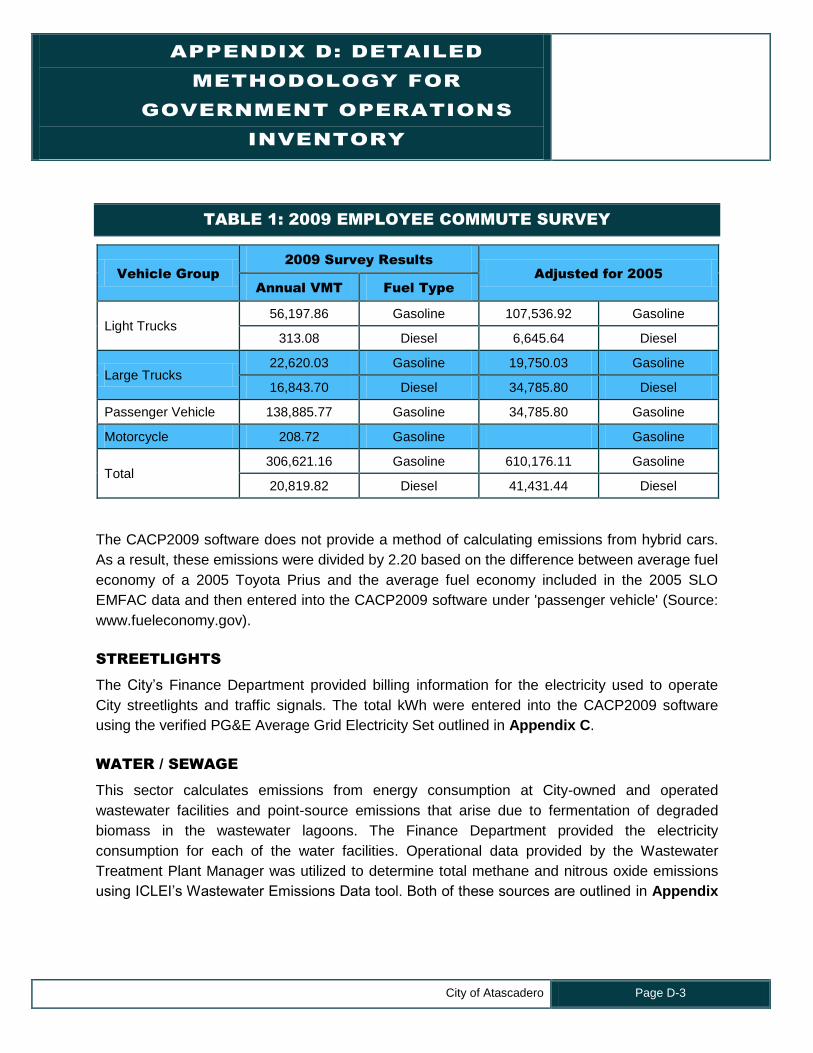
APPENDIX D: DETAILED
METHODOLOGY FOR
GOVERNMENT OPERATIONS
INVENTORY
City of Atascadero Page D-3
TABLE 1: 2009 EMPLOYEE COMMUTE SURVEY
Vehicle Group
2009 Survey Results
Adjusted for 2005
Annual VMT Fuel Type
Light Trucks 56,197.86 Gasoline 107,536.92 Gasoline
313.08 Diesel 6,645.64 Diesel
Large Trucks 22,620.03 Gasoline 19,750.03 Gasoline
16,843.70 Diesel 34,785.80 Diesel
Passenger Vehicle 138,885.77 Gasoline 34,785.80 Gasoline
Motorcycle 208.72 Gasoline Gasoline
Total 306,621.16 Gasoline 610,176.11 Gasoline
20,819.82 Diesel 41,431.44 Diesel
The CACP2009 software does not provide a method of calculating emissions from hybrid cars.
As a result, these emissions were divided by 2.20 based on the difference between average fuel
economy of a 2005 Toyota Prius and the average fuel economy included in the 2005 SLO
EMFAC data and then entered into the CACP2009 software under 'passenger vehicle' (Source:
www.fueleconomy.gov).
STREETLIGHTS
The City‟s Finance Department provided billing information for the electricity used to operate
City streetlights and traffic signals. The total kWh were entered into the CACP2009 software
using the verified PG&E Average Grid Electricity Set outlined in Appendix C.
WATER / SEWAGE
This sector calculates emissions from energy consumption at City-owned and operated
wastewater facilities and point-source emissions that arise due to fermentation of degraded
biomass in the wastewater lagoons. The Finance Department provided the electricity
consumption for each of the water facilities. Operational data provided by the Wastewater
Treatment Plant Manager was utilized to determine total methane and nitrous oxide emissions
using ICLEI‟s Wastewater Emissions Data tool. Both of these sources are outlined in Appendix
APPENDIX D: DETAILED
METHODOLOGY FOR
GOVERNMENT OPERATIONS
INVENTORY
Page D-4 City of Atascadero
B. These totals were entered into the CACP2009 software with the PG&E Average Grid
Electricity Set outlined in Appendix C.
WASTE
Atascadero Waste Alternatives reported solid waste tonnage produced by City operations. The
City produced 168.65 tons of waste in 2005 that was sent to managed landfill. The waste
composition was unknown for the city; therefore, the California averages provided by the 2004
California Integrated Waste Management Board Waste Characterization Report were used. A
weighted average methane recovery factor of 60% was used in this analysis, as outlined in
Appendix C.

APPENDIX E:
CITY EMPLOYEE COMMUTE SURVEY, 2009

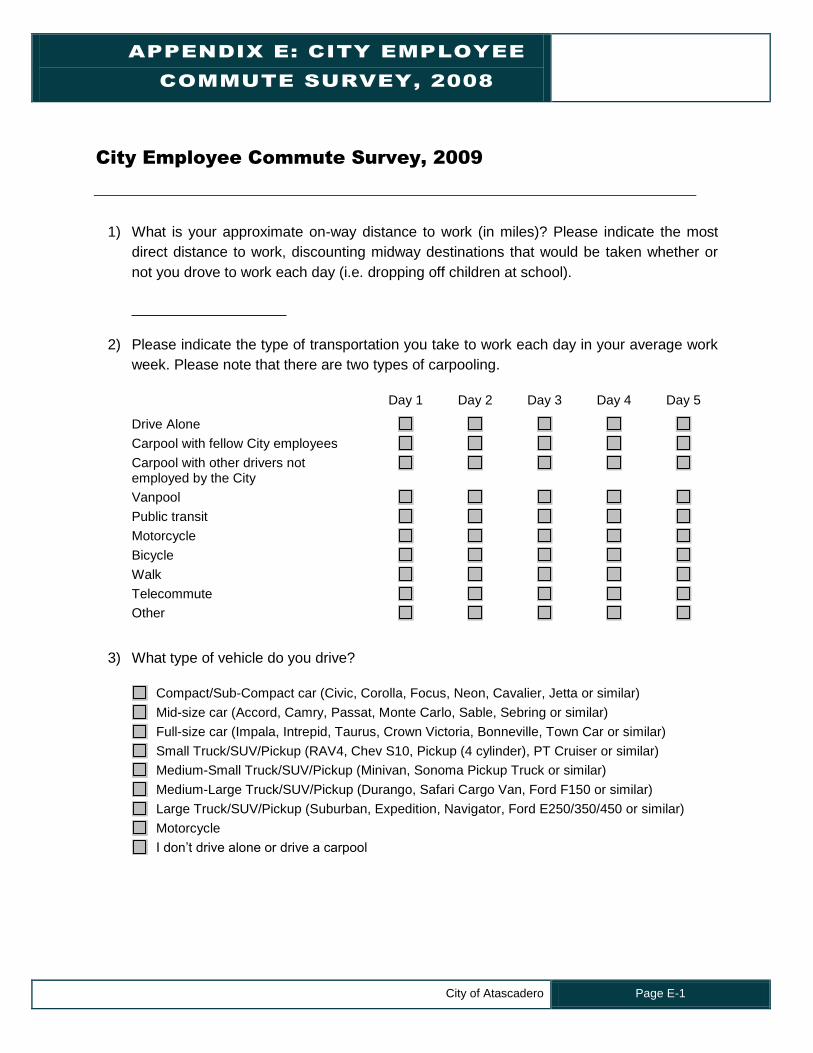
APPENDIX E: CITY EMPLOYEE
COMMUTE SURVEY, 2008
City of Atascadero Page E-1
City Employee Commute Survey, 2009
1) What is your approximate on-way distance to work (in miles)? Please indicate the most
direct distance to work, discounting midway destinations that would be taken whether or
not you drove to work each day (i.e. dropping off children at school).
___________________
2) Please indicate the type of transportation you take to work each day in your average work
week. Please note that there are two types of carpooling.
Day 1 Day 2 Day 3 Day 4 Day 5
Drive Alone
Carpool with fellow City employees
Carpool with other drivers not employed by the City
Vanpool
Public transit
Motorcycle
Bicycle
Walk
Telecommute
Other
3) What type of vehicle do you drive?
Compact/Sub-Compact car (Civic, Corolla, Focus, Neon, Cavalier, Jetta or similar)
Mid-size car (Accord, Camry, Passat, Monte Carlo, Sable, Sebring or similar)
Full-size car (Impala, Intrepid, Taurus, Crown Victoria, Bonneville, Town Car or similar)
Small Truck/SUV/Pickup (RAV4, Chev S10, Pickup (4 cylinder), PT Cruiser or similar)
Medium-Small Truck/SUV/Pickup (Minivan, Sonoma Pickup Truck or similar)
Medium-Large Truck/SUV/Pickup (Durango, Safari Cargo Van, Ford F150 or similar)
Large Truck/SUV/Pickup (Suburban, Expedition, Navigator, Ford E250/350/450 or similar)
Motorcycle
I don‟t drive alone or drive a carpool

APPENDIX E: CITY EMPLOYEE
COMMUTE SURVEY, 2008
Page E-2 City of Atascadero
4) What type of fuel does your vehicle from question 3 use?
Gasoline
Diesel
Biodiesel
Hybrid
Electric
I don‟t drive to work or drive a carpool
Other (Specify): ___________________________________
5) If you carpool or vanpool with fellow City employees, home may City employees ride with you? If
you carpool with a different number each day, please indicate the average. If „not applicable‟,
please enter “0”.
Enter # of people: ___________________________________