Embed Size (px)
Citation preview

City of Hallandale Compressed Natural Gas (CNG) Filling Station & Fleet Conversion Market Guidance Findings
Lambert Advisory (Lambert) has completed its research associated with the development of a CNG filling station on a 2.74 acre City of Hallandale Beach (City) owned property along Ansin Boulevard. The site just east of Interstate 95, with appropriate signage, will be able to enjoy good visibility from the Interstate. This memorandum highlights our findings.
Summary
Lambert researched trends in the CNG market and conducted a variety of interviews with relevant industry officials covering:
• Current Industry Trends • Public Sector Efforts • Private Sector Efforts • Other Considerations
Our research has indicated the following:
• Many of the largest public and private fleet owners of localized fleets (large municipalities, intra-city express package delivery vehicles, trash haulers) throughout Florida and the United States are converting their fleets to CNG given that to obtain the same equivalent performance of a gallon of gasoline or diesel (Gas Gallon Equivalent – GGE), CNG is approximately 50% of the cost. Given the prevalence of natural gas domestically, this ratio is expected to hold for some time into the future. Additionally, CNG produces less carbon admissions and is expected to reduce vehicle maintenance over the long term;
• Larger inter-city fleets of long haul trucks are also beginning to convert their fleets to natural gas as well given the potential savings, but these trucks require Liquid Natural Gas (LNG) rather than CNG for a variety of technical reasons. These trucks are principally 18-wheeler trucks which utilize the nation’s highway system. Despite the potential savings, the conversion of these vehicles to LNG has principally been slowed due to the lack of refilling infrastructure in cities and along the interstate system;
• The capital costs associated with CNG filling stations is approximately $250,000 per rapid filling station with a minimum of eight filling stations given the need to spread common infrastructure and equipment cost. The minimum economically efficient CNG filling station is approximately $2.0 million to development net of the cost of land. LNG filling stations, given that LNG requires major cooling infrastructure is approximately double that of CNG for an equivalent number of hookups;

Hallandale Beach CNG Economic Assessment
July 2013 • In addition to cost of the fueling station, there is also a cost of converting a fleet to CNG
from gasoline or diesel. This cost is substantial. For example, sanitation trucks cost approximately $65,000 per vehicle to covert and the cost per vehicle for a new truck is $40,000 to $50,000 per vehicle higher for CNG than for gas or diesel. Additionally, the cost of converting or expanding maintenance facilities needs to be accounted for as well;
• Given a reasonable understanding of the cost of building the CNG infrastructure and
converting an existing fleet or purchasing a new fleet, the metric for cost recovery through savings from utilizing natural gas over gasoline or diesel is a reasonably straight forward calculation. To recover the capital cost of infrastructure and conversion in approximately 5 years, a fleet of 70 vehicles which drive 40,000 plus miles a year would have to be converted (Appendix A – Conversion Analysis). While Hallandale Beach meets the threshold in fleet size, the small size of the municipality means that it never comes close to meeting the mileage threshold;
• Given the rapidly changing natural gas market, expansion of infrastructure throughout
the United States and substantially longer than five year time frame to recover the cost of investment we do not recommend the City develop a facility for its own purposes exclusively. Likewise, we have interviewed a number of municipalities which have developed CNG facilities and have accommodated the utilization of private fleets but this business has turned out to be a modest part of the utilization of most of these facilities given that the fleets need to be utilized principally within a seven to ten mile radius of the refueling facility so that to-and-from drive time in minimized;
• While the time frame to recover the City’s infrastructure investment given the relative
miles per year its fleet travels may be too long to comfortably project, given the strong location and visibility of the Ansin Boulevard site and the economic and environmental benefits of converting a fleet to CNG we do recommend that the City issue a solicitation to identify a private development/fleet partner who would make the required investment in the refueling facility in return for a long term agreement with the City to purchase fuel from the facility at preferred rates. Likewise, the City should explore the potential of concurrently allowing the investor the rights to develop a LNG fueling station in addition to the CNG station on site to capture the soon to be expanding I-95 truck traffic which will run on LNG fuel;
• As it relates to issuing the solicitation, we strongly recommend two other elements.
First, the City needs to move very quickly given that the market appears to be changing and expanding so rapidly that there is likely to be increased competition from other municipalities and strong sites in the near future to establish large refueling stations. Second, the City should strongly consider taking any value of its land through a long term reduction in CNG cost rather than any participation in revenue from the land lease
2

Hallandale Beach CNG Economic Assessment
July 2013
given the rapidly changing nature of the industry. This would take a form of a fixed percent below the best customer rate and concurrently benchmarked against the regional or national CNG gas gallon equivalent retail cost.
Current Industry Trends
Beyond the documented environmental benefits of burning cleaner natural gas in local truck fleets, conversion programs began growing at an accelerated rate in in 2008 as the average price of gasoline reached $4.00 a gallon and have generally hovered between $3.00 and $4.00 since then. Diesel fuel prices typically are 15 to 20 percent higher than unleaded gasoline.
CNG prices can range from 30 to 60 percent lower than diesel fuel price per Gas Gallon Equivalent (GGE), which is broadly defined as the amount of natural gas required to drive the same number of miles under the same operating conditions as diesel. Savings have averaged 50 percent over the past several years.
The growing gap between diesel fuel and CNG has facilitated increased efforts by units of government as well as private sector industries to convert vehicles to CNG or LNG, especially those with truck fleets that use diesel fuel (typically Class 6, 7 and 8 trucks).
Public Sector Efforts
Up until the present, California, Texas, Arizona, Louisiana and Michigan have maintained the most aggressive public sector CNG conversion programs. Besides the environmental benefits and the savings from eventual payback of conversion these states have extensive natural gas pipeline infrastructure.
Florida is beginning to make in-roads, but biggest issue in Florida is infrastructure – most notably, lack pipeline infrastructure to provide supply, which is more cost effective then providing supply by tanker truck.
However, Hallandale Beach would not be the first unit of government in the State to covert its fleet to natural gas. Public sectors conversion programs among units of government in Florida to date include:
In 2012, the City of Clearwater Solid Waste Department, in partnership with Clearwater Gas System (owned by the City) built the first CNG facility in the Tampa Bay area. The facility cost $2.0 million and eight pumps/hoses on two islands (four per island). The City has a fleet of 70 solid waste trucks that will be replaced with new trucks designed to run on CNG. The replacement program will take 6-7 years at a cost of $200,000 per truck. The City chose the replacement option over conversion of the existing fleet, which would have cost $65,000 per truck on an older fleet of trucks since many of the trucks in the City’s fleet were going to require
3

Hallandale Beach CNG Economic Assessment
July 2013
replacement in the near future in any event. Since the opening of the facility, the City has entered into contracts with Verizon to provide CNG to 13 of their service vans locally, and two waste/recycling trucks owned by a local private company. The City estimates that over the long term, 80% of demand will be for City Solid Waste Trucks and 20% for other users, with a 7+-year payback. They plan to open the facility to the public in the next year. Current price for CNG at the facility is $2.05/gallon.
Energy Services of Pensacola (ESP, which is owned by the City of Pensacola), in partnership with the Emerald Coast Utilities Authority (ECUA), opened the panhandle’s first CNG facility in November 2012. The facility cost $1.8 million. As part of the effort, the City of Pensacola and ECUA agreed to transition their vehicle fleets to CNG. ECUA plans to ultimately convert 275 vehicles over the next 10 years. ECUA expects savings of $250,000 per year in maintenance costs and $1.0 million a year in fuel costs. Under the terms of the agreement, ECUA will pay ESP a monthly transportation charge as well as an indexed price per diesel gallon equivalent of CNG fuel used by ECUA vehicles. Two other stations are planned for the Pensacola area, including one in Gulf Breeze. Current price for CNG at the facility is $2.05/gallon
Hillsborough County Aviation Authority (Tampa International Airport) opened a CNG facility in March of 2012. The Authority plans to convert 83 its 115 vehicle fleet to CNG within the next ten years. The Authority anticipates fuel cost savings of $1.0 million over the first five years and payback on investment over the same time period. The facility was built by Clean Energy Fuels (T. Boone Pickens) (costs were not reported). Through an agreement with the Aviation Authority, Clean Energy will also operate and maintain a “turnkey” facility at the airport for a term of 20 years and pay the Authority rent as well as royalties on CNG sales. TECO People’s Gas will supply the natural gas pipelined to the facility. The facility is open to the public. Current price for CNG at the facility is $2.34/gallon
City of Milton, in cooperation with Natural Gas of Milton, opened a public access CNG fueling station in January 2103. Funds for the facility were provided through a federal grant. Current price for CNG at the facility is $1.98/gallon.
Other units of government in Florida have already made the conversion or are planning CNG conversion programs for vehicle fleets. A number of these agencies reportedly have received grants through the Florida Energy Office of Department of Community Affairs. These include:
Miami-Dade Aviation Authority
Palm Beach County
Broward County, which reportedly has three CNG fueling stations including: Commercial Blvd Station, SW 4th Avenue Station and Andrews Avenue Station.
4
Hallandale Beach CNG Economic Assessment
July 2013 Palm Beach Gardens
City of North Miami
City of Deerfield Beach
City of Sunrise
City of Leesburg
Sarasota County Sheriff’s Department
Private Sector CNG Efforts
Heavily driven by economics and with a secondary benefit of enhancing their green credentials, waste management companies are one of the leading industries converting fleets of Class 7 and 8 trucks from diesel fuel to CNG.
Waste Management Inc., based in Houston, with operations throughout North America, has a fleet of 17,000 Class 8 truck vehicles. Currently, 1,400 have been converted to CNG. Waste Management plans to convert all 17,000 over the next 5 years. They have also developed 28 CNG fueling stations in North America, with plans to have 50 stations by the end of 2012 or early in 2013.
Existing or planned facilities by Waste Management of Florida Inc., as well as other waste management companies in Florida include:
Waste Management Inc., of Florida opened a CNG fueling station in Pompano Beach The “Clean N’ Green” station opened in November 2012. The station will serve its fleet of 75 trucks at the Pompano Beach facility and be open to units of government and commercial fleets. The CNG trucks service Cooper City, Coral Springs, Dania Beach, Davie, Lauderdale Lakes, Lighthouse Point, Margate, Parkland, Plantation, Pompano Beach, Tamarac, Wilton Manor and unincorporated Broward County. ET Environmental built the facility, which was funded by Waste Management. The cost of development is not available however the current price for CNG at the facility is $2.20/gallon.
Waste Management also has a slow fill CNG facility in Sarasota and plans to open two other two other facilities in Palm Beach County and Tampa Bay in 2013.
In 2009, Choice Environmental Services (Choice), a provider of solid waste and recycling services to south Florida communities, became one of the first waste management companies in Florida to convert a portion of their fleet of trucks to CNG. In late October of 2009, Choice also opened a CNG refuse truck fueling station,
5

Hallandale Beach CNG Economic Assessment
July 2013
in Pompano Beach, which was designed, built and is being operated by Clean Energy Fuels Corp. Natural gas is supplied by TECO People’s Gas.
Waste Pro has partnered with Clean Energy Fuels to build and operate a “multi-million dollar” CNG facility in Fort Pierce, Florida. Waste Pro plans to convert 150 of its truck fleet to CNG. Waste Pro operates in 115 communities with plans to open additional facilities throughout the south, including Florida.
JJ Taylor Companies of Tampa (a beer distributor) is replacing it 95-unit fleet running on diesel fuel to CNG. As of the program they also plan to build a CNG fueling station for their operations in Tampa and Ft. Myers.
There are also several companies with semi/tractor trailer truck fleets which are implementing pilot programs to test the effectiveness of converting to Liquid Natural Gas (LNG) given that these long haul vehicles cannot yet run on CNG. Some examples include:
Wal-Mart;
UPS;
Staples;
Tyson Chicken;
Con-way Freight; and,
Ryder
Companies with large Class 8 truck fleets (tractor trailers) which require LNG fuel have been proceeding more cautiously about implementing a comprehensive conversion program than their local and governmental fleet counterparts. The principal reasons are as follows:
The cost of a new truck running on CNG cost $35,000+ more than a truck running on diesel fuel, while the cost of a new truck running on LNG cost $65,000 more than a truck running on diesel fuel. Alternatively, it costs anywhere from $5,000 to $80,000 to convert existing trucks running on diesel fuel to CNG or LNG;
Uncertainty over the cost to maintain a truck running on LNG; and,
Lack of fueling stations which is especially the case in Florida at this point.
As it relates to the lack of fueling stations, substantial change appears to be on the way. Clean Energy Fuels Corporation was in the process of building 70 LNG stations in 2012 and is planning to open another 80 stations in 2013. They are building these stations along some of the busiest truck routes in the United States, about 250 to 300 miles apart so that trucks running on LNG can be fueled easily. Clean Energy is working with Flying J and Pilot to add LNG pumps at existing truck stops throughout the country. Given the strong location with
6
Hallandale Beach CNG Economic Assessment
July 2013 potential sign visibility from I-95 of the Ansin Boulevard site, designing the facility to accommodate LNG “pumps” to complement the CNG filling station may be wise. If a growing number of intercity vehicles are converted to LNG, the site may be well positioned to capture I-95 truck traffic.
Finally, there is a growing market niche for passenger cars running CNG. Honda is the market leader in the small market niche for passenger cars. Other manufacturers that offer a CNG option include:
Ford
BMW
Volvo
Mercedes
Volkswagen
Chevrolet – Cavalier model
This market will continue to grow, and making sure that facilities are open to the public will only further support the move to cleaner natural gas for vehicular fuel and broaden the revenue potential of the facility. However, as natural gas becomes ubiquitous, existing filling stations will seek to add CNG filling capacity and the prime locations along Hallandale Beach Boulevard will become competitors for auto refilling. Trucks will be the principal source of business for the facility over the long term.
Other Considerations
Currently, there are two types of CNG fuel systems available: dedicated vehicles or conversions that run solely on CNG and normally have a fuel capacity equal to or larger than the original gasoline or diesel tank and bi-fuel vehicles that have the ability to run on either CNG or gasoline/diesel. These bi-fuel vehicles typically retain their original gasoline/diesel tank and are retrofitted with an additional, smaller-capacity CNG tank. While it is beyond the scope of our analysis to determine which better meets the City’s need, the amount of fuel utilization and infrastructure investment will depend upon which system is chosen.
Based upon our interviews the cost to build a facility is a minimum of $1.0+ to $2.0million for a CNG facility ($250,000+ per pump/hose) and $3.0 to $4.0 million for LNG facilities given the additional cooling equipment required. One of the reasons why multiple pumps or hoses are needed is the desire to maintain “quick fill”, however all quick fill CNG equipment systems need recovery time—i.e., adequate time for the ground storage tanks to be recharged (refilled) with CNG after customer vehicles have been fueled. Such recovery time is not needed in slow-fill CNG systems, where the compressor fills the vehicle directly
7
Hallandale Beach CNG Economic Assessment
July 2013 from the compressor with no ground storage tanks. Slow-fill systems take much longer to fuel a vehicle than quck-fill systems. Slow fill is generally eight to 12 hours versus quick fill which is approxmately four minutes. However, due to the needed recovery time, more quick fill stations are required than would be the case with slow fill.
There are also a series of other operating system cost considerations which need to be accounted for when determining the desirability of converting to CNG which we identified in our assessment and interviews:
• Determining the adequate size and type of compressor systems has been noted as a critical item. Undersized systems can lead to significantly higher operating and maintenance costs; oversized means higher up front costs than is warranted;
• Size and type of storage tanks needs to be carefully considered; • CNG product conditioning systems (e.g., driers) are a key and costly project element; • Control systems vary broadly from supplier to supplier; and, • Acquisition, operation and maintenance costs of the facility and the fleet over the
long term need to be taken into account in any assessment.
Finally, the biggest pipeline supplier of natural gas in Florida is TECO People’s Gas. Other significant suppliers include:
• Southern Natural Gas in North Florida • Florida Gas Transmission • Gulfstream Natural Gas Systems
One key determination at the outset is an understanding of the availability of lower cost pipeline gas supply to the site as opposed to truck fill which will almost certainly be at a higher wholesale price.
Cost/Benefit Summary
For the cost benefit analysis undertaken as part of this study, we completed two separate evaluations which are described in the following:
1.) Analysis of Payback Period For Sample CNG Station – In this first case, we evaluate the estimated payback period associated with the infrastructure investment under various fleet and mileage scenarios which is not specific to Hallandale Beach’s operating structure. Rather, this initial analysis is being performed to provide an understanding of the payback period for the City’s investment in CNG Station based upon industry standard capital costs, operating costs and utilization (revenues). Importantly, the analysis is based upon insight from the research completed as part of this assessment and may be subject to refinement based upon updated information (such as changes in
8
Hallandale Beach CNG Economic Assessment
July 2013
infrastructure cost structure or operating efficiencies) that may result from near term advances of a relatively newly evolving industry. The detailed proforma analysis is provided in Attachment A herein.
Generally, for units of government or private sector business contemplating building a CNG facility the following thresholds should be met to insure a reasonable (5-7 years) payback is achieved:
• The fleet should consist of at least 50 vehicles targeted for conversion; • Average mileage per vehicle should be from 40,000 miles per year, at a minimum
and preferably 70,000+ miles per year; • According to sources interviewed, it costs $35,000 to $80,000 to convert an existing
Class 6, or 7 vehicle to CNG and from $200,000 to $350,000 for a new vehicle equipped with CNG system; and,
• There is an additional cost of $250,000 to $350,000 to retrofit maintenance facilities for CNG vehicles.
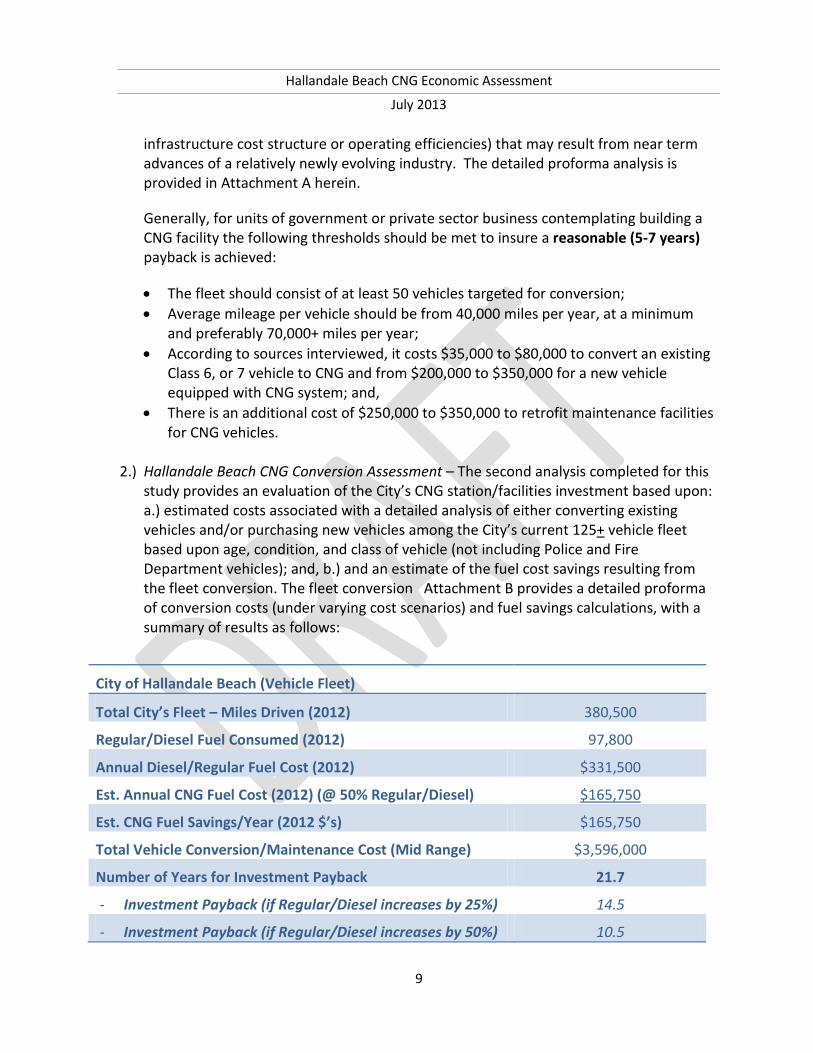
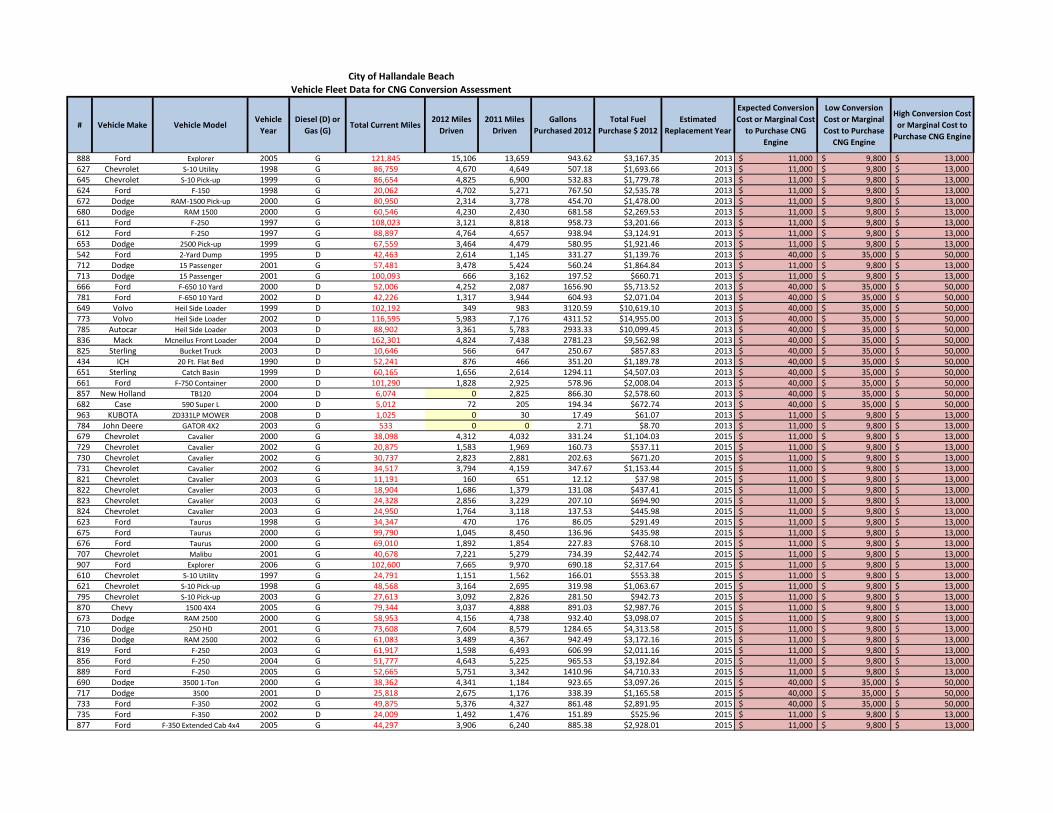
2.) Hallandale Beach CNG Conversion Assessment – The second analysis completed for this study provides an evaluation of the City’s CNG station/facilities investment based upon: a.) estimated costs associated with a detailed analysis of either converting existing vehicles and/or purchasing new vehicles among the City’s current 125+ vehicle fleet based upon age, condition, and class of vehicle (not including Police and Fire Department vehicles); and, b.) and an estimate of the fuel cost savings resulting from the fleet conversion. The fleet conversion Attachment B provides a detailed proforma of conversion costs (under varying cost scenarios) and fuel savings calculations, with a summary of results as follows:
City of Hallandale Beach (Vehicle Fleet)
Total City’s Fleet – Miles Driven (2012) 380,500
Regular/Diesel Fuel Consumed (2012) 97,800
Annual Diesel/Regular Fuel Cost (2012) $331,500
Est. Annual CNG Fuel Cost (2012) (@ 50% Regular/Diesel) $165,750
Est. CNG Fuel Savings/Year (2012 $’s) $165,750
Total Vehicle Conversion/Maintenance Cost (Mid Range) $3,596,000
Number of Years for Investment Payback 21.7
- Investment Payback (if Regular/Diesel increases by 25%) 14.5
- Investment Payback (if Regular/Diesel increases by 50%) 10.5
9
Hallandale Beach CNG Economic Assessment
July 2013 As summarized above, City provided data indicates that its entire vehicle fleet traveled a total 380,000 miles in 2012 (or an average 3,100 miles per vehicle per year). Based upon the City’s 2012 fuel consumption (97,800 gallons), the City spent $331,500 in regular/diesel fuel. If we assume that regular/diesel fuel costs remain constant (2012 $’s) than the payback period for the $3.6 million CNG Vehicle Conversion and Maintenance Facility upgrade cost is 21.7 years – which clearly does not justify the investment from strictly an economic perspective. Accordingly, even if regular/diesel fuel costs increase 25 percent or even 50 percent, then the payback period shortens though only too roughly 15 and 11 years, respectively. As a result, the analysis above clearly indicates that given the level of utilization (or total mileage for its fleet), the City’s investment in a CNG vehicle conversion and station is not warranted from an economic standpoint. However, perhaps the City’s best option is to identify a private fleet operator or private investor who would partner with the City to development the CNG filling station. In this scenario, the private investor would be assured the City would be a long term customer to establish a base of business and have access to a well located ready-to-build site.
Findings and Recommendations
Based upon our interviews and industry research we recommend the following:
• Beyond the environmental benefits, it makes strong economic sense for the City to convert its truck fleet to CNG if it does not have to develop its own filling infrastructure but can refill in a privately developed station on the Ansin Boulevard site.
• The City should rapidly issue a request to identify a private partner to develop a CNG with LNG expansion potential on the Ansin Boulevard site. Beyond the contribution of land, the City can assure the operator/investor a significant annual purchase of CNG which while not enough to support the construction of the facility certainly minimizes risk. The reason for speed in issuing the request is due to the fact that as in any rapidly expanding and changing industry, the competition among land owners and municipalities with similarly well located sites for CNG/LNG filling stations will expand rapidly as well and the sooner to market the better given competition among land owners to offer up strong sites up-and-down I-95 in Broward and northern Miami-Dade County will expand as well.
• One aspect of the request for private CNG investors should include an option to the lessee of the site to either indicate a proposed fixed ground lease payment or payment through a long term reduction-to-market CNG cost expressed as a percent of best customer or surrounding competitive market cost. We strongly recommend against the City attempting to realize land value through a revenue participation
10

Hallandale Beach CNG Economic Assessment
July 2013
agreement. The market is too fluid at this point to accurately estimate the long term viability of any given filling station’s revenue.
11
ATTACHMENT A
FLEET CONVERSON TO CNG COST/BENEFIT ASSESSMENT

Compressed Natural Gas (CNG) Conversion ‐ Cost/Benefit Analysis
Assumptions for Fleet or Municipality
Inputs: A B C D
Number of vehicles 50 60 70 100
Miles driven per year per vehicle 40,000 40,000 40,000 40,000
50,000 50,000 50,000 50,000
60,000 60,000 60,000 60,000
70,000 70,000 70,000 70,000
Existing Vehicles ‐ Average Miles Per Gallon 5.00 5.00 5.00 5.00
Based on Converting Older Vehicles
Cost of Diesel Fuel Per Gallon $4.00 $4.00 $4.00 $4.00
Gallons per year/all vehicles 400,000 480,000 560,000 800,000
500,000 600,000 700,000 1,000,000
600,000 720,000 840,000 1,200,000
700,000 840,000 980,000 1,400,000
Diesel Fuel Cost Per year $1,600,000 $1,920,000 $2,240,000 $3,200,000
$2,000,000 $2,400,000 $2,800,000 $4,000,000
$2,400,000 $2,880,000 $3,360,000 $4,800,000
$2,800,000 $3,360,000 $3,920,000 $5,600,000
Cost to Convert Old Vehicles‐ Per Vehicle $65,000 $3,250,000 $3,900,000 $4,550,000 $6,500,000
Cost of CNG Facility at 4 Pumps ‐ Variable $1,000,000 $1,000,000 $1,000,000 $1,000,000
Cost to Upgrade Maintenance Facility‐Variable $300,000 $300,000 $300,000 $300,000
Estimated Total Capital & Conversion Costs $4,550,000 $5,200,000 $5,850,000 $7,800,000
$4,550,000 $5,200,000 $5,850,000 $7,800,000
$4,550,000 $5,200,000 $5,850,000 $7,800,000
$4,550,000 $5,200,000 $5,850,000 $7,800,000
CNG Cost Gas Gallon Equivalent (GGE) $2.00 $2.00 $2.00 $2.00
CNG Cost Savings per year $800,000 $960,000 $1,120,000 $1,600,000
$1,000,000 $1,200,000 $1,400,000 $2,000,000
$1,200,000 $1,440,000 $1,680,000 $2,400,000
$1,400,000 $1,680,000 $1,960,000 $2,800,000
0.00% $0 $0 $0 $0
$0 $0 $0 $0
$0 $0 $0 $0
$0 $0 $0 $0
Payback in years ‐ Vehicle Conversion 5.7 5.4 5.2 4.9
4.6 4.3 4.2 3.9
3.8 3.6 3.5 3.3
3.3 3.1 3.0 2.8
Based on Buying New Vehicles
Cost to Buy New Vehicles‐ Per Vehicle $250,000 $12,500,000 $15,000,000 $17,500,000 $25,000,000
Cost of CNG Facility at 4 Pumps $1,000,000 $1,000,000 $1,000,000 $1,000,000
Cost to Upgrade Maintenance Facility $300,000 $300,000 $300,000 $300,000
Estimated Total Capital Costs $13,800,000 $16,300,000 $18,800,000 $26,300,000
Payback in years ‐ New Vehicles 17.3 17.0 16.8 16.4
13.8 13.6 13.4 13.2
11.5 11.3 11.2 11.0
9.9 9.7 9.6 9.4
Additional Revenue from 3rd Party Contracts
Scenarios
ATTACHMENT B
HALLANDALE BEACH CNG VEHICLE CONVERSION/PURCHASE ANALYSIS
# Vehicle Make Vehicle ModelVehicle
YearDiesel (D) or
Gas (G)Total Current Miles
2012 Miles Driven
2011 Miles Driven
Gallons Purchased 2012
Total Fuel Purchase $ 2012
Estimated Replacement Year
Expected Conversion Cost or Marginal Cost
to Purchase CNG Engine
Low Conversion Cost or Marginal Cost to Purchase
CNG Engine
High Conversion Cost or Marginal Cost to
Purchase CNG Engine
888 Ford Explorer 2005 G 121,845 15,106 13,659 943.62 $3,167.35 2013 11,000$ 9,800$ 13,000$ 627 Chevrolet S-10 Utility 1998 G 86,759 4,670 4,649 507.18 $1,693.66 2013 11,000$ 9,800$ 13,000$ 645 Chevrolet S-10 Pick-up 1999 G 86,654 4,825 6,900 532.83 $1,779.78 2013 11,000$ 9,800$ 13,000$ 624 Ford F-150 1998 G 20,062 4,702 5,271 767.50 $2,535.78 2013 11,000$ 9,800$ 13,000$ 672 Dodge RAM-1500 Pick-up 2000 G 80,950 2,314 3,778 454.70 $1,478.00 2013 11,000$ 9,800$ 13,000$ 680 Dodge RAM 1500 2000 G 60,546 4,230 2,430 681.58 $2,269.53 2013 11,000$ 9,800$ 13,000$ 611 Ford F-250 1997 G 108,023 3,121 8,818 958.73 $3,201.66 2013 11,000$ 9,800$ 13,000$ 612 Ford F-250 1997 G 88,897 4,764 4,657 938.94 $3,124.91 2013 11,000$ 9,800$ 13,000$ 653 Dodge 2500 Pick-up 1999 G 67,559 3,464 4,479 580.95 $1,921.46 2013 11,000$ 9,800$ 13,000$ 542 Ford 2-Yard Dump 1995 D 42,463 2,614 1,145 331.27 $1,139.76 2013 40,000$ 35,000$ 50,000$ 712 Dodge 15 Passenger 2001 G 57,481 3,478 5,424 560.24 $1,864.84 2013 11,000$ 9,800$ 13,000$ 713 Dodge 15 Passenger 2001 G 100,093 666 3,162 197.52 $660.71 2013 11,000$ 9,800$ 13,000$ 666 Ford F-650 10 Yard 2000 D 52,006 4,252 2,087 1656.90 $5,713.52 2013 40,000$ 35,000$ 50,000$ 781 Ford F-650 10 Yard 2002 D 42,226 1,317 3,944 604.93 $2,071.04 2013 40,000$ 35,000$ 50,000$ 649 Volvo Heil Side Loader 1999 D 102,192 349 983 3120.59 $10,619.10 2013 40,000$ 35,000$ 50,000$ 773 Volvo Heil Side Loader 2002 D 116,595 5,983 7,176 4311.52 $14,955.00 2013 40,000$ 35,000$ 50,000$ 785 Autocar Heil Side Loader 2003 D 88,902 3,361 5,783 2933.33 $10,099.45 2013 40,000$ 35,000$ 50,000$ 836 Mack Mcneilus Front Loader 2004 D 162,301 4,824 7,438 2781.23 $9,562.98 2013 40,000$ 35,000$ 50,000$ 825 Sterling Bucket Truck 2003 D 10,646 566 647 250.67 $857.83 2013 40,000$ 35,000$ 50,000$ 434 ICH 20 Ft. Flat Bed 1990 D 52,241 876 466 351.20 $1,189.78 2013 40,000$ 35,000$ 50,000$ 651 Sterling Catch Basin 1999 D 60,165 1,656 2,614 1294.11 $4,507.03 2013 40,000$ 35,000$ 50,000$ 661 Ford F-750 Container 2000 D 101,290 1,828 2,925 578.96 $2,008.04 2013 40,000$ 35,000$ 50,000$ 857 New Holland TB120 2004 D 6,074 0 2,825 866.30 $2,578.60 2013 40,000$ 35,000$ 50,000$ 682 Case 590 Super L 2000 D 5,012 72 205 194.34 $672.74 2013 40,000$ 35,000$ 50,000$ 963 KUBOTA ZD331LP MOWER 2008 D 1,025 0 30 17.49 $61.07 2013 11,000$ 9,800$ 13,000$ 784 John Deere GATOR 4X2 2003 G 533 0 0 2.71 $8.70 2013 11,000$ 9,800$ 13,000$ 679 Chevrolet Cavalier 2000 G 38,098 4,312 4,032 331.24 $1,104.03 2015 11,000$ 9,800$ 13,000$ 729 Chevrolet Cavalier 2002 G 20,875 1,583 1,969 160.73 $537.11 2015 11,000$ 9,800$ 13,000$ 730 Chevrolet Cavalier 2002 G 30,737 2,823 2,881 202.63 $671.20 2015 11,000$ 9,800$ 13,000$ 731 Chevrolet Cavalier 2002 G 34,517 3,794 4,159 347.67 $1,153.44 2015 11,000$ 9,800$ 13,000$ 821 Chevrolet Cavalier 2003 G 11,191 160 651 12.12 $37.98 2015 11,000$ 9,800$ 13,000$ 822 Chevrolet Cavalier 2003 G 18,904 1,686 1,379 131.08 $437.41 2015 11,000$ 9,800$ 13,000$ 823 Chevrolet Cavalier 2003 G 24,328 2,856 3,229 207.10 $694.90 2015 11,000$ 9,800$ 13,000$ 824 Chevrolet Cavalier 2003 G 24,950 1,764 3,118 137.53 $445.98 2015 11,000$ 9,800$ 13,000$ 623 Ford Taurus 1998 G 34,347 470 176 86.05 $291.49 2015 11,000$ 9,800$ 13,000$ 675 Ford Taurus 2000 G 99,790 1,045 8,450 136.96 $435.98 2015 11,000$ 9,800$ 13,000$ 676 Ford Taurus 2000 G 69,010 1,892 1,854 227.83 $768.10 2015 11,000$ 9,800$ 13,000$ 707 Chevrolet Malibu 2001 G 40,678 7,221 5,279 734.39 $2,442.74 2015 11,000$ 9,800$ 13,000$ 907 Ford Explorer 2006 G 102,600 7,665 9,970 690.18 $2,317.64 2015 11,000$ 9,800$ 13,000$ 610 Chevrolet S-10 Utility 1997 G 24,791 1,151 1,562 166.01 $553.38 2015 11,000$ 9,800$ 13,000$ 621 Chevrolet S-10 Pick-up 1998 G 48,568 3,164 2,695 319.98 $1,063.67 2015 11,000$ 9,800$ 13,000$ 795 Chevrolet S-10 Pick-up 2003 G 27,613 3,092 2,826 281.50 $942.73 2015 11,000$ 9,800$ 13,000$ 870 Chevy 1500 4X4 2005 G 79,344 3,037 4,888 891.03 $2,987.76 2015 11,000$ 9,800$ 13,000$ 673 Dodge RAM 2500 2000 G 58,953 4,156 4,738 932.40 $3,098.07 2015 11,000$ 9,800$ 13,000$ 710 Dodge 250 HD 2001 G 73,608 7,604 8,579 1284.65 $4,313.58 2015 11,000$ 9,800$ 13,000$ 736 Dodge RAM 2500 2002 G 61,083 3,489 4,367 942.49 $3,172.16 2015 11,000$ 9,800$ 13,000$ 819 Ford F-250 2003 G 61,917 1,598 6,493 606.99 $2,011.16 2015 11,000$ 9,800$ 13,000$ 856 Ford F-250 2004 G 51,777 4,643 5,225 965.53 $3,192.84 2015 11,000$ 9,800$ 13,000$ 889 Ford F-250 2005 G 52,665 5,751 3,342 1410.96 $4,710.33 2015 11,000$ 9,800$ 13,000$ 690 Dodge 3500 1-Ton 2000 G 38,362 4,341 1,184 923.65 $3,097.26 2015 40,000$ 35,000$ 50,000$ 717 Dodge 3500 2001 D 25,818 2,675 1,176 338.39 $1,165.58 2015 40,000$ 35,000$ 50,000$ 733 Ford F-350 2002 G 49,875 5,376 4,327 861.48 $2,891.95 2015 40,000$ 35,000$ 50,000$ 735 Ford F-350 2002 D 24,009 1,492 1,476 151.89 $525.96 2015 11,000$ 9,800$ 13,000$ 877 Ford F-350 Extended Cab 4x4 2005 G 44,297 3,906 6,240 885.38 $2,928.01 2015 11,000$ 9,800$ 13,000$
Vehicle Fleet Data for CNG Conversion AssessmentCity of Hallandale Beach

# Vehicle Make Vehicle ModelVehicle
YearDiesel (D) or
Gas (G)Total Current Miles
2012 Miles Driven
2011 Miles Driven
Gallons Purchased 2012
Total Fuel Purchase $ 2012
Estimated Replacement Year
Expected Conversion Cost or Marginal Cost
to Purchase CNG Engine
Low Conversion Cost or Marginal Cost to Purchase
CNG Engine
High Conversion Cost or Marginal Cost to
Purchase CNG Engine
Vehicle Fleet Data for CNG Conversion AssessmentCity of Hallandale Beach
662 Chevrolet 2500 VAN 2000 G 58,168 6,416 10,017 1501.72 $4,986.48 2015 11,000$ 9,800$ 13,000$ 732 Dodge RAM 3500 VAN 2002 G 52,181 3,590 5,709 565.69 $1,883.19 2015 11,000$ 9,800$ 13,000$ 797 Sterling Leach Rear Loader 2003 D 36,522 3,147 3,822 1497.88 $5,139.67 2015 40,000$ 35,000$ 50,000$ 694 Ford F-550 TV Truck 2000 D 42,864 2,358 2,913 1215.30 $4,063.37 2015 40,000$ 35,000$ 50,000$ 828 Sterling 5 Yd. Dump 2003 D 16,238 260 468 115.48 $399.73 2015 40,000$ 35,000$ 50,000$ 858 Sterling 5 Yd. Dump 2004 D 29,682 792 662 154.13 $532.38 2015 40,000$ 35,000$ 50,000$ 594 Ford 32 Yd. Dump 1997 D 49,508 0 910 0.00 $0.00 2015 40,000$ 35,000$ 50,000$ 711 Sterling 32 Yd. Dump 2001 D 40,915 665 1,537 155.99 $537.21 2015 40,000$ 35,000$ 50,000$ 582 Ford Water Truck 1996 D 31,223 600 1,914 172.06 $587.89 2015 40,000$ 35,000$ 50,000$ 868 IHC Catch Basin 2005 D 43,487 5,765 6,547 2671.42 $9,126.31 2015 40,000$ 35,000$ 50,000$ 678 Sterling Peterson CA 2000 D 12,423 643 968 307.62 $1,051.74 2015 40,000$ 35,000$ 50,000$ 613 Ford 6640 Tractor 1997 D 493 44 12 126.84 $431.51 2015 40,000$ 35,000$ 50,000$ 726 Case Backhoe/Loader 2002 D 5,097 220 144 277.26 $954.72 2015 40,000$ 35,000$ 50,000$ 869 Terex Backhoe/Loader 2005 D 3,940 154 212 343.61 $1,185.72 2015 40,000$ 35,000$ 50,000$ 734 Case Skid Steer Load. 2002 D 772 0 0 39.94 $142.30 2015 40,000$ 35,000$ 50,000$ 607 ING IR Vibratory Roller 1997 D 596 14 0 87.60 $300.71 2015 40,000$ 35,000$ 50,000$ 783 John Deere GATOR 6X4 2003 D 917 0 0 0.00 $0.00 2015 40,000$ 35,000$ 50,000$ 892 Ford Ranger Pick-up 2006 G 18,111 1,800 3,071 176.73 $592.37 2016 11,000$ 9,800$ 13,000$ 893 Ford Ranger Pick-up 2006 G 21,140 4,019 3,746 330.87 $1,109.17 2016 11,000$ 9,800$ 13,000$ 897 Ford F-150 Pick-up 2006 G 31,781 2,791 3,736 476.96 $1,580.97 2016 11,000$ 9,800$ 13,000$ 898 Ford F-150 Pick-up 2006 G 41,397 6,228 4,742 1040.37 $3,467.54 2016 11,000$ 9,800$ 13,000$ 899 Ford F-150 Pick-up 2006 G 51,565 5,097 4,394 927.45 $3,095.28 2016 11,000$ 9,800$ 13,000$ 900 Ford F-150 Pick-up 2006 G 47,418 5,387 11,188 625.71 $2,068.95 2016 11,000$ 9,800$ 13,000$ 901 Ford F-350 4x2 Regular Cab 2006 G 52,763 8,071 7,561 1508.27 $5,024.56 2016 11,000$ 9,800$ 13,000$ 902 Ford F-350 4x2 Regular Cab 2006 G 36,573 4,056 5,075 759.51 $2,537.85 2016 11,000$ 9,800$ 13,000$ 903 Ford F-350 4x2 Regular Cab 2006 G 39,093 5,862 7,105 1213.27 $4,051.78 2016 11,000$ 9,800$ 13,000$ 906 Ford E-350 D EXT VAN 2006 G 23,562 3,943 3,350 766.21 $2,573.39 2016 11,000$ 9,800$ 13,000$ 904 Sterling Condor Front Loader 2006 D 89,447 3,975 1,333 2731.08 $9,341.41 2016 65,000$ 55,000$ 70,000$ 905 Sterling Condor Front Loader 2006 D 91,158 2,908 5,096 2510.77 $8,607.52 2016 65,000$ 55,000$ 70,000$ 909 Caterpillar 4WD 2006 D 4,289 207 299 479.99 $1,651.67 2016 65,000$ 55,000$ 70,000$
1004 SCAG 61" RIDING MOWER 2011 G 677 2,102 188 410.71 $1,376.02 2016 11,000$ 9,800$ 13,000$ 1029 SCAG 52" RIDING MOWER 2011 G 955 184 0 99.96 $338.55 2016 11,000$ 9,800$ 13,000$ 1031 John Deere 7400 MOWER 2011 D 250 42 0 100.48 $350.51 2016 11,000$ 9,800$ 13,000$
908 John Deere 1200A 2006 G 0 0 0 4.00 $13.50 2016 11,000$ 9,800$ 13,000$ 985 Sterling LT9500 2007 D 25,608 3,313 8,872 895.56 $3,086.36 2017 65,000$ 55,000$ 70,000$ 986 Sterling LT9500 2007 D 31,824 8,315 5,970 2346.43 $8,075.07 2017 65,000$ 55,000$ 70,000$ 958 Ford F-250 XL 4x2 2008 G 44,938 7,471 6,977 1730.33 $5,801.25 2018 11,000$ 9,800$ 13,000$ 966 Ford F-250 XL 4x2 2008 G 30,925 8,140 6,806 1323.97 $4,416.03 2018 11,000$ 9,800$ 13,000$ 967 Ford F-250 XL 4x2 2008 G 28,325 4,871 5,240 1378.01 $4,612.74 2018 11,000$ 9,800$ 13,000$ 960 Ford F-350 CREWCAB 2008 D 35,247 6,475 4,850 1297.30 $4,470.05 2018 65,000$ 55,000$ 70,000$ 962 Ford F-450 4x2 9' Dump 2008 D 37,125 3,900 5,226 911.86 $3,140.37 2018 65,000$ 55,000$ 70,000$ 968 Ford F-450 4x2 11' Dump 2008 D 15,608 1,398 2,388 643.85 $2,219.28 2018 65,000$ 55,000$ 70,000$ 965 John Deere 544J 2008 D 2,879 239 1,041 781.99 $2,686.05 2018 65,000$ 55,000$ 70,000$ 980 Autocar W/EZ Pack 40 2009 D 56,987 6,485 7,596 5113.78 $17,658.03 2019 65,000$ 55,000$ 70,000$ 988 GMC W3500/Schwarze 2009 D 19,710 3,330 4,012 1081.87 $3,735.24 2019 65,000$ 55,000$ 70,000$ 771 New Holland TRAC/SWE 2002 D 3,709 0 14 0.00 $0.00 2019 65,000$ 55,000$ 70,000$ 987 Ford Escape XLS 2010 G 14,000 2,825 4,658 300.48 $1,008.49 2020 11,000$ 9,800$ 13,000$
1024 Ford Explorer 2012 G 20,208 12,223 512 774.59 $2,580.61 2020 11,000$ 9,800$ 13,000$ 1058 Ford Explorer 2012 G 6,219 1,660 0 124.82 $426.07 2020 11,000$ 9,800$ 13,000$ 1059 Ford Explorer 2012 G 12,845 4,733 0 260.06 $890.31 2020 11,000$ 9,800$ 13,000$
992 Ford E-250 ADA VAN 2010 G 12,699 5,103 2,885 785.89 $2,618.55 2020 11,000$ 9,800$ 13,000$ 983 Autocar W/EZ Pack 40 2010 D 24,765 3,739 7,268 4844.09 $16,696.15 2020 65,000$ 55,000$ 70,000$ 993 CAT 297C TRAC LOADER 2010 D 247 0 0 0.00 $0.00 2020 65,000$ 55,000$ 70,000$
1009 Ford Fusion 2011 G 5,704 2,550 626 183.25 $604.09 2021 11,000$ 9,800$ 13,000$

# Vehicle Make Vehicle ModelVehicle
YearDiesel (D) or
Gas (G)Total Current Miles
2012 Miles Driven
2011 Miles Driven
Gallons Purchased 2012
Total Fuel Purchase $ 2012
Estimated Replacement Year
Expected Conversion Cost or Marginal Cost
to Purchase CNG Engine
Low Conversion Cost or Marginal Cost to Purchase
CNG Engine
High Conversion Cost or Marginal Cost to
Purchase CNG Engine
Vehicle Fleet Data for CNG Conversion AssessmentCity of Hallandale Beach
1065 Ford Explorer 2013 G 2,275 0 0 131.72 $439.69 2021 11,000$ 9,800$ 13,000$ 1022 Ford F-150 4x4 2011 G 9,607 4,761 0 885.54 $2,948.72 2021 11,000$ 9,800$ 13,000$
995 Ford F-250 4x2 CREWCAB 2011 G 16,131 5,300 4,975 1469.45 $4,918.53 2021 11,000$ 9,800$ 13,000$ 996 Ford F-250 4x2 CREWCAB 2011 G 14,500 4,264 4,229 1054.11 $3,503.14 2021 11,000$ 9,800$ 13,000$
1007 Ford E-350 EXT 15 Passenger 2011 G 19,467 3,688 3,954 1164.47 $3,863.38 2021 11,000$ 9,800$ 13,000$ 998 Freightliner M2 18 Yd. 2011 D 2,900 526 366 212.77 $728.82 2021 65,000$ 55,000$ 70,000$ 999 Freightliner Crane 2011 D 7,112 2,828 2,562 1199.78 $4,148.21 2021 65,000$ 55,000$ 70,000$
1005 CAT 303C CR Mini 2011 D 256 0 22 0.00 $0.00 2021 65,000$ 55,000$ 70,000$ 1057 Ford Escape XLS 2012 G 2,778 884 0 80.36 $277.00 2022 11,000$ 9,800$ 13,000$ 1055 Ford F-150 Regular cab 2012 G 5,746 2,267 0 230.24 $788.95 2022 11,000$ 9,800$ 13,000$ 1056 Ford F-150 Regular cab 2012 G 4,870 2,169 0 240.35 $825.06 2022 11,000$ 9,800$ 13,000$ 1034 Ford F-250SD XL 4x2 2012 G 8,621 3,441 0 553.98 $1,902.01 2022 11,000$ 9,800$ 13,000$ 1035 Ford F-250SD XL 4x2 2012 G 7,174 3,711 0 649.68 $2,253.47 2022 11,000$ 9,800$ 13,000$ 1036 Ford F-250SD XL 4x2 2012 G 10,438 5,483 0 724.74 $2,494.23 2022 11,000$ 9,800$ 13,000$ 1054 Ford E-350 EXT 15 Passenger 2012 G 5,097 1,351 0 248.50 $837.63 2022 11,000$ 9,800$ 13,000$ 1062 Caterpillar 420F 2012 D 4 0 0 0.00 $0.00 2022 65,000$ 55,000$ 70,000$ 1068 Ford Escape S 2013 G 3 0 0 0.00 $0.00 2023 11,000$ 9,800$ 13,000$ 1066 Autocar ACX64/WAYNE 2013 Natural Gas 1,971 0 0 0.00 $0.00 2023 -$ -$ -$ 1067 Autocar ACX64/WAYNE 2013 Natural Gas 1,951 0 0 0.00 $0.00 2023 -$ -$ -$
380,567 395,528 97,805.88 $331,492.313,246,000$ 2,819,800$ 3,798,000$
Maintenance Facility Upgrade 350,000$ 300,000$ 400,000$
Total Cost of Conversion 3,596,000$ 3,119,800$ 4,198,000$
Payback at 2012 Gas Prices(in Years) 21.70 18.82 25.33
Payback if Gas Prices Increase by 25% without corresponding Increase in CNG Cost (in Years) 14.46 12.55 16.89 Payback if Gas Prices Increase by 50% without corresponding Increase in CNG Cost (in Years) 10.85 9.41 12.66
Totals