Embed Size (px)
Citation preview

COMPREHENSIVE ANNUAL FINANCIAL REPORT
City of Miami
Fiscal Year Ended September 30,
2012

COMPREHENSIVE ANNUAL FINANCIAL REPORT
City of Miami, Florida For the Year Ended September 30, 2012
Prepared by the Finance Department

City of Miami, Florida
Comprehensive Annual Financial Report For the Fiscal Year Ended September 30, 2012
TABLE OF CONTENTS
I. INTRODUCTORY SECTION
PRINCIPAL CITY OFFICIALS ................................................................................... i LETTER OF TRANSMITTAL ................................................................................... iii CERTIFICATE OF ACHIEVEMENT ........................................................................xv ORGANIZATIONAL CHART ................................................................................. xvi
II. FINANCIAL SECTION
Report of Independent Certified Public Accountants ....................................................1 Management’s Discussion and Analysis .......................................................................3 Basic Financial Statements:
Government-wide Financial Statements
Statement of Net Assets ................................................................................13 Statement of Activities ..................................................................................14
Fund Financial Statements Governmental Funds Financial Statements
Balance Sheet ................................................................................................15 Reconciliation of the Governmental Funds Balance Sheet to the Statement of Net Assets ................................................................16 Statement of Revenues, Expenditures and Changes in Fund Balances .........................................................................................17 Reconciliation of the Statement of Revenues, Expenditures and Changes in Fund Balances of Governmental Funds to the Statement of Activities……………………………………………….. ..18
Fiduciary Funds Financial Statements Statement of Fiduciary Net Assets ................................................................19 Statement of Changes in Fiduciary Net Assets .............................................20
Discretely Presented Component Units Statement of Net Assets ................................................................................21 Statement of Activities ..................................................................................22
Notes to the Financial Statements ...................................................................25

Required Supplementary Information: Budgetary Comparison Schedules–Major Funds (General and Special Revenue):
General Fund .................................................................................................88 Special Obligation Bonds Fund ....................................................................89
Notes to the Required Supplementary Information ......................................90
Pension Schedules: Schedule of Funding Progress ......................................................................91 Schedule of Employer Contributions ............................................................92
Combining and Individual Fund Statements and Schedules:
Nonmajor Governmental Funds: Fund Listing and Descriptions .....................................................................93 Combining Balance Sheet ............................................................................98 Combining Statement of Revenues, Expenditures and Changes
in Fund Balances ......................................................................................104 Budgetary Comparison Schedules – Non-major Governmental Funds:
OMNI CRA Agency ...................................................................................110 MIDTOWN CRA Agency .........................................................................111 Southeast Overtown Park West CRA (SEOPW) Agency...........................112 Homeless Fund............................................................................................113 Community Development Fund ..................................................................114 Choice Housing Vouchers (Section 8) Fund ..............................................115 State Housing Initiatives Program (SHIP) Fund .........................................116 Convention Center Fund .............................................................................117 Economic Development & Planning Services Fund ...................................118 Fire Rescue Services Fund ..........................................................................119 Net Offices Fund .........................................................................................120 Parks and Recreations Fund ........................................................................121 Police Services Fund ...................................................................................122 Law Enforcement Trust Fund .....................................................................123 Public Works Services Fund .......................................................................124 City Clerk Services Fund ............................................................................125 Emergency Services Fund...........................................................................126 General Special Revenue Fund ...................................................................127 Miami Ballpark Parking Facility………………………………………….128 Department Improvement Initiatives Fund .................................................129 Transportation & Transit Fund ...................................................................130 Liberty City Community Revitalization Trust ............................................131 Virginia Key Beach Park Trust ...................................................................132 General Obligation Bonds Fund .................................................................133 SEOPW Special Obligation Bonds Fund ....................................................134

Fiduciary Funds Fund Listing and Descriptions……………………………………………135
Combining Statement of Fiduciary Net Assets ...........................................136 Combining Statement of Changes in Fiduciary Net Assets ........................137 III. STATISTICAL SECTION (Unaudited)
Net Assets by Component ..........................................................................................139 Changes in Net Assets ...............................................................................................140 Governmental Activities Tax Revenues by Source ...................................................141 Fund Balances of Governmental Funds .....................................................................142 Changes in Fund Balances of Governmental Funds ..................................................143 General Government Tax Revenues by Source .........................................................144 Net Assessed Value and Estimated Actual Value of Taxable Property .....................145 Property Tax Rates – Direct and Overlapping Governments ....................................146 Principal Property Taxpayers .....................................................................................147 Property Tax Levies and Collections .........................................................................148 Ratios of Outstanding Debt by Type .........................................................................149 Ratios of General Bonded Debt Outstanding .............................................................150 Direct and Overlapping Governmental Activities Debt .............................................151 Legal Debt Margin Information .................................................................................152 Pledged Revenue Coverage .......................................................................................153 Demographics and Economic Statistics .....................................................................154 Principal Employers ...................................................................................................155 Full-Time Equivalent City Government Employees by Function .............................156 Operating Indicators by Function ..............................................................................157 Capital Assets Statistics by Function/Program ..........................................................158

This page intentionally left blank

i
City of Miami, Florida Principal City Officials
September 30, 2012
MAYOR Tomás P. Regalado
CITY COMMISSION Francis Suarez, Chairman
Marc David Sarnoff, Vice-Chairman Wifredo (Willy) Gort, Commissioner
Frank Carollo, Commissioner Michelle Spence-Jones, Commissioner
CITY MANAGER Johnny Martinez
CITY ATTORNEY Julie O. Bru

ii
This page intentionally left blank

iii
June 18, 2013 The Honorable Mayor, Members of the City of Miami Commission, and Citizens of the City of Miami, Florida Ladies and Gentlemen: The Comprehensive Annual Financial Report (“CAFR”) of the City of Miami, Florida (the “City”) for the fiscal year ended September 30, 2012 is hereby submitted as mandated by Florida Statutes. This report consists of management’s representations concerning the finances of the City. Consequently, management assumes full responsibility for the completeness and reliability of all the information presented in this report. To provide a reasonable basis for making these representations, management of the City desires to continually improve on a comprehensive internal control framework that is designed both to protect the City’s assets from loss, theft or misuse and to compile sufficient reliable information for preparation of the City’s financial statements in conformity with Generally Accepted Accounting Principles (GAAP). Because the cost of internal controls should not outweigh their benefits, the City’s comprehensive framework of internal control has been designed to provide reasonable, rather than absolute assurance that the financial statements will be free of material misstatement. As management, we assert that, to the best of our knowledge and belief, this financial report is complete and reliable in all material respects. All disclosures necessary to enable the reader to acquire an understanding of the City’s financial activities are in the financial section of this report, which includes management’s discussion and analysis (MD&A). The MD&A and the footnotes to the financial statements are to complement this letter of transmittal and should be read in conjunction with the report. Ernst & Young LLP, a firm of independent certified public accountants, has audited the City’s basic financial statements. The goal of the independent audit was to provide reasonable assurance that the financial statements of the City for the fiscal year ended September 30, 2012 are free of material misstatement. The independent audit involved examining, on a test basis, evidence supporting the amounts and disclosures in the basic financial statements; assessing the accounting principles used and significant estimates made by management; and evaluating the overall financial statement presentation. The independent auditors concluded, based upon the audit, that there was reasonable basis for rendering an unqualified opinion that the City’s basic financial statements for the fiscal year ended September 30, 2012 were presented fairly in conformity with GAAP. The independent auditor’s report is presented as the first component of the financial section of this report. The independent audit of the financial statements of the City was part of a broader, federally, and state mandated “Single Audit” designed to meet the special needs of federal and state grantor agencies. The standards governing Single Audit engagements require the independent auditor to report not only on the fair presentation of the financial statements, but also on the audited

iv
government’s internal control and compliance with legal requirements, with special emphasis on internal controls and legal requirements involving the administration of federal and state awards. CITY PROFILE & GOVERNMENT STRUCTURE The City is situated at the mouth of the Miami River on the western shores of Biscayne Bay. It is a main port of entry into Florida and is the county seat of Miami-Dade County, Florida (the “County”). Now 116 years old, the City is part of the nation’s seventh largest metropolitan area. Incorporated in 1896, the City is the only municipality conceived and founded by a woman - Julia Tuttle. According to the U.S. Census Bureau, the City’s population in 1900 was 1,700 people. Today it is a city rich in cultural and ethnic diversity of approximately 408,750 residents according to the 2011 U.S. Census Bureau, 58.4% of them foreign born. In physical size, the City is not large, encompassing only 35.87 square miles. In population, the City is the largest of the 35 municipalities that make up Miami-Dade County and is the county seat. Since 1997, the City has been governed by a form of government known as the “Mayor-City Commissioner plan.” There are five Commissioners elected from designated districts within the City. The City Commission constitutes the governing body and is responsible for, among other things, passing ordinances and adopting regulations. The Mayor serves as the chief executive officer and head of the city government, pursuant to Charter, for particular purposes. The Mayor, within ten days of final adoption by the City Commission, has veto authority over any legislative, quasi-judicial, zoning, master plan or land use decision of the City Commission. The City Commission may override that veto by a four-fifths vote of the City Commissioners present. The Mayor also appoints the City Manager, who serves as the administrative head of the municipal government. City elections are held in November every two years on a non-partisan basis. At each election, two or three members of the Commission are elected for four-year terms. Thus, the terms are staggered so that there are always at least two experienced members of the Commission. The Mayor is elected at large every four years. The City Manager is charged with the responsibility of managing the City's financial operations, organizing, and directing the administrative infrastructure. The City Manager also sees that the laws and ordinances are enforced, retains full authority in the appointment and supervision of department directors, preparation of the City's annual budget, and takes appropriate action on all administrative matters. The City continues to provide the following services: police and fire protection, public works activities, solid waste collection, parks and recreational facilities, planning and development, community development, financial services, and general administrative services. The accompanying financial statements include those of the City (the primary government) and those of its component units. The decision to include a potential component unit in the City’s reporting entity is based on the criteria stated in Governmental Accounting Standards Board (“GASB”) Statement No. 14 - The Financial Reporting Entity, as amended by GASB Statement No. 39 – Determining Whether Certain Organizations Are Component Units.

v
Based upon the application of the criteria in GASB Statement No. 14, the financial statements of the component units listed below have been included in the City’s reporting entity as either blended or discretely presented component units. See Note 1 - Summary of Significant Accounting Policies, Section A. Reporting Entity, for more details.
BLENDED DISCRETELY PRESENTEDSoutheast Overtown Park West CRA Miami Sports and Exhibition AuthorityOMNI CRA Department of Off-Street ParkingMidtown CRA Downtown Development AuthorityVirginia Key Beach Park Trust Bayfront Management TrustLiberty City Revitalization District Trust Health Facility Authority
Civilian Investigative PanelCoconut Grove Business Improvement District
The annual budget serves as the foundation for the City’s financial planning and control. All budgets are monitored at varying levels of classification detail that include both personnel and operating as appropriation designations; however, budgetary control is legally maintained at the fund level except for the General Fund, which is maintained at the departmental operating level. Budget-to-actual comparisons are provided in this report for each major individual governmental fund for which an appropriated annual budget has been adopted. For all non-major governmental funds with appropriated annual budgets, this comparison is presented in the combining and individual fund section of this report. See Note 1 – Budgetary Policy under Notes To The Required Supplementary Information Year Ended September 30, 2012 for more information. LOCAL ECONOMIC CONDITION AND OUTLOOK The City is an international crossroads and known for its range of lifestyles, high-rise skyline, exciting entertainment venues, recreational opportunities, and ethnic diversity. The economic base of the City has diversified in recent years, shifting from reliance on the tourism industry to a combination of motion picture production, manufacturing, service industries and international trade. The area’s advantages in terms of climate, geography, low taxes and skilled labor have combined to make the Miami area a prime relocation area for major manufacturing firms and international corporate headquarters. Local Government Financial Trend For the past several years the City’s General Fund Revenues and Expenditures, along with their respective Transfers In and Out, show various trends. The first trend is that revenues that were once decreasing have been increasing in the past two fiscal years. Another significant trend is that expenditures have been decreasing. Some of the reasons for these trends are explained by local economic conditions noted below and others are related to actions taken by the City and discussed further in this letter under the heading of Long-Term Financial Planning.
General Fund FY 2011 -2012 FY 2010 -2011 FY 2009 -2010 FY 2008 -2009
Revenues and Transfers In $518,053,064 $515,360,438 $505,535,707 $519,306,337 Expenditures and Transfers Out $480,153,386 $513,189,549 $532,065,924 $572,911,198 Net Change in Fund Balance $37,899,678 $2,170,889 ($26,530,217) ($53,604,861) Source: City of Miami Comprehensive Annual Financial Reports fiscal years 2009 through 2012

vi
Housing & Real Estate Market The City is just beginning to come out of the real estate crisis that has been affecting the entire state. While the trend is favorable, it will take many years to reverse the negative impacts of the previous years. The City’s tax base increased to $31.3 billion in fiscal year 2012. However, it is still lower than the previous high of $37.7 billion in fiscal year 2008. According to the US Census Bureau, single–family home values increased from a median value of $222,100 at the end of 2010 to $257,500 in 2011. Also, Miami’s median household income levels increased from $27,291 in 2010 to $30,270 in 2011. According to the website RealtyTrac, the foreclosure filings in Miami have decreased from one in every 277 housing units in 2011 to one in every 300 housing units in 2012. Employment & Wealth Demographics According to the Bureau of Labor Statistics the preliminary unemployment rate decreased from 9.5% in 2011 to 8.1% in 2012 for the Miami-Fort Lauderdale-Pompano Beach Metropolitan Area. The poverty rate also decreased from 32.4% in 2011 to 27.7% in 2012. Akin to the housing and real estate market, it will take years for the unemployment and poverty rates to revert back to the lower rates found in previous years. Our regional economic base remains diversified, comprised of wholesale and retail trade, construction, light manufacturing, and tourism. The City has made great strides in the areas of telecommunications and biomedical industries. Located in the center of a hemispheric market of more than 700 million people, and easily accessible to South and Central America, the Caribbean, Europe and Africa, Miami’s strategic location and international commerce infrastructure make it the ideal location for international trade. As a result of expanding economies in several Latin American countries, international trade has been growing at double-digit rates in the Miami area.
The following major companies have their Latin American headquarters located in the City: The Gap, Inc. Caterpillar Americas Co. Lucent Technologies Federal Express Corporation Ericsson, Inc. Barclays Bank PLC ABN AMRO Bank Terra Networks USA Oracle Latin America Sony Broadcast Export Corporation IBM Corporation Cisco Systems Olympus America Canon Latin America AT&T Latin America ExxonMobil Inter-America Acer Latin America Olympus Latin America Black & Decker Latin America Group Komatsu Latin America Clorox Latin America Hewlett Packard Co. Latin America Tech Data American Express Eastman Chemical Latin America Chevron-Texaco Stanley Latin America Telefonica International USA, Inc. Johnson & Johnson
Source: Beacon Council

vii
Tourism Tourism is an important industry in Miami. The Greater Miami Visitors and Convention Bureau recently released data showing an increase in the number of visitors arriving through the City’s ports, higher hotel room occupancy rates, and more dollars being spent on food and beverage in restaurants. Along with finance and business, the beaches, conventions, festivals and events draw over 38 million visitors annually into the city, from across the country and around the world, approximately spending $17.1 billion. Brickell Citi Centre The Mayor previously announced in his State of the City Address that plans have been finalized, and the Swire Group has begun construction of the “Brickell Citi Centre”, a $1.05 billion project which encompasses three city blocks and includes hotel and condominium towers, a below level parking area and plenty of shops and office spaces. Officials from the Swire Group estimate this project alone will generate approximately 1,700 construction jobs in the next four years and, when finished, employ approximately 3,700 people. The Swire Group projects this project will provide our City with over $5.4 million annually in ad valorem property taxes. Miami International Airport Miami International Airport is one of the busiest airports in the world for both passengers and cargo traffic serving the City of Miami. It ranks twelfth in the nation and twenty-eighth in the world in passenger traffic through the airport. The airport ranks third in the nation and eleventh in the world in tonnage of domestic and international cargo movement. In 2012, over 39.56 million air travelers were serviced by Miami International Airport, and approximately 2.0 million tons of domestic and international cargo were handled. As of April 2011, 93 airlines serve Miami International Airport, flying passengers to more than 130 destinations around the globe. Port of Miami The Port of Miami, known as the “cruise capital of the world,” is operated by the Seaport Department of Miami-Dade County. In 2012, more than 3.7 million passengers sailed from the Port of Miami aboard one of the eight cruise companies who operate out of Miami. The Port of Miami is also a hub for Caribbean and Latin American commerce. These countries account for over half of the 8.1 million tons of cargo transferred through the Port of Miami in 2011. The Port of Miami is also reaching out to the global community where trade with the Far East, Asia and the Pacific accounted for almost 32% of the total cargo handled at the Port of Miami. The Port of Miami is also important to the U.S. economy, contributing in excess of $17 billion annually, which should increase after the completion of the Port of Miami’s five year, $346 million capital improvement program. American Recovery and Reinvestment Act of 2009 The American Recovery and Reinvestment Act (ARRA) is an unprecedented effort to jumpstart our economy, preserve or create jobs, make investments in infrastructure, energy and science and provide unemployment assistance, and state and local economic stabilization. The ARRA was signed into law by President Barack Obama on February 17, 2009. The ARRA provides $787 Billion in spending and tax relief Projects. The federal legislation includes grant funds that are distributed in

viii
two ways: (1) directly to states and cities by formula, and (2) by competitive grants for which applicants must apply. The City successfully addressed some of the necessary costs associated with reduced federal funding in Community Development programs such as Community Development Block Grants (CDBG) with the use of ARRA funds. The City will continue to monitor and address the staff and funding levels as ARRA funds are reduced. Through April 2012, over $47 million has been allocated to the City of Miami, and over $1.4 billion throughout Miami-Dade County in formulaic and competitive grant funding for projects. In addition to the funds received for projects, the City has leveraged stimulus funding provided through other agencies to provide temporary jobs to area residents.
LONG-TERM FINANCIAL PLANNING
In an effort to stabilize the financial management of the City’s resources and focus on the long-term sustainability, while addressing immediate issues and concerns raised by the changing economic climate and drivers within the community, challenging but necessary decisions were required to be made. Financial Urgency Pursuant to Section 447.4095 of the Florida Statutes, the City may declare a financial urgency. This statute, which requires declaration each year, provides that, in the event of a financial urgency requiring modification of a collective bargaining agreement, the City and the representative of the bargaining unit are required to meet as soon as possible to negotiate the impact of the financial urgency. If, after a reasonable period which may not exceed 14 days, the parties are in disagreement, then they must proceed under Section 447.403 of the Florida Statutes, which provides for the appointment of a special magistrate. The City Manager declared a financial urgency in calendar years 2010, 2011 and 2012. Although Financial Urgency was declared in 2010, 2011 and 2012, the City was able to negotiate a one-year contract in 2011(no modifications were imposed) and a two-year contract in 2012 with the unions. In 2012, the City was able to reach agreements with the unions which included, among other things, changes to the pension plans. There may be a legal requirement that certain terms in the pension agreements which were modified by ordinance in 2012 be approved by the Circuit Court. However, the City does not expect this to be an issue because all parties have jointly agreed to petition the Court for those terms, if legally necessary. Refinancings Subsequent to fiscal year end 2012, the City successfully refinanced the outstanding balance of a $50 million short term bank loan for the Port of Miami Tunnel Project, which was scheduled to be paid in January 2013 (see Note 13-Subsequent Events). There are no new financings anticipated during fiscal year 2013, other than continued refinancing of existing bonds to achieve lower interest costs.

ix
The SEOPW CRA has a planned bond sale for up to $50 million primarily for affordable housing and mixed-use commercial facilities in the area of Gibson Park. This financing will not be supported by revenue of the City of Miami, and will instead pledge for repayments of such bonds with tax increment revenues. Financial Outlook Due to the financial distress that the City has experienced in the past, the City continues to take steps and study plans for stabilization. The City Commission requested the City Manager to identify future revenue sources and the City Manager responded by making an assessment of all of the revenues and expenditures of the City. As part of such assessment, the City Manager has charged each member of the executive team to identify new revenue sources and increase the existing revenue sources, along with finding ways to further reduce expenditures over time. For example, the City has reviewed leases entered into by the City as lessor and was able to increase the lease rate on some of those leases. The City has also improved management of waterfront properties by initiating the lease renewal process to include market lease rates that will increase, as recurring revenues over the term of the lease. The City also has become more diligent in the collection of lease payments due. This action has caused the delinquency rate on such leases to decrease to 2%. The overall collection effort, particularly code enforcement liens and unsafe structure and lot clearing special assessments, continues to be a high priority. The early results have been favorable as collections have shown signs of increasing. In addition, the City received from a major lessee, Jungle Island, the first payment in a series of payments that had been previously deferred (see Note 3- Receivables for more information). In an effort to reduce expenditures, the City has been able to negotiate with the unions and achieve reductions in the approximate range of $75-$100 million over the last three years and kept costs from rising, leaving expenditures flat. Such reduction is primarily attributable to the decrease in contributions to health care and pension costs. Capital Improvement Plan In order to meet the service demands of residents and visitors, the City continues to address the long-term financing necessary in order to fund the capital projects essential to the creation, improvement, enhancement, and preservation of public facilities and infrastructure. The City’s six-year Capital Improvement Plan, covering the period from October 1, 2012 through September 30, 2018, has earmarked funding estimated at $568 million for 362 projects throughout the City. Streets and sidewalks projects account for the largest portion of the total Capital Plan funding at $145 million or 25.47%, Public Facilities projects represent the second largest portion of the plan at $111 million or 19.57%, and the Parks and Recreation projects are the third largest, accounting for $97 million, or 17.09%. Proceeds from the issuance of City bonds represent the largest share of funding for the Capital Improvement Plan, accounting for 43.31% of the value. Capital project revenues (impact fees, storm water utilities, local option gas tax, etc.) account for 28.89%, and State grants account for 12.12%. The remaining funding comes from a combination of Federal, Miami-Dade County, and other private donations and grants. The City expects grant revenue to be consistent, while local option gas tax and citizen’s independent transportation tax revenues are projected to increase annually by 1.5% and 3% respectively.

x
Securities and Exchange Commission Investigations The City is cooperating with two SEC investigations. Both are detailed in Note 12 - Commitments and Contingencies. The first is under the heading Securities and Exchange Commission (SEC) Investigation: City Bond Offerings in 2007 and 2009 and the second is under the heading Securities and Exchange Commission (SEC) Investigation: Marlins Parking Garage. These two investigations could have a material effect on the City’s financial condition and operations. Internal Revenue Service Examination The City is cooperating with an IRS examination. It is detailed in Note 12 – Commitments and Contingencies under the heading of Internal Revenue Service Examination: $153,060,000 City of Miami, Florida Limited Ad Valorem Tax Refunding Bonds, Series 2007A (Homeland Defense/Neighborhood Capital Improvement Projects) and City of Miami, Florida Limited Ad Valorem Tax Bonds, Series 2007B (Homeland Defense/Neighborhood Capital Improvement Projects) dated July 10, 2007 (collectively, the “2007 Homeland Defense/Neighborhood Capital Improvement Bonds). This examination could have a material effect on the City’s future financial condition and operations. RELEVANT FINANCIAL POLICIES Debt Management Policy and Investment Management Policy The City adopted a Debt Management Policy on July 21, 1998 to provide guidance governing the issuance, management, continuing evaluation of and reporting on all debt obligations issued by the City and to provide for the preparation and implementation necessary to ensure compliance and conformity with the policy. It is the responsibility of the City’s finance committee to review and make recommendations regarding the issuance of debt obligations and the management of outstanding debt. The City’s debt management policy may be modified by the City Commission. The City adopted a detailed written investment policy on May 10, 2001, that applies to all cash and investments held or controlled by the City and identified as “general operating funds” of the City with the exception of the City’s Pension Funds, Deferred Compensation & Section 401(a) Plans, and such funds related to the issuance of debt where there are other existing policies or indentures in effect for such funds. Additionally, any future revenues, which have statutory investment requirements conflicting with the City’s Investment Policy and funds held by State agencies (e.g. Department of Revenue), are not subject to the provisions of the policy. The City is currently in compliance with its Debt and Investment Management Policies. More detailed information on either policy can be obtained by contacting the Treasury Management division of the Finance Department.

xi
Financial Integrity Principles On February 10, 2000, the City enacted Ordinance No. 11890 (“Financial Integrity Ordinance”) establishing thirteen financial integrity principles. The Financial Integrity Ordinance was enacted as a preventative measure setting forth financial practices that would prevent the recurrence of a financial emergency. The Financial Integrity Ordinance requires the City to establish three reserves: (1) a “contingency” reserve of $5,000,000 to fund unanticipated budget issues which arise or potential expenditure overruns which cannot be offset through other sources or actions; (2) an “unassigned” fund balance reserve equal to ten percent (10%) of the prior three years average of general revenues (excluding transfers and including the contingency reserves in (1) above) to fund unexpected mid-year revenue shortfalls or for an emergency such as a natural or man-made disaster, which threatens the health, safety and welfare of the City’s residents, businesses or visitors; and (3) an “assigned” reserve equal to ten percent (10%) of the prior three years average of general revenues (excluding transfers) to fund long-term liabilities and commitments of the City, such as compensated absences, self-insurance plan deficits and anticipated adjustments in pension plan payments resulting from market losses. The City’s General Fund reserves increased by $37.9 million during the year ended September 30, 2012. The City is not in compliance with the Financial Integrity Ordinance contingency reserve and unassigned fund balance reserve requirements. As of September 30, 2012, the City had approximately $50.3 million in its assigned fund balance and therefore is in compliance with the assigned fund balance reserve requirements of the Financial Integrity Ordinance. The Administration has a plan wherein the two (2) reserves identified within Financial Integrity Principle #5 would be restored over a two (2) to three (3) year period starting in fiscal year 2014. While the surplus experienced in fiscal year 2012 went a long way in reversing the trend of declines experienced in 2008 through 2009, the ultimate course will be determined by the City Commission in its review, consideration and ultimate approval of options provided in the plan submitted by the Administration. Failure to comply with the Financial Integrity Ordinance is not an event of default under the Ordinance. The City will strive to come into compliance with the Ordinance. However, there can be no assurance that the general fund reserves will reach or be maintained at the level required by the Financial Integrity Ordinance. City Management continues to implement balanced budgets and restore General Fund Reserves to required levels as quickly as reasonably possible. Risk Management – Self Insurance Program The City administers a self-insurance program for workers' compensation, tort liability, property, and group health and life insurance programs, subject to certain stop-loss provisions. The City also offers to its retirees comprehensive medical coverage and life insurance benefits through its self-insurance plan. The health and life insurance programs are administered by an independent administrator. The City funds the program on a pay as you go basis. Insurance coverage is maintained with independent carriers for property damage to City facilities. The City maintains excess coverage with independent carriers for workers' compensation and general liability.

xii
For the Fiscal Year 2013 Budget, the City created Internal Service Funds primarily to provide a mechanism that allows for both a cost allocation of pension, health insurance and worker’s compensation benefits in the operating departments and a centralized account from which payments are made. The Internal Service Funds are a financing mechanism and self-insurance reserve for those payments. Such funds are in accordance with generally accepted accounting principles and are allowed by GASB. Currently the administration is discussing the impact of any possible reporting changes for next fiscal year. Current Ratings & Other Actions During fiscal year 2012, the three credit rating agencies – Fitch, Moody’s, and Standards & Poor – affirmed our ratings. The Fitch rating specifically showed improvement and changed the outlook from negative to stable (see page 11). MAJOR INITIATIVES The City’s emphasis continues to be on its plan to restore, maintain and beautify urban and residential infrastructure through a program of major renovations and improvements to City parks, streets, sidewalks, and drainage systems. Some of the planned projects in Parks and Recreation include the design and/or construction of various community Buildings that include: The Coral Way NET Office Community Center, Bryan Park Community Center, Hadley Park New Youth Center and West End Park Community Building. In addition, enhancing Public Safety is a major initiative. The Fire Department is working with Capital Improvements toward the new design and construction of Fire Station 13 and 14. The Police Department plans to hire, train, and deploy officers through funding from a grant that was awarded by the Office of Community Oriented Policing Services. Public Facilities and Capital Improvements are planning the design and construction of a new Marine Stadium Marina at Virginia Key that is estimated to provide additional revenues to the City. In October 2012, the City announced the launch of its automated single stream recycling program. The process of collecting recyclables preserves the environment, decreases the City’s disposal costs, and extends the useful life of existing landfills. The Administration is also working on a business plan for the Finance Department which would include the review of the Finance Department’s organizational structure for operations and recommendations for structural improvements. CERTIFICATE OF ACHIEVEMENT The Government Finance Officers Association of the United States and Canada (GFOA) awarded a Certificate of Achievement for Excellence in Financial Reporting to the City of Miami, Florida for its Comprehensive Annual Financial Report (CAFR) for the fiscal year ended September 30, 2011. The Certificate of Achievement is the highest form of recognition in the area of governmental accounting and financial reporting. The attainment of this award represents a significant accomplishment by a government and its financial management team.


xiv
This page intentionally left blank


Backup documentation for amending budget resolution.
2 Management and Budget is an Office within the City Manager’s Office1 Acting/Interim
Community Redevelopment
AgencyPieter Bockweg
DowntownDevelopment
AuthorityAlyce Robertson
Miami ParkingAuthority
Arthur Noriega
CivilianInvestigative Panel
Carol Abia 1
General Employees &Sanitation Employees’
Retirement TrustSandra Elenberg
Bayfront Park Management Trust
Tim Schmand
Fire Fighter’s & PoliceO�cer’s Retirement
TrustRobert H. Nagle
Alice BravoAssistant City Manager /
Chief of Infrastructure
Other Agencies
Luis CabreraAssistant City Manager /
Chief of Operations
NETHaydee Wheeler
Grants AdministrationLillian Blondet
Community Development
George Mensah
Solid WasteKeith Carswell
Parks & RecreationJuan Pascual
GSARicardo Falero
Human ResourcesBeverly Pruitt
Code EnforcementJessica Angel-Capo1
Miami Sports &Exhibition Authority
Kirk Menendez
Public FacilitiesHenry Torre
Planning & ZoningFrancisco Garcia
Public WorksNzeribe Ihekwaba
BuildingMariano Fernandez
CIP & TransportationMark Spanioli
Information Technology
Cindy Torres 1
EODPAmy Klose
Management & Budget 2
Daniel J. Alfonso
Civil Service BoardTishria Mindingall
Risk ManagementCalvin Ellis
PurchasingKen Robertson
FinanceStephen Petty
Janice LarnedAssistant City Manager /
Chief Financial O�cer
CommunicationsAngel Zayon
Maurice KempFire-Rescue
Manuel OrosaPolice
Community Redevelopment
Agency
DowntownDevelopment
Authority
Miami ParkingAuthority
CivilianInvestigative Panel
General Employees &Sanitation Employees’
Retirement Trust
Bayfront Park Management Trust
Fire Fighter’s & PoliceO�cer’s Retirement
Trust
Assistant City Manager / Chief of Infrastructure
Other Agencies
Assistant City Manager / Chief of Operations
NET
Grants Administration
Community Development
Solid Waste
Parks & Recreation
GSA
Human Resources
Code Enforcement
Miami Sports &Exhibition Authority
Public Facilities
Planning & Zoning
Public Works
Building
Information Technology
EODP
Managementand Budget
Civil Service Board
Risk Management
Purchasing
Finance
Assistant City Manager / Chief Financial O�cer
Communications
CIP & Transportation
Fire-Rescue
Police
Residents of Miami
City CommissionChairman: F. Suarez
Vice-Chairman: M. Sarno�Commissioner: F. CarolloCommissioner: W. Gort
Commissioner: M. Spence-Jones Johnny MartinezChief Administrator / City Manager
Tomas P. RegaladoExecutive Mayor
City Attorney
Auditor General
City Clerk
O�ce of International Business Development
CITY OF MIAMI Table of Organization
i
FINANCIAL SECTION
REPORT OF INDEPENDENT CERTIFIED PUBLIC ACCOUNTANTS
MANAGEMENT’S DISCUSSION AND ANALYSIS
BASIC FINANCIAL STATEMENTS
(Government-Wide Financial Statements) (Fund Financial Statements)
NOTES TO THE FINANCIAL STATEMENTS
REQUIRED SUPPLEMENTARY INFORMATION
COMBINING AND INDIVIDUAL FUND
STATEMENTS AND SCHEDULES

Ernst & Young LLP Suite 3000 201 South Biscayne Boulevard Miami, FL 33131-5313 Tel: +1 305 358 4111 Fax: +1 305 415 1411 www.ey.com
A member firm of Ernst & Young Global Limited
1306-1095346 1
Report of Independent Certified Public Accountants
The Honorable Mayor, Members of the City Commission and City Manager City of Miami, Florida
We have audited the accompanying financial statements of the governmental activities, the aggregate discretely presented component units, each major fund, and the aggregate remaining fund information of the City of Miami, Florida (the City), as of and for the year ended September 30, 2012, which collectively comprise the City’s basic financial statements as listed in the table of contents. These financial statements are the responsibility of the City’s management. Our responsibility is to express opinions on these financial statements based on our audit. We did not audit the financial statements of the discretely presented component units which represent 100% of the assets and revenues of the aggregate discretely presented component units. We also did not audit the Firefighters’ and Police Officers’ Retirement Trusts and the General Employees’ and Sanitation Employees’ Retirement Trust and Other Managed Trusts, which represents 92% and 72% of the assets and revenues, respectively, of the aggregate remaining fund information. Those financial statements were audited by other auditors whose reports thereon have been furnished to us, and our opinions, insofar as they relate to the amounts included for the aggregate discretely presented component units and pension trust funds referred to above, are based on the reports of other auditors.
We conducted our audit in accordance with auditing standards generally accepted in the United States and the standards applicable to financial audits contained in Government Auditing Standards, issued by the Comptroller General of the United States. Those standards require that we plan and perform the audit to obtain reasonable assurance about whether the financial statements are free of material misstatement. We were not engaged to perform an audit of the City’s internal control over financial reporting. Our audit included consideration of internal control over financial reporting as a basis for designing audit procedures that are appropriate in the circumstances, but not for the purpose of expressing an opinion on the effectiveness of the City’s internal control over financial reporting. Accordingly, we express no such opinion. An audit also includes examining, on a test basis, evidence supporting the amounts and disclosures in the financial statements, assessing the accounting principles used and significant estimates made by management and evaluating the overall financial statement presentation. We believe that our audit and the reports of other auditors provide a reasonable basis for our opinions.
In our opinion, based on our audit and the reports of other auditors, the financial statements referred to above present fairly, in all material respects, the respective financial position of the governmental activities, the aggregate discretely presented component units, each major fund, and the aggregate remaining fund information of the City as of September 30, 2012, and the respective changes in financial position for the year then ended in conformity with US generally accepted accounting principles.
In accordance with Government Auditing Standards, we have also issued our report dated June 20, 2013 on our consideration of the City’s internal control over financial reporting and on our tests of its compliance with certain provisions of laws, regulations, contracts, and grant agreements and other matters. The purpose of that report is to describe the scope of our testing of internal control over financial

A member firm of Ernst & Young Global Limited
1306-1095346 2
reporting and compliance and the results of that testing, and not to provide an opinion on the internal control over financial reporting or on compliance. That report is an integral part of an audit performed in accordance with Government Auditing Standards and should be considered in assessing the results of our audit.
Accounting principles generally accepted in the United States require that management’s discussion and analysis, the budgetary comparison schedules – general fund and special obligations debt service fund, the schedule of funding progress (pensions), and the schedule of employer contributions (pensions) on pages 88 through 89, page 91, and page 92 be presented to supplement the basic financial statements. Such information, although not a part of the basic financial statements, is required by the Governmental Accounting Standards Board who considers it to be an essential part of financial reporting for placing the basic financial statements in an appropriate operational, economic or historical context. We and the other auditors have applied certain limited procedures to the required supplementary information in accordance with auditing standards generally accepted in the United States, which consisted of inquiries of management about the methods of preparing the information and comparing the information for consistency with management’s responses to our inquiries, the basic financial statements, and other knowledge we obtained during our audit of the basic financial statements. We and the other auditors do not express an opinion or provide any assurance on the information because the limited procedures do not provide us with sufficient evidence to express an opinion or provide any assurance.
Our audit was conducted for the purpose of forming opinions on the financial statements that collectively comprise the City’s basic financial statements. The combining and individual nonmajor fund financial statements and budgetary comparison schedules are presented for purposes of additional analysis and are not a required part of the basic financial statements. Such information is the responsibility of management and was derived from and relates directly to the underlying accounting and other records used to prepare the financial statements. The information has been subjected to the auditing procedures applied in the audit of the financial statements and certain additional procedures, including comparing and reconciling such information directly to the underlying accounting and other records used to prepare the financial statements or to the financial statements themselves, and other additional procedures in accordance with auditing standards generally accepted in the United States. In our opinion, the information is fairly stated in all material respects in relation to the financial statements as a whole.
Our audit was conducted for the purpose of forming opinions on the financial statements that collectively comprise the City’s basic financial statements. The introductory section and statistical section are presented for purposes of additional analysis and are not a required part of the basic financial statements. Such information has not been subjected to the auditing procedures applied in the audit of the basic financial statements and, accordingly, we do not express an opinion or provide any assurance on it.
June 20, 2013

3
MANAGEMENT’S DISCUSSION AND ANALYSIS
As management of the City of Miami, Florida (the “City”), we offer readers of the City’s financial
statements this narrative overview and analysis of the financial activities of the City for the fiscal year
ended September 30, 2012. We encourage readers to consider the information presented here in conjunction
with additional information that we have furnished in our letter of transmittal, which can be found on pages
iii – xiii of this report.
USING THIS ANNUAL REPORT
This discussion and analysis is intended to serve as an introduction to the City’s basic financial statements.
The City’s basic financial statements are comprised of three components: 1) government-wide financial
statements 2) fund financial statements, and 3) notes to the financial statements. This report also contains
other supplementary information in addition to the basic financial statements themselves.
FINANCIAL HIGHLIGHTS
The assets of the City exceeded its liabilities at the close of the most recent fiscal year by $415.8
million.
The General Fund (the primary operating fund) is reflected on a current financial resource basis and
shows an increase in fund balance of $37.9 million from last fiscal year.
The City’s total debt for bonds and loans had a net decrease of $24.5 million (or 3.38%) as of the close
of the current fiscal year. The decrease included a $5.2 million dollar principal payment made by the
SEOPW CRA for the Wells Fargo Tunnel loan. The City did not issue any new or refunding debt
during the current fiscal year.
Government-Wide Financial Statements
The government-wide financial statements (see pages 13 – 14) are designed to be corporate-like, in that all
governmental activities are presented in columns that add to a total for the Primary Government. The focus
of the Statement of Net Assets (see page 13) is designed to be similar to bottom line results for the City and
its governmental activities. This statement reflects the governmental funds’ current financial resources
(short-term spendable resources) with capital assets and long-term obligations. The primary government of
the City does not report any business-type activities for financial reporting purposes.
The Statement of Activities (see page 14) is focused on both the gross and net cost of various functions
(including governmental activities and component units), which are supported by the government’s general
tax and other revenues. This is intended to summarize and simplify the user’s analysis of the cost of various
governmental services and/or component units.
Discretely presented component units, which are other governmental units over which the City can exercise
influence and/or may be obligated to provide financial subsidies, are presented as a separate column in the
government-wide financial statements. The focus of the statements is clearly on the primary government
and the presentation allows the user to address the relative relationship with the component units.
The governmental activities reflect the City’s basic services, including police, fire, solid waste collection,
parks and cultural activities, and general administration. Property taxes, other local taxes, and grants finance
the majority of these activities.

4
Fund Financial Statements
Fund financial statements have traditionally been presented in the Comprehensive Annual Financial Report
(the “CAFR”). A fund is a set of self-balancing accounts that are segregated for the purpose of carrying on
specific activities or attaining certain objectives, as required by special regulations, restrictions or
limitations. The City’s funds can be divided into two categories: governmental funds and fiduciary funds.
Traditional users of governmental financial statements will find the Fund Financial Statements’ presentation
more familiar. Their focus is on the City’s major funds. The fund financial statements provide more
information about the City’s most significant funds – not the City as a whole.
The City’s fund types:
Governmental Funds – Governmental funds account for most of the City’s basic services, which are
reported as governmental activities in the government wide statements. Fund statements, however, use the
modified accrual basis of accounting and current financial resources measurement focus. The aim of the
statements is to report the near-term (current) inflows and outflows, and the balances of spendable financial
resources at the end of the fiscal year. The statements provide a short-term view of the City’s ability to
finance its programs in the near future, in contrast to the long-term view provided by the government-wide
statements. To facilitate the comparison between the governmental funds and governmental activities, a
reconciliation is provided (see pages 16 & 18)
The City maintains forty individual governmental funds. Information is presented separately in the
governmental fund Balance Sheets and in the governmental fund Statement of Revenues, Expenditures and
Changes in Fund Balances for the General Fund, Special Obligation Bonds Debt Service Fund, Public
Safety Capital Projects Fund, General Government Capital Projects Fund, and the Streets and Sidewalks
Capital Projects Fund, which are considered to be major funds. Data from the other thirty-five
governmental funds are combined into a single, aggregated presentation. Individual fund data for each of
these non-major governmental funds is provided in the form of combining statements elsewhere in this
report.
The City adopts an annual appropriated budget for its General Fund, Special Revenue Funds, and Debt
Service Funds. Budgetary comparison schedules have been provided for the General Fund and Special
Obligation Bonds Debt Service Fund to demonstrate compliance with the budget. Such information is
presented as required supplementary information.
The basic governmental fund financial statements can be found on pages 15 – 18 of this report.
Fiduciary Funds – These funds are used to account for resources held for the benefit of parties outside the
City. Fiduciary funds are not reflected in the government-wide financial statements because the resources
of these funds are not available to support the City’s own programs.
The basic fiduciary fund financial statements can be found on pages 19 – 20 of this report.
Notes to the Financial Statements – The notes provide additional information that is essential to a full
understanding of the data provided in the government-wide and fund financial statements. The notes to the
financial statements can be found on pages 25 – 87 of this report.
Other Information – In addition to the basic financial statements and accompanying notes, this report also
presents certain required supplementary information concerning budgetary comparisons and the City’s
progress in funding its obligations to provide pension benefits to its employees. Required supplementary
information can be found on pages 88 – 90 of this report.

5
The combining statements referred to earlier in connection with non-major governmental funds are
presented immediately following the required supplementary information. Combining and individual fund
statements and schedules can be found on pages 93 – 135 of this report.
GOVERNMENT-WIDE FINANCIAL ANALYSIS
As noted earlier, net assets may serve over time as a useful indicator of a government’s financial position.
In the case of the City, assets exceed liabilities by $415.8 million at the close of the most recent fiscal year.
The largest portion of the City’s net assets reflects its investment in capital assets (e.g. infrastructure, land,
buildings, machinery and equipment); less any related debt used to construct or acquire those assets that is
still outstanding. The City uses these capital assets to provide services to citizens; consequently, these
assets are not available for future spending. Although the City’s investment in capital assets is reported net
of related debt, it should be noted that the resources needed to repay this debt must be provided from other
sources, since the capital assets themselves cannot be used to liquidate these liabilities. As of September
30, 2012, the City’s Net Assets Invested in Capital Assets net of Related Debt were approximately $657.5
million.
Approximately 21.7% of the City’s net assets represent resources that are subject to restrictions on how they
may be used. As of September 30, 2012 the City’s Restricted Net Assets were approximately $90.1 million.
The remaining unrestricted net assets deficit of approximately $331.8 million is primarily due to
outstanding borrowings for which there are no off-setting assets, along with an increase in claims payable,
pension obligation, and the recognition of the City’s Other Post Employment Benefits liability. The
following schedule reflects a summary of net assets compared to the prior year:
2012 2011 Change % Change
Current and other assets 507,737,064$ 528,278,910$ (20,541,846)$ -3.89%
Capital assets 1,157,017,199 1,160,899,016 (3,881,817) -0.33%
Total assets 1,664,754,263 1,689,177,926 (24,423,663) -1.45%
Other liabilities 209,340,752 150,725,759 58,614,993 38.89%
Long-term liabilities 1,039,660,001 1,090,608,755 (50,948,754) -4.67%
Total liabilities 1,249,000,753 1,241,334,514 7,666,239 0.62%
Net assets:
Invested in capital assets, net of debt 657,451,573 693,247,304 (35,795,731) -5.16%
Restricted 90,077,677 95,873,418 (5,795,741) -6.05%
Unrestricted (Deficit) (331,775,740) (341,277,310) 9,501,570 -2.78%
Total net assets 415,753,510$ 447,843,412$ (32,089,902) -7.17%
Governmental Activities
Summary of Net Assets as of September 30, 2012

6
The following table provides a summary of the City’s changes in net assets for the fiscal years ended
September 30, 2012 and 2011.
2012 2011 Change % Change
Revenues:
Program revenues:
Charges for services 166,731,223$ 153,560,915$ 13,170,308$ 8.58%
Operating grants and contributions 88,607,745 94,339,110 (5,731,365) -6.08%
Capital grants and contributions 29,302,530 21,824,134 7,478,396 34.27%
General revenues:
Property taxes 250,273,095 261,325,155 (11,052,060) -4.23%
Franchise taxes 44,649,826 44,881,126 (231,300) -0.52%
State revenue sharing - unrestricted 12,367,171 11,429,920 937,251 8.20%
Sales and other use taxes 25,803,387 25,987,633 (184,246) -0.71%
Public services tax 58,045,986 59,426,883 (1,380,897) -2.32%
Investment earnings - unrestricted 2,825,787 2,393,381 432,406 18.07%
Other - 1,087,268 (1,087,268) 100.00%
Total revenues 678,606,750 676,255,525 2,351,225 0.35%
Expenses:
General government 104,494,781 155,563,797 (51,069,016) -32.83%
Planning and development 16,396,997 10,945,321 5,451,676 49.81%
Community development 38,099,612 40,875,284 (2,775,672) -6.79%
Community redevelopment areas 17,040,767 4,695,820 12,344,947 262.89%
Public works 83,062,109 66,183,960 16,878,149 25.50%
Public safety 352,869,205 340,739,499 12,129,706 3.56%
Public facilities 16,330,343 11,303,648 5,026,695 44.47%
Parks and recreation 44,977,172 39,547,833 5,429,339 13.73%
Interest on long-term debt 37,425,666 43,336,330 (5,910,664) -13.64%
Contribution to Port Tunnel - 50,000,000 (50,000,000) 100.00%
Total expenses 710,696,652 763,191,492 (52,494,840) -6.88%
Change in net assets (32,089,902) (86,935,967) 54,846,065 63.09%
Net assets - Beginning 447,843,412 534,779,379 (86,935,967) -16.26%
Net assets - Ending 415,753,510$ 447,843,412$ (32,089,902)$ -7.17%
Changes in Net Assets
Governmental Activities
Governmental Activities – As noted earlier, governmental activities decreased the City’s net assets by
approximately $32.1 million. The major changes are as follows:
Charges for services increased by $13.2 million an 8.58% increase from prior year. The increase in revenue
is attributable to $3.7 million in revenue from the red light cameras, $1.1 million in parking facility charges,
$6.3 million in rental income and $2 million in building revenues. The above revenues were unanticipated
increases.
The decrease in operating grants and contributions of $5.7 million is the result of decreases in funding
received in the current year relative to the prior year; primarily related to a decrease in Community
Development.
The increase in capital grants and contributions of $7.5 million is attributable to grant revenues received
from FEMA funded activities.

7
Property taxes revenues decreased by approximately $11.1 million or 4.23% over the prior year. This
reduction is primarily due to a decrease in overall assessed property value.
Public Services Tax decreased by approximately $1.4 million due to decreased revenues resulting from the
change to the data plan in the communication taxes received from the State of Florida.
State Revenue Sharing and State Half Cent Taxes increased by $0.9 million from prior year.
Other Revenue decreased by approximately $1.1 million due to a one-time sale of land, in the prior year.
General Government expenses experienced a decrease of approximately $51.1 million from the prior year
due to a distribution of pension, health benefits and employee related costs to different governmental
functions. The decrease was distributed to all governmental activities of the City.
Planning and Development Department expenses experienced an increase of approximately $5.5 million
due to the merging of other departments into the Planning and Development Department, increasing both
personnel and operating costs.
Community Development expenses decreased by $2.8 million due to a reduction in operating costs and
funding.
Community Redevelopment Area (CRA) expenses increased by $12.3 million as a result of a $5 million
dollar principal payment and the $2.1 million interest payment of the City’s Wells Fargo Loan and an
increase in expenditures for the Access Improvement Project for the OMNI CRA.
Public Works Department expenses increased approximately $16.9 million due to an increase in personnel
and operating costs.
Public Safety experienced an increase of approximately $12.1 million in expenses from the prior year
primarily due to an increases in personnel and operating costs. The Fire Department finalized two Urban
Search and Rescue Initiative grants with an increase in expenditures for said grant.
Parks and Recreation Department expenses increased by $5.4 million due to an increase in operating costs
and primarily due to an increase in personnel costs.
Interest expense on long term debt and other related costs decreased by $5.9 million as a result of payments
of principal and interest on general and special obligations bonds including the first payment related to the
Miami Ballpark Garages and Retail debts.
Contribution expense decreased in 2012, as a one-time contribution to the State of Florida for the Port
Tunnel project was made for $50.0 million in prior year with no additional contributions, or loans, during
2012 related to that project.

8
0
50,000,000
100,000,000
150,000,000
200,000,000
250,000,000
300,000,000
350,000,000
400,000,000
Gen G
ovt
Pla
n &
Dev
Co
mm
Dev
Co
mm
Redev
Public W
ork
s
Pu
blic S
afe
ty
Public F
acil
itie
s
Park
s &
Rec
Pri
ncip
al
and I
nte
rest
Expenses and Program Revenues - Governmental Activities
Expenses Revenues
REVENUE BY SOURCE – GOVERNMENTAL ACTIVITIES
Charges for Services
24.57%
Operating Grants &
Contributions13.06%
Property Taxes36.88%
Capital Grants &
Contributions4.32%
Franchise
Taxes
6.58%Sales and Other Use
Taxes3.80%
State RevenueSharing
1.82%
Public Services
Taxes8.55%
InvestmentEarnings
.42%
Other0.00%

9
FINANCIAL ANALYSIS OF THE CITY’S FUNDS
As noted earlier, the City uses fund accounting to ensure and demonstrate compliance with finance related
legal requirements.
Governmental Funds – The focus of the City’s governmental funds is to provide information on near-term
inflows, outflows, and balances of spendable resources. Such information is useful in assessing the City’s
financing requirements. In particular, unassigned fund balance may serve as a useful measure of a
government’s net resources available for spending at the end of the fiscal year.
The General Fund is the chief operating fund of the City. At the end of the current fiscal year, the City’s
total general fund balance was $57.5 million (see pages 15 & 17). Of this amount, approximately $7.1
million (see page 15) is recorded as non-spendable for prepaid expenses. $50.4 million (see page 15) is
assigned fund balance in accordance with the City’s Financial Integrity Ordinance which requires 10% of
the average 3 years revenue to be designated as assigned fund balance.
General Fund’s fund balance had a net increase of $37.9 million (see page 17) during the current fiscal year.
Key factors in the overall increase were due to:
The imposed salary and benefit reductions approved by the City Commission reducing overall salaries,
pension and health benefits offset by reduction on revenues and reduction on inter-fund transfers.
The City was very diligent in creating stop-gaps in Fiscal Year 2012, by budgeting funds for one-time
payouts, uncollectable revenues and managing expenditures.
Financial highlights of the City’s other major governmental funds are as follows:
The Special Obligation Bond Debt Service Fund has a fund balance of approximately $32.3 million (see
page 15 & 17). This represents an increase of approximately $0.5 million (see page 17). The increase is
attributed to an increase in transfers in to maintain the restricted cash requirements per the official statement
of each bond.
The Street and Sidewalks Capital Projects Fund had a fund balance of $66 million as of September 30, 2012
(see pages 15 &17). This represents a decrease of approximately $35.5 million (see page 17). The decrease
can be attributed to 1) the transfer of $17.6 million to the Transportation & Transit Fund, a dedicated fund
created in fiscal year 2012 to isolate the Citizen’s Independent Transportation Trust funds appropriated to
qualifying street and sidewalk projects, and 2) $1.6 million for Venetian Causeway improvements, $1.8
million for Palm Grove Road Improvements, $1.0 million for Little River Industrial Park Improvements and
$13.5 million was spent over 95 smaller projects with expenditures of less than $0.05 million.
Public Safety Capital Projects Fund has a fund balance of $0.2 million (see pages 15 & 17); a decrease in
fund balance of $0.5 million (see page 17) from the prior year due primarily to increases in project costs.
The General Government Capital Project Fund has a fund balance of $58.9 million (see pages 15 & 17).
This represents a decrease of approximately $5.9 million (see page 17). The decrease can be attributed to
the continuation of projects funded out of this fund including $1.6 million for the ERP Integration Systems
project, $0.7 million for the Land Management System project, $0.9 million for the IT Modernization
project, $0.4 million for the Green Lab Construction project and $0.3 million for the damaged vehicle
replacement/repair project. The remaining $1.0 million is attributed to various smaller projects.

10
GENERAL FUND BUDGETARY HIGHLIGHTS
The significant variations between the original and final General Fund budget for Fiscal Year 2012 can be
summarized as follows (please see budget to actual comparison on page 88):
$ 4.1 million decreased allocation to the General Government Departments.
General Government Department budgets were decreased primarily due to the reductions in salaries and
group health benefits as imposed by the City Commission after the declaration of financial urgency.
CAPITAL ASSETS AND DEBT ADMINISTRATION
Capital Assets
At September 30, 2012, the City had a total of $1.2 billion (net of accumulated depreciation) invested in a
variety of capital assets as reflected in the following schedule, which represents a net decrease (additions
less retirements and depreciation) of $4.8 million (or 0.41%) from the end of the prior year.
Governmental
Activities
2012 2011 Change % Change
Land 93,583,975$ 92,726,315$ 857,660$ 0.92%
Construction-in-Progress 48,222,812 251,326,647 (203,103,835) -80.81%
Buildings 199,860,508 104,694,188 95,166,320 90.90%
Improvements 174,289,432 147,838,849 26,450,583 17.89%
Machinery and Equipment 55,703,178 49,647,636 6,055,542 12.20%
Infrastructure 585,357,294 514,665,381 70,691,913 13.74%
Total 1,157,017,199$ 1,160,899,016$ (3,881,817)$ -0.33%
Capital Assets at Year End
(Net of Depreciation)
Major capital asset events during the current fiscal year included the following:
Construction in progress decreased approximately $203 million due to the recognition of completed
projects, including the Marlins Parking Garage, Gibson Park and a number of other projects. The total
transfers out of projects from a non depreciable category to depreciable categories amounted to $269.9
million and an offset of $66.8 million in new expenditures for the remaining projects not yet completed
during Fiscal Year 2012.
The Infrastructure projects completed during the fiscal year included $84 million in Streets/Sidewalk/
Bridges, $20.1 million in Docks & Piers/Storm Drain Pipe Distributions/Waterways and $5.0 million in
Electrical Distributions.
The Improvement projects completed during the fiscal year included $46.8 million of completed
projects.
The transfers out of Construction-in-Progress to Buildings during the fiscal year was approximately
$103.5 million.
Additional information on the City’s capital assets can be found in Note 1 on page 33 and Note 5 on page
53 in the notes to the financial statements.

11
Long-Term Debt
At the end of the current fiscal year, the City had total debt outstanding of $702.3 million. Of this amount,
$25.4 million is backed by the full faith and credit of the City and $226.1 million is backed Limited Ad
Valorem Tax Revenue; the remainder represents Special Obligation, Revenue bonds and loans secured
solely by Non-Ad Valorem revenue source.
Governmental Activities
2012 2011 Change % Change
General Obligation Bonds 239,988,415$ 251,566,791$ (11,578,376)$ -4.60%
Special Obligation,
Revenue Bonds and Loans 462,338,660$ 475,292,475$ (12,953,815)$ -2.73%
Total 702,327,075$ 726,859,266$ (24,532,191)$ -3.38%
The City’s net debt decreased during the current fiscal year by $24.5 million (or 3.38%). This decrease can
be attributed to a reduction of principal in accordance with scheduled retirements of bond payments and
increased by $3.6 million for the financing of recycling bins financed using a three lease-purchase
agreement.
The City maintained its bond rating on its special obligation debt of BBB+ from Standard & Poor’s, A3
from Moody’s, and A- from Fitch Ratings.
Additional information on the City’s long-term liabilities can be found in Note 8 on pages 57 through 61 in
the notes to the financial statements.
ECONOMIC FACTORS AND NEXT YEAR’S BUDGET AND RATES
The budget process begins with the preparation of the financial outlook, a comprehensive review of
allocation needs that are expected to be required by the City for its operations. These allocations include a
review of salaries and wages (growth as dictated by negotiated union contracts), pension requirement needs,
anticipated insurance premium increases, etc. These allocation needs are then compared to the City’s
anticipated revenue inflows to determine whether these needs can be satisfied. It is with this analysis, along
with the Mayor and City Commissioners’ feedback, and the City’s comprehensive strategic plan, that the
guidelines for preparing the budget toolkit are determined and compiled into an all-inclusive instructional
booklet that is then distributed to departments for their use in preparing their budget submissions. The
City’s elected and appointed officials considered many factors when adopting the fiscal year 2012 budget.
Included among these factors were uncertainties regarding pension costs, health insurance costs, other post
employment benefit costs, and various other economic indicators.
The City of Miami, like many municipalities throughout the State, is slowly recovering from the economic
downturn of previous years. Recently approved property tax legislation, rising fuel prices, and increases in
utility costs continue to impact every resident and business in the City. Recently approved State legislation
along with a constitutional amendment passed by Florida voters, lowered the City’s taxable values while
establishing controls on its millage rate (discussed below). This legislation and amendment was also a clear
indication by the people of the State of Florida that not enough was done in the previous year to provide
property owners with tax relief.
In fiscal year 2012, the City did not change its operating millage rate of 7.571 mills with a unanimous vote
and anticipated to collect $215.4 million in property tax revenues. The millage rate recommended in the
fiscal year 2012 budget required City officials to fully understand the impact property taxes were having on
Miami residents and to become more effective in managing government finances.

12
The slow economic recovery has not only affected property tax values but also the unemployment rate. Per
the U.S. Department of Labor, the unemployment rate for South Florida is currently 8.1% which is a 3.4%
decrease from the prior year. This rate is lower than the State’s average unemployment rate of 8.7% and
equal to the national average rate of 8.1%. The region’s inflation rate of 2.0% is significantly higher than
the national indices of 1.6%.
The City is currently monitoring and managing its limited resources to address the current state of its
General Fund balance. The City has in place a financial integrity ordinance that requires the City to have a
20% reserve on the average of the last three years General Fund revenues. The 20% reserve requirement is
comprised of two designations of reserves. The first 10% is assigned and the second 10% is unassigned.
The City was out of compliance with this requirement on September 30, 2012. Over the last two years the
City has been actively pursuing various options to replenish the reserves without impacting the residents
monetarily or by reduction in services. To that end, the City Commission approved changes to employee
wages and benefits during the budget process which resulted in reductions to the overall budget of
approximately $72 million.
FINANCIAL CONTACT
The City’s financial statements are designed to present users (citizens, taxpayers, customers, investors, and
creditors) with a general overview of the City’s finances and to demonstrate the City’s accountability. If
users have questions about the report or need additional financial information, they should contact Director
of the City of Miami’s Finance Department, 444 Southwest 2nd
Avenue, Suite 618, Miami, Florida 33130,
or visit the City’s web site at www.miamigov.com.

13
City of Miami, FloridaStatement of Net Assets
Governmental Component Activities Units
AssetsCash, Cash Equivalents, and Investments 271,638,806$ 24,895,991$ Receivables - Net 33,920,665 1,280,371 Accrued Interest 223,439 6,100 Due from Other Governments 32,018,391 367,780 Inventory 926,141 - Prepaids 7,140,534 602,497 Other Assets 68,858 541,833 Cash, Cash Equivalents, and Investments
related to Bond Proceeds 125,061,559 - Restricted Cash, Cash Equivalents, and Investments 27,030,705 7,558,691 Capital Assets:
Non-Depreciable 141,806,787 15,458,232 Depreciable - Net 1,015,210,412 62,427,951
Deferred Charges 9,707,966 1,881,249 Total Assets 1,664,754,263 115,020,695
LiabilitiesAccounts Payable and Accrued Liabilities 42,628,838 3,410,297 Due to Other Governments 1,075,334 1,397,461 Unearned Revenue 19,210,311 575,728 Deposits 6,277,836 146,867 Accrued Interest Payable 10,338,561 1,767,354
Due Within One Year:Bonds and Loans Payable 71,187,820 1,110,000 Compensated Absences 7,965,982 426,583 Claims Payable 52,664,602 -
Non-Current LiabilitiesDue In More Than One Year:
Bonds and Loans Payable 656,328,173 69,508,573 Compensated Absences 58,286,352 301,177 Claims Payable 162,062,454 - Other Post Employment Benefits 156,418,000 71,324 Net Pension Obligation 4,556,490 -
Total Liabilities 1,249,000,753 78,715,364
Net AssetsInvested in Capital Assets - Net of Related Debt 657,451,573 13,979,892 Restricted for:
Capital Projects - 107,460 Debt Service 32,792,396 960,297 Parking Waiver - 462,362 Law Enforcement 3,681,724 - Community Redevelopment 44,816,027 - Choice Housing Voucher Program 298,044 - E-911 8,489,486 -
Unrestricted (Deficit) (331,775,740) 20,795,320 Total Net Assets 415,753,510$ 36,305,331$
The accompanying notes are an integral part of the financial statements.
September 30, 2012

14
City of Miami, FloridaStatement of Activities
For the Year Ended September 30, 2012
Net (Expenses) Revenue and Changes Program Revenues in Net Assets
Operating Capital Primary GovernmentFunctions/Programs Activities: Charges for Grants and Grants and Governmental ComponentPrimary Government: Expenses Services Contributions Contributions Activities Units
Governmental Activities:General Government 104,494,781$ 51,263,550$ 11,365,699$ 18,647,237$ (23,218,295)$ -$ Planning and Development 16,396,997 15,327,935 16,500 - (1,052,562) - Community Development 38,099,612 709,171 35,712,144 - (1,678,297) - Community Redevelopment Areas 17,040,767 39,141 973,332 - (16,028,294) - Public Works 83,062,109 41,533,411 - 6,436,162 (35,092,536) - Public Safety 352,869,205 23,321,360 39,288,116 - (290,259,729) - Public Facilities 16,330,343 27,352,799 - 2,812,967 13,835,423 - Parks and Recreation 44,977,172 7,183,856 1,251,954 1,406,164 (35,135,198) - Interest on Long-Term Debt 37,425,666 - - - (37,425,666) -
Total primary government 710,696,652$ 166,731,223$ 88,607,745$ 29,302,530$ (426,055,154) -
Component Units:Miami Sports Exhibition Authority 59,987$ 2$ -$ -$ - (59,985) Department of Off-Street Parking 27,969,177 26,513,580 - - - (1,455,597) Downtown Development Authority 5,170,683 - - - - (5,170,683) Bayfront Park 3,773,762 3,735,868 - - - (37,894) Coconut Grove BID 1,438,233 - - - - (1,438,233) Civilian Investigative Panel 363,040 - 432,000 - - 68,960
Total component units 38,774,882$ 30,249,450$ 432,000$ -$ - (8,093,432)
General Revenues: Taxes: Property Taxes, levied for general purposes 223,386,063 6,102,995 Property Taxes, levied for debt service 26,887,032 - Gain on Sale of Property and Equipment - 2,479,520 Franchise Taxes 44,649,826 - State Revenue Sharing - Unrestricted 12,367,171 - Sales and Other Use Taxes 25,803,387 - Public Service Taxes 58,045,986 - Investment Earnings - Unrestricted 2,825,787 375,642 Other - 255,413 Total General Revenues 393,965,252 9,213,570 Change in Net Assets (32,089,902) 1,120,138 Net assets - Beginning 447,843,412 35,185,193 Net assets - Ending 415,753,510$ 36,305,331$
The accompanying notes are an integral part of the financial statements.

15
City of Miami, FloridaBalance Sheet
Governmental Funds
OtherSpecial Non-Major Total
Obligation Public General Street & Governmental GovernmentalGeneral Bonds Safety Government Sidewalks Funds Funds
AssetsPooled Cash, Cash Equivalents and Investments 53,341,988$ 13,635,317$ 11,364,699$ 59,261,986$ 70,760,563$ 188,335,812$ 396,700,365$ Restricted Cash, Cash Equivalents, and Investments - 18,397,777 199,328 - - 8,433,600 27,030,705 Receivables
(Net of Allowance for Uncollectibles):Accounts 20,500,822 250,000 - - - 2,962,394 23,713,216 Loans Receivable 179,502 - - - - - 179,502 Property Taxes 9,036,487 - - - - 991,460 10,027,947 Due from Other Governments 6,863,521 - 4,783 370,484 1,392,417 23,387,186 32,018,391
Due from Other Funds 5,469,657 - - - - - 5,469,657 Accrued Interest 96,403 - - 7,413 85,947 33,676 223,439 Prepaids 7,140,534 - - - - - 7,140,534 Other Assets 68,858 - - - - - 68,858
Total Assets 102,697,772$ 32,283,094$ 11,568,810$ 59,639,883$ 72,238,927$ 224,144,128$ 502,572,614$
Liabilities and Fund BalancesLiabilities:
Accounts Payable and Accrued Liabilities 20,640,586$ -$ 457,358$ 414,176$ 4,899,684$ 16,217,034$ 42,628,838$ Due to Other Funds - - - - - 5,469,657 5,469,657 Due to Other Governments - - - - - 1,075,334 1,075,334 Deferred or Unearned Revenues 18,565,189 - 10,910,612 370,483 1,330,312 15,269,929 46,446,525 Deposits 5,948,145 - - - - 329,691 6,277,836
Total Liabilities 45,153,920 - 11,367,970 784,659 6,229,996 38,361,645 101,898,190
Fund Balances (Deficit):Non-Spendable Fund Balance
Non Spendable 7,140,534 - - - - 1,000,000 8,140,534 Spendable Fund Balance
Restricted - 32,283,094 457,155 55,422,484 64,817,603 180,203,770 333,184,106 Committed - - - 2,525,892 1,191,328 12,794,918 16,512,138 Assigned 50,403,318 - - 906,848 - 851,193 52,161,359 Unassigned - - (256,315) - - (9,067,398) (9,323,713) Total Fund Balances 57,543,852 32,283,094 200,840 58,855,224 66,008,931 185,782,483 400,674,424
Total Liabilities and Fund Balances 102,697,772$ 32,283,094$ 11,568,810$ 59,639,883$ 72,238,927$ 224,144,128$ 502,572,614$
The accompanying notes are an integral part of the financial statements.
Major Funds
September 30, 2012
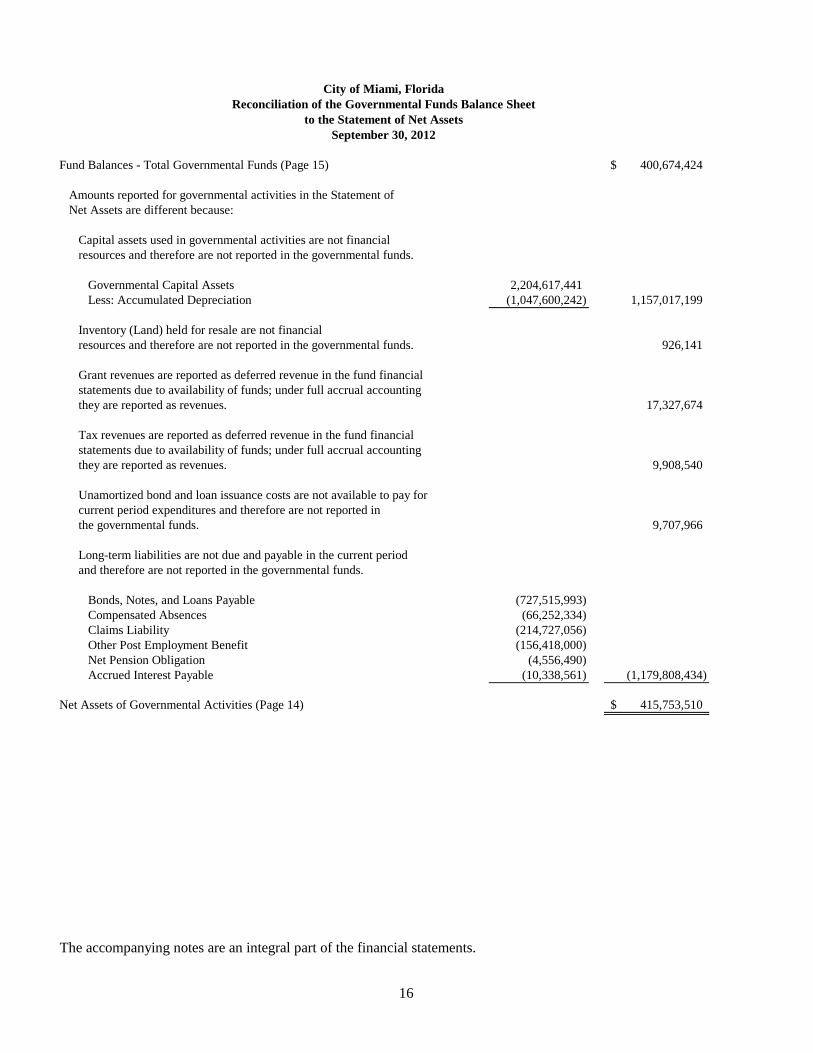
16
City of Miami, FloridaReconciliation of the Governmental Funds Balance Sheet
to the Statement of Net Assets
Fund Balances - Total Governmental Funds (Page 15) 400,674,424$
Amounts reported for governmental activities in the Statement ofNet Assets are different because:
Capital assets used in governmental activities are not financialresources and therefore are not reported in the governmental funds.
Governmental Capital Assets 2,204,617,441Less: Accumulated Depreciation (1,047,600,242) 1,157,017,199
Inventory (Land) held for resale are not financialresources and therefore are not reported in the governmental funds. 926,141
Grant revenues are reported as deferred revenue in the fund financialstatements due to availability of funds; under full accrual accounting they are reported as revenues. 17,327,674
Tax revenues are reported as deferred revenue in the fund financialstatements due to availability of funds; under full accrual accountingthey are reported as revenues. 9,908,540
Unamortized bond and loan issuance costs are not available to pay forcurrent period expenditures and therefore are not reported in the governmental funds. 9,707,966
Long-term liabilities are not due and payable in the current periodand therefore are not reported in the governmental funds.
Bonds, Notes, and Loans Payable (727,515,993)Compensated Absences (66,252,334)Claims Liability (214,727,056)Other Post Employment Benefit (156,418,000)Net Pension Obligation (4,556,490)Accrued Interest Payable (10,338,561) (1,179,808,434)
Net Assets of Governmental Activities (Page 14) 415,753,510$
The accompanying notes are an integral part of the financial statements.
September 30, 2012

17
City of Miami, FloridaStatement of Revenues, Expenditures and Changes In Fund Balances (Deficit)
Governmental FundsFor The Year Ended September 30, 2012
OtherSpecial Non-Major Total
Obligation Public General Street & Governmental GovernmentalGeneral Bonds Safety Government Sidewalks Funds Funds
RevenuesProperty Taxes 209,126,414$ -$ -$ -$ -$ 41,146,681$ 250,273,095$ Franchise and Other Taxes 102,489,740 - - - - 21,740 102,511,480 Licenses and Permits 35,655,699 - - - - 69,872 35,725,571 Fines and Forfeitures 4,808,276 - - - - 730,208 5,538,484 Intergovernmental Revenues 56,176,739 3,000,000 422,008 10,909 1,767,790 91,009,963 152,387,409 Charges for Services 91,413,221 - 294,727 13,891 - 14,993,769 106,715,608 Interest 2,418,809 37,533 - 94,995 96,691 177,759 2,825,787 Impact Fees - - - 4,337,998 - - 4,337,998 Other 11,373,919 - - 207,305 - 3,352,432 14,933,656
Total Revenues 513,462,817 3,037,533 716,735 4,665,098 1,864,481 151,502,424 675,249,088
ExpendituresCurrent Operating:
General Government 51,631,428 - - 2,803,481 2,370,375 9,288,204 66,093,488 Planning and Development 7,706,052 - - - - 216,316 7,922,368 Community Development - - - - - 36,706,327 36,706,327 Community Redevelopment Areas - - - - - 22,040,767 22,040,767 Public Works 48,876,063 - - - - 72,897 48,948,960 Public Safety 190,369,730 - 618,445 - - 30,077,639 221,065,814 Public Facilities 4,162,439 - - - - 8,546,003 12,708,442 Parks and Recreation 22,857,751 - - - - 3,021,662 25,879,413 Risk Management 48,659,416 - - - - - 48,659,416 Pensions 72,843,201 - - - - - 72,843,201
Debt Service:Principal - 11,120,815 - - - 11,813,375 22,934,190 Interest and Other Charges - 27,402,989 - - - 13,782,472 41,185,461
Capital Outlay 17,389 - 2,075,876 824,080 16,326,613 47,653,169 66,897,127 Total Expenditures 447,123,469 38,523,804 2,694,321 3,627,561 18,696,988 183,218,831 693,884,974
Excess (Deficiency) of RevenuesOver (Under) Expenditures 66,339,348 (35,486,271) (1,977,586) 1,037,537 (16,832,507) (31,716,407) (18,635,886)
Other Financing Sources (Uses)Transfers In 4,590,247 35,968,904 1,527,891 3,435,369 6,529,814 62,211,003 114,263,228 Transfers Out (33,029,917) - (25,000) (10,335,662) (25,151,319) (45,721,330) (114,263,228)
Total Other Financing Sources (Uses) (28,439,670) 35,968,904 1,502,891 (6,900,293) (18,621,505) 16,489,673 -
Net Changes in Fund Balances 37,899,678 482,633 (474,695) (5,862,756) (35,454,012) (15,226,734) (18,635,886)
Fund Balances - Beginning 19,644,174 31,800,461 675,535 64,717,980 101,462,943 201,009,217 419,310,310
Fund Balances - Ending 57,543,852$ 32,283,094$ 200,840$ 58,855,224$ 66,008,931$ 185,782,483$ 400,674,424$
The accompanying notes are an integral part of the financial statements.
Major Funds

18
Net Changes in Fund Balances - Total Governmental Funds (Page 17) (18,635,886)$
Amounts reported for governmental activities in the Statement of Activities are different because:
Grant revenues are reported as deferred revenue in the fund financial statements due to availabilityof funds; under full accrual accounting they are reported as revenues. 12,806,140
Revenues in the statement of activities for the previous year provided current financial resources and,as such, are reported as revenues in the funds for the current year. (9,448,478)
Governmental funds report capital outlays as expenditures. However, in the Statement of Activitiesthe cost of these assets is depreciated over their estimated useful lives.
Expenditures for Capital Assets 69,666,820$ Less: Current Year Depreciation (77,148,634)
(7,481,814)
Purchase of Property held for resale is reported as Inventory in Statement of Net Assets 378,033
Principal Paid on Bonds and Loans 28,132,190 Net effect of Deferring and Amortizing Issuance Costs, Premiums, Discounts, and Accretion 3,322,859 31,455,049
Some items reported in the Statement of Activities do not require the use of current financial resources and therefore are not reported as expenditures in governmental funds.
Compensated Absences 2,576,319 Claims Payable (6,785,454) Other Post Employment Benefits (37,211,453) Net Pension Obligation 18,706 Accrued Interest Payable 238,936 (41,162,946)
Change in Net Assets of Governmental Activities (Page 14) (32,089,902)$
The accompanying notes are an integral part of the financial statements.
For the Year Ended September 30, 2012
City of Miami, FloridaReconciliation of the Statement of Revenues, Expenditures
and Changes in Fund Balances of Governmental Fundsto the Statement of Activities

19
City of Miami, FloridaStatement of Fiduciary Net Assets
Fiduciary FundsSeptember 30, 2012
EmployeeRetirement
FundsAssets
Cash and Short-Term Investments 53,362,658$ Accounts Receivable 22,090,851 Capital Assets 4,154,789
79,608,298
InvestmentsU.S. Government Obligations 328,776,874 Corporate Bonds 348,490,256 Corporate Stocks 809,155,878 Money Market Funds and Commercial Paper 35,572,188 International Equity 222,966,793 Mutual Funds 168,278,569 Real Estate 150,205,708 Private Equity 43,900,769
Total Investments 2,107,347,035
Securities Lending Collateral 276,817,344 Total Assets 2,463,772,677
LiabilitiesObligations Under Security Lending 276,817,344 Accounts Payable 1,416,447 Accrued Liabilities 168,282,338 Payable for Securities Purchased 17,378,121
Total Liabilities 463,894,250
Net AssetsHeld in Trust for Pension Benefits 1,999,878,427$
The accompanying notes are an integral part of the financial statements.

20
City of Miami, FloridaStatement of Changes in Fiduciary Net Assets
Fiduciary FundsFor the Year Ended September 30, 2012
EmployeeRetirement
FundsAdditions
Contributions:Employer 72,215,216$ Plan Members 17,070,474
Total Contributions 89,285,690
Investment Earnings:Net Increase in Fair
Value of Investments 262,984,978 Interest 33,265,050 Dividends 15,967,718 Other 369,094
Total Investment Earnings 312,586,840
Security Lending Activities:Security Lending Income 859,839 Security Lending Fees and Rebates (214,836) Unrealized Gain 54,366
Net Income From Security Lending Activities 699,369
Less Investment Expenses 7,848,391 Net Investment Earnings 304,738,449
Reimbursement from City for Administrative Costs 3,209,232 Total Additions 397,932,740
DeductionsBenefit Payments 197,209,425 Refunds upon Resignation, Death, etc. 2,439,259 Distribution to Retirees 17,747,481 Administrative and Other Deduction 3,325,958
Total Deductions 220,722,123 Change in Net Assets 177,210,617 Net Assets - Beginning of Year 1,822,667,810 Net Assets - End of Year 1,999,878,427$
The accompanying notes are an integral part of the financial statements.

21
City of Miami, FloridaStatement of Net Assets
Discretely Presented Component Units
Miami Sports Department Downtown Bayfront Park Coconut Civilianand Exhibition of Off-Street Development Management Grove Investigative
Authority Parking Authority Trust BID Panel TotalAssets
Cash, Cash Equivalents and Investments 606,944$ 10,311,937$ 4,910,146$ 5,131,607$ 3,630,231$ 305,126$ 24,895,991$ Receivables (Net)
Accounts - 401,469 124,328 13,603 740,971 - 1,280,371 Accrued Interest - 6,100 - - - - 6,100 Due From Other Governments - 367,780 - - - - 367,780 Prepaids 7,605 446,505 128,024 14,405 5,958 602,497 Other Assets - 541,833 - - - - 541,833 Restricted Assets:
Cash, Cash Equivalents, and Investments - 7,558,691 - - - - 7,558,691 Capital Assets:
Non-Depreciable - 14,942,103 - 516,129 - - 15,458,232 Depreciable, Net - 57,652,277 136,158 4,639,516 - - 62,427,951
Deferred Charges - 1,881,249 - - - - 1,881,249 Total Assets 614,549 94,109,944 5,298,656 10,315,260 4,377,160 305,126 115,020,695
LiabilitiesAccounts Payable and Accrued Liabilities - 2,282,137 793,865 73,484 229,815 30,996 3,410,297 Due to Other Governments - 1,397,461 - - - - 1,397,461 Unearned Revenue - 393,882 - 181,846 - - 575,728 Deposits - 131,432 - 15,435 - - 146,867 Accrued Interest Payable - 1,767,354 - - - - 1,767,354 Non-Current Liabilities
Due Within One Year:Bonds and Loans Payable - 1,110,000 - - - - 1,110,000 Compensated Absences - 426,583 - - - - 426,583
Due In More Than One Year:Bonds and Loans Payable - 69,508,573 - - - - 69,508,573 Other Post-Employment Benefit Obligation - 71,324 - - - - 71,324 Compensated Absences - 150,308 150,869 - - - 301,177
Total Liabilities - 77,239,054 944,734 270,765 229,815 30,996 78,715,364
Net AssetsInvested in Capital Assets, Net of Related Debt - 8,688,089 136,158 5,155,645 - - 13,979,892 Restricted for:
Capital Projects 107,460 - - - - - 107,460 Debt Service - 960,297 - - - - 960,297 Parking Waiver - - - - 462,362 - 462,362
Unrestricted 507,089 7,222,504 4,217,764 4,888,850 3,684,983 274,130 20,795,320 Total Net Assets 614,549$ 16,870,890$ 4,353,922$ 10,044,495$ 4,147,345$ 274,130$ 36,305,331$
The accompanying notes are an integral part of the financial statements.
September 30, 2012

22
City of Miami, FloridaStatement of Activities
Discretely Presented Component UnitsFor the Year Ended September 30, 2012
Program Revenues
OperatingCharges for Grants and
Expenses Services ContributionsMiami Sports
Exhibition AuthorityCulture and Recreation 59,987$ 2$ -$ Total Miami Sports Exhibition Authority 59,987 2 -
Departmentof Off-Street Parking
Transportation 27,969,177 26,513,580 - Total Department of Off-Street Parking 27,969,177 26,513,580 -
DowntownDevelopment Authority
Economic Development 5,170,683 - - Total Downtown Development Authority 5,170,683 - -
Bayfront ParkParks and Recreation 3,773,762 3,735,868 - Total Bayfront Park 3,773,762 3,735,868 -
Coconut Grove BIDGeneral Government 1,438,233 - - Total Coconut Grove BID 1,438,233 - -
Civilian Investigative PanelGeneral Government 363,040 - 432,000 Total Civilian Investigative Panel 363,040 - 432,000
Total Component Units 38,774,882$ 30,249,450$ 432,000$
General Revenues: Taxes: Property Taxes, levied for general purposes Investment Earnings Gain on Disposal of Property Other Total General Revenues Change in Net AssetsNet assets - BeginningNet assets - Ending
The accompanying notes are an integral part of the financial statements.

23
Net (Expense) Revenue andChanges in Net Assets
Miami Sports Department Downtown Bayfront Park Coconut Civilianand Exhibition of Off-Street Development Management Grove Investigative
Authority Parking Authority Trust BID Panel Totals
(59,985)$ -$ -$ -$ -$ -$ (59,985)$ (59,985) - - - - - (59,985)
- (1,455,597) - - - - (1,455,597) - (1,455,597) - - - - (1,455,597)
- - (5,170,683) - - - (5,170,683) - - (5,170,683) - - - (5,170,683)
- - - (37,894) - - (37,894) - - - (37,894) - - (37,894)
- - - - (1,438,233) - (1,438,233) - - - - (1,438,233) - (1,438,233)
- - - - - 68,960 68,960 - - - - - 68,960 68,960
(59,985)$ (1,455,597)$ (5,170,683)$ (37,894)$ (1,438,233)$ 68,960$ (8,093,432)
- - 4,497,950 - 1,605,045 - 6,102,995 508 79,389 8,721 258 286,766 - 375,642
- 2,479,520 - - - - 2,479,520 - - 154,763 100,650 - - 255,413
508 2,558,909 4,661,434 100,908 1,891,811 - 9,213,570 (59,477) 1,103,312 (509,249) 63,014 453,578 68,960 1,120,138 674,026 15,767,578 4,863,171 9,981,481 3,693,767 205,170 35,185,193 614,549$ 16,870,890$ 4,353,922$ 10,044,495$ 4,147,345$ 274,130$ 36,305,331$
(8,948,181) 908,206 -

24
This page intentionally left blank

25
CITY OF MIAMI, FLORIDA NOTES TO FINANCIAL STATEMENTS
SEPTEMBER 30, 2012
NOTE 1. – SUMMARY OF SIGNIFICANT ACCOUNTING POLICIES The accompanying financial statements of the City of Miami, Florida (the “City”) have been prepared in conformity with Generally Accepted Accounting Principles (GAAP). The Governmental Accounting Standards Board (“GASB”) is the standard-setting body for governmental accounting and financial reporting. The GASB periodically updates its codification of the existing Governmental Accounting and Financial Reporting Standards which, along with subsequent GASB pronouncements (Statements and Interpretations), constitutes GAAP for governmental units. The more significant of these accounting policies are described below. A. Reporting Entity The City, which is located in the county of Miami-Dade, was incorporated in 1896, and has a population of 408,750 according to the 2011 U.S. Census Bureau. The City is situated at the mouth of the Miami River on the western shores of Biscayne Bay and is a main port of entry into Florida and is the county seat of Miami-Dade County, Florida. The City comprises 35.87 square miles of land and 19.42 square miles of water. The City’s Charter was adopted by the electors of the City of Miami at an election held on May 17, 1921 and was legalized and validated by Chapter 9024 of the laws of the State of Florida of 1921. During fiscal year 1997, the residents of the City voted on a referendum that created single-member districts and an Executive Mayor form of government. The City continues to operate under the Commission/City Manager form of government and provides the following services: police and fire protection, public works activities, solid waste collection, parks and recreational facilities, planning and development, community development, financial services, and general administrative services. The Florida Legislature, in 1955, approved and submitted to a general election, a constitutional amendment designed to give a new form of government to Miami-Dade County, Florida (the “County”). The County is, in effect, a municipality with governmental powers affecting thirty cities and unincorporated areas, including the City. The County has not displaced nor replaced the City’s powers, but supplements them. The County can take over particular activities of the City's operations if (1) the services fall below minimum standards set by the County Commission or (2) with the consent of the governing body of the City. Accordingly, the County’s financial statements are not included in this report. The accompanying financial statements include those of the City (the primary government) and those of its component units. Component units are legally separate organizations for which the primary government is financially accountable or organizations which should be included in the City’s financial statements because of the nature and significance of their relationship with the primary government. The decision to include a potential component unit in the City’s reporting entity is based on the criteria stated in GASB Statement No. 14 - The Financial Reporting Entity and GASB Statement No. 39 - Determining Whether Certain Organizations Are Component Units which includes the ability to appoint a voting majority of an organization’s governing body and (1) the ability of the City to impose its will on that organization or (2) the potential for the organization to provide specific financial benefits to, or impose specific financial burden on, the City.

CITY OF MIAMI, FLORIDA NOTES TO FINANCIAL STATEMENTS
26
Based upon the application of the criteria in GASB Statements No. 14 and 39, the financial statements of the component units listed on the following pages have been included in the City’s reporting entity as either blended or discretely presented component units. Blended component units, although legally separate entities, are in substance part of the City's operations. Accordingly, data from these component units are included with data of the primary government. Each discretely presented component unit, on the other hand, is reported in a separate column in the financial statements to emphasize that they are legally separate from the City. The financial balances and activities for each blended and discretely presented component unit are as of and for the year ended September 30, 2012. Blended Component Units SOUTHEAST OVERTOWN PARK WEST COMMUNITIY REDEVELOPMENT AGENCY (“SEOPW CRA”) – SEOPW is an Agency established by the City in 1983 under the authority of Section 163.330, Florida Statutes and City Resolution No. 82-755. The purpose of the Agency is to eliminate blight and slum conditions within the redevelopment area of the agency pursuant to the redevelopment plans of the Agency for new residential and commercial activity of the Southeast Overtown Park West area. The City has entered into an interlocal agreement with Miami-Dade County approving the deposit of tax increments into the separate SEOPW CRA accounts. The members of the City Commission are also the Board of Directors of the SEOPW CRA. Additionally, under the interlocal agreement the City handles the disbursement, accountability, management, and proper application of all monies in the SEOPW accounts. The funds of the SEOPW CRA included within the reporting entity are a special revenue fund (SEOPW CRA), a debt service fund (SEOPW CRA - Other Special Obligation Bonds), and a capital projects fund (SEOPW Community Redevelopment Agency). OMNI COMMUNITY REDEVELOPMENT AGENCY (“OMNI CRA”) – OMNI CRA is an Agency established by the City in 1986 under the authority of Section 163.330, Florida Statutes and City Resolution No. 86-868. The purpose of the Agency is to eliminate blight and slum conditions within the redevelopment area of the agency pursuant to the redevelopment plans of the Agency for new residential and commercial activity of the Omni area. The City has entered into an interlocal agreement with Miami-Dade County approving the deposit of tax increments into the separate OMNI CRA accounts. The members of the City Commission are the Board of Directors of the OMNI CRA. Additionally, under the interlocal agreement the City handles the disbursement, accountability, management, and proper application of all monies in the OMNI CRA accounts. The OMNI CRA is included within the reporting entity as a special revenue fund (Omni CRA). MIDTOWN COMMUNITY REDEVELOPMENT AGENCY (“MIDTOWN CRA”) – MIDTOWN CRA is an Agency established by the City in 2005 under the provisions of Section 163.330, Florida Statutes and City Resolution No. 05-002. The purpose of the Agency is to eliminate blight and slum conditions within the redevelopment area of the agency pursuant to the redevelopment plans of the Agency for new residential and commercial activity of the Midtown area. The MIDTOWN CRA entered into an interlocal agreement with the City, Miami-Dade County, and the Midtown Community Development District whereby tax increments would be deposited into the separate MIDTOWN CRA accounts. The members of the City Commission are the Board of Directors of the MIDTOWN CRA. Additionally, under the interlocal agreement the City handles the disbursement, accountability, management, and

CITY OF MIAMI, FLORIDA NOTES TO FINANCIAL STATEMENTS
27
proper application of all monies in the MIDTOWN CRA accounts. The MRA is included within the reporting entity as a special revenue fund (Midtown CRA). VIRGINIA KEY BEACH PARK TRUST (“VKBPT”) – On December 14, 2000 (and effective January 2001), via sections 38-230 through 38-242 of Chapter 38 of the Code of the City of Miami Ordinance 12003, the VKBPT was established and acts as a limited agency and instrumentality of the City of Miami. Its general purposes, in cooperation with City of Miami, are to preserve, restore, and maintain the Historic Virginia Key Beach Park in a manner consistent with environmental health, the historical importance of the Park and the aspirations of the African American Community, make it accessible to the general public, propose policy, planning, and design to ensure maximum community utilization and enjoyment. The City Commission must approve VKBPT’s board membership and operating budget. The City considers itself the exclusive recipient of the services provided by VKBPT and therefore its operations are blended in the reporting entity as a special revenue fund (Virginia Key Beach Park Trust). LIBERTY CITY COMMUNITY REVITALIZATION TRUST (“Liberty City”) – On July 10, 2001, via section 2-892 of Chapter 2 of the Code of the City of Miami ordinance 12082, Liberty City was established and acts as a limited agency and instrumentality of the City and provides services entirely or almost entirely to the primary government. Liberty City, in cooperation with the Department of Community Development and other City departments, is responsible for oversight of and facilitating the City’s revitalization efforts for the redevelopment of the Liberty City Community Revitalization District in a manner consistent with the strategy identified in the Five-Year Consolidated Plan, adopted by the City Commission in August, 1999. Liberty City’s specific purpose is to purchase land and renovate capital assets that belong to the City of Miami within the Liberty City area. The City Commission must approve Liberty City’s board membership and operating budget. The City considers itself the exclusive recipient of the services provided by Liberty City and therefore its operations are blended in the reporting entity as a special revenue fund (Liberty City Revitalization Trust). Discretely Presented Component Units MIAMI SPORTS AND EXHIBITION AUTHORITY (“MSEA”) – The MSEA was created by the City in 1983 pursuant to Chapter 212.0305, Florida Statutes and City Ordinance No. 9662 adopted by the City Commission (as amended by City Ordinance No. 11155) and Section 213.0305 of the Florida Statutes to promote the development of sports, convention and exhibition facilities within the City, and attracting professional sports franchises and exhibitions to utilize the City’s and/or Authorities’ facilities. The City Commission must approve MSEA’s board membership and operating budget. Therefore, the MSEA is fiscally dependent and is discretely presenting the MSEA in the accompanying financial statements. DEPARTMENT OF OFF-STREET PARKING OF THE CITY OF MIAMI, FLORIDA, d/b/a MIAMI PARKING AUTHORITY (“DOSP”) – The DOSP was originally created in 1955 by a special act of the Florida State Legislature (Laws of Florida Chapter 30.997, as amended) and subsequently incorporated into the City's Charter in 1968. The DOSP is an agency and instrumentality of the City which owns and operates parking facilities within the City. The City Commission has reserved the right to confirm new members of the DOSP Board, to establish and fix rates and charges for parking services, to approve the DOSP’s operating budget and to authorize the issuance of revenue bonds. Therefore, the DOSP is fiscally dependent and is discretely presenting the DOSP in the accompanying financial statements.

CITY OF MIAMI, FLORIDA NOTES TO FINANCIAL STATEMENTS
28
DOWNTOWN DEVELOPMENT AUTHORITY (“DDA”) – The DDA was created by the City in 1965 pursuant to Chapter 65-1090 of the General Laws of Florida and City Code Section 14-25. The DDA is governed by a board appointed by the City Commission and was established for the purpose of furthering the development of the Downtown Miami area by promoting economic growth in the region and strengthening downtown’s appeal as a livable city as well as a regional, national and international center for commerce and culture. The City Commission must approve the DDA's operating budget and the millage levied on the special taxing district established to fund the DDA. Therefore, the DDA is fiscally dependent and is discretely presenting the DDA in the accompanying financial statements. BAYFRONT PARK MANAGEMENT TRUST (“BFP”) –The BFP was established by the City in 1987 under the authority of City of Miami Resolution No. 10348. The BFP was created for the purpose of managing and operating the events held at Bayfront and Bicentennial Park and the daily maintenance and upkeep of the grounds, its various amenities including the amphitheater and the Mildred and Claude Pepper Fountain. The governing body of the BFP consists of nine appointed members serving initial terms of one to three years. Upon expiration of an initial term, each successor member may be appointed by the City Commission for terms of one to three years. The BFP has appointed an executive director to act as the chief executive officer, subject to policy directives. The BFP prepares and submits an annual budget request and master plan to the City Commission for its approval for each fiscal year. Therefore, the BFP is fiscally dependent and is discretely presenting the BFP in the accompanying financial statements. HEALTH FACILITY AUTHORITY (“HFA”) – The HFA is an agency established by the City in 1979 under the authority of Chapter 154, Florida Statutes and City Resolution No. 79-93 to serve as a conduit to issue revenue bonds. The City Commission must approve the HFA’s board membership and operating budget. Therefore, the City is financially accountable and is discretely presenting the HFA in the accompanying financial statements. Debt obligations issued under the purview of the HFA do not constitute an indebtedness, liability or pledge of the faith or credit of the HFA or the City. The amount of conduit debt obligations totaled $20,830,000 at September 30, 2012. The HFA does not issue stand-alone audited financial statements. During Fiscal Year 2011 Mercy Hospital redeemed the Miami Health facilities Authority Series 1998, 2002, 2008 and 2009 bonds on June 1, 2011. Series 2003 Bonds were defeased on June 2, 2011 to their call date 11/15/2013. The debt service payment was made by Miami Jewish Home. The City of Miami Health Facilities Authority conduit debt outstanding as of September 30, 2012 is as follows:
Miami Principal OutstandingJewish Home Payment Balance
Series 2005 21,540,000 710,000 20,830,000 Total 21,540,000$ 710,000$ 20,830,000$
The scheduled debt service payments were made by Miami Jewish Home and the payments are current. Proceeds from these bond issues were used to finance construction of buildings and parking facilities; land acquisitions; equipment purchases including beds and other medical apparatus; renovation of existing facilities; and engineering costs.

CITY OF MIAMI, FLORIDA NOTES TO FINANCIAL STATEMENTS
29
CIVILIAN INVESTIGATIVE PANEL (“CIP”) – The CIP was established by the City of Miami Commission Ordinance Number 12188 on February 14, 2002 for the purpose of creating an independent citizen’s oversight panel to conduct investigations related to allegations of police misconduct, review polices, practices and procedures of the police department and perform community outreach programs. The CIP consists of thirteen members who were originally appointed as follows: a) the Miami City Commission selects and appoints nine members, b) the Mayor selects three members whose names are ratified and appointed by the City Commission, and c) the Chief of Police of the City of Miami appoints one member, who serves at the will of the Chief of Police. The CIP prepares and submits an annual budget request to the City Commission for its approval for each fiscal year and is funded by the City of Miami. Therefore, the CIP is fiscally dependent and is discretely presenting the CIP in the accompanying financial statements. COCONUT GROVE BUSINESS IMPROVEMENT DISTRICT (“BID”) – In July 2004, pursuant to Resolution No. 12564, the City of Miami approved the establishment of the Coconut Grove Business Improvement Committee (“BIC”). The BIC was formed as an advisory committee to the City. During November 2008, the City tabulated the results of a special election for the creation of the Coconut Grove Business Improvement District (“BID”), where the BID was deemed to be approved a majority of the affected property owners. During March 2009, under City Ordinance No. 13059, the City approved to repeal the BIC and establish a new Coconut Grove Business Improvement District Board (“BID Board”) to stabilize and improve retail and other businesses in the BID area through promotion, management, marketing and other similar services, including, but not limited to, coordination, funding, implementation and maintenance of all infrastructure improvement, and other projects, utilizing BID assessment proceeds and other funds identified. The BID prepares and submits an annual budget request and master plan to the City Commission for its approval for each fiscal year. Therefore, the BID is fiscally dependent and is discretely presenting the BID in the accompanying financial statements. Complete financial information of the individual component units may be obtained at the entity's respective administrative offices as follows: SEOPW CRA 1490 NW 3rd Ave. Suite 105 Miami, Florida 33136 OMNI/MIDTOWN CRA 1401 North Miami Ave. Miami, Florida 33136 VKBPT 4020 Virginia Beach Drive Miami, Florida 33149 Liberty City
MSEA 3500 Pan American Drive Miami, Florida 33133 DOSP 40 NW 3rd Street Suite 1103 Miami, Florida 33128 DDA 200 S. Biscayne Blvd. Suite 2929 Miami, Florida 33131
BFP 301 N. Biscayne Blvd. Miami, Florida 33132-2226 CIP 970 SW 1st Street Suite 305 Miami, FL 33130 BID 3390 Mary Street, Ste 130 Coconut Grove, FL 33133
4800 NW 12th Avenue Miami, Florida 33127-2218

CITY OF MIAMI, FLORIDA NOTES TO FINANCIAL STATEMENTS
30
B. Government-Wide Financial Statements
The government-wide financial statements (i.e., the Statement of Net Assets and the Statement of Activities) report information on all of the non-fiduciary activities of the City and its component units. The primary government is reported separately from the legally separate component units. The Statement of Net Assets presents the financial position of the City and its discretely presented component units at the end of its fiscal year. The Statement of Activities demonstrates the degree to which the direct expenses of a given function or segment are offset by program revenues. Direct expenses are those that are clearly identifiable with a specific function or segment. Program revenues include 1) charges to customers or applicants who purchase, use, or directly benefit from goods, services, or privileges provided by a given function or segment, and 2) grants and contributions that are restricted to meeting the operational or capital requirements of a particular function or segment. Taxes and other items that are not deemed to be program revenues are reported instead as general revenues. C. Fund Financial Statements The accounts of the City are organized and operated on the basis of funds. A fund is an independent fiscal and accounting entity with a self-balancing set of accounts which comprise its assets, liabilities, fund balances/net assets, revenues, and expenditures. Fund accounting segregates funds according to their intended purpose and it is used to aid management in demonstrating compliance with finance-related legal and contractual provisions. The City maintains the minimum number of funds consistent with legal and managerial requirements. The focus of governmental fund financial statements is on major funds as that term is defined in professional pronouncements. Each major fund is to be presented in a separate column, with non-major funds aggregated and presented in a single column. The City maintains fiduciary funds which are used to account for assets held by the City in a trustee capacity. Since the governmental fund statements are presented on a different measurement focus and basis of accounting than the government-wide statements’ governmental activities column, reconciliation is presented on the statements or on the page following, which briefly explains the adjustments necessary to transform the fund-based financial statements into the governmental activities column of the government-wide presentation. The City reports the following major governmental funds: General Fund – The General Fund is the general operating fund of the City. General tax revenues and other receipts that are not allocated by law or contractual agreement to some other fund are accounted for in this fund. General operating expenditures, fixed charges, and capital improvement costs not paid through other funds are paid from this fund. Special Obligation Bonds – This Debt Service Fund accounts for monies for payment of principal, interest, and other costs related to various special obligation and revenue bonds and loans. Public Safety – This Capital Projects Fund accounts for the acquisition or construction of major capital facilities that support the City of Miami’s Police and Fire operations. General Government – This Capital Project Fund accounts for expenditures for capital made for general government operations. Streets and Sidewalks – This Capital Project Fund accounts for capital expenditures made for streets, sidewalks, and other traffic-related projects.

CITY OF MIAMI, FLORIDA NOTES TO FINANCIAL STATEMENTS
31
Additionally, the City reports the following fiduciary fund type: Pension Trust Funds - The pension trust funds account for the City of Miami Fire Fighters’ and Police Officers’ Retirement Trust (“FIPO”), the City of Miami General Employees’ and Sanitation Employees’ Retirement Trust (“GESE”) and Other Managed Trusts (Members, Excess Plan, and Staff Plan), and the Elected Officers’ Retirement Trust (“EORT”). The pension trust funds accumulate resources for pension benefit payments. D. Measurement Focus and the Financial Statement Presentation The government-wide financial statements are reported using the economic resources measurement focus and the accrual basis of accounting, as are the fiduciary fund financial statements. Revenues are recorded when earned and expenses are recorded when a liability is incurred, regardless of the timing of related cash flows. Property taxes are recognized as revenues in the year for which they are levied. Grants and similar items are recognized as revenue as soon as all eligibility requirements imposed by the provider have been met. Governmental fund financial statements are reported using the current financial resources measurement focus and the modified accrual basis of accounting. Revenues are recognized as soon as they are both measurable and available. Revenues are considered to be available when they are collectible within the current period or soon enough thereafter to pay liabilities of the current period. For this purpose, the City considers revenues to be available if they are collected within 60 days of the end of the fiscal period. Expenditures generally are recorded when a liability is incurred, as under accrual accounting. However, debt service expenditures, as well as expenditures related to compensated absences, insurable claims, pensions, pollution remediation obligations, and other post employment benefits are recorded only when payment is due or when City has made a decision to fund these obligations with current available resources. Certain revenues associated with the current fiscal period are considered to be susceptible to accrual and are recognized as revenues of the current fiscal period such as:
• Property taxes • Intergovernmental revenue • Sales tax, franchise and utility taxes • Charges for services, and • Interest
All other revenue items are considered to be measurable only when cash is received by the City. As a general rule, the effect of inter-fund activity has been eliminated from the government-wide financial statements. Amounts reported as program revenues include 1) charges to customers or applicants for goods, services, or privileges provided, 2) operating grants and contributions, and 3) capital grants and contributions, including special assessments. Internally dedicated resources are reported as general revenues rather than program revenues. Likewise, general revenues include all taxes. When restricted resources are available for use, it is the City’s policy to use restricted resources first as they are needed. Similarly, within fund balance categories committed amounts are reduced first, followed

CITY OF MIAMI, FLORIDA NOTES TO FINANCIAL STATEMENTS
32
by assigned, and then by unassigned amounts when expenditures are incurred for purposes for which amounts in any of these fund balance classifications could be used. E. Assets, Liabilities, and Net Assets or Equity Deposits and Investments The City has defined “cash, cash equivalents and investments” to include cash on hand, demand deposits, money market funds, debt securities, and cash with fiscal agents. Each fund’s equity in the City’s investment pool is considered to be a cash equivalent since the funds can be deposited or effectively withdrawn at any time without prior notice or penalty. In addition, the City considers all highly liquid investments with a maturity of three months or less when purchased, to be a cash equivalent. All investments, including those of the Pension Trust Funds, are stated at fair value, using quoted market price or the best available estimate thereof. Investments that have a maturity of one year or less at the time of purchase are reported at amortized cost. Alternative investments which include private equity, private debt, venture capital and equity real estate investments where no readily ascertainable market value exists, management, in consultation with the general partner and investment advisors, have determined the fair values for the individual investments based upon the partnership’s most recent available financial information. Interfund Receivables and Payables Activity between funds that is representative of lending/borrowing arrangements outstanding at the end of the fiscal year is referred to as “due to/from other funds”. Receivables Receivables include amounts due from other governments and others for services provided by the City and are recorded when the related revenue is earned. Allowances for uncollectible receivables are based upon historical trends and the periodic aging of receivables. The City fully reserves for all receivables greater than 60 days with the exception of grant receivables and other accounts that are in the collection process, which are based on historical collection experience and other factors. Prepaids Prepaid items consist of certain costs which have been paid prior to the end of the fiscal year, but represent items which are applicable to future accounting periods. Reported amounts in governmental funds are equally offset by non-spendable fund balance, in the fund financial statements, which indicates that these amounts do not constitute “available spendable resources” even though they are a component of current assets. Long term service agreements, other than insurance policies, are expensed in the year of renewal. The City uses the “Alternate Expense Recognition” method for those contracts covering one or more fiscal period. Inventory There are no inventory values presented in the governmental funds. Purchases considered inventoriable items are recorded as expenditures/expense at the time of purchase and the year-end balances are not

CITY OF MIAMI, FLORIDA NOTES TO FINANCIAL STATEMENTS
33
material. The government-wide financial statements present inventory values of the City, primarily properties held by the Community Development Department for resale. Restricted Assets Certain proceeds from bonds, loans and deposits, as well as advances from grants, are classified as restricted assets because their use is limited by applicable bond indentures, contracts, and agreements. Capital Assets Capital assets, which include property, plant, equipment, and infrastructure (e.g. roads, sidewalks, drainage, and similar items), are reported in the governmental activities column in the government-wide financial statements and fiduciary fund financial statements. Capital assets are defined by the City as assets with an initial cost of $1,000 or more and an estimated useful life in excess of one year. Such assets are recorded at historical cost if purchased or constructed. Donated capital assets are recorded at estimated fair value on the date of the donation. Major outlays for capital assets and improvements are capitalized as projects are constructed. The cost of normal maintenance and repairs that do not add to the value of the asset or materially extend asset lives are not capitalized. Property, plant, equipment, and infrastructure of the City, and its component units, are depreciated using the straight-line method over the following estimated useful lives:
Asset YearsBuildings 20 - 50Improvements other than buildings 10 - 30Machinery and equipment 3 - 15Infrastructure 15 - 75
In the governmental funds, capital assets are recorded as expenditures and no depreciation expense is recorded. Deferred Charges Deferred charges in the government-wide financial statements represent the unamortized portion of the cost incurred for the issuance of long-term debt. These costs are being amortized over the term of the respective bond issue or the shorter of the amortization period remaining from the prior refunding or the life of the latest refunding debt. The costs are amortized using the effective interest method. For governmental funds, these costs are considered to be period costs. Compensated Absences Under terms of Civil Service regulations, labor contracts and administrative policy, City employees are granted vacation and sick leave in varying amounts. Additionally, certain overtime hours can be accrued and carried forward as earned time off. Unused vacation and sick time is payable upon separation from service, subject to various limitations depending upon the employee’s seniority and civil service classification. The amount accrued as of September 30, 2012 is $66.2 million of which $7.9 million is the current portion. The City accrues a liability for compensated absences as well as certain other salary

CITY OF MIAMI, FLORIDA NOTES TO FINANCIAL STATEMENTS
34
related costs associated with the payment of compensated absences. The liability for such accumulated leave is reflected in the government-wide financial statements as current and long-term liabilities. A liability for these amounts is reported in the governmental funds only if they have matured, for example, as a result of employee resignations and retirements. The liability for compensated absences includes salary-related payments, paid sixty days subsequent to year end. Employee Benefit Plans and Net Pension Asset/Obligation - The City provides separate defined benefit pension plans for general employees, sanitation employees and for uniformed police and fire department personnel, as well as a defined contribution pension plan created in accordance with Internal Revenue Code Section 401(a) for certain employees. The City also offers an optional deferred compensation plan created in accordance with Internal Revenue Code Section 457. At September 30, 2012 the City recorded a net pension obligation related to the General Employees and Sanitation Employees (GESE) Excess Benefit Plan in its government-wide statement of net assets. The net pension obligation is a function of annual required contributions, interest, adjustments to the annual required contribution, annual pension costs and actual employers contributions made to the plan. A Net Pension Obligation results when the plan is not funded 100%.
Post Employment Benefits Other Than Pensions (OPEB) - Pursuant to Section 112.0801, Florida Statutes, the City is required to permit participation in the health insurance program by retirees and their eligible dependents at a cost to the retiree that is no greater than the cost at which coverage is available for active employees. Retired police officers are offered coverage at a discounted premium under the FOP Health Trust that is administered separately from the City’s health care plan. For non-police retirees (fire fighters, general employees, sanitation employees and elected officials) and their dependents, the City subsidizes health care coverage and life insurance at a premium equal to the blended group rate.
The City is financing the post employee benefits on a pay-as-you go basis. As determined by an actuarial valuation, the City records a net OPEB obligation in its government-wide financial statements related to the implicit subsidy. Unearned/Deferred Revenues Resources that do not meet revenue recognition requirements (not earned) are recorded as unearned revenue in the government-wide and fund financial statements. In addition, amounts related to government fund receivables that are measurable, but not available, are recorded as deferred revenue in the governmental fund financial statements, primarily grant related reimbursements not yet collected. Unearned/Deferred revenues in the government-wide and governmental funds financial statements at September 30, 2012 are as follows:
Government-Wide GovernmentalSource Level Funds Level
College of Policing $ 10,905,829 $ 10,905,829Burglar Alarms and Business Taxes Receipts 8,051,975 8,051,975Miami Exihibition and Sports Authority 196,866 196,866Emergency Medical Sevices 55,641 55,641Deferred Taxes - 9,908,540Grants and Others - 17,327,674
Total $ 19,210,311 $ 46,446,525

CITY OF MIAMI, FLORIDA NOTES TO FINANCIAL STATEMENTS
35
Long-Term Obligations In the government-wide financial statements long-term debt and other long-term obligations are reported as liabilities on the statement of net assets. Bonds payable are reported net of the applicable accretion, bond premiums or discounts and any gains or losses related to deferred refunding amounts. Bond premiums, discounts, and issuance costs are amortized over the life of the bonds using the effective interest method. In the fund financial statements, governmental fund types recognize bond premiums and discounts, as well as bond issuance costs, during the current period. The face amount of debt issued is reported as other financing sources. Premiums received on debt issuances are reported as other financing sources while discounts on debt issuances are reported as other financing uses. Issuance costs, whether or not withheld from the actual debt proceeds received, are reported as debt service expenditures. Payment of debt principal is reported as an expenditure. Risk Management – Under the protection of this sovereign immunity limit, Florida Statutes 768.28 and Chapter 440, Florida Statutes covering Workers’ Compensation, the City has established a self-insured program to provide coverage for almost all areas of liability including Workers’ Compensation, General Liability, Automotive Liability, Police Professional Liability, Public Officials’ Liability, and Employment Practices Liability. Section 768.28, Florida Statutes, provides for waiver of sovereign immunity in tort actions or claims against the state and its agencies and subdivisions. The present limit of recovery in the absence of special relief granted by the Florida legislature is $200,000 per person per claim or judgment. The limit of recovery for all claims or judgments arising out of the same incident or occurrence is $300,000. The City also provides group health benefits for its active employees, retirees, and their dependents through a fully self-funded health insurance program and uses a commercial carrier as the administrator. The discounted accrued liability for estimated insurance claims represents an estimate of the ultimate cost of settling claims arising prior to year end including claims incurred but not yet reported. Net Assets Equity in the government-wide statement of net assets is displayed in three categories: 1) invested in capital assets, net of related debt, 2) restricted, and 3) unrestricted. Net assets invested in capital assets net of related debt consists of capital assets reduced by accumulated depreciation and by any outstanding debt incurred to acquire, construct, or improve those assets, excluding unexpended proceeds. Net assets are reported as restricted when there are legal limitations imposed on their use by State Statutes or City legislation or external restrictions by other governments, creditors, or grantors. Unrestricted net assets consist of all net assets that do not meet the definition of either of the other two components. The government-wide statement of net assets reports $90,077,677 of restricted net assets, all of which is restricted by enabling legislation. Fund Equity The City follows Governmental Accounting Standards Board Statement No. 54, Fund Balance Reporting and Governmental Fund Type Definitions, which established the accounting and financial reporting standards for government entity to report fund balance in classifications that comprise a hierarchy based primarily on the extent to which the government is bound to honor constraints on the specific purposes

CITY OF MIAMI, FLORIDA NOTES TO FINANCIAL STATEMENTS
36
for which amounts in those funds can be spent. The following is a description of the classifications used by the City. Non Spendable Fund Balance – This amount includes amounts that cannot be spent because they are either (a) not in spendable form or (b) legally or contractually required to be maintained intact. Examples of this would be inventory and prepaid assets. Restricted Fund Balance – This amount includes amounts that are restricted to specific purposes stipulated by (a) external creditors, grantors, contributors, or laws or regulations of other governments or (b) imposed by law through constitutional provisions or enabling legislation. Committed Fund Balance – This amount includes amounts that can only be used for specific purposes pursuant to constraints imposed by resolution of the City’s highest level of decision making authority which is the City Commission. Once adopted by resolution, a resolution can only be revised or removed by adoption of a new resolution. Assigned Fund Balance – This amount includes amounts that are constrained by the City’s intent to be used for specific purposes, but are neither restricted nor committed. Intent is expressed by the City Commission. The City’s Financial Integrity Rule Section 18-542 specifies the amounts the City shall retain as assigned fund balance. Unassigned Fund Balance – This amount is the residual classification for the general fund. This classification represents fund balance that has not been assigned to other funds and that has not been restricted, committed, or assigned to specific purposes within the general fund. Unassigned fund balance may include negative balances for any governmental fund if cumulative expenditures exceed amounts restricted, committed, or assigned for those specific purposes.

CITY OF MIAMI, FLORIDA NOTES TO FINANCIAL STATEMENTS
37
The following schedule classifies the City’s fund balances as of fiscal year end September 30, 2012:
Special Non-Major Total Obligation General Street & Governmental Governmental
General Bonds Public Safety Government Sidewalks Funds FundsFUND BALANCES
Non Spendable:Recycling Trust Fund -$ -$ -$ -$ -$ 1,000,000$ 1,000,000$ Prepaid Items 7,140,534 - - - - - 7,140,534
7,140,534 - - - - 1,000,000 8,140,534 Spendable:
Restricted for:Debt Service Reserved by Debt Covenants - 32,283,094 - - - 4,093,860 36,376,954 Environmental Projects - - - 689,240 - 1,697,054 2,386,294 Water-Sewer Combination - - - - - 27,595,892 27,595,892 Emergency and Disaster Relief - - - - - 1,748,436 1,748,436 Other Grants - - - - 2,564,328 1,552,185 4,116,513 Park Projects - - - - - 17,557,459 17,557,459 Capital Improvements - - - 53,327,986 58,810,496 - 112,138,482 Transportation and Transit - - - - 3,442,779 35,469,204 38,911,983 Computer and Software Upgrade - - 457,155 - - 225,791 682,946 Housing and Urban Development - - - - - 6,453,871 6,453,871 Equipment - - - - - 726,879 726,879 Public Safety - - - 1,405,258 - 11,916,342 13,321,600 Other Infrastructure and Development - - - - 194,320 194,320 Other Facilities Improvement - - - - - 25,243,339 25,243,339 Community Redevelopment Agencies - - - - - 44,817,840 44,817,840 Other - - - - - 911,298 911,298
- 32,283,094 457,155 55,422,484 64,817,603 180,203,770 333,184,106 Committed to:
Elected Officials - - - - - 293,515 293,515 Planning Projects - - - - - 1,286,970 1,286,970 Housing and Urban Development - - - - - 3,459,022 3,459,022 Park Projects - - - - - 1,442,145 1,442,145 Capital Improvements - - - - - 2,109,172 2,109,172 Downtown Development - - - - - 2,443,294 2,443,294 Computer and Software Upgrade - - - 2,292,569 - - 2,292,569 Transportation Projects - - - - 1,191,328 - 1,191,328
Other - - - 233,323 - 1,760,800 1,994,123 - - - 2,525,892 1,191,328 12,794,918 16,512,138
Assigned to: Strategic and Management Initiatives 50,403,318 - - - - - 50,403,318 Other - - - 906,848 - 851,193 1,758,041
50,403,318 - - 906,848 - 851,193 52,161,359 Unassigned:
Unassigned - - (256,315) - - (9,067,398) (9,323,713)
Total Fund Balances 57,543,852$ 32,283,094$ 200,840$ 58,855,224$ 66,008,931$ 185,782,483$ 400,674,424$

CITY OF MIAMI, FLORIDA NOTES TO FINANCIAL STATEMENTS
38
Use of Estimates The preparation of the financial statements in conformity with accounting principles generally accepted in the United States requires management to make estimates and assumptions that affect the reported amounts of assets and liabilities and disclosure of contingent assets and liabilities at the date of the financial statements. Estimates also affect the reported amounts of revenues and expenditures during the reporting period. Actual results could differ from estimates. Excess of Expenditures over Appropriations The following funds exceeded their authorized budget for fiscal year ended September 30, 2012:
Exceeded BudgetAuthorization
Special Revenue:Emergency Services 100,268$ Homeless Program 10
Blended Component Unit: Virginia Beach Trust 32,427
Fund/Department
The Emergency Services Fund is dedicated for the training and operations of the Urban Search and Rescue team reimbursed by FEMA. The Homeless Program is primarily funded by a number of grants and the $10 variance is a due to rounding of the budgets to the nearest 100th. The Virginia Beach Trust is a blended component unit and the projected revenue collections were lower than expected.
Fund Deficits The following funds had deficits in the amounts indicated as of September 30, 2012:
DeficitSpecial Revenue:
Fire Rescue Services $ 3,928,202 General Special Revenues 1,396,853
Capital Projects:Disaster Recovery 772,383 Mass Transit 179,289
Blended Component Unit: Virginia Beach Trust 32,463
Fund
The fund deficits reported as of September 30, 2012, for the Fire Rescue Services, General Special Revenues, Disaster Recovery and Mass Transit funds is attributed to reimbursements of grants not received as of the year end. The City continues to pursue collection of the outstanding balances. The Virginia Beach Trust is a blended component unit and the projected revenue collections were lower than expected for fiscal year 2012.

CITY OF MIAMI, FLORIDA NOTES TO FINANCIAL STATEMENTS
39
New Accounting Pronoucements GASB Statement No. 64, Derivative Instruments: Application of Hedge Accounting Termination Provisions - an amendment of GASB Statement No. 53, was issued in June 2011. This Statement is to clarify whether an effective hedging relationship continues after the replacement of a swap counterparty or a swap counterparty’s credit support provider arising from the application of the termination of hedge accounting provisions in Statement No. 53, Accounting and Financial Reporting for Derivative Instruments. The provisions of this Statement was effective for the City beginning with its year ending September 30, 2012. This Statement did not have an impact on the City’s financial statements. NOTE 2. – DEPOSITS AND INVESTMENTS Deposits The City, excluding the Pension Trust Funds and restricted cash balances, maintains a cash management pool for its cash, cash equivalents, and investments in which each fund and/or account or sub-account of a fund participates on a dollar equivalent and daily transaction basis. Interest income (which includes unrealized gains and losses) is distributed monthly to all eligible funds, accounts and/or sub-account, based on the available cash balance at month end. The yield is determined for these eligible funds, based on the amount of time they are available for investing. A cash balance that is needed within a 3 month period will receive the yield on a 3 month treasury bill as determined by the current bond market. Custodial Credit Risk – This is the risk that in the event of a bank failure, the City’s deposits may not be recoverable. In addition to insurance provided by the Federal Deposit Insurance Corporation, deposits are held in banking institutions approved by the State Treasurer of Florida to hold public funds. The City’s adopted policy is governed by Florida Statutes Chapter 280, Security for Public Deposits, which requires all Florida qualified public depositories to deposit with the Treasurer or another banking institution eligible collateral. In the event of failure of a qualified public depository, the remaining public depositories would be responsible for covering any resulting losses. Investments Custodial Credit Risk – This is the risk that in the event of the failure of the counterparty, the City will not be able to recover the value of its investments or collateral securities that are in the possession of an outside party. The City’s investment policy requires that securities be registered in the name of the City. All safekeeping receipts for investment instruments are held in accounts in the City’s name and all securities are registered in the City’s name. As required by Florida Statutes, the City has adopted a written investment policy, which may, from time to time, be amended by the City Commission. The City Code authorizes the Director of Finance and/or a designee in their absence to purchase and invest idle funds prudently in U. S. Treasuries and obligations of agencies of the United States, provided such are guaranteed by the United States or by the issuing agency; general obligations of states, municipalities, school districts, or other political subdivisions, revenue and excise tax bonds of the various municipalities of the State of Florida, provided none of such securities has been in default within five years prior to date of purchase, negotiable certificates of deposit, bankers acceptance drafts, money market investments, the State Board of Administration Investment Pool, and prime commercial paper. The State Board of Administration administers of the Local Government Surplus Funds Trust Fund and is governed by Ch. 19-7 of the Florida Administrative Code. These rules provide guidance and establish the general operating procedures for the administration of the Local Government Surplus Funds Trust Fund. Additionally, the State of Florida Office of the Auditor General performs the operational audit of

CITY OF MIAMI, FLORIDA NOTES TO FINANCIAL STATEMENTS
40
the activities and investments of the State Board of Administration. The fair value of the position in the external investment pool is the same as the value of the pool shares. The Local Government Surplus Funds Trust Fund is not a registrant with the Securities and Exchange Commission; however, the board has adopted operating procedures consistent with the requirements for a 2a-7 fund. These investments are valued using the pooled share price, which is based on amortized cost. At September 30, 2012, the pooled cash, cash equivalents and investments including restricted cash of the primary government, exclusive of the Pension Trust Funds and discrete component units, consisted of the following:
Federal National Mortgage Association 68,440,380$ Federal Home Loan Mortgage Corporation 34,902,116 Federal Farm Credit Bank 81,961,111 Federal Home Loan Bank 63,552,882 Commercial Paper 98,274,461 Money Market Fund 27,030,705 Total Investments 374,161,655 Bank Deposits 49,569,415 Total Pooled Cash, Cash Equivalents and Investments 423,731,070$
As of September 30, 2012, $125,061,559 of the total balance listed above relates to unspent bond proceeds. Unspent bond proceeds consisted of the following:
Issue Unspent Proceeds2007 Street & Sidewalks 16,562,122$ Special Obligations A 1,825,312 2007B Limited 2,173,054 2009 Limited 31,060,944 2009 Streets and Sidewalks 44,278,327 2010A Marlins Garage Tax Exempt 10,248,055 2010B Marlins Garage Taxable 2,688,911 2011A- Non-Ad Valorem Refunding Bond 16,224,834
125,061,559$
Interest Rate Risk - Interest rate risk is the risk that as market rates change, the fair value of an investment will vary. Generally, the longer the maturity of an investment, the greater the sensitivity of its fair value to changes in the market interest rates. The City’s policy limits the maturity of an investment to a maximum of 5 years. As of September 30, 2012, the City of Miami had the following investments with the respective weighted average maturity in years. The respective weighted average maturities were based on the securities’ call date, not the maturity date.
Weighted AverageInvestment Type Maturity in YearsUnited States Treasury Notes and Bills 0.00Federal National Mortgage Association 0.99Federal Home Loan Mortgage Corporation 1.19Federal Farm Credit Bank 0.82Federal Home Loan Bank 0.33Commercial Paper 0.13

CITY OF MIAMI, FLORIDA NOTES TO FINANCIAL STATEMENTS
41
Credit Risk – Credit Risk is the risk that a security or portfolio will lose some or all of its value due to a real or perceived change in the ability of the issuer to repay its debt. The City’s investment policy (the Policy), minimizes credit risk by restricting authorized investments to the highest ratings of at least one of the nationally recognized statistical rating organizations (NRSROs). Commercial paper and bankers acceptances must have the highest letter and numerical rating as provided for by at least one NRSRO. The credit ratings below were consistent among the two major rating agencies (Moody’s and Fitch). The table below summarizes the investments by credit rating at September 30, 2012:
Moody's & FitchInvestment Type Credit RatingFederal National Mortgage Association AA+Federal Home Loan Mortgage Corporation AA+Federal Farm Credit Bank AA+Federal Home Loan Bank AA+Commercial Paper A1/P1/F1
Concentration of Credit Risk – The City’s policy establishes limitations on portfolio composition by investment type and by issuer to limit its exposure to concentration of credit risk. The policy provides that a maximum of 20% of the portfolio may be invested in SEC registered money market funds with no more than 10% to any single money market fund. A maximum of 100% of available funds may be invested in the Local Governments Surplus Funds Trust Fund. A maximum of 100% of the total portfolio may be invested in U.S. Government securities and federal instruments, with a limit of 25% invested in any one issuer of federal instruments. A maximum of 35% of the portfolio may be invested in prime commercial paper with a maximum of 5% with any one issuer. A maximum of 10% of the portfolio may be invested in banker’s acceptances with a maximum of 5% with any one issuer. As of September 30, 2012, the following issuers held 10% or more of the investment portfolio:
Issuer PercentageFederal Farm Credit Bank 24%Federal Home Loan Bank 18%Federal Home Loan Mortgage Corp. 10%Federal National Mortgage Association 20%
The above excludes investments in mutual funds and external investments pools. City of Miami Firefighters and Police Officers Retirement Trust (FIPO) FIPO’s investment policy is determined by its Board of Trustees and is implemented by investment managers. The policy has been identified by the Board as having the greatest expected investment return, and the resulting positive impact on asset values, funded status and benefits, without exceeding a prudent level of risk. The Trustees are authorized to acquire and retain property, real, personal or mixed and investments specifically including, bonds, debentures and other corporate obligations, and stocks, preferred or common.

CITY OF MIAMI, FLORIDA NOTES TO FINANCIAL STATEMENTS
42
Interest Rate Risk - Interest rate risk is the risk that changes in market interest rates will adversely affect the fair value of an investment. Generally, the longer the maturity of an investment the greater the sensitivity of its fair value to changes in market interest rates. As a means of limiting its exposure to interest rate risk, the Plan’s Investment Policy limits the maturities and diversifies its investments by security type and institution, and limits holdings in any one type of investment with any one issuer to control this risk. Information about the sensitivity of fair values of the Plan’s investments to market interest rate fluctuations is provided by the following table that shows the distribution of the Plan’s investments by maturity at September 30, 2012:
U.S. U.S. CorporateTreasuries Agencies Bonds Total
Fair Value 138,817,322$ 105,875,001$ 280,685,368$ 525,377,691$ Investment Maturities:
Less than 1 year 16,763,020 1,061,402 6,603,371 24,427,793 1 to 5 years 55,518,116 2,655,008 96,970,206 155,143,330 6 to 10 years 45,663,030 2,934,425 127,905,102 176,502,557 More than 10 years 20,873,156 99,224,166 49,206,689 169,304,011
Credit Risk - Credit risk is the risk that a security or a portfolio will lose some or all of its value due to a real or perceived change in the ability of the issuer to repay its debt. This risk is generally measured by the assignment of a rating by a nationally recognized statistical rating organization. The Plan’s investment policy utilizes portfolio diversification in order to control this risk. The following table discloses credit ratings, at September 30, 2012:
PercentageInvestment Type/Rating Fair Value of PortfolioU.S. Government guaranteed* 244,692,323$ 46.57%Credit risk debt securitiesAAA 9,659,787 1.84%AA+ 13,359,080 2.54%AA 6,018,794 1.15%AA- 7,144,105 1.36%A+ 16,230,876 3.09%A 20,892,150 3.98%A- 35,563,605 6.77%BBB+ 23,059,329 4.39%BBB 36,684,491 6.98%BBB- 11,509,255 2.19%BB+ and lower 83,790,353 15.95%Not Rated 16,773,543 3.19%
Total credit risk debt securities 280,685,368 53.43%Total fixed income securities 525,377,691$ 100.00%
* Obligations of the U.S. government or obligations explicitly or implicitly guaranteed by the U.S. government are not
considered to have credit risk and do not have purchase limitations.
Custodial Credit Risk - This is the risk that in the event of the failure of the counterparty, the Plan will not be able to recover the value of its investments that are in the possession of an outside party.
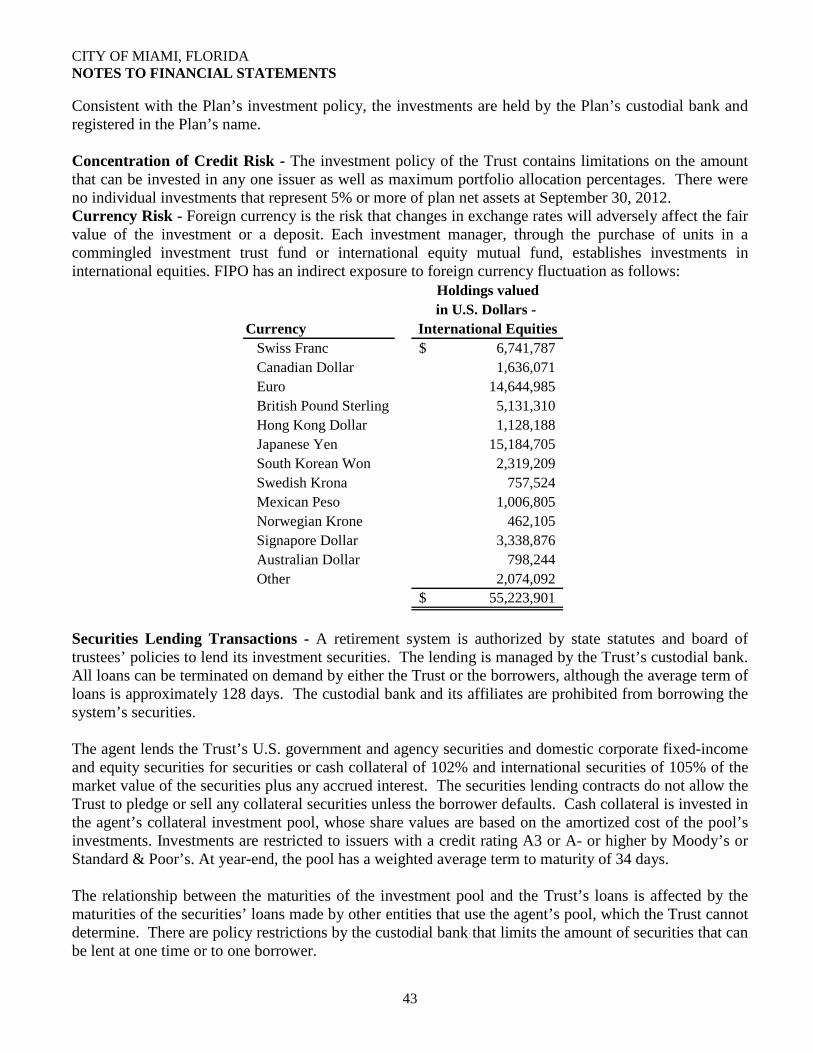
CITY OF MIAMI, FLORIDA NOTES TO FINANCIAL STATEMENTS
43
Consistent with the Plan’s investment policy, the investments are held by the Plan’s custodial bank and registered in the Plan’s name. Concentration of Credit Risk - The investment policy of the Trust contains limitations on the amount that can be invested in any one issuer as well as maximum portfolio allocation percentages. There were no individual investments that represent 5% or more of plan net assets at September 30, 2012. Currency Risk - Foreign currency is the risk that changes in exchange rates will adversely affect the fair value of the investment or a deposit. Each investment manager, through the purchase of units in a commingled investment trust fund or international equity mutual fund, establishes investments in international equities. FIPO has an indirect exposure to foreign currency fluctuation as follows:
Holdings valuedin U.S. Dollars -
Currency International EquitiesSwiss Franc 6,741,787$ Canadian Dollar 1,636,071 Euro 14,644,985 British Pound Sterling 5,131,310 Hong Kong Dollar 1,128,188 Japanese Yen 15,184,705 South Korean Won 2,319,209 Swedish Krona 757,524 Mexican Peso 1,006,805 Norwegian Krone 462,105 Signapore Dollar 3,338,876 Australian Dollar 798,244 Other 2,074,092
55,223,901$
Securities Lending Transactions - A retirement system is authorized by state statutes and board of trustees’ policies to lend its investment securities. The lending is managed by the Trust’s custodial bank. All loans can be terminated on demand by either the Trust or the borrowers, although the average term of loans is approximately 128 days. The custodial bank and its affiliates are prohibited from borrowing the system’s securities. The agent lends the Trust’s U.S. government and agency securities and domestic corporate fixed-income and equity securities for securities or cash collateral of 102% and international securities of 105% of the market value of the securities plus any accrued interest. The securities lending contracts do not allow the Trust to pledge or sell any collateral securities unless the borrower defaults. Cash collateral is invested in the agent’s collateral investment pool, whose share values are based on the amortized cost of the pool’s investments. Investments are restricted to issuers with a credit rating A3 or A- or higher by Moody’s or Standard & Poor’s. At year-end, the pool has a weighted average term to maturity of 34 days. The relationship between the maturities of the investment pool and the Trust’s loans is affected by the maturities of the securities’ loans made by other entities that use the agent’s pool, which the Trust cannot determine. There are policy restrictions by the custodial bank that limits the amount of securities that can be lent at one time or to one borrower.
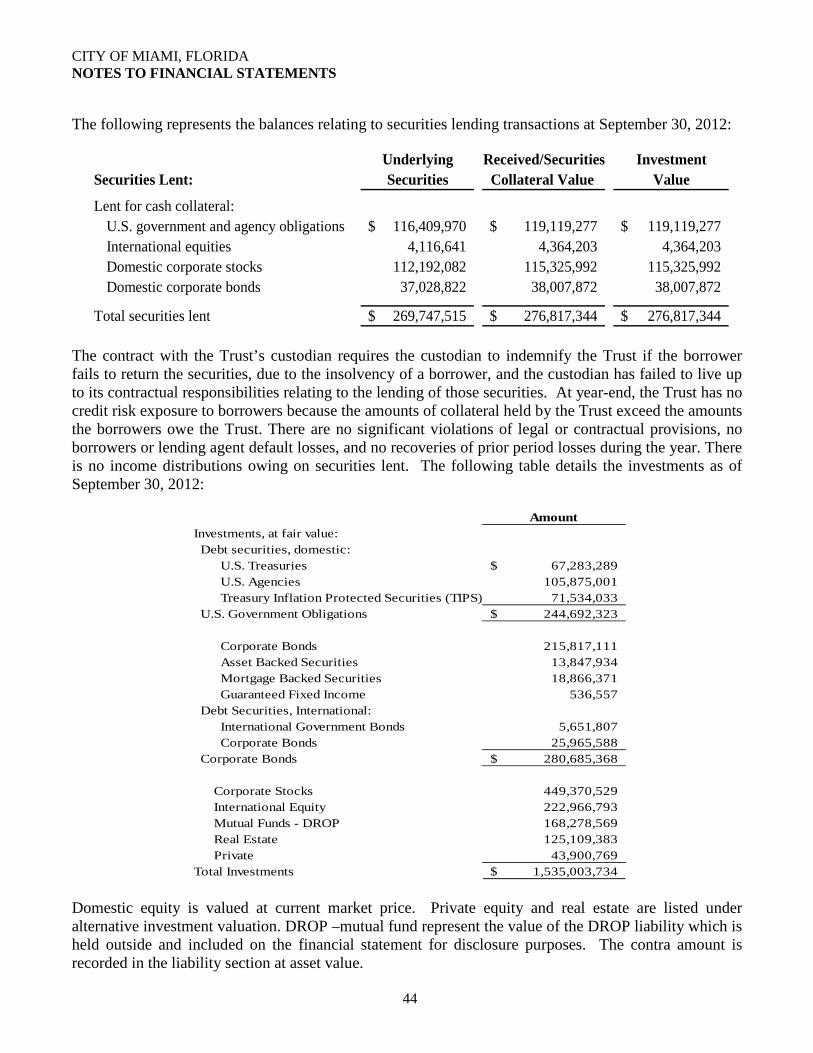
CITY OF MIAMI, FLORIDA NOTES TO FINANCIAL STATEMENTS
44
The following represents the balances relating to securities lending transactions at September 30, 2012:
Underlying Received/Securities InvestmentSecurities Lent: Securities Collateral Value Value
Lent for cash collateral:U.S. government and agency obligations 116,409,970$ 119,119,277$ 119,119,277$ International equities 4,116,641 4,364,203 4,364,203 Domestic corporate stocks 112,192,082 115,325,992 115,325,992 Domestic corporate bonds 37,028,822 38,007,872 38,007,872
Total securities lent 269,747,515$ 276,817,344$ 276,817,344$ The contract with the Trust’s custodian requires the custodian to indemnify the Trust if the borrower fails to return the securities, due to the insolvency of a borrower, and the custodian has failed to live up to its contractual responsibilities relating to the lending of those securities. At year-end, the Trust has no credit risk exposure to borrowers because the amounts of collateral held by the Trust exceed the amounts the borrowers owe the Trust. There are no significant violations of legal or contractual provisions, no borrowers or lending agent default losses, and no recoveries of prior period losses during the year. There is no income distributions owing on securities lent. The following table details the investments as of September 30, 2012:
Amount
Investments, at fair value: Debt securities, domestic: U.S. Treasuries 67,283,289$ U.S. Agencies 105,875,001 Treasury Inflation Protected Securities (TIPS) 71,534,033 U.S. Government Obligations 244,692,323$
Corporate Bonds 215,817,111 Asset Backed Securities 13,847,934 Mortgage Backed Securities 18,866,371 Guaranteed Fixed Income 536,557 Debt Securities, International: International Government Bonds 5,651,807 Corporate Bonds 25,965,588 Corporate Bonds 280,685,368$
Corporate Stocks 449,370,529 International Equity 222,966,793 Mutual Funds - DROP 168,278,569 Real Estate 125,109,383 Private 43,900,769
Total Investments 1,535,003,734$ Domestic equity is valued at current market price. Private equity and real estate are listed under alternative investment valuation. DROP –mutual fund represent the value of the DROP liability which is held outside and included on the financial statement for disclosure purposes. The contra amount is recorded in the liability section at asset value.
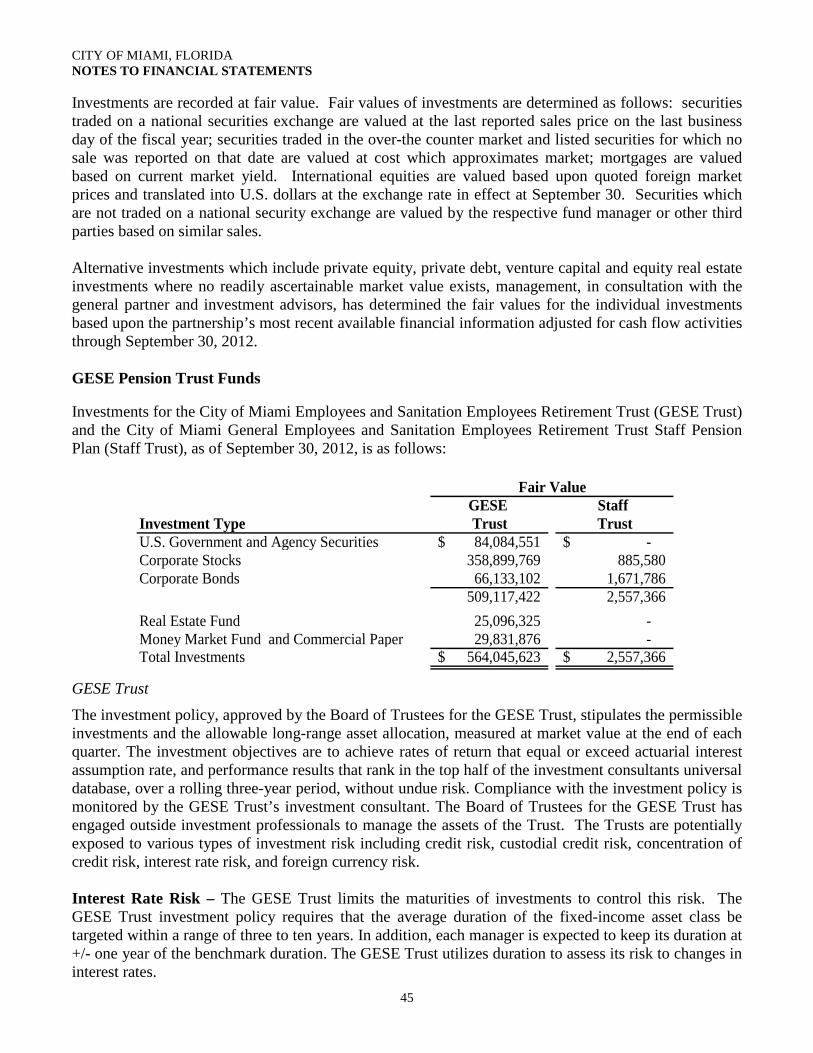
CITY OF MIAMI, FLORIDA NOTES TO FINANCIAL STATEMENTS
45
Investments are recorded at fair value. Fair values of investments are determined as follows: securities traded on a national securities exchange are valued at the last reported sales price on the last business day of the fiscal year; securities traded in the over-the counter market and listed securities for which no sale was reported on that date are valued at cost which approximates market; mortgages are valued based on current market yield. International equities are valued based upon quoted foreign market prices and translated into U.S. dollars at the exchange rate in effect at September 30. Securities which are not traded on a national security exchange are valued by the respective fund manager or other third parties based on similar sales. Alternative investments which include private equity, private debt, venture capital and equity real estate investments where no readily ascertainable market value exists, management, in consultation with the general partner and investment advisors, has determined the fair values for the individual investments based upon the partnership’s most recent available financial information adjusted for cash flow activities through September 30, 2012. GESE Pension Trust Funds Investments for the City of Miami Employees and Sanitation Employees Retirement Trust (GESE Trust) and the City of Miami General Employees and Sanitation Employees Retirement Trust Staff Pension Plan (Staff Trust), as of September 30, 2012, is as follows:
GESE Staff Investment Type Trust TrustU.S. Government and Agency Securities 84,084,551$ -$ Corporate Stocks 358,899,769 885,580 Corporate Bonds 66,133,102 1,671,786
509,117,422 2,557,366 Real Estate Fund 25,096,325 - Money Market Fund and Commercial Paper 29,831,876 - Total Investments 564,045,623$ 2,557,366$
Fair Value
GESE Trust The investment policy, approved by the Board of Trustees for the GESE Trust, stipulates the permissible investments and the allowable long-range asset allocation, measured at market value at the end of each quarter. The investment objectives are to achieve rates of return that equal or exceed actuarial interest assumption rate, and performance results that rank in the top half of the investment consultants universal database, over a rolling three-year period, without undue risk. Compliance with the investment policy is monitored by the GESE Trust’s investment consultant. The Board of Trustees for the GESE Trust has engaged outside investment professionals to manage the assets of the Trust. The Trusts are potentially exposed to various types of investment risk including credit risk, custodial credit risk, concentration of credit risk, interest rate risk, and foreign currency risk. Interest Rate Risk – The GESE Trust limits the maturities of investments to control this risk. The GESE Trust investment policy requires that the average duration of the fixed-income asset class be targeted within a range of three to ten years. In addition, each manager is expected to keep its duration at +/- one year of the benchmark duration. The GESE Trust utilizes duration to assess its risk to changes in interest rates.

CITY OF MIAMI, FLORIDA NOTES TO FINANCIAL STATEMENTS
46
The following represents the investment’s value and duration of the securities at September 30, 2012:
Weighted Avg.Investment Type Fair Value Maturity YearsOther Gov't 361,000$ 13.83Asset-Backed 1,614,000 1.39Corporate-Bank 10,583,000 2.96Corporate-Finance 9,310,000 4.39Corporate-Industrial 28,118,000 6.18Corporatet-Misc 1,285,000 8.28Corporate-Transportation 990,000 7.34Corporate-Comm. Utility 2,366,000 4.41Corporate-Electric Utility 1,734,000 4.06US Treasury Bonds 4,386,000 15.50US Treasury Notes 21,101,000 5.55US Agency 20,609,000 3.25Yankee-Finance 226,000 4.07Yankee-Industrial 1,526,000 5.69Mortgages 45,621,000 9.63Cash 4,737,000 0.00Other 2,003,000 4.23
Total 156,570,000$ 4.68 Credit Risk – The GESE Trust utilizes portfolio diversification in order to limit this risk as well as limiting investments to the highest rated securities as rated by nationally recognized rating agencies. The GESE Trust’s Investment Policy limits credit risk by requiring fixed-income securities to be rated by Moody’s as a Baa/BBB or better. However, a maximum of 5% of each manager’s portfolio may be invested in high yield securities rated by Moody’s/S&P as Caa/CCC or better. At September 30, 2012, the following table displays Moody’s ratings and the market value of the total fixed-income portfolio invested:
Fair Value PercentUS Treasury* 25,487,000$ 16.28%US Agency* 20,609,000 13.16%Other Government - AAA 361,000 0.23%Asset-Backed** 1,614,000 1.03%Mortgages** 45,621,000 29.14%Aa 5,754,000 3.68%A 32,398,000 20.69%Baa 17,833,000 11.39%Ba 2,156,000 1.38%Cash 4,737,000 3.03%Total 156,570,000$ 100.00%
Implied AAA rating There is no rating classification for these investments.
Custodial Credit Risk - The GESE Trust utilizes an independent custodial safekeeping agent for its investment activity. Custodial credit risk is limited since its investments are held in independent custodial safekeeping accounts, external investment pools, and/or open end mutual funds (SSgA Government STIF). All cash in each money manager’s portfolio is swept into this STIF account on a daily basis.
CITY OF MIAMI, FLORIDA NOTES TO FINANCIAL STATEMENTS
47
Concentration of Credit Risk - The GESE Trust utilizes limitations on securities of a single issuer or industry to manage this risk. The GESE Trust investment policy requires that corporate bond issues must be diversified by industry and in number so that no investment in the securities of a single issue shall exceed 7% (at market) of the value of the portfolio. Single industry weightings will be a maximum of 25%, except U.S. government and agency securities. Investments issued or explicitly guaranteed by the U.S. Government and investments in mutual funds, external investment pools and other pooled investments are not subject to concentration of credit risk. At September 30, 2012, the GESE Trust did not have any corporate bond investments with issuers greater than 5%. Foreign Currency Risk - The GESE Trust Investment policy allows a maximum of 10% of each manager’s portfolio to be invested in aggregate to Yankee bonds, foreign credits, Eurodollar bonds, and Rule 144A securities. At September 30, 2012, the GESE Trust did not have any foreign denominated fixed income investments. Staff Trust The investment policy for the Staff Trust was determined by the Board of Trustees and is monitored by the Staff Trust’s investment consultant. The policy stipulates the permissible investments, and the allowable long-range asset allocation, measured at market value, at the end of each quarter. The investment objectives are to achieve rates of return that equal or exceed actuarial interest assumption rate, and performance results that rank in the top half of the investment consultants universe database, over a rolling three-year period, without undue risk. The Board of Trustees has engaged outside investment professionals to manage the assets for the Staff Trust. Interest Rate Risk – The Staff Trust limits the maturities of investments to control this risk. The Staff Trust investment policy requires that the average duration of the fixed-income asset class be targeted within a range of three to ten years. In addition, the manager is expected to keep its duration at +/- one year of the benchmark duration. The effective duration of the passive mutual funds is 4.96 years. Credit Risk – The Staff Plan utilizes portfolio diversification in order to limit this risk as well as limiting investments to the highest rated securities as rated by nationally recognized rating agencies. The Staff Plan Investment Policy limits credit risk by requiring all fixed income securities to be rated by Moody’s/S&P as a Baa/BBB or better. The Board of Trustees for the GESE Trust has elected to hire outside investment professionals to manage the assets for the Staff Pension Plan. As of September 30, 2012, the fixed income assets of the pension plan were invested in a mutual fund managed passively by Vanguard.

CITY OF MIAMI, FLORIDA NOTES TO FINANCIAL STATEMENTS
48
The value of the fixed income portfolio was approximately $885,000. Vanguard manages the assets in accordance with the investment policy statement approved by the trustees. The table below summarizes the investments by credit rating at September 30, 2012:
Investment Type/Rating Fair Value ('000) PercentGovernment* 696$ 78.64%Aaa 2 0.23%Aa 17 1.92%A 91 10.28%Baa 79 8.93%
885$ 100.00%* Implied AAA rating
Custodial Credit Risk - This is the risk that in the event of the failure of the counterparty, the Plan will not be able to recover the value of its investments or collateral securities that are in the possession of an outside party. The Staff Trust utilizes an independent custodial safekeeping agent for its investment activity. Custodial credit risk is limited since its investments are held in independent custodial safekeeping accounts, external investment pools, and/or open-end mutual funds. All cash in each money manager’s portfolio is swept into a money market mutual fund on a daily basis. Concentration of Credit Risk - The Staff Trust utilizes limitations on securities of a single issuer or industry to manage this risk. Investments issued or explicitly guaranteed by the U.S. government and investments in mutual funds, external investment pools and other pooled investments are excluded from this requirement. The Staff Trust investment policy requires that corporate bond issues must be diversified by industry and in number so that no investment in the securities of a single issue shall exceed 20% (at market) of the value of the portfolio. Single industry weightings will be a maximum of 20%, except U.S. government and agency securities. As of September 30, 2012, the Staff Trust did not have any positions with issuers greater than 5%. Foreign Currency Risk – The Staff Trust Investment policy prohibits investments in foreign currency denominated securities and is therefore not exposed to foreign currency risk. Elected Official Retirement Trust (EORT) At September 30, 2012, the investments of EORT consisted of the following:
Investment Type Fair ValueFedernal National Mortgage Association 1,274,563$ Federal Home Loan Mortgage Corporation 1,264,237 Federal Home Loan Bank 1,404,959 Federal Farm Credit Bank 1,360,962 Money Market Funds 492,467
5,797,188$

CITY OF MIAMI, FLORIDA NOTES TO FINANCIAL STATEMENTS
49
Interest Rate Risk - Interest rate risk is the risk that as market rate changes the fair value of an investment will vary. Generally, the longer the maturity of an investment, the greater the sensitivity of its fair value to changes in the market interest rate. The City’s investment policy limits the maturity of an investment to a maximum of 5 years. As of September 30, 2012, EORT had the following investments with the respective weighted average maturity in years. The respective weighted average maturities were based on the securities call date, not the maturity date.
Weighted AverageInvestment Type Maturity In YearsFederal National Mortgage Association 4.58Federal Home Loan Mortgage Association 4.69Federal Home Loan Bank 4.20Federal Farm Credit Bank 4.75Money Market Funds Less than 1 year
The investments at September 30, 2012 are in compliance with the City’s investment policy. Credit Risk - The Plan’s investment policy minimizes credit risk by restricting authorized investments to the highest ratings of at least one of the nationally recognized statistical rating organizations (NRSROs). Investments in the State Board of Administration, The Local Government Surplus Funds Trust Fund, do not have a rating from the NRSRO. Commercial paper and bankers acceptances must have the highest letter and numerical rating as provided for by at least one NRSRO. At September 30, 2012, all of the Plan’s investments were held in Government Agencies and Money Market Funds. Money Market Funds are authorized by the City’s investment policy, but are not rated by the major rating agencies. Custodial Credit Risk - This is the risk that in the event of the failure of the counterparty, the Plan will not be able to recover the value of its investments or collateral securities that are in the possession of an outside party. The EORT Plan utilizes an independent custodial safekeeping agent for its investment activity. Custodial credit risk is limited since its investments are held in independent custodial safekeeping accounts, external investment pools, and/or open-end mutual funds. All cash in each money manager’s portfolio is swept into a money market mutual fund on a daily basis. All investments are held by the plans custodial bank and registered in the City’s name. Concentration of Credit Risk - The Plan’s policy establishes limitations on portfolio composition by investment type and by issuer to limit its exposure to concentration of credit risk. The policy provides that a maximum of 20% of the portfolio may be invested in SEC registered money market funds with no more than 10% to any single money market fund. A maximum of 100% of available funds may be invested in the Local Governments Surplus Funds Trust Fund. A maximum of 100% of the total portfolio may be invested in U.S. Government securities and federal instruments, with a limit of 25% invested in any one issuer of federal instruments. A maximum of 35% of the portfolio may be invested in prime commercial paper with a maximum of 5% with any one issuer. A maximum of 10% of the portfolio may be invested in banker’s acceptances with a maximum of 5% with any one issuer. At September 30, 2012, the EORT Trust did not have any positions with issuers greater than 5%.

CITY OF MIAMI, FLORIDA NOTES TO FINANCIAL STATEMENTS
50
NOTE 3. – RECEIVABLES Receivables at year-end for the City in individual major funds and non-major funds in the aggregate, including the applicable allowance for uncollectible accounts, are as follows:
SpecialObligation Public General Streets & Non-Major
Receivables General Bonds Safety Government Sidewalks Govt Funds Total
Accounts 34,213,204$ 250,000$ -$ 3,012,408$ 103,671$ 5,397,253$ 42,976,536$
Property Taxes 9,036,487 - - - - 991,460 10,027,947
Due from Other Govts 6,863,521 - 4,783 370,484 1,392,417 23,387,186 32,018,391
Loan to component unit - - - - - 1,950,000 1,950,000
Loan Receivables 179,502 13,821,923 - - - - 14,001,425
Gross Receivables 50,292,714 14,071,923 4,783 3,382,892 1,496,088 31,725,899 100,974,299
Less: Allowance for:
Uncollectibles (13,712,382) (13,821,923) - (3,012,408) (103,671) (4,384,859) (35,035,243)
Net Total Receivables 36,580,332$ 250,000$ 4,783$ 370,484$ 1,392,417$ 27,341,040$ 65,939,056$
On November 17, 2011, the City, Miami-Dade County (the “County”), and the U.S. Department of Housing and Urban Development (“HUD”) amended (the “First HUD Loan Amendment”) their earlier May 13, 2001 Assumption of Loan Guarantee Assistance Liability and Pledge Agreement (“HUD Loan Assumption Agreement”) in order to refinance the Parrot Jungle Project (“Project”) HUD Section 108 Loan originally evidenced by an earlier note in the original principal amount of $25,000,000 (the “Old Note”) under a new note at a lesser interest rate for the then currently outstanding principal amount of $15,560,000 (the “New Note”). The refinancing under the New Note remained in accordance with the pro-rata payment obligations under a continuing Participation Agreement for the Parrot Jungle Project HUD Section 108 Loan whereby the City’s pro-rata payment obligations remain eighty percent (80%) and the County’s pro-rata payment obligations remain twenty percent (20%). The City and the County have multiple continuing agreements, which have been amended over time, with Parrot Jungle and Gardens of Watson Island, Inc. and its various related entities (now known collectively as “Jungle Island”), regarding, inter alia, (1) the borrowing by Jungle Island of the Parrot Jungle Project HUD Section 108 Loan proceeds from the County and the City, (2) the leasing by Jungle Island of City-owned property for the construction of the Project, (3) City and County payments to HUD for the Parrot Jungle Project HUD Section 108 Loan due to Jungle Island’s inability to pay during construction and start-up of the Project, and (4) another loan from the City to Jungle Island of $800,000 for the payment of ad valorem taxes on the Jungle Island property to the County. At this time, Parrot Jungle’s payment obligations to the City are as follows:
1. Parrot Jungle Project HUD Section 108 Loan Deferred Payments will begin August 1, 2019
to repay the City’s earlier 80% payments to HUD in the approximate amount of $13.8 million;
2. Regular Lease Rent Payments begin April 1, 2013 from Jungle Island to the City based upon a “Gross Revenues” monthly calculation;
3. Deferred Lease Rent Payments due from Jungle Island to the City based upon a minimum rent/percentage rent calculation formula. The deferred rent amounts to $2.7 million and is not due to the City until December 31, 2020, and therefore is not presented as a receivable and related deferred revenue in the governmental fund financial statements.

CITY OF MIAMI, FLORIDA NOTES TO FINANCIAL STATEMENTS
51
4. Property Tax Loan Payments are ongoing from Jungle Island to the City regarding the $800,000 paid by the City to the County for the Project. The payments due to the City are current as of September 30, 2012 the balance due is $179,502.
5. State Deed Restriction Waiver Payments are ongoing from Jungle Island for payment by the City to the State of Florida, Board of Trustees of the Internal Improvement Fund.
Additionally, those multiple agreements contain certain continuing job creation and retention requirements which are ongoing throughout the operations periods of each agreement. The receivable balances relating to the above obligations are reported in the Special Obligations Fund and the General Fund. Single-Family Homeownership and Rehabilitation Programs Single-family home rehabilitation and homeownership programs funded under the Community Development Block Grant (CDBG), HOME Investment Partnership Loan Program (HOME), American Dream Down Payment Initiative (ADDI), State Housing Initiative Partnership Program (SHIP) and Affordable Housing Trust Fund, generally are repaid when the related properties are transferred or sold. If the property is transferred or sold before the end of the “loan” period, the proceeds from the repayment including interest, if any, are then returned to the program to assist additional low-income families. If the homeowners remain in their homes for the full term of the deferred loan, the loan is “forgiven” and becomes a grant. A mortgage or a covenant is placed against the property to ensure the repayment of the loan and interest. Given the nature of these “loans”, collection is not assured, consequently they are not recognized in the financial statements. A summary of single-family, deferred long-term loans that are not recognized in the financial statements is as follows:
Program Loans Outstanding AmountCDBG 76 loans 2,005,348$ HOME 545 loans 22,749,139 SHIP 300 loans 12,572,834 Other 99 loans 2,017,368 Total 1,020 loans 39,344,689$
September 30, 2012
Home Ownership and Rental Multi-Family Loans As of September 30, 2012, there are 108 projects aggregating to $57,493,187 for new construction or rehabilitation of multi-family units, which under the terms of the loan agreement are to be repaid if program conditions are not met. Home ownership loans are usually “forgiven” to the developer and transferred to the home buyer. The home buyer loans are usually amortizable or deferred during the life of the affordability period. Such loans will be forgiven and become grants if the homeowners remain in their homes during the full term of the loan. Given the nature of these “loans”, collections is not assured, consequently they are not recognized in the financial statements.

CITY OF MIAMI, FLORIDA NOTES TO FINANCIAL STATEMENTS
52
Economic Development Commercial Loans As of September 30, 2012, there are 30 loans aggregating to $9,769,994 for Special Economic Development projects under the CDBG program. Those projects are collateralized by placing a mortgage against the property of the business or non-profit entity’s assets to ensure repayment of the loan and interest to the City. Some of these “loans” are written with no interest payment or deferred payments and are “forgivable”, if all program conditions are met. Given the nature of these “loans”, collection is not assured, consequently they are not recognized in the financial statements. NOTE 4. – PROPERTY TAXES Property taxes are assessed according to the value determined by the Miami-Dade County Property Appraiser on January 1st of each year and are due, with discounts of one to four percent allowed if paid prior to March 1st of the following calendar year. Taxpayers also have the option of paying their taxes in advance in equal quarterly payments based on the prior year's tax assessment with quarterly discounts varying between 2% and 4%. All unpaid taxes on real and personal property become delinquent on April 1st and bear interest at 18% until a tax sale certificate is sold at auction. The County bills and collects all property taxes for the City, and sells tax certificates for delinquent taxes. The assessed value of property, as established by the Miami-Dade County Property Appraiser, at January 1, 2011, upon which the 2011-2012 levy was based, was $31,333,834,037. The City is permitted by Article 7, Section 8 of the Florida Constitution to levy taxes up to $10 per $1,000 of assessed valuation for general governmental services other than the payment of principal and interest on general obligation long-term debt. In addition, unlimited amounts may be levied for the payment of principal and interest on general obligation long-term debt, subject to a limitation on the amount of debt outstanding. The tax rate to finance general governmental services (other than the payment of principal and interest on general obligation long-term debt) for the year ended September 30, 2012, was $7.5710 per $1,000. The debt service tax rate for the same period was $0.900 per $1,000. Property taxes receivable reported in the government-wide Statement of Net Assets and the governmental funds Balance Sheet represent amounts due for unpaid delinquent property taxes at September 30, 2012. Property taxes that are not considered “available” have been reported as deferred revenues in the governmental funds Balance Sheet.

CITY OF MIAMI, FLORIDA NOTES TO FINANCIAL STATEMENTS
53
NOTE 5. – CAPITAL ASSETS The following is a summary of changes in capital assets during the year ended September 30, 2012:
Beginning Additions/ Retirements/ Ending Balance Transfers In Transfers Out Balance
Governmental Activities:Non-Depreciable Assets:
Land 92,726,315$ 857,660$ -$ 93,583,975$ Construction in Progress 251,326,647 66,772,982 (269,876,817) 48,222,812
Total Capital Assets, not being depreciated 344,052,962 67,630,642 (269,876,817) 141,806,787 Depreciable Assets:
Buildings 195,052,688 103,542,040 - 298,594,728 Improvements 217,840,140 46,836,778 - 264,676,918 Machinery and Equipment 185,361,321 16,160,422 (1,849,854) 199,671,889 Infrastructure 1,190,728,053 109,139,561 (495) 1,299,867,119
Total Capital Assets being depreciated 1,788,982,202 275,678,801 (1,850,349) 2,062,810,654 Less Accumulated Depreciation for:
Buildings 90,358,500 8,375,720 - 98,734,220 Improvements 70,001,291 20,386,195 - 90,387,486 Machinery and Equipment 135,713,685 9,939,566 (1,684,540) 143,968,711 Infrastructure 676,062,672 38,447,153 - 714,509,825
Total accumulated depreciation 972,136,148 77,148,634 (1,684,540) 1,047,600,242 Total Capital Assets being depreciated, net 816,846,054 198,530,167 (165,809) 1,015,210,412
Governmental activities capital assets, net 1,160,899,016$ 266,160,809$ (270,042,626)$ 1,157,017,199$
Depreciation expense was charged to governmental functions as follows: Depreciation
Function/Program Activities ExpenseGeneral Government 40,966,520$ Planning and Development 115,208 Community Development 35,242 Community Redevelopment Areas 297,899 Public Works 6,485,133 Public Safety 8,203,851 Public Facilities 3,628,454 Parks and Recreation 17,416,327
Total depreciation expense 77,148,634$
During the fiscal year, the City purchased recycling bins for governmental type activities under a lease purchase financing agreement. The purchased equipment is provided as collateral via a “lease purchase” financing arrangement for a three year term. Obligations under the lease purchase agreement are recorded at the present value of their future minimum lease payments beginning October 1, 2012. The aggregate amount of the purchase was $3.8 million and the bins were capitalized as of September 30, 2012. In Fiscal Year 2012, the City recorded depreciation expense related to errors for assets not properly categorized—(moved from CIP to their respective asset category and depreciated) of approximately $12.6 million. Had these errors been corrected in the respective fiscal year, the beginning net assets in Fiscal Year 2012 would have been $12.6 million lower. Construction Commitments As of September 30, 2012, the City had in progress various construction projects that were not completed with remaining balances totaling $38,382,532. Funding of these projects is to be made primarily through the proceeds of the related bond issues, loans, and future tax revenues.

CITY OF MIAMI, FLORIDA NOTES TO FINANCIAL STATEMENTS
54
Discretely Presented Component Units Capital Assets The following is a summary of changes in capital assets of the component units during the year ended September 30, 2012: MSEA, CIP, BID and HFA did not have any capital asset balances at September 30, 2012. A summary of the changes in capital assets for DOSP is as follows:
DOSP
Beginning Additions/ Retirements/ EndingBalance Transfers In Transfers Out Balance
Capital assets, not being depreciated:Land 14,152,054$ -$ (1,013,794)$ 13,138,260$ Construction in progress 233,017 1,698,794 (127,968) 1,803,843
Total capital assets, not being depreciated 14,385,071 1,698,794 (1,141,762) 14,942,103
Capital assets, being depreciated:Building and structures 72,191,633 319,341 (200,449) 72,310,525 Leasehold improvements 10,630,423 33,563 (175,776) 10,488,210 Furniture and fixtures 1,080,795 15,030 (163,863) 931,962 Equipment 18,410,761 237,941 (2,686,354) 15,962,348
Total capital assets, being depreciated 102,313,612 605,875 (3,226,442) 99,693,045
Less accumulated depreciation for:Building and structures 18,574,502 1,903,080 (200,449) 20,277,133 Leasehold improvements 8,500,071 396,665 (175,776) 8,720,960 Furniture and fixtures 326,918 74,221 (163,863) 237,276 Equipment 14,302,245 1,186,251 (2,683,097) 12,805,399
Total accumulated depreciation 41,703,736 3,560,217 (3,223,185) 42,040,768 Total capital assets, being depreciated, net 60,609,876 (2,954,342) (3,257) 57,652,277
DOSP capital assets, net 74,994,947$ (1,255,548)$ (1,145,019)$ 72,594,380$
A summary of the changes in capital assets for DDA is as follows:
DDA
Beginning Additions/ Retirements/ EndingCapital assets, being depreciated: Balance Transfers In Transfers Out Balance
Furniture and equipment 515,809$ 7,849$ -$ 523,658$
Less accumulated depreciation for:Furniture and equipment (360,845) (26,655) - (387,500)
DDA capital assets, net 154,964$ (18,806)$ -$ 136,158$

CITY OF MIAMI, FLORIDA NOTES TO FINANCIAL STATEMENTS
55
A summary of changes in capital assets for BFP is as follows: BFP
Beginning Additions/ Retirements/ EndingBalance Transfers In Transfers Out Balance
Capital assets, not being depreciated:Land 516,129$ -$ -$ 516,129$ Construction in progress - - - -
Total capital assets, not being depreciated 516,129 - - 516,129
Capital assets, being depreciated:Buildings 2,637,934 - - 2,637,934 Public domain and system infrastructure 5,363,559 39,025 - 5,402,584 Machinery and equipment 444,125 28,329 - 472,454
Total capital assets, being depreciated 8,445,618 67,354 - 8,512,972
Less accumulated depreciation for:Buildings (1,229,997) (52,759) - (1,282,756) Public domain and system infrastructure (1,998,379) (218,804) - (2,217,183) Machinery and equipment (349,114) (24,403) - (373,517)
Total accumulated depreciation (3,577,490) (295,966) - (3,873,456) Total capital assets being depreciated, net 4,868,128 (228,612) - 4,639,516
BFP capital assets, net 5,384,257$ (228,612)$ -$ 5,155,645$
Summary of discretely presented component unit capital assets at September 30, 2012 is as follows:
DOSP DDA BFP TotalCapital Assets: Non-depreciable 14,942,103$ -$ 516,129$ 15,458,232$ Depreciable, Net 57,652,277 136,158 4,639,516 62,427,951
72,594,380$ 136,158$ 5,155,645$ 77,886,183$
Depreciation expenses was charged to the discretely presented component units as follows:
Entity Depreciation ExpenseDOSP 3,560,217$ DDA 26,655 BFP 295,966 Total depreciation expense 3,882,838$

CITY OF MIAMI, FLORIDA NOTES TO FINANCIAL STATEMENTS
56
NOTE 6. – ACCOUNTS PAYABLE AND ACCRUED LIABILITIES Accounts payable and accrued liabilities in the governmental funds balance sheet at September 30, 2012 consisted of the following:
Non-Major
Public General Streets & Governmental
General Safety Government Sidewalks Funds Total
Accounts Payables 12,499,512$ 407,853$ 157,881$ 4,029,742$ 13,012,818$ 30,107,806$
Retainage 33,710 49,505 256,295 869,942 3,204,216 4,413,668
Salaries and
Benefits 8,107,364 - - - - 8,107,364 Total 20,640,586$ 457,358$ 414,176$ 4,899,684$ 16,217,034$ 42,628,838$ NOTE 7. – INTERFUND RECEIVABLES, PAYABLES, AND TRANSFERS The balances reflected as due from/due to other funds as of September 30, 2012 are as follows:
AmountGeneral Fund Other Non-Major 5,469,657$
Governmental Funds
Total 5,469,657$
Payable FundReceivable Fund
These outstanding balances between funds result mainly from the time lag between the dates that (a) interfund goods and services are provided or reimbursable expenditures occur, (b) transactions are recorded in the accounting system, and (c) payments between funds are made. The following is a summary of interfund transfers for the year ended September 30, 2012:
Special NonmajorObligation Public General Street & Governmental
Transfer Out General Bonds Safety Government Sidewalks Funds TotalGeneral -$ 20,519,000$ -$ 1,400,000$ 1,403,800$ 9,707,117$ 33,029,917$ Public Safety - - - 25,000 - - 25,000 General Government - - 1,498,586 - 852,152 7,984,924 10,335,662 Street & Sidewalks - - - 2,000,000 - 23,151,319 25,151,319 Nonmajor
Governmental Funds 4,590,247 15,449,904 29,305 10,369 4,273,862 21,367,643 45,721,330 Total 4,590,247$ 35,968,904$ 1,527,891$ 3,435,369$ 6,529,814$ 62,211,003$ 114,263,228$
Transfer In
Transfers are used to (a) move revenues from the fund that statute or budget requires to collect them to the fund that statute or budget requires to expend them, (b) move receipts restricted to debt service from the funds collecting the receipts to the debt service fund as debt service payments become due, and (c) move unrestricted revenues collected in the general and public services tax funds to finance various programs accounted for in other funds in accordance with budgetary authorizations. During the fiscal year, transfers in to the General Fund totaled $4.6 million. This total was comprised of transfers from the Omni CRA of $0.7 to fund the Police Visibility Program and a $3.9 million one-time

CITY OF MIAMI, FLORIDA NOTES TO FINANCIAL STATEMENTS
57
transfer from the Emergency Services Fund by FEMA for reimbursement of expenditures paid by the General Fund during Hurricanes Katrina and Wilma which were reimbursed during fiscal year 2012. Transfers into the Special Obligation Bond Fund for the payment of debt service includes funds from the Public Service Tax, Local Option Fuel Tax, Transportation Surtax, Parking Surcharge and JL Knight Convention Center revenue. Transfers out of the Streets and Sidewalks Fund to nonmajor Governmental Funds which include the newly created fund titled Transportation and Transit Capital Projects Fund; segregates the proceeds received from the Citizen’s Independent Transportation Trust which are appropriated for qualifying capital projects. NOTE 8. – LONG-TERM OBLIGATIONS Changes in Long-Term Obligations The following is a summary of changes in long-term obligations for the year ended September 30, 2012:
Beginning Ending Due withinBalance Additions Reduction Balance One Year
General Obligation Bonds 251,566,791$ -$ (11,578,376)$ 239,988,415$ 11,017,644$ Special Obligation and Revenue
Bonds and Loans 475,292,475 3,600,000 (16,553,815) 462,338,660 60,170,176 Total General Obligation/Special Obligation and 726,859,266 3,600,000 (28,132,191) 702,327,075 71,187,820 Revenue Bonds and Loans
Accretion 27,870,904 - (4,609,669) 23,261,235 - Bond Premium (discounts) 6,197,664 - (767,724) 5,429,940 - Deferred loss on Advance Refunding (4,228,837) 726,580 - (3,502,257) -
Total bonds costs 29,839,731 726,580 (5,377,393) 25,188,918 - Total Bonds and Loans 756,698,997 4,326,580 (33,509,584) 727,515,993 71,187,820
Other liabilities:Compensated Absences 68,828,653 5,677,286 (8,253,605) 66,252,334 7,965,982 Claims Payable 207,941,602 57,887,062 (51,101,608) 214,727,056 52,664,602 Other Post Employment Benefits 119,206,547 44,552,000 (7,340,547) 156,418,000 - Net Pension Obligation 4,575,196 496,201 (514,907) 4,556,490 - Total Governmental Activities Long-term Liabilities 1,157,250,995$ 112,939,129$ (100,720,251)$ 1,169,469,873$ 131,818,404$
Primary Government
Claims payables, compensated absences, and the net pension obligations are generally liquidated by the General Fund. Claims payable balance of $214,727,056 includes an accrual of $2,045,829 for pollution remediation obligations, which are obligations to address the current or potential detrimental effects of existing pollution and $3,003,819 for potential legal claims. The claims payables reported for the City’s self-insurance is discussed in Note 9 and material legal contingencies are discussed in Note 12.

CITY OF MIAMI, FLORIDA NOTES TO FINANCIAL STATEMENTS
58
Bonds and Loans Outstanding – Summarized below are the City’s bond and loan issues, which are outstanding at September 30, 2012:
Purpose of Amount Outstanding Interest RateDESCRIPTION Issue Issued Balance RangeGeneral Obligation Bonds:
Homeland Defense/Neighborhood CIPSeries 2002 (Limited) Homeland Defense 153,186,406$ 22,063,415$ 4.17%-4.97%
General Obligation Refunding BondsSeries 2002A Refunding 32,510,000 16,715,000 5.0%-5.375%
General Obligation BondsSeries 2003B Refunding 4,180,000 2,740,000 2.635%-3.5%
Homeland Defense/Neighborhood CIPSeries 2007A (Limited) Refunding 103,060,000 102,500,000 4%-5%
Homeland Defense/Neighborhood CIPSeries 2007B (Limited) Homeland Defense 50,000,000 50,000,000 4.995%-5%
Homeland Defense/Neighborhood CIPSeries 2009 (Limited) Homeland Defense 51,055,000 45,970,000 3%-5.5%Total General Obligation Bonds 393,991,406$ 239,988,415$
Special Obligation and Revenue Bonds and Loans:Special Revenue Refunding Bonds
Series 1987 Refunding 65,271,325$ 2,161,796$ 5.25%-7.3%Community Redevelopment Revenue Bonds
Series 1990 Redevelopment 11,500,000 1,170,000 8.50%Special Obligation Non-Ad Valorem Revenue
Series 1995 Pension 72,000,000 26,885,000 6.5%-7.25%Special Revenue Refunding Bonds
Series 2002A Refunding 27,895,000 18,330,000 3.5%-5.375%Special Revenue Refunding Bonds
Series 2002C Refunding 28,390,000 14,025,000 3.1%-4.375%Special Obligation Non-Ad Valorem Refunding Bonds
Series 2009 Refunding 37,435,000 35,395,000 3.4%-7.55%Special Obligation Tax-Exempt Revenue Bonds
Series 2010A Parking 84,540,000 84,540,000 5%-5.25%Special Obligation Tax Revenue Bonds, Garages
Series 2010B Parling 16,830,000 16,830,000 5.9375%-7.443%SEOPW - Section 108 HUD Loan Redevelopment 5,100,000 1,250,000 (1)Wagner Square Section 108 HUD Loan Redevelopment 4,000,000 3,413,000 (1)Special Revenue Bonds Street & Sidewalks 80,000,000 74,225,000 3.5%-5.0%
Series 2007Special Revenue Bonds Street & Sidewalks 65,000,000 63,160,000 2.5%-5.625%
Series 2009 Port of Miami Tunnel Loan Tunnel 50,000,000 45,000,000 (2)Special Obligation Refunding Bonds
Series 2011-A Refunding 70,645,000 70,645,000 4.00%-6.00%Gran Central Corporation Loan Redevelopment 1,708,864 1,708,864 0.00%Mears Leasing Company Recycling Bins 3,600,000 3,600,000 3.02%
Total Special Obligation Bonds, Revenue Bonds, and Loans 623,915,189$ 462,338,660$ Total Bonds and Loans 1,017,906,595$ 702,327,075$
(1) These are variable rate loans. The interest is calculated monthly and paid to the trustee quarterly. (2) This is a variable rate loan. The interest is calculated yearly and paid to the trustee annually

CITY OF MIAMI, FLORIDA NOTES TO FINANCIAL STATEMENTS
59
Annual Debt Service Requirements to Maturity The annual debt service requirements for all bonds and loans outstanding as of September 30, 2012 are as follows:
Special Obligation,Year General Revenue Bonds,
Ended Obligation Bonds and Loans TotalSeptember 30, Principal Interest Principal Interest Principal Interest
2013 11,017,644$ 13,731,697$ 60,170,176$ 29,350,774$ 71,187,820$ 43,082,471$ 2014 11,592,518 13,780,673 15,206,077 26,636,003 26,798,595 40,416,676 2015 12,339,949 13,741,374 11,006,407 25,684,675 23,346,356 39,426,049 2016 14,908,304 11,165,643 9,975,000 20,652,894 24,883,304 31,818,537 2017 17,000,000 9,067,485 19,478,000 19,838,214 36,478,000 28,905,699
2018-2022 101,080,000 31,379,508 84,882,000 82,903,322 185,962,000 114,282,830 2023-2027 54,655,000 11,958,810 69,371,000 62,897,738 124,026,000 74,856,548 2028-2032 17,395,000 677,694 80,365,000 41,365,231 97,760,000 42,042,925 2033-2037 - - 80,660,000 20,710,106 80,660,000 20,710,106 2038-2039 - - 31,225,000 1,787,223 31,225,000 1,787,223
Total 239,988,415$ 105,502,884$ 462,338,660$ 331,826,180$ 702,327,075$ 437,329,064$
Synopsis of Bond Covenants
Debt service for general obligation bonds is provided for by a tax levy on non-exempt property value. The total general obligation debt outstanding is limited by the City Charter to 15% of the assessed non-exempt property value. At September 30, 2012, the statutory limitation of assessed non-exempt property value for the City amounted to $4,533,761,443 providing a debt margin of $4,295,725,019 after consideration of $238,036,424 of general obligation bonds outstanding at September 30, 2012 and adjusted for the fund balance of $1,951,991 in the related Debt Service Fund. Pledged Revenue The City pledged future revenue proceeds of (i) 80% People Transportation Taxes, (ii) 100% new Local Option Gas Taxes, and (iii) 20% of the City’s Parking Surcharge to repay $80,000,000 in Special Obligation Revenue Bonds, Series 2007 and $65,000,000 in Special Obligation Revenue Bonds, Series 2009. The proceeds from the bonds were used for the improvement of streets, sidewalks and drainage within the City. Those bonds are payable solely from the pledged revenues listed above through January 1, 2039. Principal and interest paid for the current year were $2,460,000 and $7,044,375 respectively. The current year revenues were (i) $13,537,633, (ii) $6,682,646, and (iii) $17,633,174 respectively. Principal and interest to be paid in subsequent years totals $130,610,322 on the Series 2007 bonds and $126,050,991 on the Series 2009 bonds. The City further pledged future revenue proceeds of (i) 100% Convention Development Taxes, (ii) Parking Revenues in connection with MLB Home Games at the Miami Marlins Baseball Stadium, and (iii) Parking Surcharge revenues on the Parking Revenues to repay $84,540,000 Tax-Exempt Special Obligation Parking Revenue Bonds, Series 2010A and $16,830,000 Taxable Special Obligation Parking Revenue Bonds, Series 2010B. The proceeds from the bonds were used for the construction of the parking facilities for the Miami Marlins Baseball Stadium. The bonds are payable solely from the pledged revenues listed above through July 1, 2039. Debt service payments began on January 1, 2012. Principal and interest to be paid in subsequent years totals $181,456,700 on the Series 2010A bonds and $31,238,422 on the Series 2010B bonds.

CITY OF MIAMI, FLORIDA NOTES TO FINANCIAL STATEMENTS
60
All other Special Obligation debt of the City is collateralized by covenants to budget and appropriate non-ad valorem revenues in accordance with their bond indentures. The bond indentures require that sufficient funds be available in the sinking fund to meet the annual debt service requirements. At September 30, 2012, the City had approximately $32.3 million available in the sinking fund to meet this requirement. Principal and interest to be paid in subsequent years totals $323,144,428 on all other Special Obligation debt of the City. Escrow Agreement On March 17, 1997, an agreement was entered into by and among an Escrow Agent, the Oversight Board, acting through its committee (Fiscal Sufficiency Advisory Board), and the City. The agreement directs the Escrow Agent to establish two escrow accounts, and maintain appropriate balances to ensure the timely payment of debt service on outstanding bonds and other debt obligations with no third party trustee. The City has agreed that certain ad valorem tax revenues received will be deposited each month into the escrow account in an amount specified by the underlying agreement. If the ad valorem taxes received in any month are inadequate to make the required deposit, the City must use other sources of funds to supplement the required deposits. The City also made deposits of $19,617,502 with the Escrow Agent during fiscal year 2012 to cover its debt service requirements on outstanding bonds and other debt obligations. The City has agreed to deposit revenues each month in amounts specified in the underlying agreement. Discretely Presented Component Units Long-Term Debt DOSP The changes in DOSP’s long-term debt for 2012 are as follows (‘000):
Beginning Ending Due WithinBalance Additions Reductions Balance One Year
Bonds payable 71,645$ -$ 910$ 70,735$ 960$ Deferred amounts (2,135) - (69) (2,066) - Compensated absences 593 478 495 576 427 Other post-employmentbenefit obligation 61 10 - 71 - Loan from primary government 2,100 - 150 1,950 150
72,264$ 488$ 1,486$ 71,266$ 1,537$
The City has issued fixed rate revenue bonds on behalf of DOSP. The principal and interest of the revenue bonds are payable solely from the revenues of the parking facilities and, accordingly, are included in the accounts of the DOSP. The DOSP, on July 21, 2005, entered into a loan agreement with the City of Miami. The loan was obtained through CDBG program funds up to a maximum of $3,000,000 to be used for the construction of a parking garage facility. Funds are disbursed on a reimbursement basis. The loan bears no interest and is payable in 40 semi-annual installments of $75,000 starting December 1, 2005. As of September 30, 2012, DOSP has drawn $3,000,000 of this loan. The balance as of September 30, 2012 is $1,950,000.

CITY OF MIAMI, FLORIDA NOTES TO FINANCIAL STATEMENTS
61
The following summarizes the debt service to maturity of outstanding DOSP debt at September 30, 2012:
Year Ending LoanSeptember 30, Principal Interest Total Principal
2013 960,000 3,511,072 4,471,072 150,000 2014 1,005,000 3,460,691 4,465,691 150,000 2015 1,060,000 3,406,485 4,466,485 150,000 2016 1,115,000 3,349,391 4,464,391 150,000 2017 1,505,000 3,243,187 4,748,187 150,000
2018-2022 8,815,000 14,865,225 23,680,225 750,000 2023-2027 11,130,000 12,480,601 23,610,601 450,000 2028-2032 14,065,000 9,354,275 23,419,275 - 2033-2037 17,975,000 5,242,294 23,217,294 - 2038-2040 13,105,000 699,500 13,804,500 -
Total 70,735,000$ 59,612,721$ 130,347,721$ 1,950,000$
Range of Rates 4.25%-5.66%
Bonds
NOTE 9. – SELF-INSURANCE A. Risk Management Section 768.28, Florida Statutes, provides for waiver of sovereign immunity in tort actions or claims against the state and its agencies and subdivisions. The present limit of recovery in the absence of special relief granted by the Florida legislature is $200,000 per person per claim or judgment. The limit of recovery for all claims or judgments arising out of the same incident or occurrence is $300,000. Under the protection of this sovereign immunity limit, Florida Statutes 768.28 and Chapter 440, Florida Statutes covering Workers’ Compensation, the City has established a self-insured program to provide coverage for almost all areas of liability including Workers’ Compensation, General Liability, Automotive Liability, Police Professional Liability, Public Officials’ Liability, and Employment Practices Liability. In addition, the City also purchases excess insurance coverage to limit catastrophic losses associated with its liability exposures. The excess liability insurance program provides for $20 million in combined limits. The excess insurance program currently has a self-insured retention of $750,000 per occurrence for Workers’ Compensation, and $500,000 for all other liability coverages. The City also purchases dedicated commercial general liability policies for the Grapeland Waterpark, Bayfront Park, and the various marinas that it operates. These policies typically carry a $1 million limit per occurrence and on an aggregate basis, with a $1,000 deductible. The City’s master property insurance program provides for a total of $100 million in insurance limits for the City’s $444 million property values. Included in this amount is $25 million for named windstorm and flood coverage. With the exception of earthquake, flood and named windstorm, the All-Other-Perils deductible is $50,000 per occurrence. In regard to the named windstorm, flood, and earthquake exposures, the deductible is 5% of the location’s value at the time of loss with a minimum of $250,000. The City also maintains separate property insurance programs for the James L. Knight Center and the Marlins Stadium parking garages. The James L. Knight Center property program provides $46,442,539 in limits for all perils including windstorm and flood. The James L. Knight Center property program has a $50,000 all other perils deductible, and a deductible of 5% of total insured values at time of loss, with a $1,000,000 minimum for named windstorm and flood perils. The Marlins Stadium parking garage program provides for $25 million in total limits for windstorm and flood, and for $81,200,000 for all other perils. The Marlins Stadium parking garage program has a $25,000 all other perils deductible, and
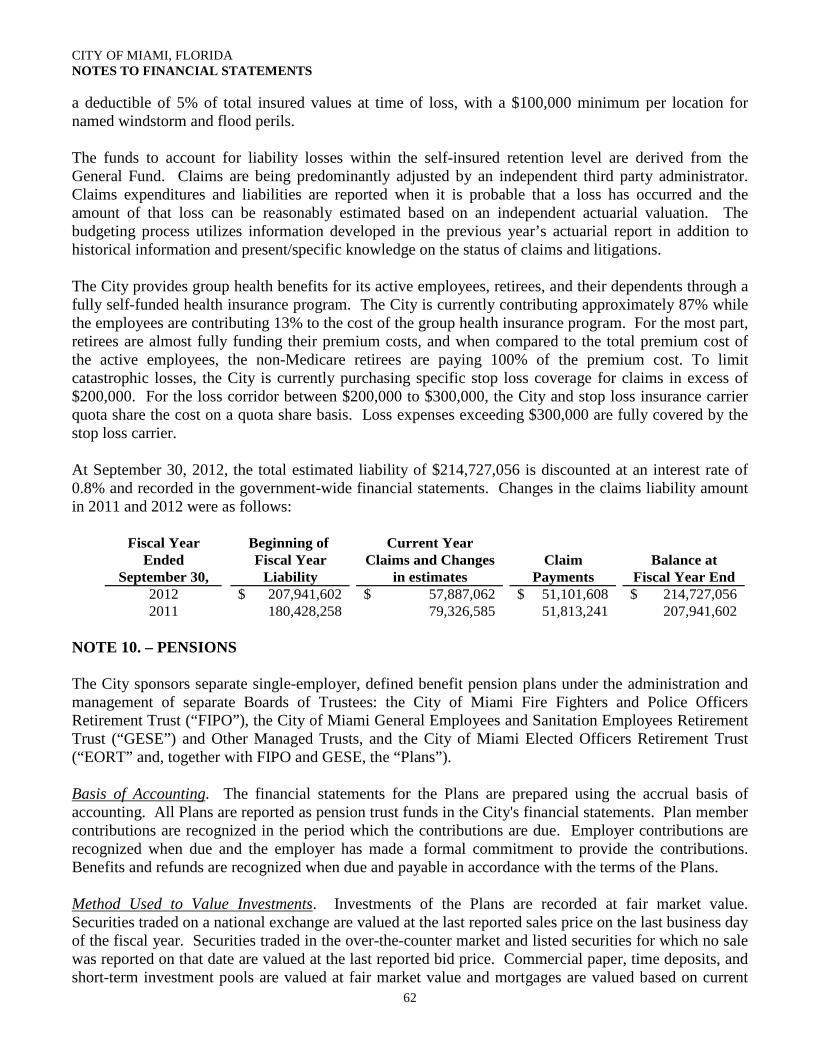
CITY OF MIAMI, FLORIDA NOTES TO FINANCIAL STATEMENTS
62
a deductible of 5% of total insured values at time of loss, with a $100,000 minimum per location for named windstorm and flood perils. The funds to account for liability losses within the self-insured retention level are derived from the General Fund. Claims are being predominantly adjusted by an independent third party administrator. Claims expenditures and liabilities are reported when it is probable that a loss has occurred and the amount of that loss can be reasonably estimated based on an independent actuarial valuation. The budgeting process utilizes information developed in the previous year’s actuarial report in addition to historical information and present/specific knowledge on the status of claims and litigations. The City provides group health benefits for its active employees, retirees, and their dependents through a fully self-funded health insurance program. The City is currently contributing approximately 87% while the employees are contributing 13% to the cost of the group health insurance program. For the most part, retirees are almost fully funding their premium costs, and when compared to the total premium cost of the active employees, the non-Medicare retirees are paying 100% of the premium cost. To limit catastrophic losses, the City is currently purchasing specific stop loss coverage for claims in excess of $200,000. For the loss corridor between $200,000 to $300,000, the City and stop loss insurance carrier quota share the cost on a quota share basis. Loss expenses exceeding $300,000 are fully covered by the stop loss carrier. At September 30, 2012, the total estimated liability of $214,727,056 is discounted at an interest rate of 0.8% and recorded in the government-wide financial statements. Changes in the claims liability amount in 2011 and 2012 were as follows:
Fiscal Year Beginning of Current YearEnded Fiscal Year Claims and Changes Claim Balance at
September 30, Liability in estimates Payments Fiscal Year End2012 207,941,602$ 57,887,062$ 51,101,608$ 214,727,056$ 2011 180,428,258 79,326,585 51,813,241 207,941,602
NOTE 10. – PENSIONS The City sponsors separate single-employer, defined benefit pension plans under the administration and management of separate Boards of Trustees: the City of Miami Fire Fighters and Police Officers Retirement Trust (“FIPO”), the City of Miami General Employees and Sanitation Employees Retirement Trust (“GESE”) and Other Managed Trusts, and the City of Miami Elected Officers Retirement Trust (“EORT” and, together with FIPO and GESE, the “Plans”). Basis of Accounting
. The financial statements for the Plans are prepared using the accrual basis of accounting. All Plans are reported as pension trust funds in the City's financial statements. Plan member contributions are recognized in the period which the contributions are due. Employer contributions are recognized when due and the employer has made a formal commitment to provide the contributions. Benefits and refunds are recognized when due and payable in accordance with the terms of the Plans.
Method Used to Value Investments. Investments of the Plans are recorded at fair market value. Securities traded on a national exchange are valued at the last reported sales price on the last business day of the fiscal year. Securities traded in the over-the-counter market and listed securities for which no sale was reported on that date are valued at the last reported bid price. Commercial paper, time deposits, and short-term investment pools are valued at fair market value and mortgages are valued based on current

CITY OF MIAMI, FLORIDA NOTES TO FINANCIAL STATEMENTS
63
market yield which approximate fair value. Net appreciation (depreciation) in fair value of investments includes realized and unrealized gains and losses. Interest and dividends are reported as investment earnings. Realized gains and losses on the sale of investments are based on average cost. FIPO
FIPO is a single-employer, defined benefit plan established by the City pursuant to the provisions and requirements of Ordinance No. 10002 as amended. Participants are contributing police officers and fire fighters with full-time employment status in the Police or Fire Department of the City.
Plan Description
As of October 1, 2011, the date of the most recent actuarial valuation, membership in the FIPO consisted of 2,285 retirees and beneficiaries receiving benefits and terminated members entitled to benefits but not yet receiving them; current membets equaled 1,196.
Members may elect to retire after 10 or more years of creditable service upon attainment of normal retirement age. Normal retirement pursuant to Section 40-203 of the City of Miami code shall be determined as follows:
Pension Benefits
Plan A - “For members employed on September 30, 2010, who as of that date have attained age 50 with ten or more years of creditable service or eligibility for rule of 64 retirement for police officer members, or eligibility for rule of 68 for firefighter members, the normal retirement age shall be 50 years of age with ten or more years of creditable service, or rule of 64 retirement for police officer members, or rule of 68 for firefighter members.”
Plan B - “For members employed on September 30, 2010 who as of that date have not attained age 50 with with ten or more years of creditable service, or rle of 64 retirement for police officer members, or rule of 68 retirement for firefighter members, and member hired on or after October 1, 2010 shall be rule of 70 retirement with a minimum age of 50 and ten or more years of creditable servie.”.
A member entitled to a normal retirement benefit shall receive a retirement allowance equal to 3% of the member’s average final compensation (as defined in the cit code section 40-191), multiplied by years of creditable service for the first 15 years of such creditable service, plus a retirement allowance equal to 3% (3 ½% for members who retired prior to October 1, 2010) of member’s average final compensation multiplied by the years of creditable service in excess of 15 years, paid in monthly installments.
The maximum benefit for members who retire after September 30, 2010 is 100% of average final compensation or $100,000 per year, whichever is less, as of retirement or DROP entry date.
Rule of 64, 68 and 70 shall mean a computation consisting of the sum of a member’s age and length of creditable service, which sum shall permit normal service retirement upon the member’s combined age and creditable service equaling at least 64, 68 and 70, respectively.
Early retirement, disability, death and other benefits are also provided.
Cost of Living AdjustmentEffective January 1, 1994, the FIPO Trust entered into an agreement with the City with regards to the funding methods, employee benefits, employee contributions and retiree cost of living adjustment (“COLA”). Pursuant to the agreement, members no longer contribute to the original COLA account (“COLA I”) and a new COLA account (“COLA II”) was established. The agreement included the following: (a) the funding method was changed to an aggregate cost method; (b) all accounts were

CITY OF MIAMI, FLORIDA NOTES TO FINANCIAL STATEMENTS
64
combined for investment purposes (membership and benefits, COLA I, and COLA II); (c) retirees receive additional COLA benefits; and (d) active members no longer contribute 2% if pretax earnings to fund the original retiree COLA I account.
The COLA II account is funded annually by a percentage of the excess investment return from the COLA I account assets (75% of first 2.5%, 50% of next 2.5%, and 25% of next 2.5%). The excess earnings contributed to the COLA II account are used to fund a minimum annual payment of $2.5 million, increasing by 4% compounded annually. To the extent necessary, the City will fund the portion of the minimum annual payment not funded by the annual excess earnings no later than January 1 of the following year. Deferred Retirement Option Plan
Members who are eligible for service retirement or Rule of 64 Retirement after September 1998 may elect to enter the deferred retirement option plan (the “DROP”). Upon election of participation, a member's creditable service, accrued benefits, and compensation calculation are frozen and the DROP payment is based on the member's average final compensation. The member's contribution and the City contribution to the retirement plan for that member ceases as no further service credit is earned. The member does not acquire additional pension credit for the purposes of the pension plan, but may continue City employment for a maximum of 36 months prior to October 1, 2001. Effective October 1, 2001, maximum participation in the DROP for firefighters shall be 48 full months and for police officers who elect the DROP on October 1, 2003, or thereafter, maximum participation in the DROP shall be 48 full months. Effective July 24, 2008, firefighter DROP participants may also continue City employment for up to 54 full months (48 full months prior to July 24, 2008 and 36 full months prior to October 1, 2001). Police officers who elect the DROP on or after May 8, 2008, may continue City employment for up to 84 full months (48 full months prior to May 8, 2008 and 36 full months prior to October 1, 2003). Once the maximum participation has been achieved, the participant must terminate employment.
The DROP of the FIPO Trust also consists of a Benefit Actuarially Calculated DROP (“BACDROP”). The BACDROP is a DROP benefit actuarially calculated. A member may elect to BACDROP to a date, no further back than the date of the member's requirement eligibility date. The BACDROP period must be in 12 month increments, beginning at the start of a pay period, not to exceed 48 full months for firefighters (36 months prior to October 1, 2001) and for police officers who elected BACDROP on October 1, 2003 (36 months prior to October 1, 2003). The benefits of the BACDROP will then be actuarially calculated to be the equivalent to the benefit earned at the date of retirement.
An individual account is created for each participant. A series of investment vehicles, as established by FIPO's Board of Trustees, are made available to DROP participants to choose from. Any losses incurred on account of the option selected by the participant will not be made up by the City or the FIPO Trust, and will be borne by the participant only. All interest will be credited to the member's account. Upon termination of employment, a participant may receive payment from the DROP account in a lump sum distribution; or periodic payments. A participant may elect to rollover the balance to another qualified retirement plan, individual retirement account, an Internal Revenue Code Section 457 Plan, or an annuity. A participant may defer payment until the latest date authorized by Section 401(a)(9) of the Internal Revenue Code. DROP participation will not affect any other death or disability benefit provided under law or applicable collective bargaining agreement. If a participant dies before the account balances are paid out in full, the beneficiary will receive the remaining balance.
Participants in the DROP are not entitled to receive an ordinary or service disability retirement and in the event of death of a DROP participant, there is no accidental death benefit for pension purposes.

CITY OF MIAMI, FLORIDA NOTES TO FINANCIAL STATEMENTS
65
Participation in the DROP does not affect any other death or disability benefit provided to a member under federal law, state law, City ordinance, or any rights or benefits under any applicable collective bargaining agreement.
Contributions and Funding Policies
Police officer members of FIPO are required to contribute 10% of their salary on a bi-weekly basis (7% prior to October 1, 2011). Firefighter members are also required to contribute 10% (9% prior to October 1, 2010) of their salary on a bi-weekly basis. The City is required to contribute such amounts annually as necessary to maintain the actuarial soundness of FIPO and to provide FIPO with assets sufficient to meet the benefits to be paid to participants. Contributions to FIPO are authorized pursuant to Sections 40.196(a) and (b) of the City Code. Contributions to the FIPO COLA accounts are authorized pursuant to Section 40.204 of the City Code. The City's contributions to FIPO provide for non-investment expenses and normal costs. The yield on investments on FIPO serves to reduce future contributions that would otherwise be required to provide for the defined level of benefits under the FIPO Trust.
The payroll for employees covered by FIPO for the year ended September 30, 2012 was approximately $82.2 million; the City's total payroll was approximately $253.4 million.
The City’s current year contribution was determined through an actuarial valuation performed as of
Annual Pension Cost
October 1, 2011. Significant actuarial assumptions used to compute the annual contribution requirement are as follows:
Valuation date: October 1, 2011Actuarial cost method: Aggregate Cost MethodAmortization method: Not Applicable
Remaining amortization period: Not ApplicableAsset valuation method: 20% Write-Up Method: Expected value is based on the Interest
Discount/Investment Return rate applied to the acturial assetvalue as of previous valuation date and cash flow during theyear. 20% of the difference between Expected Value and theMarket Value (net of pending transfers to the COLA Fund) isadded to the Expected Value. The result cannot be greater than120% of market value or less than 80% of market value (net ofpending COLA transfers).
Actuarial assumptions Investment rate of return: 7.50%, compounded annually
Projected salary increases due to inflation: 3.25% compounded annuallySeniority/merit 5.00% to 0% reducing by attained age
Promotion/other 1.50%Mortality table: RP 2000 Mortality Table Projected to 2020
Mortality, disability, retirement and turnover: RP 2000 Disabled Mortality Table Projected to 2020
Source
: City of Miami Fire Fighters' and Police Officers' Retirement Trust October 1, 2011 Actuarial Report prepared by The Nyhart Company, Inc.
FIPO contributions are determined using the aggregate cost method. The aggregate cost method does not identify and separately amortize the unfunded actuarial liabilities. The annual pension cost is equal to the annual required contribution each year.

CITY OF MIAMI, FLORIDA NOTES TO FINANCIAL STATEMENTS
66
Year Ended Annual Pension Percentage of Net PensionSeptember 30 Cost (APC) APC Contributed Obligation
2012 42,353,775$ 108% -$ * 2011 42,287,046 95% 3,037,485 * 2010 55,095,791 99% 752,865
* Re-stated based on FIPO's Actuarial Report
Three Year Trend Information
GESE The Board of Trustees of the GESE administers three defined benefit pension plans: (a) the GESE; (b) an Excess Benefit Plan for the City of Miami (the “EBP”); and (c) General Employees and Sanitation Employees Retirement Trust Staff Pension Plan (the “Staff Trust”). Each plan's assets may be used only for the payment of benefits to the members of that plan, in accordance with the terms of the plan. Separate audited financial statements are provided for the GESE Plans and can be obtained from the pension board at: GESE, 2901 Bridgeport Avenue, Coconut Grove, Florida 33133. City of Miami General Employees and Sanitation Employees Retirement Trust (GESE Trust) Plan Description The GESE is a single-employer defined benefit plan. The GESE was established pursuant to the City Ordinance No. 10002 and subsequently revised under City Ordinance No. 12111. The GESE covers all City general and sanitation employees except certain employees eligible to decline membership. Participation in the GESE is a mandatory condition of employment for all regular and permanent employees other than fire fighters, police officers and executive level employees hired after October 1, 2009. Those executive employees are required to participate in a defined contribution plan (401(a)) At October 1, 2011, the date of the most recent audited financial statement, membership in the GESE consisted of 2,200 retired members and 152 entitled to benefits but not yet receiving them; current active employees equaled 1,294 as of that date. Pension Benefits The minimum normal retirement age is 55. Any member in service who has 10 or more years of continuous creditable service may elect to retire upon attainment of normal retirement age. A member who has completed a combination of at least 10 or more years of creditable service plus attained an age equaling 70 points may elect a Rule of 70 Retirement. Subsequnet to September 30, 2010 for members not eligible to retire as of that date, the retirement age and service changed to age 55 and 30 years of creditable service or age 60 and 10 years of continuous creditable service or a combination of at least ten years of creditable service plus attained age equaling 80 points (Rule of 80). Retirement benefits are generally based on 3% of the average final compensation multiplied by years of creditable service, which is paid annually in monthly installments. For service after September 30, 2010, for members not eligible to retire as of that date, benefits are based on 2.25% of average final compensation multiplied by creditable service up to 15 years, 2.5% of average final compensation for 16 to 20 years of service and 2.75% for service over 20 years. Effective September 30, 2012, for members not eligible to retire on that date, member retirement allowances shall not exceed the lesser of 100% of

CITY OF MIAMI, FLORIDA NOTES TO FINANCIAL STATEMENTS
67
the member's average final compensation or an annual retirement allowance of $80,000. Any member who has accrued a benefit in excess of the maximum benefit as of September 30, 2012 will retain that benefit but will not accrue any additional benefit. Members eligible to receive accumulated sick and vacation leave from the City are able to transfer the amount to an eligible retirement plan. The GESE facilitates the transfer of accumulated sick and vacation leave to any eligible retirement plan and is pursuant to Section 40-266 of the City Code. Cost of Living Adjustment Effective October 1, 1998, the GESE was amended to provide for an increase in the COLA paid to retirees to 4% with a $400 annual maximum increase, provided the retiree's first anniversary of retirement has been reached. The amendment also provided for retirees electing the return of their contribution option to receive a minimum COLA benefit of $27 per year and a maximum COLA benefit of $200 added to the previous COLA benefit, provided the retiree's first anniversary of retirement has been reached. Deferred Retirement Option Plan The DROP is available to GESE Trust members for normal retirement as of January 1, 2013 or vested as of October 1, 2010. The DROP is not available to any other GESE Trust member. The DROP is an enhancement to the GESE Trust that can provide a member with another way to save for retirement. It allows a participant to receive pension payments by depositing in the DROP program while continuing to work and receive pay and benefits as an active employee. At the end of the DROP period, when the participant is officially required to retire, the participant receives monthly pension payments based on the years of service and salary at the time that the participant enrolled in the DROP. The participant may elect to receive the accumulated DROP account blance or can be rolled over into a separate tax-qualified plan after withdrawing from the DROP. BACKDROP Option The Backdrop is available to all GESE Trust members effective January 1, 2013. Under the Backdrop option a member can receive a lump sum payment in addition to a monthly pension annuity. The employee chooses to take a Backdrop at the end of his or her employment with the City as long as he or she Backdrops to any date after he or she reaches the Normal Retirement date. If the member elects the Backdrop option, the monthly benefit payable on the member’s actual retirement date (when the member leaves City employment) is based on the benefit the member would have received had he or she left employment and retired on an earlier Normal Retirement (NR) date, referred to as the Backdrop date. In addition, the member will receive a lump sum payment equal to the accumulation of annuity payments he or she would have received during the Backdrop period had he or she elected to receive immediate pension annuity payments equal to the accumulation of annuity payments he or she would have received during the Backdrop period had he or she elected to receive immediate pension annuity payments starting as of the Backdrop date. Annuity payments would be accumulated at the rate of 3% per year, compounded annually. The member’s Backdrop date can be any date after his or her Normal Retirement Date and the Backdrop period can be any date after his or her Normal Retirement Date and the Backdrop period can be as little as one year and as long as seven years. If the member does not elect a Backdrop benefit option, his or her monthly retirement benefit will be calculated using his or her final average final compensation and creditable service as of the member’s actual employment termination date. The

CITY OF MIAMI, FLORIDA NOTES TO FINANCIAL STATEMENTS
68
participant may received accumulated Backdrop account balance upon electing the Backdrop and the end of his or her employment. Contributions and Funding Policies Members of the GESE are required to contribute 13% of their salary on a bi-weekly basis. The GESE's funding policies provide for periodic contributions at actuarially determined rates that, expressed as percentages of annual covered payroll, are sufficient to maintain the actuarial soundness of the GESE and to accumulate sufficient assets to pay benefits when due. The City is required to contribute an actuarially determined amount that, when combined with participants' contributions, will fully provide all benefits as they become payable. Contributions to the GESE are authorized pursuant to Sections 40-241(a) and (b) of the City Code. Contributions from the City are designed to fund the GESE's non-investment expenses and normal costs and to fund the unfunded actuarial accrued liability. The yield (interest, dividends and net realized and unrealized gains and losses) on investment of the GESE serves to reduce or increase future contributions that would otherwise be required to provide for the defined level of benefits under the GESE. The payroll for employees covered by the GESE Trust for the year ended September 30, 2012 was approximately $63.6 million; the City's total payroll was approximately $253.4 million.
The City’s current year contribution was determined through an actuarial valuation performed as of October 1, 2011. Significant actuarial assumptions used to compute the annual contribution requirement are as follows:
Annual Pension Cost
Valuation date: October 1, 2011
Actuarial cost method: Modified entry age normalAmortization method: Level percent, closed
Remaining amortization period: 7 - 18 yearsEquivalent single amortization period; 10 years
Asset valuation method: 5-Year Smoothed MarketActuarial assumptions
Investment rate of return: 8.10% Projected salary increases: 5.25%
Payroll Growth 3.00% Includes inflation at: 3.50%
Cost of living adjustments: 4% per year, with $54 per year minimum and $400 per year maximum.
Source: City of Miami General Employees' and Sanitation Employees' Retirement Trust Actuarial Valuation Report as of October 1, 2011 prepared by Cavanaugh Macdonald Consulting, LLC. GESE Trust contributions are determined using the entry age normal cost method with frozen actuarial accrued liability. The annual pension cost is equal to the annual required contribution each year.

CITY OF MIAMI, FLORIDA NOTES TO FINANCIAL STATEMENTS
69
Year Ended Annual Pension Percentage ofSeptember 30 Cost (APC) APC Contributed
2012 25,973,331$ 100% -$ * 2011 20,232,513 100% -
2010 24,037,093 100% -
* ARC for fiscal year 2011 adjusted for interest to reflect timing
Obligation Net Pension
Source: City of Miami General Employees' and Sanitation Employees' Retirement Trust Actuarial Valuation Report as of October 1, 2011 prepared by Cavanaugh Macdonald Consulting, LLC.
The City’s annual pension cost and net pension obligation to the GESE for the current fiscal year was as follows:
Annual required contribution 25,973,331$ Interest on net pension obligation - Adjustment to annual required contribution - Annual pension cost 25,973,331 Contributions made (25,973,331) Change in net pension obligation - Net pension obligation, beginning of year - Net pension obligation, end of year -$
GESE Excess Benefit Plan (EBP) Plan Description In July 2000, the City, pursuant to applicable Internal Revenue Code provisions, established a qualified governmental excess benefit plan to continue to cover the difference between the allowable pension to be paid and the amount of the defined benefit so the benefits for eligible members are not diminished by changes in the Internal Revenue Code. The GESE Board of Trustees administers the excess benefit plan. GESE members are not required to contribute to the EBP. Members of the GESE participate in this plan. At October 1, 2011, the date of the most recent actuarial report, membership in the EBP consisted of 35 retirees and beneficiaries currently receiving benefits and terminated employees entitled to benefits but not yet receiving them. There are no current employees in the plan. Deferred Retirement Option Plan (DROP) The GESE made the DROP available to GESE Trust members eligible for normal retirement as of the January 1, 2013 or vested as of October 1, 2010. The DROP is not available to any other GESE Trust member. The DROP is an enhancement to the GESE Trust that can provide a member with another way to save for retirement. It allows a participant to receive pension payments by depositing in the DROP program while continuing to work and receive pay and benefits as an active employee. At the end of the DROP period, the participant may receive the accumulated DROP account balance after withdrawing from the DROP.

CITY OF MIAMI, FLORIDA NOTES TO FINANCIAL STATEMENTS
70
Contributions and Funding Policies The payment of the City's contribution of excess retirement benefits for eligible members of the GESE above the limits permitted by the Internal Revenue Code is: (a) funded from the City's General Fund; (b) paid annually concurrently with the City's annual contribution to normal pension costs which causes the City to realize a reduction in normal pension costs in the same amount; and (c) deposited in a separate account established specifically for the GESE to receive the City's excess retirement benefit contributions. This account is separate and apart from the accounts established to receive the City's normal pension contributions for the GESE. The City is required to contribute as benefits become payable. The payroll for employees covered by the Excess Benefit Plan for the year ended September 30, 2012 was approximately $63.6 million; the City's total payroll was approximately $253.4 million.
Annual Pension Cost and Net Pension Obligation
The EBP is an unfunded plan; however if the City were to fund the EBP on the same actuarial basis as the GESE. The City’s current year contribution was determined through an actuarial valuation performed as of October 1, 2011. Significant actuarial assumptions used to compute the annual contribution requirement are as follows:
Valuation date: October 1, 2011Actuarial cost method: Modified entry age normalAmortization method: Level dollar, closed
Remaining amortization period: 19 yearsAsset valuation method: Not Applicable
Actuarial assumptions Investment rate of return: 8.00% Projected salary increases Variable By Years of Service
Includes inflation at: 3.50%Cost of living adjustment None
Source: City of Miami General Employees' and Sanitation Employees' Excess Benefit Plan Actuarial Valuation Report as of October 1, 2011 prepared by Cavanaugh Macdonald Consulting, LLC. GESE Excess Plan contributions are determined using the entry age normal cost method with frozen actuarial accrued liability.
Annual PercentageYear Ended
September 30Pension Cost
(APC)of APC
ContributedNet Pension Obligation
2012 496,201$ 104% 4,556,490$ 2011 488,253 83% 4,575,196 2010 541,428 63% 4,493,186

CITY OF MIAMI, FLORIDA NOTES TO FINANCIAL STATEMENTS
71
The City’s annual pension cost and net pension obligation to the GESE Excess Plan for the current fiscal year was as follows:
Annual required contribution 606,589$ Interest on net pension obligation 366,016 Adjustment to annual required contribution (476,404) Annual pension cost 496,201 Contributions made (514,907) Change in net pension obligation (18,706) Net pension obligation, beginning of year 4,575,196 Net pension obligation, end of year 4,556,490$
City of Miami General Employees and Sanitation Employees Retirement Trust (Staff Trust) Plan Description The Staff Trust is a single-employer, defined benefit plan. The Staff Trust was established by the rule-making authority of the GESE, pursuant to Chapter 40 of the City Code. The Staff Trust covers all administrative full-time employees and other positions as may be named by the Board of Trustees. Participation in the Staff Trust is a mandatory condition of employment for all full-time employees, other than those eligible to decline membership. At October 1, 2011, the date of the most recent actuarial report, membership in the Staff Trust had no retirees and beneficiaries currently receiving benefits; one terminated employee entitled to benefits, but not yet receiving them and 11 current employees. Pension Benefits The minimum normal retirement age is 55. Any member in service who has 10 or more years of continuous creditable service may elect to retire upon attainment of normal retirement age. A member who has completed a combination of at least 10 or more years of creditable service plus attained an age equaling 70 points may elect a Rule of 70 Retirement. However, a member is entitled to early retirement at any age with at least 10 years of creditable service. Retirement benefits are generally based on 3% of the average final compensation during the highest two years of membership service multiplied by years of creditable service, which is paid annually in monthly installments. A retired member who dies prior to having received 12 monthly retirement payments and prior to having an optional allowance becoming effective will have a lump sum equal to the excess, if any, of 12 times the monthly payments over the actual payments received paid to his designated beneficiary. Deferred Retirement Option Plan The Staff Trust implemented a DROP for employees eligible for Rule of 70 Retirement on March 26, 2010. Any employee who is eligible for a Rule of 70 Retirement is eligible to participate in the DROP. Upon election of participation, a member’s creditable service, accrued benefits, and compensation calculation are frozen and the DROP payment is based on the member’s average final compensation. The member’s contribution and the City contribution to the retirement plan for that member ceases as no further service credit is earned. The member does not acquire additional pension credit for the purposes

CITY OF MIAMI, FLORIDA NOTES TO FINANCIAL STATEMENTS
72
of the pension plan, but may continue City employment for up to a maximum of 48 months. Once the maximum participation has been achieved, the participant must terminate employment. Upon termination of employment, a participant may receive payment from the DROP account in a lump sum distribution; or periodic payments. A participant may elect to rollover the balance to another qualified retirement plan, individual retirement account, an Internal Revenue Code Section 457 Plan, or an annuity. A participant may defer payment until the latest date authorized by Section 401(a)(9) of the Internal Revenue Code. DROP participation will not affect any other death or disability benefit provided under law or applicable collective bargaining agreement. If a participant dies before the account balances are paid out in full, the beneficiary will receive the remaining balance. Contributions and Funding Policies Members of the Staff Trust are required to contribute 10% of their salary on a bi-weekly basis. The funding policies of the Staff Trust provide for periodic contributions at actuarially determined rates that, expressed as percentages of annual covered payroll, are sufficient to maintain the actuarial soundness of the Staff Trust and to accumulate sufficient assets to pay benefits when due. The City is required to contribute an actuarially determined amount that, when combined with member contributions, will fully provide all benefits as they become payable. The yield (interest, dividends and net realized and unrealized gains and losses) on investments of the Staff Trust serves to reduce or increase future contributions that would otherwise be required to provide for the defined level of benefits under the Staff Plan. The payroll for employees covered by the Staff Trust for the year ended September 30, 2012 was approximately $0.7 million; the City's total payroll was approximately $253.4 million.
Annual Pension Cost
The City’s current year contribution was determined through an actuarial valuation performed as of October 1, 2011. Significant actuarial assumptions used to compute the contribution requirements are as follows:
Valuation date: October 1, 2011Actuarial cost method: Modified entry age normalAmortization method: Level dollar amount, closed
Remaining amortization period: 5 - 20 yearsEquivalent single amortization period: 13 years
Asset valuation method: 3-year smoothed marketActuarial assumptions
Investment rate of return: 8.10% Projected salary increases: 6.00%
Includes inflation at: 3.50% Cost of living adjustments: None
Source: City of Miami General Employees' and Sanitation Employees' t Plan Actuarial Valuation Report as of October 1, 2011 prepared by Cavanaugh Macdonald Consulting, LLC. Staff Trust contributions are determined using the entry age normal cost method with frozen actuarial accrued liability. The annual pension cost is equal to the annual required contribution each year.

CITY OF MIAMI, FLORIDA NOTES TO FINANCIAL STATEMENTS
73
Year Ended Annual Pension Percentage of September 30 Cost (APC) APC Contributed
2012 226,793$ 100% -$ 2011 164,490 100% - 2010 132,542 100% -
Three Year Trend Information
ObligationNet Pension
The City’s annual pension cost and net pension obligation to the Staff Trust for the current fiscal year was as follows:
Annual required contribution 226,793$ Interest on net pension obligation - Adjustment to annual required contribution - Annual pension cost 226,793 Contributions made (226,793) Change in net pension obligation - Net pension obligation, beginning of year - Net pension obligation, end of year -$
Elected Officers Retirement Trust (EORT) Plan Description Prior to October 22, 2009, the City’s elected officials participated in a single-employer, non-contributory defined benefit pension plan under the administration and management of a separate Board of Trustees. Under the EORT, eligibility requires 7 years of total service if elected between October 1, 2001 and October 22, 2009, or 10 years of total service if elected prior to October 1, 2001 as an elected official of the City to be vested without requiring that such service be continuous. Any official elected after October 22, 2009 is not eligible to participate in the plan. The City, pursuant to applicable Internal Revenue Code provisions, also established qualified governmental excess benefit plans to continue to cover the difference between the allowable pension to be paid, and the amount of the defined benefit, so that the benefits for eligible members are not diminished by changes in the Internal Revenue Code. At the most recent preliminary actuarial valuation dated November 5, 2012, membership in the EORT consisted of 7 retirees and beneficiaries currently receiving benefits and terminated employees entitled to benefits but not yet receiving them, and 4 active officers with the future range of service from 2 to 4 years. Pension Benefits Benefits accrue for City Commissioners at the rate of 50% of the highest annual W-2 wages in the last three years of employment after 7 years of service as an elected official of the City plus 5% for each additional year up to 100% at 17 or more years of service. Benefits are payable on the later of age 55 or on the first day of the month following an officer's termination. An active participant will be fully vested upon death and a single sum death benefit is payable. The EORT was frozen to new entrants effective October 22, 2009. Only participants who were accruing benefits and had not yet become vested in their

CITY OF MIAMI, FLORIDA NOTES TO FINANCIAL STATEMENTS
74
benefits as of that date continue to accrue benefits under the EORT. Benefit accruals for all other participants were frozen. Contributions and Funding Policies The funding methodology recently changed from the individual aggregate cost method to the Projected Unit Credit (PUC) method. Assets are allocated first to the non-active participants, then to the active participants based on their accrued liability. The unfunded present value of future benefits is determined for each individual and spread over their expected future working lifetime with the City. As EORT is a non-contributory defined benefit plan, all funding is provided by the City. The payroll for employees covered by EORT for the year ended September 30, 2012 was approximately $209,200; the City's total payroll was approximately $253.4 million.
Annual Pension Cost
The City’s current year contribution was determined through an actuarial valuation determined as of January 1, 2012. Significant actuarial assumptions used to compute the annual contribution requirement are as follows:
Valuation date: January 1, 2012Actuarial cost method: Projected Unit CreditAmortization method: Not Applicable
Remaining amortization period: Not ApplicableAsset valuation method: December 31 market values
Actuarial assumptions Investment rate of return: 3.75% compounded annually
Projected salary increases: N/A Inflation: N/A
Merit, longevity, etc: N/AMortality table: RP-2000 White Collar Active/Retiree, Healthy Mortality
table without setbackDisability, turnover and retirements: No disability or turnover assumed. Retirement is assumed
at the end of the current term or 100% vested.
Source: City of Miami Elected Officers’Retirement Trust Actuarial Valuation Report as of January1, 2012 prepared by Cowden Associated, Inc.. EORT contributions are determined using the Projected Unit Credit funding method. This method separates and develops funding components for annual contributions into 1) normal costs and 2) an amortization payment toward the unfunded liability for past service benefits. Revising the actuarial funding method allows the City to fund the payment liability over a longer period of time. The following contributions were made to EORT in accordance with actuarially determined contribution requirements, based on the actuarial valuation performed for each respective year. The annual pension cost is equal to the annual required contribution each year. The following is a six year trend information:

CITY OF MIAMI, FLORIDA NOTES TO FINANCIAL STATEMENTS
75
Year Ended Percentage Net PensionSeptember 30 Contributed Obligation
2012 566,252$ 100% -$ 2011 432,170 100% - 2010 1,275,242 100% - 2009 412,588 100% - 2008 711,209 100% - 2007 285,408 100% -
Annual Pension Cost(APC) and Annual
Required Contribution
Separate stand-alone financial statements are not issued for EORT therefore, presented below is the Statement of Fiduciary Net Assets and the Statement of Changes in Fiduciary Net Assets as of and for the year ended September 30, 2012:
Statement of Fiduciary Net Assets
AssetsInvestments, at fair value 5,304,720$ Money Market Funds 492,468
Total Assets 5,797,188
Net AssetsHeld in Trust for Pension Benefits 5,797,188$
AdditionsContributions:
Employer 566,372$ Investment Earnings:
Interest 139,548 Total Additions 705,920
DeductionsBenefits 263,535
Total Deductions 263,535 Change in Net Assets 442,385 Net Assets - Beginning of Year 5,354,803 Net Assets - End of Year 5,797,188$
Statement of Changes in Fiduciary Net Assets

CITY OF MIAMI, FLORIDA NOTES TO FINANCIAL STATEMENTS
76
The following table presents the Pension Trust Funds schedule of funding progress: (2) Unfunded
(1) Actuarial Unfunded (Overfunded)Pension Actuarial Actuarial Accrued (Overfunded) Funded (3) as a PercentageTrust Valuation Value of Liability AAL Ratio Covered of Covered PayrollFund Date Assets (AAL) (2) - (1) (1)/(2) Payroll ((2) - (1))/(3)GESE Retirement Trust 10/1/2011 600,678,610$ 845,100,000$ 244,421,390$ 71.08% 63,601,380$ 384.30%GESE Staff Plan 10/1/2011 2,136,978 3,139,899 1,002,921 68.06% 735,056 136.44%GESE Excess Plan 10/1/2011 - 5,825,435 5,825,435 0.00% 63,601,380 9.16%FIPO 10/1/2011 1,150,323,527 1,590,500,000 440,176,473 72.32% 82,164,617 535.73%EORT 1/1/2012 5,922,119 7,480,479 1,558,360 79.17% 209,200 744.91%
The actuary used the aggregate actuarial cost method for valuation. This method does not identify or separately amortize unfunded actuarial liabilities. Information about funded status and funding progress has been prepared using the entry age actuarial cost method for that purpose and the information presented is intended to serve as a surrogate for the funded status and funding progress of the plan. The required schedule of funding progress disclosed above presents multiyear trend information about whether the actuarial value of plan assets is increasing or decreasing over time relative to the actuarial accrued liability for benefits. See Required Supplementary Information Section for multi-year Pension Trust Fund and Other Post Employment Benefits Schedule of Funding Progress. Special Benefit Plans Certain executive employees of the City are allowed to join the ICMA Retirement Trust's 401(a) plan (the “SBP”). This defined contribution deferred compensation plan, which covers governmental employees throughout the country, is governed by a Board of Directors responsible for carrying out the overall management of the organization, including investment administration and regulatory compliance. Membership for the City employees is limited by the City Code to specific members of the City Clerk, City Manager, City Attorney's offices, Department Directors, Assistant Directors, and other executives. To participate in the plan a written trust agreement must be executed, which requires the City to contribute 8% of the individual's earnable compensation, and the employee to contribute 10% of their salary. Participants may withdraw funds at retirement or upon separation based on a variety of payout options. The City does not have any fiduciary responsibility relating to the plan, consequently the amount accrued for benefits are not recorded in the fiduciary funds. The following information relates to the City participation in this plan:
Total current year's payroll for all employees 253,363,666$ Current year's payroll for participating employees 3,275,063 Current year employer contributions 318,166
In addition to coverage under the FIPO, the firefighters and police officers are members of two separate non-contributory money purchase benefit plans established under the provisions of Chapters 175 and 185, Florida Statutes, respectively. These two plans are funded solely from proceeds of certain excise taxes levied by the City and imposed upon property and casualty insurance coverage within the City limits. This tax, which is collected from insurers by the State of Florida, is remitted directly to the plans' Boards of Trustees. The City is entitled to levy such excise taxes solely for the use of the money purchase benefit plans as long as the minimum benefit provisions of Chapter 175 and 185, Florida Statutes, are met by the FIPO. The City does not have any fiduciary responsibility relating to the SBP, consequently amount accrued benefits are not recorded in the fiduciary funds. The total of such excise taxes received from the state of Florida and remitted to the plans was $10,008,353 for the year ended

CITY OF MIAMI, FLORIDA NOTES TO FINANCIAL STATEMENTS
77
September 30, 2012. Accordingly, these monies are recorded as pass through funds in the City's financial statements. Benefits are allocated to the participants based upon their service during the year and the level of funding received during said year. Participants are fully vested after nine years of service. Upon termination of service, a participant may elect to receive one of the three options (1) a lump sum payment; (2) five substantially equal payments, or (3) 10% or more in the first year and the remainder in any way over the next four years. The total must be paid out within five years. NOTE 11. – POST-EMPLOYMENT HEALTH CARE BENEFITS
Pursuant to Section 112.0801, Florida Statutes, the City is required to permit participation to the health insurance program by retirees and their eligible dependents at a cost to the retiree that is no greater than the cost at which coverage is available for active employees. Retired police officers are offered coverage at a discounted premium under the FOP Health Trust that is administered separately from the City’s health care plan. For non-police retirees (fire fighters, general employees, sanitation employees and elected officials) and their dependents, the City subsidizes health care coverage and life insurance at a discounted premium equal to the blended group rate. GASB Statement No. 45 allows flexibility to governmental employers in the use of various actuarial cost methods. Several such acceptable actuarial cost methods were evaluated, including the entry age normal cost method, the frozen entry age normal cost method, the aggregate cost method, and the projected unit credit normal cost method. The goal was for the City to adopt an actuarial cost method which is acceptable, appropriate, and commonly used. The City's annual Other Post Employment Benefit (“OPEB”) liability was calculated using the entry age normal cost method. Plan Description The City has two separate single-employer OPEB plans for its retirees. One plan is for retiring police officers and the other plan is for all other retiring employees (the “Non-Police Retirees”). The benefits afforded to all retirees include lifetime medical, prescription, vision, dental and certain life insurance coverage for retiree and dependents. Non-Police Retirees receive the same benefits as similarly situated active employees of the City, while retired police officers receive the same benefits as provided through the Fraternal Order of Police (the “FOP”) Health Trust. The City offers to its retirees comprehensive medical coverage and life insurance benefits through its self-insurance plan. This plan was established in accordance with Section 112.0801, Florida Statutes. Substantially all of the City's general employees, sanitation employees and firefighters may become eligible for these benefits when they reach normal retirement age while working for the City. There are approximately 4,939 covered participants (including spouses and dependents), of which approximately 3,306 are active employees and 1,633 are retirees. Funding Policy The City is authorized to establish benefit levels and approve the actuarial assumptions used in the determination of contributions levels. Beginning with the 2012 plan year, the retirees are contributing the majority of their premium costs each month. Spouses and other dependents are also eligible for coverage, although the retiree pays the premium cost. The FOP sponsors a Health Insurance Trust (the “HIT”) that is partially self-insured, which provides life, heath, and accidental death and dismemberment insurance to substantially all full-time sworn members of the City's Police department, eligible retirees, their families and beneficiaries. The HIT receives a

CITY OF MIAMI, FLORIDA NOTES TO FINANCIAL STATEMENTS
78
significant source of its funding from the City, pursuant to the terms of a collective bargaining agreement. The agreement requires the City to reimburse the HIT an amount that is required to bring the HIT's minimum fund balance to $2.35 million annually. Currently, the City's subsidy to OPEB benefits is unfunded. There are no separate trust funds or equivalent arrangements into which the City makes contributions to advance-fund the OPEB obligations, as it does for its retiree pension plans. The City's cost of the OPEB benefits is funded on a pay-as-you-go basis. The City contributed $7,341,000 for the fiscal year ended September 30, 2012. The ultimate implicit subsidies which are provided over time are financed directly by general assets of the City, which are invested in short-term fixed income instruments according to its current investment policy. The City selected an interest discount rate of 3.85%, which is the long-range expected return on such short-term fixed income instruments, to calculate the present values and costs of the OPEB. This is consistent with GASB Statement 45 guidance. Significant actuarial assumptions and methods used to estimate the OPEB liability are as follows:
Valuation date October 1, 2011Actuarial cost method Entry Age Normal Cost MethodAmortization method Level Percent of PayrollAmortization Period 26 years
Actuarial assumptions:Assumed rate of return on investments 3.85%
Assumed health care cost trend rates:2011 - 8.5%2012 - 8.0%2013 - 7.5%2014 - Decrease of .5 % annually, until reaching 5.0%, 5.0% thereafter
Source: City of Miami Other Than Police Actuarial Valuation Report of Postemployemnt Benefit Plan as of October 1, 2011 prepared by Healthcare Analytics, a Division of Gallagher Benefit Services, Inc. The following table is the Other Post Employment Benefits schedule of funding progress:
Actuarial Actuarial AccruedActuarial Value of Liability (AAL) - Unfunded AAL FundedValuation Assets* Entry Age (UAAL) Ratio
Date (a) (b) (b - a) (a / b)Non-Police 10/1/2011 -$ 152,498,000$ 152,498,000 0.00%Police 10/1/2011 - 400,586,000 400,586,000 0.00%
Total -$ 553,084,000$ 553,084,000$ 0.00%
* Amounts based on actuarial valuation. No assets existed in the plan at September 30, 2012. Actuarial Methods Actuarial valuations of an ongoing plan involve estimates of the value of reported amounts and assumptions about the probability of occurrence of events far into the future. Actuarially determined amounts are subject to continual revision as actual results are compared to past expectations and new

CITY OF MIAMI, FLORIDA NOTES TO FINANCIAL STATEMENTS
79
estimates are made about the future. Although the valuation results are based on values the actuarial consultant believes are reasonable assumptions, the valuation result is only an estimate of what future costs may actually be and reflect a long-term perspective. Deviations in any of the several factors, such as future interest rates, discounts, medical cost inflation, Medicare coverage risk and changes in marital status could result in actual costs being greater or less than estimated. Projection of benefits for financial reporting purposes are based on the substantive OPEB plan (the OPEB plan as understood by the employer and the members) and include the types of benefits provided at the time of each valuation and the historical pattern of sharing of benefit costs between the employer and plan members. The actuarial methods and assumptions used include techniques that are designed to reduce the effects of short-term volatility in actuarial accrued liabilities and the actuarial value of assets, consistent with the long-term perspective of calculations. Annual OPEB Cost and Net OPEB Obligation The City's annual OPEB cost is calculated based on the annual required contribution of the employer, an amount actuarially determined in accordance with the parameters of GASB Statement No. 45. The annual required contribution represents a level of funding that, if paid on an ongoing basis, is projected to cover normal cost each year and amortize the actuarial liabilities over a period not to exceed 30 years. The City’s annual OPEB cost for the fiscal year was $30,876,000 for Police retirees and $13,676,000 for the Non-Police retirees. The City’s annual OPEB cost and the net OPEB obligation for the fiscal year ended September 30, 2012 for both Non-Police and Police retirees are as follows:
Non-Police PoliceRetirees Retirees Total
Annual required contribution (ARC) 13,757,000$ 30,977,000$ 44,734,000$ Interest on net OPEB obligation 1,005,000 3,585,000 4,590,000 Adjustment to annual required contribution (1,086,000) (3,686,000) (4,772,000) Annual OPEB cost (expense) 13,676,000 30,876,000 44,552,000 Contributions made (3,172,000) (4,169,000) (7,341,000) Increase in net OPEB obligation 10,504,000 26,707,000 37,211,000 Net OPEB obligation - beginning of year 26,101,000 93,106,000 119,207,000 Net OPEB obligation - end of year 36,605,000$ 119,813,000$ 156,418,000$
The City’s percentage of annual OPEB cost contributed to the plans, and the net OPEB obligations for the fiscal year ended September 30, 2012 are as follows:
Beginning Percentage of EndingFiscal Balance Annual of Annual BalanceYear Net OPEB OPEB Amount OPEB Cost Net OPEB
Ending Obligation Cost Contributed Contributed ObligationPolice 9/30/2012 93,106,000$ 30,876,000$ 4,169,000$ 13.50% 119,813,000$ Non-Police 9/30/2012 26,101,000 13,676,000 3,172,000 23.19% 36,605,000
Total 119,207,000$ 44,552,000$ 7,341,000$ 16.48% 156,418,000$
The 2012 contributions for the Police and non-Police retiree plans represented 13.50% and 23.19% respectively, of the annual required contributions. See Required Supplementary Information Section for multi-year Pension Trust Fund and Other Post Employment Benefits Schedule of Funding Progress.

CITY OF MIAMI, FLORIDA NOTES TO FINANCIAL STATEMENTS
80
NOTE 12. – COMMITMENTS AND CONTINGENCIES The City participates in a number of federal and state assisted programs. These programs are subject to audit under the requirements of the Single Audit Act and Chapter 10.550, Rules of the Auditor General. The City received revenues and contributions related to grants from Federal agencies and the State of Florida. These grants are for specific purposes and are subject to review and audit by the grantor agencies. Such audits could result in requests for reimbursement for expenditures being disallowed under the grant terms. Based upon prior experience, the City’s management believes any requests for reimbursement, if any, will not be significant. Global Agreement: In December 2007, the City, the County, the OMNI CRA, and the Southeast Overtown Park West CRA, entered into an inter-local agreement that establishes the funding framework for the several major facilities and infrastructure improvement projects. Those projects include the Arsht Performing Arts Center (“Arsht Center”), Miami Port Tunnel, Museum Park improvements, and the Miami Marlins Baseball Stadium and parking facilities. The agreement specifically calls for the OMNI CRA to increase its contribution to the County to service debt and other loans on the Arsht Center. Further, the agreement established parameters by which the City, County, and CRAs would move forward with the legal process of extending the lives and expanding the geographic boundaries of both CRAs, and utilizing the additional tax increment revenues to finance affordable housing, infrastructure, and redevelopment projects consistent with the CRAs’ redevelopment plans. The additional OMNI CRA tax increment revenues could also be used to finance the City’s contributions to the Miami Port Tunnel project and the Museum Park improvements. Finally, the agreement addresses the City’s and County’s Miami Marlins Major League Baseball project stadium and related parking facilities built on the former Orange Bowl location site. To date, the total contributions required to be made by the City for the Museum Park Improvement projects has not been determined. The OMNI CRA has voted to provide an annual grant of tax increment revenues to the City in connection with repayment of the City’s Special Obligation Non-Ad Valorem Revenue Refunding Bonds, Series (Part of Miami Tunnel Project) issued December 13, 2012. International Police Training Facility and Law Enforcement High School: On November 9, 2007, the City Commission adopted Resolution No. R-07-0650 which authorized the design, construction, funding and contingencies of a co-located International Police Training Facility and Law Enforcement High School on City-owned property located at 405 Northwest 3rd Avenue (known as the "College of Policing and Forensic High School") with The School Board of Miami-Dade County (the “School Board”). The City and the School Board entered into an Interlocal Agreement whereby the School Board leases its portion of the facility from the City for an initial term forty (40) years for the cost of $1.00 per year with the $40 payable in advance of occupancy. At the end of the initial term, the School Board will have four (4) ten-year options to renew the lease. The School Board may exercise this option upon six (6) months prior written notice to the City, provided that the School Board is not otherwise in default under the Interlocal Agreement and provided the Parties come to a mutual agreement regarding any capital expenditures that may be required to continue the useful life of the facility during the option period(s). The parties share the operating/maintenance costs in proportion to their occupancy percentages (59% for the City and 41% for the School Board).

CITY OF MIAMI, FLORIDA NOTES TO FINANCIAL STATEMENTS
81
Fraternal Order of Police (FOP), Walter E. Headley, Jr., Miami Lodge No. 20 v. City of Miami, Case No.: CA-2010-119. This is a matter filed before the Public Employees Relations Commission (“PERC”) by the FOP (hereinafter “Union”) claiming the City committed an unfair labor practice as a result of its declaration of a financial urgency pursuant to F.S. 447.4095. The FOP alleges that it had a Collective Bargaining Agreement ("CBA") with the City, effective through September 30, 2010, that the parties exchanged initial proposals for a successor agreement, and that the parties have held several bargaining sessions. The Union further alleges that during the several bargaining sessions, the City never advised the Union that there was a need to reach settlement on economic items expeditiously, or that the City intended to declare a "financial urgency" and invoke the process set forth in Section 447.4095, F.S. The Union contends that Section 447.4095 may only be invoked to modify the terms of an existing agreement. The Union further alleges that although the parties continued to bargain for a successor collective bargaining agreement on August 9 and 12, 2010, the parties never discussed wages or pensions, but on August 16, 2010, the City advised PERC that it had engaged in negotiations on the impact of the financial urgency, and any action necessitated by the financial urgency, and that a dispute existed. The Union further alleges that on August 31, 2010, the City unilaterally took action to alter the terms and conditions of employment before reaching impasse with the Union, in violation of Section 447.501(1)(a) and (1)(c). Additionally, the Union claims that, although the changes were not discussed with them, they were discussed in a closed door unnoticed "shade" meeting conducted in violation of Section 447.605, F.S. (an exemption to the Sunshine Law). The Union contends that the failure of the City to have any discussions with the Union on these matters constitutes bad faith or surface bargaining in violation of Section 447.501(1)(a), F.S. It also asserts that by unilaterally altering terms and conditions of employment before completion of the impasse procedure set forth in Section 447.403, F.S., and by not responding to a request for records, the City violated Section 447.501(1)(a) and (1)(c), F.S. The Union seeks reinstatement of all benefits (pension and wages) modified by the City Commission. Hearings were held and concluded before a Special Magistrate. A Recommended Order was received on July 1, 2011 and the City was found in compliance with F.S. 447.4095. The Hearing Officer found the City did not commit an unfair labor practice. Subsequently, PERC adopted the Recommended Order and entered a Final Order in favor of the City. The Union appealed to the First District Court of Appeals. The hearing is scheduled for May 21, 2013 and is pending decision as of the date of this report.
International Association of Firefighters (IAFF), Local 587 v. City of Miami, Case No.: CA-2010-124. This is a matter filed before the Public Employees Relations Commission (“PERC”) by the IAFF Local 587 (hereinafter "Union") claiming the City committed an unfair labor practice. Specifically, the Union asserts that it had a Collective Bargaining Agreement ("CBA") with the City, effective through October 1, 2010, that, in 2010, in exchange for concessions by the Union, the CBA was extended through September 30, 2012, and that the City expressly waived its right not to fund any year of the CBA except in the case of "true fiscal emergency", defined in the CBA (ARTICLE 18) as, "the City must demonstrate that there is no other reasonable alternative means of appropriating monies to fund the agreement for that year or years". The Union further alleges that less than six (6) months after agreeing to the extension, on April 30, 2010, the City invoked the process under Section 447.4095, F.S., claiming "financial urgency," and on August 31, 2010, unilaterally took action to modify wages, insurance and pension benefits. The Union asserts that the invocation of Section 447.4095, F.S. was improper and was waived by the City in the CBA. Further, the Union alleges that, prior to their enactment, the modifications to the CBA were discussed in a closed door, unnoticed shade meeting in violation of Section 447.605, F.S. (an exemption to the Sunshine Law). Finally, the Union asserts that the City failed to bargain collectively and in good faith by enacting the changes of August 31, 2010, by not providing the Union with notice in advance, and by failing to discuss, bargain over, impact bargain, or complete the process set forth in Section 447.403 and/or Section 447.4095, F.S. The Union seeks reinstatement of all benefits (pension and wages)

CITY OF MIAMI, FLORIDA NOTES TO FINANCIAL STATEMENTS
82
modified by the City Commission. A hearing was scheduled before a Special Magistrate and Recommended Order was received on July 7, 2011 and the City was found in compliance with F.S. 447.4095. The Hearing Officer found the City did not commit an unfair labor practice. Subsequently, PERC adopted the recommended order and entered a Final Order in favor of the City. The Union appealed to the Third District Court of Appeals. The hearing occurred on April 15, 2013 and is pending decision as of the date of this report. Securities and Exchange Commission (SEC) Investigation: City Bond Offerings in 2007 and 2009. On December 10, 2009, the City of Miami was notified by the Miami Regional Office of the SEC that the staff of the SEC was conducting a non-public inquiry concerning certain City of Miami bond offerings to determine whether there had been any violations of federal securities laws. In letters dated December 10, 2009 and December 23, 2009, the SEC staff requested that the City voluntarily provide the SEC staff with documents concerning (a) City bond offerings in 2007 and 2009, (b) the transfer of approximately $13.1 million from the Capital Projects Fund to the General Fund in Fiscal Year 2007, (c) the transfer of approximately $13.3 million from the Capital Projects Fund to the General Fund in Fiscal Year 2008, and (d) Audit Report No. 010-005, Audit of Compliance with the Financial Integrity Principles, issued by the City of Miami Office of Independent Auditor General in November, 2009.
In February 2010, the SEC issued a formal order directing a non-public investigation (“Formal Order”), stating that it had information tending to show possible violations of Section 10(b) of the Securities Exchange Act of 1934 and Rule 10b-5 thereunder and Section 17(a) of the Securities Act of 1933. According to the Formal Order, the SEC is investigating whether, since at least 2005, the City and others may have violated these provisions by, among other things, employing devices, schemes or artifices to defraud, engaging in transactions which operated or would operate as a fraud or deceit, or making false statements of material fact or failing to disclose material facts concerning, among other things, the state of the City’s financial condition.
The SEC has requested documents from the City, both voluntarily and by subpoena, and has also issued subpoenas for documents from and the testimony of current and former City officials and employees, and has taken the testimony of some individuals. The City has received multiple subpoenas from the SEC asking for additional documents concerning primarily the Auditor General's report referenced above, the fund transfers referenced above, City bond issues in 2007 and 2009, bond document disclosures, reports to bondholders, City pension plans and obligations under such plans, any policies, procedures and guidelines related to inter-fund transfers, any adverse conditions concerning the City's finances, any internal investigation, review or analysis conducted by the City and related to matters that have been identified as subjects of the SEC investigation and documents related to the use of certain revenue sources as recently mentioned in the Internal Auditor General Report No. 11-001. Documents requested include communications with and among City management and elected officials.
On July 23, 2012, the SEC notified the City that the SEC’s enforcement staff intends to recommend that the SEC file civil fraud charges against the City based on transactions that occurred with respect to the City’s fiscal years ending September 30, 2007 and September 30, 2008. This notification from the SEC staff is commonly referred to as a “Wells Notice,” and it contains the SEC staff’s recommendations based upon its investigation. On August 6, 2012, the City filed its response to the Wells Notice which respectfully disagreed with the SEC staff’s position and the City has presented information to the SEC’s senior staff demonstrating that such charges are not warranted. The City continues to discuss the recommendation with the SEC senior staff.

CITY OF MIAMI, FLORIDA NOTES TO FINANCIAL STATEMENTS
83
The SEC investigation has temporarily diverted the attention of City officials and employees from the conduct of City operations, has caused the City to incur significant expenses, and could have a material effect on the City's financial condition and operations. The City cannot predict at this time the duration or the outcome of the final conclusion of this investigation.
Additionally, the SEC has requested documents in connection with the City’s Special Obligation Parking Revenue Bonds, Series 2010A and Series 2010B (Marlins Stadium Project). The City is cooperating fully with the SEC investigation and is providing information in response to the SEC's requests. The SEC has not advised the City when the investigation is expected to be concluded or of any potential outcome of the investigation, and the City cannot predict either the duration of the investigation or its outcome. The SEC investigation may temporarily divert the attention of City officials and employees from the conduct of City operations, could cause the City to incur significant expenses, and could have a material effect on the City's financial condition and operations. The City cannot predict the outcome of this investigation or the ultimate consequences resulting from any action on the part of the SEC.
In a prior action, dated March 21, 2003, the SEC ordered the City to cease and desist from committing or causing any further violations or future violations of Section 17(a) of the Securities Act of 1933, Section 10(b) of the Securities Exchange Act of 1934 and Rule 10b-5 thereunder. This action was taken in connection with three bond offerings, all of which occurred in 1995, for failure to disclose that the City’s cash position had materially declined since the close of Fiscal Year 1994.
Internal Revenue Service Examination: $153,060,000 City of Miami, Florida Limited Ad Valorem Tax Refunding Bonds, Series 2007A (Homeland Defense/Neighborhood Capital Improvement Projects) & City of Miami, Florida Limited Ad Valorem Tax Bonds, Series 2007B (Homeland Defense/Neighborhood Capital Improvement Projects) dated July 10, 2007 (collectively, the “2007 Homeland Defense/Neighborhood Capital Improvement Bonds”). On November 18, 2011, the City was notified by an examination request letter from the Department of Treasury, Internal Revenue Service (“IRS”), informing the City that it has been selected for a routine examination to determine compliance with federal tax requirements regarding arbitrage under sections 148 and 149 of the Internal Revenue Code.
The City is cooperating fully with the IRS examination and is providing information in response to the IRS’s requests. The IRS has not advised the City when the examination is expected to be concluded or of any potential outcome of the examination. The IRS examination has temporarily diverted the attention of City officials and employees from the conduct of City operations, could cause the City to incur significant expense, and could have a material effect on the City's future financial condition and operations. The City cannot predict the duration or the outcome of this examination or the ultimate consequences resulting from any action on the part of the IRS.
Litigation The City is involved in various lawsuits arising in the ordinary course of operations. Although the outcome of these matters is not presently determinable, it is the opinion of management of the City based upon consultation with legal counsel, that the outcome of these matters will not have an adverse material effect on the financial position of the City beyond the amounts accrued for its self-insured liability.

CITY OF MIAMI, FLORIDA NOTES TO FINANCIAL STATEMENTS
84
Encumbrances The City has outstanding encumbrances in the governmental funds. The following is a summary of these commitments at September 30, 2012:
Major Funds:Public Safety 4,701,486$ Streets and Sidewalks 13,152,305 General Government 906,590
Other Non-Major Governmental Funds 34,417,390 53,177,771
Governmental Funds
NOTE 13. – SUBSEQUENT EVENTS CITY OF MIAMI COMMUNITY REDEVELOPMENT REVENUE BONDS SERIES 1990, $11,500,000. On October 1, 2012, the City defeased the outstanding balance of the City of Miami Community Redevelopment Revenue Bonds Series 1990. SECTION 108 LOAN UNITED STATES DEPARTMENT OF HOUSING AND URBAN DEVELOPMENT WAGNER SQUARE) $4,000,000– On October 2, 2012 the City as part of the bankruptcy settlement with Wagner Square LLC defeased the balance of this outstanding loan. SPECIAL OBLIGATION NON-AD VALOREM REVENUE REFUNDING BONDS SERIES 2012 (PORT OF MIAMI TUNNEL PROJECT) $44,725,000 – On December 13, 2012, the City issued $44,725,000 in Special Obligation Non-Ad Valorem Revenue Refunding Bonds Series 2012 (Port of Miami Tunnel Project) for the purpose of, together with any other available monies, (i) refinancing the City’s Revenue Note, Series 2010 (Port of Miami Tunnel and Access Improvement Project) outstanding in the appregate principal amount of $45,000,000, including the payment of accrued interest; ii) funding a deposit to the debt service reserve Account; and (iii) paying certain costs of issuance of the Series 2012 Bonds. On April 9, 2013, the Catholic Archdiocese of Miami filed a lawsuit against the City asserting claims seeking $89 million dollars in damages, plus interest, attorneys fees, and expenses under the Bert J. Harris, Jr. Private Property Rights Protection Act, Section 70.001, F.S. regarding four parcels of property owned by the Archdiocese and located at 3333, 3601, 3607, and 3675 South Miami Avenue within the City. The lawsuit alleges diminution of property values due to the City’s enactment of the Miami 21 Zoning Code. At this time, the City cannot predict with certainty the outcome of this lawsuit. See The Most Reverend Thomas G. Wenski, Archbishop of the Archdiocese of Miami, Inc. v. city of Miami, Miami-Dade County Circuit Court, Case No,. 1312523 CA 06. NOTE 14. – PRONOUNCEMENTS ISSUED, BUT NOT YET ADOPTED GASB Statement No. 61, the Financial Reporting Entity: Omnibus, was issued in December 2010. The Statement amends GASB Statement No. 14, The Financial Reporting Entity, and No. 34, Basic Financial Statements – and Management’s Discussion and Analysis – for State and Local Governments. The Statement is intended to improve the existing standards for defining and presenting the financial reporting entity by guiding governments to: include the organizations that should be included; exclude

CITY OF MIAMI, FLORIDA NOTES TO FINANCIAL STATEMENTS
85
the organizations that should not be included and display and disclose financial information about component units in the most appropriate and useful manner. The Statement’s most significant effects include increasing the emphasis on financial relationships between a primary government and component units. The provisions of this Statement will be effective for the City beginning with the year ending September 30, 2013. GASB Statement No. 62, Codification of Accounting and Financial Reporting Guidance Contained in Pre-November 30, 1989 FASB and AICPA Pronouncements, was issued in December 2010. The Statement is intended to enhance the usefulness of GASB Codification by incorporating certain accounting guidance issued by the FASB and the AICPA that is applicable to state and local governments. The provisions of this Statement will be effective for the City beginning with the year ending September 30, 2013. GASB Statement No. 63, Financial Reporting of Deferred Outflows of Resources, Deferred Inflows of Resources, and Net Position, was issued in June 2011. This Statement provides financial reporting guidance for deferred outflows of resources and deferred inflows of resources. This Statement amends the net asset reporting requirements in Statement No. 34, Basic Financial Statements—and Management’s Discussion and Analysis—for State and Local Governments, and other pronouncements by incorporating deferred outflows of resources and deferred inflows of resources into the definitions of the required components of the residual measure and by renaming that measure as net position, rather than net assets. The provisions of this Statement will be effective for the City beginning with the year ending September 30, 2013. GASB Statement No. 65, Items Previously Reported as Assets and Liabilities, was issued in March 2012, This Statement establishes accounting and financial reporting standards that reclassify, as deferred outflows of resources or deferred inflows of resources, certain items that were previously reported as assets and liabilities and recognized, as outflows of resources or inflows of resources, certain items that were previously reported as assets and liabilities. The provisions of this Statement are effective for the City’s year ending September 30, 2014. GASB Statement No. 66, Technical Corrections-2012-an amendment of GASB Statements No. 10 and No. 62, This Statement amends Statement No. 10, Accounting and financial Reporting for Risk Financing and Related Insurance Issues, by removing the provisions that limits fund-based reporting of an entity’s risk financing activities to the general fund and the internal service fund type. The provisions of this Statement are effective for financial statements for the City’s year ending September 30, 2014. GASB Statement No. 67, Financial Reporting for Pension Plans-an amendment of GASB Statement No. 25, The objective of this Statement is to improve financial reporting by state and local governmental pensions plans. This Statement results from comprehensive review of the effectiveness of existing standards of accounting standards of accounting and financial reporting for pensions with regard to providing decision-useful information, supporting assessments of accountability and interperiod equity, and creating additional transparency. The provisions of this Statement are effective for financial statements for the City’s year ending September 30, 2014. GASB Statement No. 68, Accounting and Financial Reporting for Pension, an Admendment of GASB Statement No. 27, establishes accounting and financial reporting requirements related to pensions for governments whose employees are provided with pensions through pension plans that are covered by the scope of this Statement, as well as for nonemployer governments that have a legal obligation to

CITY OF MIAMI, FLORIDA NOTES TO FINANCIAL STATEMENTS
86
contribute to those plans. The provisions of this Statement are effective for financial statements for the City’s year ending September 30, 2015. GASB Statement No. 69, Government Combinations and Disposals of Government Operations, establishes accounting and financial reporting standards related to government combinations and disposals of government operations. The provisions of this Statement are effective for financial statements for the City’s year ending September 30, 2015. The City’s management has not yet determined the effect these statements will have on the City’s financial statements, if any.

87
This page intentionally left blank

88
City of Miami, FloridaSchedule of Revenues, Expenditures and Changes In Fund Balance
Budget and Actual - General FundFor The Year Ended September 30, 2012
Variance with Budgeted Amounts Final Budget
Original Final Actual Amounts Positive (Negative)Revenues:
Property Taxes 215,449,900$ 215,449,900$ 209,126,414 (6,323,486) Franchise and Other Taxes 36,350,000 99,064,100 102,489,740 3,425,640 Licenses and Permits 36,177,500 36,616,500 35,655,699 (960,801) Fines and Forfeitures 5,000,000 5,000,000 4,808,276 (191,724) Intergovernmental Revenues 42,477,500 42,477,500 56,176,739 13,699,239 Charges for Services 82,645,800 83,170,700 91,413,221 8,242,521 Interest 1,500,000 1,500,000 2,418,809 918,809 Other 13,575,100 17,845,600 11,373,919 (6,471,681)
Total Revenues 433,175,800 501,124,300 513,462,817 12,338,517
Expenditures:General Government
Mayor 631,800 643,800 643,291 509 Board of Commissioners 1,700,000 1,700,000 1,619,795 80,205 Office of City Manager 7,673,400 7,891,000 7,085,321 805,679 Office of City Clerk 1,061,900 1,111,900 1,048,340 63,560 Office of Civil Service 290,500 290,500 286,141 4,359 Office of Auditor General 835,100 685,100 436,025 249,075 Office of Communications 428,000 428,000 377,331 50,669 Employee Relations 2,123,000 2,158,000 1,882,005 275,995 Information Technology 8,904,400 8,454,400 8,454,345 55 Office of the City Attorney 4,420,000 4,420,000 4,264,429 155,571 Office of Strategic Planning & Budgeting 1,144,600 1,144,600 1,114,154 30,446 Purchasing 1,002,600 1,002,600 900,777 101,823 Office of Equal Opportunity & Diversity 229,300 238,200 237,745 455 Finance 5,993,900 5,993,900 5,743,691 250,209 Capital Improvement Administration 778,300 2,641,100 2,641,053 47 Non-Departmental 30,143,800 24,511,800 14,914,374 9,597,426
Total General Government 67,360,600 63,314,900 51,648,817 11,666,083
Planning and DevelopmentBuilding 4,775,300 4,940,300 4,492,190 448,110 Department of Planning 3,377,300 3,377,300 3,213,862 163,438
Total Planning and Development 8,152,600 8,317,600 7,706,052 611,548
Public WorksSolid Waste 18,932,000 20,142,000 20,140,882 1,118 General Service Administration 16,330,800 16,330,800 15,910,361 420,439 Public Works 14,503,300 14,503,300 12,824,820 1,678,480
Total Public Works 49,766,100 50,976,100 48,876,063 2,100,037
Public SafetyFire- Rescue 68,047,000 71,917,500 71,917,444 56 Police 117,613,600 118,452,300 118,452,286 14
Total Public Safety 185,660,600 190,369,800 190,369,730 70
PensionsG.E.S.E. Pension 76,808,800 76,808,800 72,843,201 3,965,599
Total Pension 76,808,800 76,808,800 72,843,201 3,965,599
Public Facilities 4,244,300 4,244,300 4,162,439 81,861 Parks and Recreation 21,562,300 23,168,000 22,857,751 310,249 Risk Management 58,413,200 58,413,200 48,659,416 9,753,784
Total Expenditures 471,968,500 475,612,700 447,123,469 28,489,231
Excess (Deficiency) of Revenues Over (Under) Expenditures (38,792,700) 25,511,600 66,339,348 40,827,748
Other Financing Sources (Uses):Transfers In 46,110,500 5,317,500 4,590,247 (727,253) Transfers Out (7,317,800) (30,829,100) (33,029,917) (2,200,817) Total Other Financing Sources (Uses) 38,792,700 (25,511,600) (28,439,670) (2,928,070)
Net Change in Fund Balance - - 37,899,678 37,899,678 Fund Balance - Beginning of Year - - 19,644,174 19,644,174 Fund Balance - End of Year -$ -$ 57,543,852 57,543,852$
The accompanying notes are an integral part of the required supplementary information.

89
City of Miami, FloridaSchedule of Revenues, Expenditures, and Changes In Fund Balance
Budget and Actual - Special Obligation Bonds FundFor The Year Ended September 30, 2012
Variance with Budgeted Amounts Final Budget
Original Final Actual Amounts Positive (Negative)Revenues:
Intergovernmental Revenues -$ -$ 3,000,000$ 3,000,000$ Interest - - 37,533 37,533 Other - 3,000,000 - (3,000,000)
Total Revenues - 3,000,000 3,037,533 37,533
Expenditures:Debt Service: Principal 11,680,900 11,680,900 11,120,815 560,085 Interest and Other Charges 27,627,300 27,627,200 27,402,989 224,211 Debt Insurance Cost - 4,000 - 4,000
Total Expenditures 39,308,200 39,312,100 38,523,804 788,296
Excess (Deficiency) of Revenues Over (Under) Expenditures (39,308,200) (36,312,100) (35,486,271) 825,829
Other Financing Sources (Uses):Transfers In 39,308,200 36,312,100 35,968,904 (343,196) Total Other Financing Sources (Uses) 39,308,200 36,312,100 35,968,904 (343,196)
Net Change in Fund Balance - - 482,633 482,633 Fund Balance - Beginning of Year - - 31,800,461 31,800,461 Fund Balance - End of Year -$ -$ 32,283,094$ 32,283,094$
The accompanying notes are an integral part of the required supplementary information.

90
CITY OF MIAMI, FLORIDA NOTES TO THE REQUIRED SUPPLEMENTARY INFORMATION
YEAR ENDED SEPTEMBER 30, 2012 (UNAUDITED)
NOTE 1. - BUDGETARY POLICY A. BUDGET POLICY The City Commission annually adopts an operating budget ordinance for all governmental funds of the City, except for the Capital Projects Funds and Emergency Services Fund. The Capital Projects Funds are budgeted on a total project basis for which annual budgets are not available. The Emergency Services Fund is dedicated for the training and operations of the Urban Search and Rescue team reimbursed by FEMA. For governmental funds, budgets are prepared on a basis consistent with accounting principles generally accepted in the United States of America. B. BUDGET-LEGAL COMPLIANCE
The City follows these procedures in establishing the budgetary data reflected in the accompanying financial statements:
- Prior to August 31st, the City Manager submits to the City Commission a proposed operating budget by fund, except for the General Fund, which is at the departmental level, for the fiscal year commencing the upcoming October 1st. The operating budget includes proposed expenditures and the means of financing them.
- The Mayor prepares and delivers a budgetary address annually to the people of the City between July 1st and September 30th.
- Such report is prepared after consultation with the City Manager. - Public hearings are conducted to obtain taxpayer comments.
- Prior to October 1st, the budget is legally enacted through the passage of an ordinance and adoption of the
budget report.
- Management may not make changes to the adopted budget without the approval of a majority vote of the Commission.
- The Commission may transfer among departments any part of an unencumbered balance of an
appropriation to a purpose for which an appropriation for the current year has proved insufficient. At the close of each fiscal year, the unencumbered balance of each appropriation reverts to the fund from which it was appropriated and is subject to future appropriations.
- Budgets are monitored at varying levels of classification detail; however, budgetary control is legally
maintained at the fund level except for the General Fund, which is maintained at the departmental level. All budget amendments require City Commission approval. During fiscal 2012, supplemental appropriations with a net effect in expenditures totaling $2,370,900 in the General Fund, $692,317 in Public Safety Capital Fund, 3,895,825 in General Government Capital Fund, $15,980,212 in Streets and Sidewalks Capital Fund, and $135,510,701 in Other Non-Major Funds was required to fund expenditures for unanticipated program requirements.

91
Unfunded(Overfunded)
(1) Actuarial Unfunded as a PercentageActuarial Actuarial Accrued (Overfunded) Funded (3) of CoveredValuation Value of Liability AAL Ratio Covered Payroll
Date Assets (AAL) (2) - (1) (1)/(2) Payroll ((2) - (1))/(3)
GESE Retirement Trust (b)(in millions)10/1/2011 $600.7 $845.1 $244.4 71% $63.6 384%10/1/2010 $653.0 $840.9 $187.9 78% $68.8 273%10/1/2009 $645.6 $780.6 $135.0 83% $90.0 150%10/1/2008 $691.8 $808.6 $116.8 85% $90.9 128%10/1/2007 $664.1 $770.2 $106.1 86% $82.1 129%10/1/2006 $618.5 $732.0 $113.5 84% $75.6 150%
GESE Staff Plan (b)(in thousands)10/1/2011 $2,137.0 $3,139.9 $1,002.9 68% $735.0 136%10/1/2010 $1,834.6 $2,827.0 $992.4 65% $843.0 118%10/1/2009 $1,556.7 $2,121.8 $565.1 73% $738.9 76%10/1/2008 $1,313.4 $1,748.1 $434.7 75% $632.2 69%10/1/2007 $1,138.7 $1,622.7 $484.1 70% $734.1 66%10/1/2006 $939.7 $1,129.3 $189.6 83% $643.8 29%
GESE Excess Plan (b)(in millions)10/1/2011 $0.0 $5.8 $5.8 0% $63.6 9%10/1/2010 $0.0 $5.7 $5.7 0% $68.8 8%10/1/2009 $0.0 $5.8 $5.8 0% $90.0 7%10/1/2008 $0.0 $5.1 $5.1 0% $90.9 5%10/1/2007 $0.0 $8.6 $8.6 0% $82.1 10%10/1/2006 $0.0 $8.0 $8.0 0% $75.6 11%
FIPO (c)(in millions)10/1/2011 $1,150.3 $1,590.5 $440.2 72% $82.2 536%10/1/2010 $1,180.6 $1,568.3 $387.7 75% $80.2 483%10/1/2009 $1,165.0 $1,539.3 $374.3 76% $122.2 306%10/1/2008 $1,219.6 $1,452.5 $232.9 85% $129.4 172%10/1/2007 $1,208.8 $1,318.4 $109.6 92% $103.6 106%10/1/2006 $1,133.0 $1,260.5 $127.5 90% $90.4 141%
EORT (e) (Elected Officials Retirement Trust (in million)1/1/2012 $5.9 $7.4 $1.5 80% $0.2 750%1/1/2011 $5.5 $6.5 $1.0 85% $0.3 333%1/1/2010 $5.3 $6.2 $0.9 85% $0.6 150%
City of Miami Other Post Employment Benefits (d)10/1/2008 $0.0 $540,682,820.0 $540,682,820.0 0.00% $257,775,622.0 209.75%10/1/2006 $0.0 $480,319,812.0 $480,319,812.0 0.00% $187,489,148.0 256.19%
a. For information regarding pension contribution percentage rates, assumptions, amortization method, see Note 10.b. Calculated using Modified Entry Age Normalc. Calculated using the Entry Age Normal Cost Methodd. Amounts based on actuarial valuation. No assets existed in the plan at September 30, 2012e. Calculated using Projected Unit Credit Cost as of 01/01/2012, prior years individual aggregate cost method.
City of Miami, FloridaPension Trust Funds and Other Post Employment Benefits
Schedule of Funding Progress (a)(Unaudited)

92
Annual Required Percentage Annual Required PercentageFiscal Contribution of ARC Fiscal Contribution of ARC
Year Ended (ARC) Contributed Year Ended (ARC) Contributed
GESE Retirement Trust FIPO Trust9/30/2012 $25,724,977 100% 9/30/2012 $47,418,316 100%9/30/2011 $20,092,441 100% 9/30/2011 $47,156,797 100%9/30/2010 $24,037,093 100% 9/30/2010 $59,025,379 100%9/30/2009 $23,191,828 100% 9/30/2009 $36,993,395 100%9/30/2008 $22,762,902 100% 9/30/2008 $36,040,251 100%9/30/2007 $24,229,028 100% 9/30/2007 $40,542,078 100%9/30/2006 $22,018,443 100% 9/30/2006 $50,635,213 100%
GESE Staff Plan GESE Excess Plan9/30/2012 $226,793 100% 9/30/2012 $606,589 69%9/30/2011 $164,490 100% 9/30/2011 $585,357 69%9/30/2010 $132,542 100% 9/30/2010 $625,539 54%9/30/2009 $159,837 100% 9/30/2009 $566,046 82%9/30/2008 $109,163 100% 9/30/2008 $898,149 50%9/30/2007 $57,995 100% 9/30/2007 $823,371 58%9/30/2006 $72,380 100% 9/30/2006 $824,766 56%
EORT (Elected Officials Retirement Trust)1/1/2012 $471,049 100%1/1/2011 $545,785 100%1/1/2010 $431,995 100%
Percentage PercentageAnnual of Annual Annual of Annual
Fiscal OPEB OPEB Fiscal OPEB OPEBYear Ended Cost Contributed Year Ended Cost Contributed
City of Miami Other Post Employment Benefits - Non-Police City of Miami Other Post Employment Benefits - Police9/30/2012 $13,676,000 23.19% 9/30/2012 $30,876,000 19.71%9/30/2011 $9,182,367 25.49% 9/30/2011 $4,931,874 39.32%9/30/2010 $7,613,473 24.11% 9/30/2010 $5,282,534 42.12%9/30/2009 $6,314,600 23.42% 9/30/2009 $5,220,141 47.78%9/30/2008 $4,910,046 18.47% 9/30/2008 $5,261,988 48.78%
(a) (a)
(a) The information presented in the Required Supplementary schedules was determined as part of the actuarial valuations at the dates indicated. The City's subsidy to OPEB benefits is unfunded. There are no separate Trust Funds or equivalent arrangements to advance-fund the OPEB obligations (See Note11).
City of Miami, FloridaPension Trust Funds and Other Post Employment Benefits
(Unaudited)Schedule of Employer Contributions

9691
Non-major Governmental Funds
SPECIAL REVENUE FUNDS Special Revenue Funds are used to account for special revenues that are legally restricted to expenditures for specified purposes. Community Redevelopment Agency (OMNI CRA) – To account for revenues and expenditures to be used for general operations in the defined OMNI Community Redevelopment Area. Community Redevelopment Agency (Midtown CRA) – To account for revenues and expenditures to be used for special operations in the defined Midtown Community Redevelopment Area. Community Redevelopment Agency (SEOPW CRA) – To account for revenues and expenditures to be used for special operations in the defined Southeast Overtown Park West Community Redevelopment Area. Homeless Program – To account for the activities of the City’s homeless program. Community Development – To account for the proceeds from the Federal government under the U.S. Department of Housing and Urban Development. Choice Housing Vouchers – To account for the monies received for administration and assistance to be provided in accordance with Section 8 of the U.S. Housing Act of 1937, as amended, under the Choice Housing Voucher Program. State Housing Initiatives Program (SHIP) – To account for the monies received from the State of Florida Housing Finance Corporation to used to provide home ownership and rental housing programs at the local level. Convention Center – To account for the operations of the City of Miami/ University of Miami James L. Knight International Center and Parking Garage.
93

9692
Non-major Governmental Funds
SPECIAL REVENUE FUNDS Economic Development & Planning Services – To account for the operations of the Economic Development and Planning Services. Fire Rescue Services – To account for the grant revenues and expenditures which supplement the City’s emergency Fire Rescue operations. Net Offices – To account for the operations of the City’s Neighborhood Enhancement Teams (Net Offices). Parks & Recreation Services – To account for the operations of the Parks and Recreation Services. Police Services – To account for the proceeds of various grants from Local, State, and Federal Agencies that are expended for police activities. Law Enforcement Trust – To account for confiscated monies awarded to the City for law enforcement related expenditures as stipulated by State Statutes. Public Works Services – To account for the proceeds granted from Local and State Agencies to be used for maintenance of streets, highways, sidewalks and infrastructure. City Clerk Services – To account for the operations of the Passport Facility, Municipal Archives and Records, and related programs. Emergency Services – To account for grants and FEMA reimbursements related to disasters. Additionally, this fund accounts for non-disaster related reimbursable expenditures. General Special Revenues – To account for activities that are designated as special revenue which do not fall into one of the previous special revenue categories.
94

9693
Non-major Governmental Funds
SPECIAL REVENUE FUNDS
Departmental Improvement Initiatives – To account for the funds designated for the City of Miami initiatives related to quality of life and technology. Transportation and Transit – To account for the operations of the City’s transit and transportation projects. Miami Ballpark Parking Facility – To account for the operations of the Miami Ballpark Parking Facilities. Liberty City Revitalization Trust – To account for the revitalization efforts for the redevelopment of the Liberty City Community Revitalization District. Virginia Key Beach Park Trust – To account for the activities to preserve, restore, and maintain the Historic Virginia Key Beach Park. Gusman and Olympia – To account for the activities of Gusman and Olympia Facilities.
95

9694
Non-major Governmental Funds
DEBT SERVICE FUNDS Debt Service Funds are used to account for the accumulation of resources, payments of general obligation bond principal, interest from government resources, special obligation bond principal and interest from pledged revenues when the government is obligated in some manner for the payment. General Obligation Bonds – To account for monies for payment of principal, interest, and other costs related to various issues of long-term general obligation bonds. Debt Service is financed primarily by an ad valorem tax. SEOPW CRA Other Special Obligation Bonds – To account for monies for payment of principal, interest, and other costs related to various CRA special obligation bonds and loans.
96

9695
Non-major Governmental Funds
CAPITAL PROJECTS FUNDS Capital Projects Funds are used to account for the acquisition and construction of major capital facilities. SEOPW Community Redevelopment Agency - To account for the acquisition or construction of major capital facilities for community redevelopment in the defined Community Redevelopment Area. Sanitary Sewers – To account for expenditures for the construction of sanitary sewers. Storm Sewers – To account for expenditures for the construction of storm sewers. Solid Waste – To account for the acquisition of equipment or facility maintenance associated with the collection and removal of solid waste. Public Facilities – To account for the acquisition or construction of major capital facilities for public use such as marinas. Parks and Recreation – To account for the acquisition, rehabilitation, or construction of major capital facilities for cultural and recreational activities such as parks, elderly and youth day care centers. Transportation and Transit – To account for the proceeds from the Citizen’s Independent Transportation Trust. Disaster Recovery – To account for revenue received from the Federal Emergency Management Agency (FEMA), insurance and other agencies as reimbursement for city-wide disasters in the areas of debris removal, roads and bridges, buildings and equipment, parks, marinas, stadiums and other measures of relief. Mass Transit – To account for the expenditures related to mass transit.
97

98
Homeless CommunityOmni CRA Midtown CRA SEOPW CRA Program Development
AssetsPooled Cash, Cash Equivalents and Investments 19,863,802$ -$ 26,768,068$ -$ 6,301,811$ Restricted Cash and Investments - - - - 4,007,475 Receivables
(Net of Allowances for Uncollectibles):Accounts - - - - 5,796 Taxes - - - - - Due from Other Governments 27,310 - 16,002 406,052 2,853,638
Accrued Interest 8,798 - 14,317 - 4,125 Total Assets 19,899,910$ -$ 26,798,387$ 406,052$ 13,172,845$
Liabilities and Fund BalancesLiabilities:
Accounts Payable and Accrued Liabilities 293,117$ -$ 1,307,546$ 43,244$ 2,415,015$ Due to Other Funds - - - 240,774 - Due to Other Governments 281,607 - - - 668,530 Deferred Revenue or Unearned Revenue - - - 104,290 920,004 Deposits - - - - 213,468
Total Liabilities 574,724 - 1,307,546 388,308 4,217,017
Fund Balances (Deficits):Non Spendable Fund BalanceNon Spendable - - - - -
Spendable Fund BalanceRestricted 19,325,186 - 25,490,841 89,452 5,496,806 Committed - - - - 3,459,022 Assigned - - - - - Unassigned - - - (71,708) - Total Fund Balances (Deficits) 19,325,186 - 25,490,841 17,744 8,955,828
Total Liabilities and Fund Balances (Deficits) 19,899,910$ -$ 26,798,387$ 406,052$ 13,172,845$
Special Revenue Funds
City of Miami, FloridaCombining Balance Sheet
Non-major Governmental FundsSeptember 30, 2012

99
EconomicChoice Development Parks & Law
Housing Convention & Planning Fire Rescue Net Recreation Police EnforcementVouchers SHIP Center Services Services Offices Services Services Trust
302,612$ 319,348$ 129,415$ 3,911,389$ -$ 1,764,306$ 2,305,345$ 4,133,980$ 3,870,340$ - - 177,126 - - - - - -
- - 114,038 - 3,570 9,606 6,931 490,428 8 - - - - - - - - - - 10,900 - 14,338 5,960,476 - 181,321 3,895,700 - - 79 - - 13 - 1 1,899 106
302,612$ 330,327$ 420,579$ 3,925,727$ 5,964,059$ 1,773,912$ 2,493,598$ 8,522,007$ 3,870,454$
4,568$ 10,900$ 191,259$ 40,864$ 3,352,872$ 25,045$ 238,066$ 1,273,848$ 76,317$ - - - - 934,414 - - - - - - - - - - - - - - - 110,643 - 5,604,975 - 21,375 359,003 - - - - - - 3,810 - - 112,413
4,568 10,900 301,902 40,864 9,892,261 28,855 259,441 1,632,851 188,730
- - - - - - - - -
298,044 319,427 118,677 333,948 1,061,057 1,776,382 540,464 7,820,799 3,681,724 - - - 3,538,838 - - 925,171 - - - - - 12,077 - - 768,522 - - - - - - (4,989,259) (31,325) - (931,643) -
298,044 319,427 118,677 3,884,863 (3,928,202) 1,745,057 2,234,157 6,889,156 3,681,724 302,612$ 330,327$ 420,579$ 3,925,727$ 5,964,059$ 1,773,912$ 2,493,598$ 8,522,007$ 3,870,454$
(continued)
Special Revenue Funds

100
General DepartmentalPublic Works City Clerk Emergency Special Improvement
Services Services Services Revenues InitiativesAssets
Pooled Cash, Cash Equivalents and Investments 2,912,159$ 435,918$ 1,249,552$ -$ 1,953,884$ Restricted Cash and Investments - - - - - Receivables
(Net of Allowances for Uncollectibles):Accounts - - - 441 124,220 Taxes - - - - - Due from Other Governments - - 677,496 1,585,943 445,290
Accrued Interest 186 - - - - Total Assets 2,912,345$ 435,918$ 1,927,048$ 1,586,384$ 2,523,394$
Liabilities and Fund BalancesLiabilities:
Accounts Payable and Accrued Liabilities 1,125$ 13,201$ 601,345$ 776,929$ 163,819$ Due to Other Funds - - - 559,064 - Due to Other Governments - - - 125,197 - Deferred Revenue or Unearned Revenue - - - 1,522,047 16,282 Deposits - - - - -
Total Liabilities 1,125 13,201 601,345 2,983,237 180,101
Fund Balances (Deficits):Non Spendable Fund BalanceNon Spendable 1,000,000 - - - -
Spendable Fund BalanceRestricted 287,840 - 1,748,436 225,792 1,255,924 Committed 1,552,786 422,717 - 13,950 1,087,369 Assigned 70,594 - - - - Unassigned - - (422,733) (1,636,595) - Total Fund Balances (Deficits) 2,911,220 422,717 1,325,703 (1,396,853) 2,343,293
Total Liabilities and Fund Balances (Deficits) 2,912,345$ 435,918$ 1,927,048$ 1,586,384$ 2,523,394$
Combining Balance SheetNon-major Governmental Funds
September 30, 2012
City of Miami, Florida
Special Revenue Funds

101
Miami LibertyBallpark City Virginia Key Gusman Total General
Transportation Parking Revitalization Beach and Special Obligation& Transit Facilities Trust Park Trust Olympia Revenue Bonds
14,158,271$ -$ 353,249$ -$ -$ 90,733,449$ -$ - - - 32,802 - 4,217,403 2,996,472
- 2,190,717 - - - 2,945,755 - - - - - - - 991,460
3,079,906 - 1,400 - 96,968 19,252,740 - - - 27 - - 29,551 -
17,238,177$ 2,190,717$ 354,676$ 32,802$ 96,968$ 117,178,898$ 3,987,932$
394,857$ 466,831$ 3,582$ 23,560$ -$ 11,717,910$ 4,491$ - 645,726 - 41,705 96,968 2,518,651 1,039,990 - - - - - 1,075,334 -
1,100,000 162,275 11,500 - - 9,932,394 991,460 - - - - - 329,691 -
1,494,857 1,274,832 15,082 65,265 96,968 25,573,980 2,035,941
- -$ - - - 1,000,000 - -
15,743,320 915,885 339,594 - - 86,869,598 1,951,991 - - - - - 10,999,853 - - - - - - 851,193 - - - - (32,463) - (8,115,726) -
15,743,320 915,885 339,594 (32,463) - 91,604,918 1,951,991 17,238,177$ 2,190,717$ 354,676$ 32,802$ 96,968$ 117,178,898$ 3,987,932$
Special Revenue Funds Debt Service Funds

102
SEOPW CRA SEOPWOther Special Total Community
Obligation Debt Redevelopment Sanitary StormBonds Service Agency Sewers Sewers
AssetsPooled Cash, Cash Equivalents and Investments 10,250$ 10,250$ 1,813$ 18,009,082$ 11,515,483$ Restricted Cash and Investments 1,219,725 4,216,197 - - - Receivables
(Net of Allowances for Uncollectibles):Accounts - - - - - Taxes - 991,460 - - - Due From Other Governments - - - - 819,325
Accrued Interest - - - 4,125 - Total Assets 1,229,975$ 5,217,907$ 1,813$ 18,013,207$ 12,334,808$
Liabilities and Fund BalancesLiabilities:
Accounts Payable and Accrued Liabilities 3,991$ 8,482$ -$ 64,867$ 1,867,931$ Due to Other Funds - 1,039,990 - - - Due to Other Governments - - - - - Deferred Revenue or Unearned Revenue - 991,460 - - 819,325 Deposits - - - - -
Total Liabilities 3,991 2,039,932 - 64,867 2,687,256
Fund Balances (Deficits):Non Spendable Fund Balance
Non Spendable - - - - - Spendable Fund Balance
Restricted 1,225,984 3,177,975 1,813 17,948,340 9,647,552 Committed - - - - - Assigned - - - - - Unassigned - - - - -
Total Fund Balances (Deficits) 1,225,984 3,177,975 1,813 17,948,340 9,647,552 Total Liabilities and Fund Balances (Deficits) 1,229,975$ 5,217,907$ 1,813$ 18,013,207$ 12,334,808$
City of Miami, FloridaCombining Balance Sheet
Non-major Governmental FundsSeptember 30, 2012
Debt Service Funds Capital Projects Funds

103
TotalTotal Non-Major
Solid Public Parks & Transportation Disaster Mass Capital GovernmentalWaste Facilities Recreation & Transit Recovery Transit Projects Funds
1,892,402$ 26,229,358$ 19,080,615$ 19,725,884$ 1,137,476$ -$ 97,592,113$ 188,335,812- - - - - - - 8,433,600
1,938 - 14,701 - - - 16,639 2,962,394- - - - - - - 991,460- 777,167 585,618 - 12,683 1,939,653 4,134,446 23,387,186- - - - - - 4,125 33,676
1,894,340$ 27,006,525$ 19,680,934$ 19,725,884$ 1,150,159$ 1,939,653$ 101,747,323$ 224,144,128
99,275$ 768,705 1,534,135$ -$ 26,949$ 128,780$ 4,490,642$ 16,217,034- - - - - 1,911,016 1,911,016 5,469,657- - - - - - - 1,075,334- 962,671 589,340 - 1,895,593 79,146 4,346,075 15,269,929- - - - - - - 329,691
99,275 1,731,376 2,123,475 - 1,922,542 2,118,942 10,747,733 38,361,645
- - - - - - - 1,000,000-
- 25,275,149 17,557,459 19,725,884 - - 90,156,197 180,203,7701,795,065 - - - - - 1,795,065 12,794,918
- - - - - - - 851,193- - - - (772,383) (179,289) (951,672) (9,067,398)
1,795,065 25,275,149 17,557,459 19,725,884 (772,383) (179,289) 90,999,590 185,782,4831,894,340$ 27,006,525$ 19,680,934$ 19,725,884$ 1,150,159$ 1,939,653$ 101,747,323$ 224,144,128
Capital Projects Funds

104
ChoiceHomeless Community Housing
Omni CRA Midtown CRA SEOPW CRA Program Development VouchersRevenues
Property Taxes 4,524,625$ 1,636,727$ 8,098,297$ -$ -$ -$ Franchise Fees and Other Taxes - - - - - - Licenses and Permits - - - - 150 - Fines and Forfeitures - - - - - - Intergovernmental Revenues 270,082 - 407,701 1,367,428 32,093,746 1,010,849 Charges for Services 4,100 - 10,389 - 66,483 - Interest 36,804 - 56,868 - 1,969 - Other - - - - - 3,192
Total Revenues 4,835,611 1,636,727 8,573,255 1,367,428 32,162,348 1,014,041
ExpendituresCurrent Operating:
General Government - - - - - - Planning and Development - - - - - - Community Development - - - 1,522,010 32,580,585 1,653,076 Community Redevelopment Areas 13,301,893 1,623,585 6,966,581 - - - Public Works - - - - - - Public Safety - - - - - - Public Facilities - - - - - - Parks and Recreation - - - - - -
Debt Service: Principal - - - - - - Interest and Other Charges - - - - - -
Capital Outlay - - - - - - Total Expenditures 13,301,893 1,623,585 6,966,581 1,522,010 32,580,585 1,653,076
Excess (Deficiency) of RevenuesOver (Under) Expenditures (8,466,282) 13,142 1,606,674 (154,582) (418,237) (639,035)
Other Financing Sources (Uses)Transfers In - - 1,737,237 196,800 894,677 - Transfers Out (859,614) (13,142) (2,398,897) - (1,136,933) -
Total Other Financing Sources (Uses) (859,614) (13,142) (661,660) 196,800 (242,256) -
Net Changes in Fund Balances (9,325,896) - 945,014 42,218 (660,493) (639,035)
Fund Balances, (Deficit) - Beginning 28,651,082 - 24,545,827 (24,474) 9,616,321 937,079
Fund Balances (Deficit) - Ending 19,325,186$ -$ 25,490,841$ 17,744$ 8,955,828$ 298,044$
City of Miami, FloridaCombining Statement of Revenues, Expenditures, and Changes In Fund Balances
Special Revenue Funds
Non-major Governmental FundsFor The Year Ended September 30, 2012

105
EconomicDevelopment Parks & Law
Convention & Planning Fire Rescue Net Recreation Police EnforcementSHIP Center Services Services Offices Services Services Trust
-$ -$ -$ -$ -$ -$ -$ -$ - - - - - - - -
25 - 16,500 - 20 48,934 - - - 23,164 - - - - - 546,271
868,463 - 33,541 14,408,142 - 1,352,353 8,933,259 - - 6,621,300 1,256,648 2,306 331,019 162,213 895,531 -
771 - - 103 1,773 102 16,805 2,183 28,890 317,784 - 10,129 - 707,980 41,366 -
898,149 6,962,248 1,306,689 14,420,680 332,812 2,271,582 9,886,961 548,454
- - - - 247,510 - - - - - 216,316 - - - - -
950,656 - - - - - - - - - - - - - - - - - - - - - - - - - - 17,703,536 - - 11,574,631 699,204 - 3,838,057 - - - - - - - - - - - 2,304,981 - -
- - - - - - - - - - - - - - - - - - - - - 370,504 199,792 -
950,656 3,838,057 216,316 17,703,536 247,510 2,675,485 11,774,423 699,204
(52,507) 3,124,191 1,090,373 (3,282,856) 85,302 (403,903) (1,887,462) (150,750)
- 3,452,788 74,000 6,805 80,000 - 825,581 - - (6,614,437) (4,975,224) - - - - - - (3,161,649) (4,901,224) 6,805 80,000 - 825,581 -
(52,507) (37,458) (3,810,851) (3,276,051) 165,302 (403,903) (1,061,881) (150,750)
371,934 156,135 7,695,714 (652,151) 1,579,755 2,638,060 7,951,037 3,832,474
319,427$ 118,677$ 3,884,863$ (3,928,202)$ 1,745,057$ 2,234,157$ 6,889,156$ 3,681,724$
(continued)
Special Revenue Funds

106
General DepartmentalPublic Works City Clerk Emergency Special Improvement
Services Services Services Revenues InitiativesRevenues
Property Taxes -$ -$ -$ -$ -$ Franchise Fees and Other Taxes - - - - - Licenses and Permits - - - - 2,795 Fines and Forfeitures - - - - 160,263 Intergovernmental Revenues - - 4,755,458 5,419,357 1,189,216 Charges for Services 295,997 126,165 - - 500 Interest 1,718 - - - 771 Other - - - - 15,000
Total Revenues 297,715 126,165 4,755,458 5,419,357 1,368,545
ExpendituresCurrent Operating:
General Government - 198,082 - 3,141,632 2,083,476 Planning and Development - - - - - Community Development - - - - - Community Redevelopment Areas - - - - - Public Works 39,481 - - - - Public Safety - - 100,268 - - Public Facilities - - - - - Parks and Recreation - - - - -
Debt Service: Principal - - - - - Interest and Other Charges - - - - -
Capital Outlay - - - 2,629,234 12,070 Total Expenditures 39,481 198,082 100,268 5,770,866 2,095,546
Excess (Deficiency) of RevenuesOver (Under) Expenditures 258,234 (71,917) 4,655,190 (351,509) (727,001)
Other Financing Sources (Uses)Transfers In - 35,000 - - 1,619,600 Transfers Out - - (3,947,965) - -
Total Other Financing Sources (Uses) - 35,000 (3,947,965) - 1,619,600
Net Changes in Fund Balances 258,234 (36,917) 707,225 (351,509) 892,599
Fund Balances, (Deficit) - Beginning 2,652,986 459,634 618,478 (1,045,344) 1,450,694
Fund Balances (Deficit) - Ending 2,911,220$ 422,717$ 1,325,703$ (1,396,853)$ 2,343,293$
Special Revenue Funds
City of Miami, FloridaCombining Statement of Revenues, Expenditures, and Changes In Fund Balances
Non-major Governmental FundsFor The Year Ended September 30, 2012

107
Debt Service FundsLiberty
Miami City Virginia Key Gusman Total GeneralTransportation Ballpark Revitalization Beach and Special Obligation
& Transit Parking Facility Trust Park Trust Olympia Revenue Bonds
-$ -$ -$ -$ -$ 14,259,649$ 26,887,032$ - - - - - - - - - - - - 68,424 - - - - - - 729,698 -
13,537,633 - 5,450 - - 85,652,678 - - 4,835,653 - 296,719 - 14,905,023 - - - 243 - - 120,110 - - - 9,150 71,613 - 1,205,104 -
13,537,633 4,835,653 14,843 368,332 - 116,940,686 26,887,032
1,031,576 - - - - 6,702,276 20,151 - - - - - 216,316 - - - - - - 36,706,327 - - - 148,708 - - 22,040,767 - - - - - - 39,481 - - - - - - 30,077,639 - - 1,295,168 - - - 5,133,225 - - - - 413,427 - 2,718,408 -
- - - - - - 11,578,375 - - - - - - 13,673,035
279,594 - - - - 3,491,194 - 1,311,170 1,295,168 148,708 413,427 - 107,125,633 25,271,561
12,226,463 3,540,485 (133,865) (45,095) - 9,815,053 1,615,471
6,593,994 - - - - 15,516,482 - (9,404,600) (2,624,600) - - - (31,975,412) - (2,810,606) (2,624,600) - - - (16,458,930) -
9,415,857 915,885 (133,865) (45,095) - (6,643,877) 1,615,471
6,327,463 - 473,459 12,632 - 98,248,795 336,520
15,743,320$ 915,885$ 339,594$ (32,463)$ -$ 91,604,918$ 1,951,991$
(continued)
Special Revenue Funds
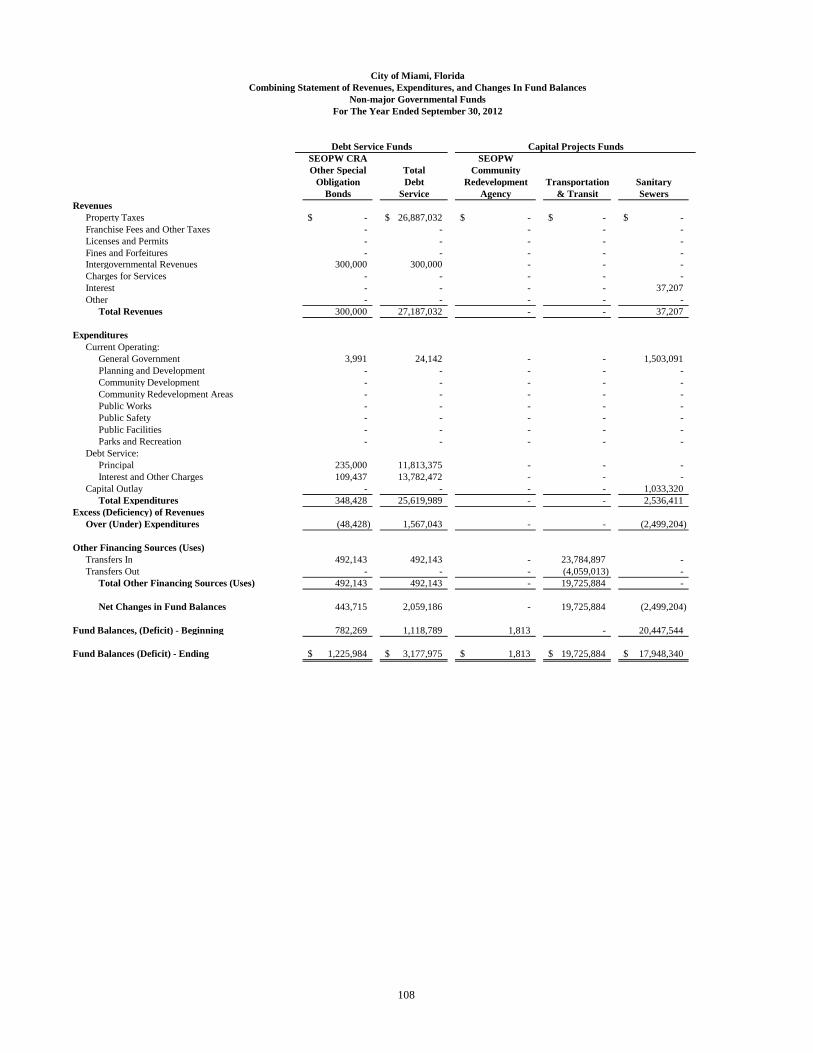
108
SEOPW CRA SEOPWOther Special Total Community
Obligation Debt Redevelopment Transportation SanitaryBonds Service Agency & Transit Sewers
RevenuesProperty Taxes -$ 26,887,032$ -$ -$ -$ Franchise Fees and Other Taxes - - - - - Licenses and Permits - - - - - Fines and Forfeitures - - - - - Intergovernmental Revenues 300,000 300,000 - - - Charges for Services - - - - - Interest - - - - 37,207 Other - - - - -
Total Revenues 300,000 27,187,032 - - 37,207
ExpendituresCurrent Operating:
General Government 3,991 24,142 - - 1,503,091 Planning and Development - - - - - Community Development - - - - - Community Redevelopment Areas - - - - - Public Works - - - - - Public Safety - - - - - Public Facilities - - - - - Parks and Recreation - - - - -
Debt Service: Principal 235,000 11,813,375 - - - Interest and Other Charges 109,437 13,782,472 - - -
Capital Outlay - - - - 1,033,320 Total Expenditures 348,428 25,619,989 - - 2,536,411
Excess (Deficiency) of RevenuesOver (Under) Expenditures (48,428) 1,567,043 - - (2,499,204)
Other Financing Sources (Uses)Transfers In 492,143 492,143 - 23,784,897 - Transfers Out - - - (4,059,013) -
Total Other Financing Sources (Uses) 492,143 492,143 - 19,725,884 -
Net Changes in Fund Balances 443,715 2,059,186 - 19,725,884 (2,499,204)
Fund Balances, (Deficit) - Beginning 782,269 1,118,789 1,813 - 20,447,544
Fund Balances (Deficit) - Ending 1,225,984$ 3,177,975$ 1,813$ 19,725,884$ 17,948,340$
City of Miami, FloridaCombining Statement of Revenues, Expenditures, and Changes In Fund Balances
Non-major Governmental FundsFor The Year Ended September 30, 2012
Capital Projects FundsDebt Service Funds

109
Capital Projects FundsTotal
Total Non-MajorStorm Solid Public Parks & Disaster Mass Capital GovernmentalSewers Waste Facilities Recreation Recovery Transit Projects Funds
-$ -$ -$ -$ -$ -$ -$ 41,146,681$ 21,740 - - - - - 21,740 21,740
- 1,448 - - - - 1,448 69,872 - 510 - - - - 510 730,208
34,715 - 1,980,282 1,181,781 - 1,860,507 5,057,285 91,009,963 - - - 88,746 - - 88,746 14,993,769 - - 20,442 - - - 57,649 177,759 - 119 2,147,209 - - - 2,147,328 3,352,432
56,455 2,077 4,147,933 1,270,527 - 1,860,507 7,374,706 151,502,424
656,992 - - - - 401,703 2,561,786 9,288,204 - - - - - - - 216,316 - - - - - - - 36,706,327 - - - - - - - 22,040,767 - 33,416 - - - - 33,416 72,897 - - - - - - - 30,077,639 - - 3,412,778 - - - 3,412,778 8,546,003 - - - 303,254 - - 303,254 3,021,662
- - - - - - - 11,813,375 - - - - - - - 13,782,472
6,769,521 1,332,867 16,971,921 15,347,511 - 2,706,835 44,161,975 47,653,169 7,426,513 1,366,283 20,384,699 15,650,765 - 3,108,538 50,473,209 183,218,831
(7,370,058) (1,364,206) (16,236,766) (14,380,238) - (1,248,031) (43,098,503) (31,716,407)
8,218,885 2,113,744 2,267,969 8,748,142 - 1,068,741 46,202,378 62,211,003 (1,847,541) - (81,670) (105,000) - (7,652,694) (13,745,918) (45,721,330) 6,371,344 2,113,744 2,186,299 8,643,142 - (6,583,953) 32,456,460 16,489,673
(998,714) 749,538 (14,050,467) (5,737,096) - (7,831,984) (10,642,043) (15,226,734)
10,646,266 1,045,527 39,325,616 23,294,555 (772,383) 7,652,695 101,641,633 201,009,217
9,647,552$ 1,795,065$ 25,275,149$ 17,557,459$ (772,383)$ (179,289)$ 90,999,590$ 185,782,483$
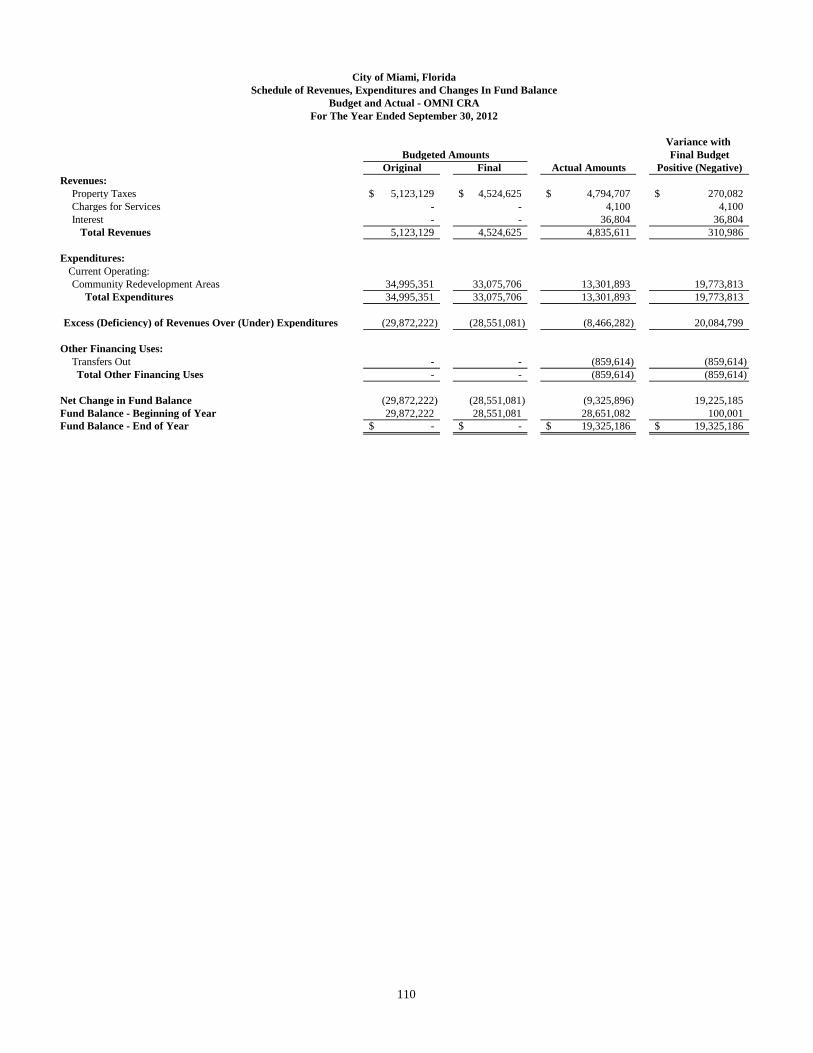
110
City of Miami, FloridaSchedule of Revenues, Expenditures and Changes In Fund Balance
Budget and Actual - OMNI CRAFor The Year Ended September 30, 2012
Variance with Budgeted Amounts Final Budget
Original Final Actual Amounts Positive (Negative)Revenues:
Property Taxes 5,123,129$ 4,524,625$ 4,794,707$ 270,082$ Charges for Services - - 4,100 4,100 Interest - - 36,804 36,804
Total Revenues 5,123,129 4,524,625 4,835,611 310,986
Expenditures:Current Operating:Community Redevelopment Areas 34,995,351 33,075,706 13,301,893 19,773,813
Total Expenditures 34,995,351 33,075,706 13,301,893 19,773,813
Excess (Deficiency) of Revenues Over (Under) Expenditures (29,872,222) (28,551,081) (8,466,282) 20,084,799
Other Financing Uses:Transfers Out - - (859,614) (859,614) Total Other Financing Uses - - (859,614) (859,614)
Net Change in Fund Balance (29,872,222) (28,551,081) (9,325,896) 19,225,185 Fund Balance - Beginning of Year 29,872,222 28,551,081 28,651,082 100,001 Fund Balance - End of Year -$ -$ 19,325,186$ 19,325,186$

111
City of Miami, FloridaSchedule of Revenues, Expenditures and Changes In Fund Balance
Budget and Actual - Midtown CRAFor The Year Ended September 30, 2012
Variance with Budgeted Amounts Final Budget
Original Final Actual Amounts Positive (Negative)Revenues:
Property Taxes 510,337$ 1,636,727$ 1,636,727$ -$ Total Revenues 510,337 1,636,727 1,636,727 -
Expenditures:Current Operating:Community Redevelopment Areas 510,337 1,636,727 1,623,585 13,142
Total Expenditures 510,337 1,636,727 1,623,585 13,142
Excess (Deficiency) of Revenues Over (Under) Expenditures - - 13,142 13,142
Other Financing Uses:Transfers Out - - (13,142) (13,142) Total Other Financing Uses - - (13,142) (13,142)
Net Change in Fund Balance - - - - Fund Balance - Beginning of Year - - - - Fund Balance - End of Year -$ -$ -$ -$

112
City of Miami, FloridaSchedule of Revenues, Expenditures and Changes In Fund Balance
Budget and Actual - SEOPW CRAFor The Year Ended September 30, 2012
Variance with Budgeted Amounts Final Budget
Original Final Actual Amounts Positive (Negative)Revenues:
Property Taxes 9,460,410$ 9,057,183$ 8,098,297$ (958,886)$ Intergovernmental Revenues 932,655 1,038,174 407,701 (630,473) Charges for Services - - 10,389 10,389 Interest - - 56,868 56,868
Total Revenues 10,393,065 10,095,357 8,573,255 (1,522,102)
Expenditures:Current Operating:Community Redevelopment Areas 34,099,456 32,992,651 6,966,581 26,026,070
Total Expenditures 34,099,456 32,992,651 6,966,581 26,026,070
Excess (Deficiency) of Revenues Over (Under) Expenditures (23,706,391) (22,897,294) 1,606,674 24,503,968
Other Financing Sources (Uses):Net carryover fund balance 25,167,764 23,184,295 - (23,184,295) Transfers In - - 1,737,237 1,737,237 Transfers Out (1,461,373) (1,438,696) (2,398,897) (960,201) Total Other Financing Sources (Uses) 23,706,391 21,745,599 (661,660) (22,407,259)
Net Change in Fund Balance - - 945,014 945,014 Fund Balance - Beginning of Year - - 24,545,827 24,545,827 Fund Balance - End of Year -$ -$ 25,490,841$ 25,490,841$

113
City of Miami, FloridaSchedule of Revenues, Expenditures and Changes In Fund Balance
Budget and Actual - Homeless ProgramFor The Year Ended September 30, 2012
Variance with Budgeted Amounts Final Budget
Original Final Actual Amounts Positive (Negative)Revenues:
Intergovernmental Revenues -$ 1,325,200$ 1,367,428$ 42,228$ Total Revenues - 1,325,200 1,367,428 42,228
Expenditures:Current Operating:Community Development 196,800 1,522,000 1,522,010 (10)
Total Expenditures 196,800 1,522,000 1,522,010 (10)
Excess (Deficiency) of Revenues Over (Under) Expenditures (196,800) (196,800) (154,582) 42,218
Other Financing Sources:Transfers In 196,800 196,800 196,800 - Total Other Financing Sources 196,800 196,800 196,800 -
Net Change in Fund Balance - - 42,218 42,218 Fund Balance (Deficit) - Beginning of Year - - (24,474) (24,474) Fund Balance (Deficit) - End of Year -$ -$ 17,744$ 17,744$

114
City of Miami, FloridaSchedule of Revenues, Expenditures, and Changes In Fund Balance
Budget and Actual - Community Development FundFor The Year Ended September 30, 2012
Variance with Budgeted Amounts Final Budget
Original Final Actual Amounts Positive (Negative)Revenues:
Licenses and Permits -$ -$ 150$ 150$ Intergovernmental Revenues - 44,475,800 32,093,746 (12,382,054) Charges for Services - - 66,483 66,483 Interest - - 1,969 1,969 Other - 245,100 - (245,100)
Total Revenues - 44,720,900 32,162,348 (12,558,552)
Expenditures:Current Operating:Community Development - 44,162,100 32,580,585 11,581,515 Debt Service: Principal - 198,000 - 198,000 Interest and Other Charges - 23,700 - 23,700 Capital Outlay - 92,600 - 92,600
Total Expenditures - 44,476,400 32,580,585 11,895,815
Excess (Deficiency) of Revenues Over (Under) Expenditures - 244,500 (418,237) (662,737)
Other Financing Sources (Uses):Transfers In - 592,700 894,677 301,977 Transfers Out - (837,200) (1,136,933) (299,733) Total Other Financing Sources (Uses) - (244,500) (242,256) 2,244
Net Change in Fund Balance - - (660,493) (660,493) Fund Balance - Beginning of Year - - 9,616,321 9,616,321 Fund Balance - End of Year -$ -$ 8,955,828$ 8,955,828$

115
City of Miami, FloridaSchedule of Revenues, Expenditures and Changes In Fund Balance
Budget and Actual - Choice Housing Vouchers For The Year Ended September 30, 2012
Variance with Budgeted Amounts Final Budget
Original Final Actual Amounts Positive (Negative)Revenues:
Intergovernmental Revenues -$ 1,653,100$ 1,010,849$ (642,251)$ Other - 3,192 3,192
Total Revenues - 1,653,100 1,014,041 (639,059)
Expenditures:Current Operating:Community Development - 1,653,100 1,653,076 24
Total Expenditures - 1,653,100 1,653,076 24
Excess (Deficiency) of Revenues Over (Under) Expenditures - - (639,035) (639,035)
Net Change in Fund Balance - - (639,035) (639,035) Fund Balance - Beginning of Year - - 937,079 937,079 Fund Balance - End of Year -$ -$ 298,044$ 298,044$

116
City of Miami, FloridaSchedule of Revenues, Expenditures and Changes In Fund Balance
Budget and Actual - SHIPFor The Year Ended September 30, 2012
Variance with Budgeted Amounts Final Budget
Original Final Actual Amounts Positive (Negative)Revenues:
Licenses and Permits -$ -$ 25$ 25$ Intergovernmental Revenues - 960,900 868,463 (92,437) Interest - - 771 771 Other - - 28,890 28,890
Total Revenues - 960,900 898,149 (62,751)
Expenditures:Current Operating:Community Development - 960,900 950,656 10,244
Total Expenditures - 960,900 950,656 10,244
Excess (Deficiency) of Revenues Over (Under) Expenditures - - (52,507) (52,507)
Net Change in Fund Balance - - (52,507) (52,507) Fund Balance - Beginning of Year - - 371,934 371,934 Fund Balance - End of Year -$ -$ 319,427$ 319,427$

117
City of Miami, FloridaSchedule of Revenues, Expenditures and Changes In Fund Balance
Budget and Actual - Convention CenterFor The Year Ended September 30, 2012
Variance with Budgeted Amounts Final Budget
Original Final Actual Amounts Positive (Negative)Revenues:
Fines and Forfeitures -$ 23,164$ 23,164$ Charges for Services 6,724,000 6,999,700 6,621,300 (378,400) Other - - 317,784 317,784
Total Revenues 6,724,000 6,999,700 6,962,248 (37,452)
Expenditures:Current Operating:Public Facilities 3,725,900 4,001,600 3,838,057 163,543
Total Expenditures 3,725,900 4,001,600 3,838,057 163,543
Excess (Deficiency) of Revenues Over (Under) Expenditures 2,998,100 2,998,100 3,124,191 126,091
Other Financing Sources (Uses):Transfers In 3,452,800 3,452,800 3,452,788 (12) Transfers Out (6,450,900) (6,450,900) (6,614,437) (163,537) Total Other Financing Sources (Uses) (2,998,100) (2,998,100) (3,161,649) (163,549)
Net Change in Fund Balance - - (37,458) (37,458) Fund Balance (Deficit)- Beginning of Year - - 156,135 156,135 Fund Balance (Deficit) - End of Year -$ -$ 118,677$ 118,677$
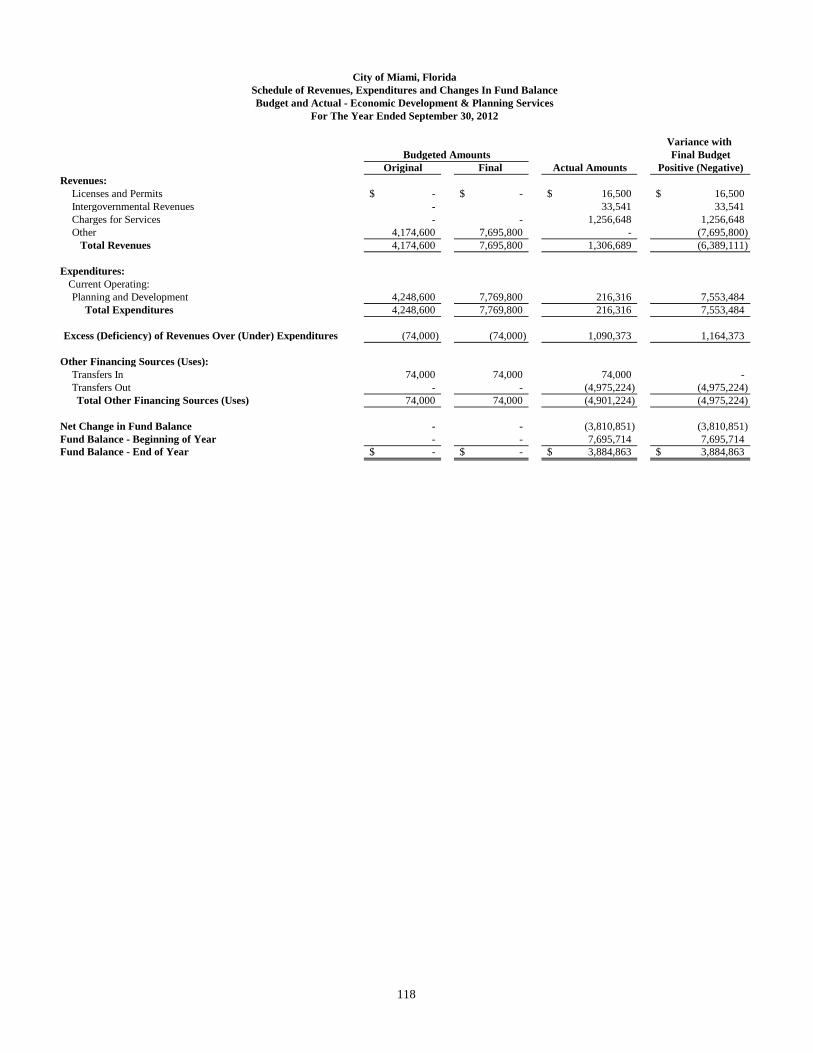
118
City of Miami, FloridaSchedule of Revenues, Expenditures and Changes In Fund BalanceBudget and Actual - Economic Development & Planning Services
For The Year Ended September 30, 2012
Variance with Budgeted Amounts Final Budget
Original Final Actual Amounts Positive (Negative)Revenues:
Licenses and Permits -$ -$ 16,500$ 16,500$ Intergovernmental Revenues - 33,541 33,541 Charges for Services - - 1,256,648 1,256,648 Other 4,174,600 7,695,800 - (7,695,800)
Total Revenues 4,174,600 7,695,800 1,306,689 (6,389,111)
Expenditures:Current Operating:Planning and Development 4,248,600 7,769,800 216,316 7,553,484
Total Expenditures 4,248,600 7,769,800 216,316 7,553,484
Excess (Deficiency) of Revenues Over (Under) Expenditures (74,000) (74,000) 1,090,373 1,164,373
Other Financing Sources (Uses):Transfers In 74,000 74,000 74,000 - Transfers Out - - (4,975,224) (4,975,224) Total Other Financing Sources (Uses) 74,000 74,000 (4,901,224) (4,975,224)
Net Change in Fund Balance - - (3,810,851) (3,810,851) Fund Balance - Beginning of Year - - 7,695,714 7,695,714 Fund Balance - End of Year -$ -$ 3,884,863$ 3,884,863$

119
City of Miami, FloridaSchedule of Revenues, Expenditures, and Changes In Fund Balance
Budget and Actual - Fire Rescue Services FundFor The Year Ended September 30, 2012
Variance with Budgeted Amounts Final Budget
Original Final Actual Amounts Positive (Negative)Revenues:
Intergovernmental Revenues -$ 1,156,400$ 14,408,142$ 13,251,742$ Charges for Services - - 2,306 2,306 Interest - - 103 103 Other - 18,825,700 10,129 (18,815,571)
Total Revenues - 19,982,100 14,420,680 (5,561,420)
Expenditures:Current Operating:Public Safety - 19,803,700 17,703,536 2,100,164 Capital Outlay - 198,800 - 198,800
Total Expenditures - 20,002,500 17,703,536 2,298,964
Excess (Deficiency) of Revenues Over (Under) Expenditures - (20,400) (3,282,856) (3,262,456)
Other Financing Sources:Transfers In - 20,400 6,805 (13,595) Total Other Financing Sources - 20,400 6,805 (13,595)
Net Change in Fund Balance - - (3,276,051) (3,276,051) Fund Balance (Deficit) - Beginning of Year - - (652,151) (652,151) Fund Balance (Deficit) - End of Year -$ -$ (3,928,202)$ (3,928,202)$

120
City of Miami, FloridaSchedule of Revenues, Expenditures and Changes In Fund Balance
Budget and Actual - NET Offices FundFor The Year Ended September 30, 2012
Variance with Budgeted Amounts Final Budget
Original Final Actual Amounts Positive (Negative)Revenues:
Licenses and Permits -$ -$ 20$ 20$ Charges for Services - - 331,019 331,019 Interest - - 1,773 1,773 Other 679,100 1,584,400 - (1,584,400)
Total Revenues 679,100 1,584,400 332,812 (1,251,588)
Expenditures:Current Operating:General Government - 905,300 247,510 657,790 Capital Outlay 679,100 679,100 - 679,100
Total Expenditures 679,100 1,584,400 247,510 1,336,890
Excess (Deficiency) of Revenues Over (Under) Expenditures - - 85,302 85,302
Other Financing Sources:Transfers In - 80,000 80,000 Total Other Financing Sources - - 80,000 80,000
Net Change in Fund Balance - - 165,302 165,302 Fund Balance - Beginning of Year - - 1,579,755 1,579,755 Fund Balance - End of Year -$ -$ 1,745,057$ 1,745,057$

121
City of Miami, FloridaSchedule of Revenues, Expenditures and Changes In Fund Balance
Budget and Actual - Parks & Recreation Services FundFor The Year Ended September 30, 2012
Variance with Budgeted Amounts Final Budget
Original Final Actual Amounts Positive (Negative)Revenue:
Licenses and Permits -$ 250,000$ 48,934$ (201,066)$ Intergovernmental Revenues - 940,100 1,352,353 412,253 Charges for Services 970,000 970,000 162,213 (807,787) Interest - - 102 102 Other 2,372,000 3,827,600 707,980 (3,119,620)
Total Revenues 3,342,000 5,987,700 2,271,582 (3,716,118)
Expenditures:Current Operating:Parks and Recreation 2,981,500 5,617,200 2,304,981 3,312,219 Capital Outlay 360,500 370,500 370,504 (4)
Total Expenditures 3,342,000 5,987,700 2,675,485 3,312,215
Excess (Deficiency) of Revenues Over (Under) Expenditures - - (403,903) (403,903)
Net Change in Fund Balance - - (403,903) (403,903) Fund Balance - Beginning of Year - - 2,638,060 2,638,060 Fund Balance - End of Year -$ -$ 2,234,157$ 2,234,157$
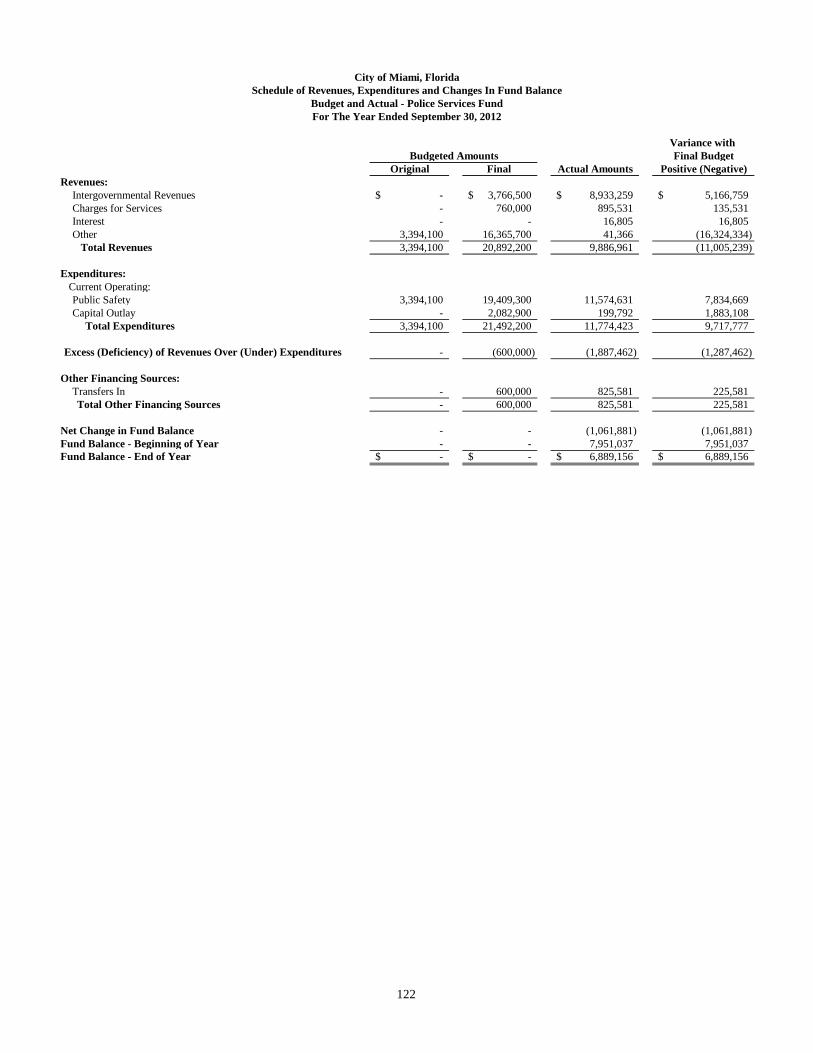
122
City of Miami, FloridaSchedule of Revenues, Expenditures and Changes In Fund Balance
Budget and Actual - Police Services FundFor The Year Ended September 30, 2012
Variance with Budgeted Amounts Final Budget
Original Final Actual Amounts Positive (Negative)Revenues:
Intergovernmental Revenues -$ 3,766,500$ 8,933,259$ 5,166,759$ Charges for Services - 760,000 895,531 135,531 Interest - - 16,805 16,805 Other 3,394,100 16,365,700 41,366 (16,324,334)
Total Revenues 3,394,100 20,892,200 9,886,961 (11,005,239)
Expenditures:Current Operating:Public Safety 3,394,100 19,409,300 11,574,631 7,834,669 Capital Outlay - 2,082,900 199,792 1,883,108
Total Expenditures 3,394,100 21,492,200 11,774,423 9,717,777
Excess (Deficiency) of Revenues Over (Under) Expenditures - (600,000) (1,887,462) (1,287,462)
Other Financing Sources:Transfers In - 600,000 825,581 225,581 Total Other Financing Sources - 600,000 825,581 225,581
Net Change in Fund Balance - - (1,061,881) (1,061,881) Fund Balance - Beginning of Year - - 7,951,037 7,951,037 Fund Balance - End of Year -$ -$ 6,889,156$ 6,889,156$
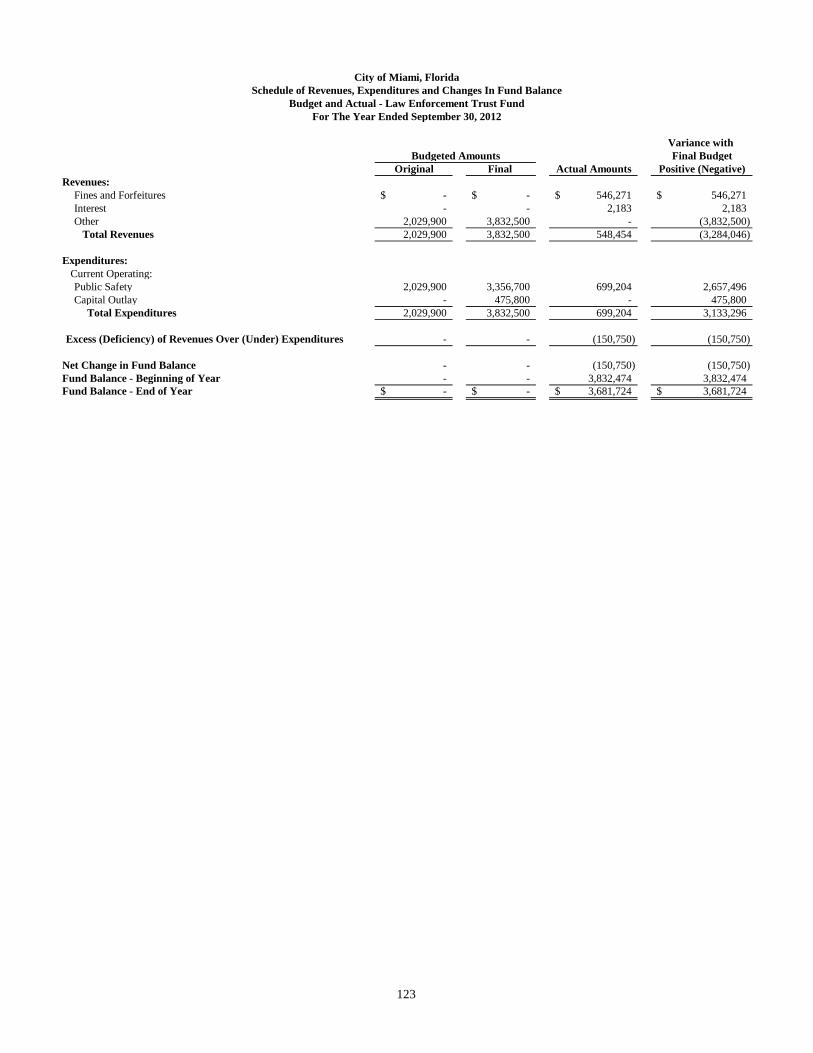
123
City of Miami, FloridaSchedule of Revenues, Expenditures and Changes In Fund Balance
Budget and Actual - Law Enforcement Trust FundFor The Year Ended September 30, 2012
Variance with Budgeted Amounts Final Budget
Original Final Actual Amounts Positive (Negative)Revenues:
Fines and Forfeitures -$ -$ 546,271$ 546,271$ Interest - - 2,183 2,183 Other 2,029,900 3,832,500 - (3,832,500)
Total Revenues 2,029,900 3,832,500 548,454 (3,284,046)
Expenditures:Current Operating:Public Safety 2,029,900 3,356,700 699,204 2,657,496 Capital Outlay - 475,800 - 475,800
Total Expenditures 2,029,900 3,832,500 699,204 3,133,296
Excess (Deficiency) of Revenues Over (Under) Expenditures - - (150,750) (150,750)
Net Change in Fund Balance - - (150,750) (150,750) Fund Balance - Beginning of Year - - 3,832,474 3,832,474 Fund Balance - End of Year -$ -$ 3,681,724$ 3,681,724$

124
City of Miami, FloridaSchedule of Revenues, Expenditures and Changes In Fund Balance
Budget and Actual - Public Works Services FundFor The Year Ended September 30, 2012
Variance with Budgeted Amounts Final Budget
Original Final Actual Amounts Positive (Negative)Revenues:
Charges for Services -$ -$ 295,997$ 295,997$ Interest - - 1,718 1,718 Other 1,111,600 2,575,200 - (2,575,200)
Total Revenues 1,111,600 2,575,200 297,715 (2,277,485)
Expenditures:Current Operating:Public Works 1,111,600 2,575,200 39,481 2,535,719
Total Expenditures 1,111,600 2,575,200 39,481 2,535,719
Excess (Deficiency) of Revenues Over (Under) Expenditures - - 258,234 258,234
Net Change in Fund Balance - - 258,234 258,234 Fund Balance - Beginning of Year - - 2,652,986 2,652,986 Fund Balance - End of Year -$ -$ 2,911,220$ 2,911,220$

125
City of Miami, FloridaSchedule of Revenues, Expenditures and Changes In Fund Balance
Budget and Actual - City Clerk Services FundFor The Year Ended September 30, 2012
Variance with Budgeted Amounts Final Budget
Original Final Actual Amounts Positive (Negative)Revenues:
Charges for Services 72,000$ 72,000$ 126,165$ 54,165$ Other 227,400 459,700 - (459,700)
Total Revenues 299,400 531,700 126,165 (405,535)
Expenditures:Current Operating:General Government 334,400 566,700 198,082 368,618
Total Expenditures 334,400 566,700 198,082 368,618
Excess (Deficiency) of Revenues Over (Under) Expenditures (35,000) (35,000) (71,917) (36,917)
Other Financing Sources:Transfers In 35,000 35,000 35,000 - Total Other Financing Sources 35,000 35,000 35,000 -
Net Change in Fund Balance - - (36,917) (36,917) Fund Balance - Beginning of Year - - 459,634 459,634 Fund Balance - End of Year -$ -$ 422,717$ 422,717$

126
City of Miami, FloridaSchedule of Revenues, Expenditures, and Changes In Fund Balance
Budget and Actual - Emergency ServicesFor The Year Ended September 30, 2012
Variance with Budgeted Amounts Final Budget
Original Final Actual Amounts Positive (Negative)Revenues:
Intergovernmental Revenues -$ -$ 4,755,458$ 4,755,458$ Total Revenues - - 4,755,458 4,755,458
Expenditures:Current Operating:Public Safety - - 100,268 (100,268)
Total Expenditures - - 100,268 (100,268)
Excess (Deficiency) of Revenues Over (Under) Expenditures - - 4,655,190 4,655,190
Other Financing Sources (Uses):Transfers Out - - (3,947,965) (3,947,965) Total Other Financing Sources (Uses) - - (3,947,965) (3,947,965)
Net Change in Fund Balance - - 707,225 707,225 Fund Balance - Beginning of Year - - 618,478 618,478 Fund Balance - End of Year -$ -$ 1,325,703$ 1,325,703$

127
City of Miami, FloridaSchedule of Revenues, Expenditures and Changes In Fund Balance
Budget and Actual - General Special RevenuesFor The Year Ended September 30, 2012
Variance with Budgeted Amounts Final Budget
Original Final Actual Amounts Positive (Negative)Revenues:
Intergovernmental Revenues -$ 1,471,600$ 5,419,357$ 3,947,757$ Other 6,169,400 - (6,169,400)
Total Revenues - 7,641,000 5,419,357 (2,221,643)
Expenditures:Current Operating:General Government - 4,995,800 3,141,632 1,854,168 Capital Outlay - 2,645,200 2,629,234 15,966
Total Expenditures - 7,641,000 5,770,866 1,870,134
Excess (Deficiency) of Revenues Over (Under) Expenditures - - (351,509) (351,509)
Other Financing Sources (Uses):Transfers In 9,506,250 9,506,300 - (9,506,300) Transfers Out (9,506,250) (9,506,300) - 9,506,300 Total Other Financing Sources (Uses) - - - -
Net Change in Fund Balance - - (351,509) (351,509) Fund Balance (Deficit) - Beginning of Year - - (1,045,344) (1,045,344) Fund Balance (Deficit) - End of Year -$ -$ (1,396,853)$ (1,396,853)$

128
City of Miami, FloridaSchedule of Revenues, Expenditures and Changes In Fund Balance
Budget and Actual - Miami Ballpark Parking FacilitiesFor The Year Ended September 30, 2012
Variance with Budgeted Amounts Final Budget
Original Final Actual Amounts Positive (Negative)Revenues:
Charges for Services -$ -$ 4,835,653$ 4,835,653$ Other - 4,999,800 - (4,999,800)
Total Revenues - 4,999,800 4,835,653 (164,147)
Expenditures:Current Operating:Public Facilities - 2,624,000 1,295,168 1,328,832
Total Expenditures - 2,624,000 1,295,168 1,328,832
Excess (Deficiency) of Revenues Over (Under) Expenditures - 2,375,800 3,540,485 1,164,685
Other Financing Sources (Uses):Transfers Out - 2,624,600 (2,624,600) (5,249,200) Total Other Financing Sources (Uses) - 2,624,600 (2,624,600) (5,249,200)
Net Change in Fund Balance - 5,000,400 915,885 (4,084,515) Fund Balance- Beginning of Year - - - - Fund Balance - End of Year -$ 5,000,400$ 915,885$ (4,084,515)$

129
City of Miami, FloridaSchedule of Revenues, Expenditures and Changes In Fund BalanceBudget and Actual - Departmental Improvement Initiatives Fund
For The Year Ended September 30, 2012
Variance with Budgeted Amounts Final Budget
Original Final Actual Amounts Positive (Negative)Revenues:
Licenses and Permits -$ -$ 2,795$ 2,795$ Fines and Forfeitures - - 160,263 160,263 Intergovernmental Revenues - 2,062,300 1,189,216 (873,084) Charges for Services - - 500 500 Interest - - 771 771 Other 438,200 926,300 15,000 (911,300)
Total Revenues 438,200 2,988,600 1,368,545 (1,620,055)
Expenditures:Current Operating:General Government 438,200 4,611,400 2,083,476 2,527,924 Capital Outlay - - 12,070 (12,070)
Total Expenditures 438,200 4,611,400 2,095,546 2,515,854
Excess (Deficiency) of Revenues Over (Under) Expenditures - (1,622,800) (727,001) 895,799
Other Financing Sources :Transfers In - 1,622,800 1,619,600 (3,200) Total Other Financing Sources - 1,622,800 1,619,600 (3,200)
Net Change in Fund Balance - - 892,599 892,599 Fund Balance - Beginning of Year - - 1,450,694 1,450,694 Fund Balance - End of Year -$ -$ 2,343,293$ 2,343,293$

130
City of Miami, FloridaSchedule of Revenues, Expenditures and Changes In Fund Balance
Budget and Actual - Transportation & Transit FundFor The Year Ended September 30, 2012
Variance with Budgeted Amounts Final Budget
Original Final Actual Amounts Positive (Negative)Revenues:
Intergovernmental Revenues 11,829,600$ 11,829,600$ 13,537,633$ 1,708,033$ Total Revenues 11,829,600 11,829,600 13,537,633 1,708,033
Expenditures:Current Operating:General Government 2,957,400 9,019,000 1,031,576 7,987,424 Capital Outlay 279,594 (279,594)
Total Expenditures 2,957,400 9,019,000 1,311,170 7,707,830
Excess (Deficiency) of Revenues Over (Under) Expenditures 8,872,200 2,810,600 12,226,463 9,415,863
Other Financing Sources (Uses): Transfers In - 6,594,000 6,593,994 - Transfers Out (8,872,200) (9,404,600) (9,404,600) - Total Other Financing Sources (Uses) (8,872,200) (2,810,600) (2,810,606) -
Net Change in Fund Balance - - 9,415,857 9,415,863 Fund Balance - Beginning of Year - - 6,327,463 6,327,463 Fund Balance - End of Year -$ -$ 15,743,320$ 15,743,326$

131
City of Miami, FloridaSchedule of Revenues, Expenditures and Changes In Fund Balance
Budget and Actual - Liberty City Revitalization TrustFor The Year Ended September 30, 2012
Variance with Budgeted Amounts Final Budget
Original Final Actual Amounts Positive (Negative)Revenues:
Intergovernmental Revenues 9,000$ 8,750$ 5,450$ (3,300)$ g Other 8,400 6,093 9,393 3,300
Total Revenues 17,400 14,843 14,843 -
Expenditures:Community Redevelopment Areas 617,650 148,710 148,708 2
Total Expenditures 617,650 148,710 148,708 2
Excess (Deficiency) of Revenues Over (Under) Expenditures (600,250) (133,867) (133,865) 2
Other Financing Sources:Sale of Property 115,000 - - - Total Other Financing Sources 115,000 - - -
Net Change in Fund Balance (485,250) (133,867) (133,865) 2 Fund Balance - Beginning of Year 485,250 473,459 473,459 - Fund Balance - End of Year -$ 339,592$ 339,594$ 2$

132
City of Miami, FloridaSchedule of Revenues, Expenditures and Changes In Fund Balance
Budget and Actual - Virginia Key Beach TrustFor The Year Ended September 30, 2012
Variance with Budgeted Amounts Final Budget
Original Final Actual Amounts Positive (Negative)Revenues:
Charges for Services 306,000$ 306,000$ 296,719$ (9,281)$ Other 75,000 75,000 71,613 (3,387)
Total Revenues 381,000 381,000 368,332 (12,668)
Expenditures:Current Operating:Parks and Recreation 381,000 381,000 413,427 (32,427)
Total Expenditures 381,000 381,000 413,427 (32,427)
Excess (Deficiency) of Revenues Over (Under) Expenditures - - (45,095) (45,095)
Net Change in Fund Balance - - (45,095) (45,095) Fund Balance (Deficit) - Beginning of Year 106,307 106,307 12,632 (93,675) Fund Balance (Deficit) - End of Year 106,307$ 106,307$ (32,463)$ (138,770)$

133
City of Miami, FloridaSchedule of Revenues, Expenditures and Changes In Fund Balance
Budget and Actual - General Obligation Bonds FundFor The Year Ended September 30, 2012
Variance with Budgeted Amounts Final Budget
Original Final Actual Amounts Positive (Negative)Revenues:
Property Taxes 28,999,600$ 28,999,600$ 26,887,032$ (2,112,568)$ Total Revenues 28,999,600 28,999,600 26,887,032 (2,112,568)
Expenditures:General Government 20,151 (20,151)
Debt Service:Principal 14,761,900 14,761,900 11,578,375 3,183,525 Interest and Other Charges 14,237,700 14,237,700 13,673,035 564,665 Total Expenditures 28,999,600 28,999,600 25,271,561 3,728,039
Excess (Deficiency) of Revenues Over (Under) Expenditures - - 1,615,471 1,615,471
Net Change in Fund Balance - - 1,615,471 1,615,471 Fund Balance (Deficit) - Beginning of Year - - 336,520 336,520 Fund Balance (Deficit) - End of Year -$ -$ 1,951,991$ 1,951,991$

134
City of Miami, FloridaSchedule of Revenues, Expenditures and Changes In Fund Balance
Budget and Actual - SEOPW CRA Other Special Obligation Bonds FundFor The Year Ended September 30, 2012
Variance with Budgeted Amounts Final Budget
Original Final Actual Amounts Positive (Negative)Revenues:
Intergovernmental Revenues -$ -$ 300,000$ 300,000$ Total Revenues - - 300,000 300,000
Expenditures:General Government - - 3,991 (3,991)
Debt Service:Principal 220,000 220,000 235,000 (15,000) Interest and Other Charges 131,300 131,300 109,437 21,863
Total Expenditures 351,300 351,300 348,428 2,872
Excess (Deficiency) of Revenues Over (Under) Expenditures (351,300) (351,300) (48,428) 302,872
Other Financing Sources:Transfers In 351,300 351,300 492,143 140,843 Total Other Financing Sources: 351,300 351,300 492,143 140,843
Net Change in Fund Balance - - 443,715 443,715 Fund Balance - Beginning of Year - - 782,269 782,269 Fund Balance - End of Year -$ -$ 1,225,984$ 1,225,984$

FIDUCIARY FUNDS
Fiduciary Funds are used to account for assets held by the City in a trustee capacity. Firefighters and Police Officers (FIPO) – This Pension Trust Fund is used to account for the accumulation of resources to be used for retirement benefits to Police and Firefighters. Resources are contributed by employees at rates fixed by law and by the City at amounts determined by annual actuarial valuations. General Employees and Sanitation Employees (GESE) – These Pension Trust Funds are used to account for the three separate GESE Plans (GESE Members, Excess Plan and Staff Plan). The funds are used to account for the accumulation of resources to be used for retirement benefits to City employees, other than police and firefighters. Resources are contributed by employees at rates fixed by law and by the City at amounts determined by annual actuarial valuations. City of Miami Elected Officers’ Retirement Trust (EORT) – Funds are used to account for the accumulation of resources to be used for retirement benefits to elected officials. Resources are contributed by the City in amounts determined by actuarial valuations.
135

136
City of Miami, FloridaCombining Statement of Fiduciary Net Assets
Fiduciary Funds
Employee Retirement Funds TotalsGeneral and General and General and Elected Officers' Employee
Firefighters and Sanitation Employees Sanitation Employees Sanitation Employees Retirement Trust RetirementPolice (FIPO) (GESE) (GESE Excess Plan) (GESE Staff Plan) (EORT) Funds
AssetsCash and Short-Term Investments 52,745,388$ 511,414$ 43,485$ 5,495$ 56,876$ 53,362,658$ Accounts Receivable 18,194,706 3,865,876 30,269 - - 22,090,851 Capital Assets 1,999,913 2,154,876 - - - 4,154,789
72,940,007 6,532,166 73,754 5,495 56,876 79,608,298
InvestmentsU.S. Government Obligations 244,692,323 84,084,551 - - - 328,776,874 Corporate Bonds 280,685,368 66,133,102 - 1,671,786 - 348,490,256 Corporate Stocks 449,370,529 358,899,769 - 885,580 - 809,155,878 Money Market Funds and Commercial Paper 29,831,876 - - 5,740,312 35,572,188 International Equity 222,966,793 - - - - 222,966,793 Mutual Funds - DROP 168,278,569 - - - - 168,278,569 Real Estate 125,109,383 25,096,325 - - - 150,205,708 Private Equity 43,900,769 - - - - 43,900,769
Total Investments 1,535,003,734 564,045,623 - 2,557,366 5,740,312 2,107,347,035
Securities Lending Collateral 276,817,344 - - - - 276,817,344 Total Assets 1,884,761,085 570,577,789 73,754 2,562,861 5,797,188 2,463,772,677
LiabilitiesObligations Under Security Lending 276,817,344 - - - - 276,817,344 Accounts Payable 608,290 733,373 73,754 1,030 - 1,416,447 Accrued Liabilities 168,278,569 3,769 - - - 168,282,338 Payable for Securities Purchased 13,735,005 3,643,116 - - - 17,378,121
Total Liabilities 459,439,208 4,380,258 73,754 1,030 - 463,894,250
Net AssetsHeld in Trust for Pension Benefits 1,425,321,877$ 566,197,531$ -$ 2,561,831$ 5,797,188$ 1,999,878,427$
September 30, 2012

137
City of Miami, FloridaCombining Statement of Changes in Fiduciary Net Assets
Fiduciary FundsFor the Year Ended September 30, 2012
Employee Retirement Funds TotalsGeneral and General and General and Elected Officers' Employee
Firefighters and Sanitation Employees Sanitation Employees Sanitation Employees Retirement Trust RetirementPolice (FIPO) (GESE) (GESE Excess Plan) (GESE Staff Plan) (EORT) Funds
AdditionsContributions:
Employer 45,122,295$ 25,784,849$ 514,907$ 226,793$ 566,372$ 72,215,216$ Plan Members 8,390,922 8,587,563 - 91,989 - 17,070,474
Total Contributions 53,513,217 34,372,412 514,907 318,782 566,372 89,285,690
Investment Earnings:Net Increase (Decrease) in Fair
Value of Investments 184,293,441 78,349,329 - 342,208 - 262,984,978 Interest 26,950,637 6,229,231 - - 85,182 33,265,050 Dividends 11,085,811 4,820,861 - 61,046 - 15,967,718 Other 261,065 108,029 - - - 369,094
Total Investment Earnings 222,590,954 89,507,450 - 403,254 85,182 312,586,840
Security Lending Activities:Security Lending Income 859,839 - - - - 859,839 Security Lending Fees and Rebates (214,836) - - - - (214,836) Unrealized Gain - - - - 54,366 54,366
Net Income From SecurityLending Activities 645,003 - - - 54,366 699,369
Less Investment Expenses 5,718,976 2,129,415 - - - 7,848,391 Net Investment Earnings 216,871,978 87,378,035 - 403,254 85,182 304,738,449
Reimbursement Income from City - 3,104,449 104,783 - - 3,209,232 Total 271,030,198 124,854,896 619,690 722,036 705,920 397,932,740
DeductionsBenefits/Payments 124,321,444 72,186,394 514,907 186,680 - 197,209,425 Refunds upon Resignation, Death, etc. 765,941 1,385,881 - 23,902 263,535 2,439,259 Distribution to Retirees 17,747,481 - - - - 17,747,481 Administrative and Other Expenses 42,726 3,178,449 104,783 - - 3,325,958
Total 142,877,592 76,750,724 619,690 210,582 263,535 220,722,123 Change in Net Assets 128,152,606 48,104,172 - 511,454 442,385 177,210,617 Net Assets - Beginning of Year 1,297,169,271 518,093,359 - 2,050,377 5,354,803 1,822,667,810 Net Assets - End of Year 1,425,321,877$ 566,197,531$ -$ 2,561,831$ 5,797,188$ 1,999,878,427$

138
Contents Page
Financial TrendsThese schedules contain trend information to help the reader understand how the City's financial performance and well-being have changed over time. 139
Revenue CapacityThese schedules contain information to help the reader assess the City's most significant local revenue source, the property tax. 144
Debt CapacityThese schedules present information to help the reader assess the affordability of the City's current levels of outstanding debt and the City's ability to issue additional debt in the future. 149
Demographic and Economic InformationThese schedules offer demographic and economic indicators to help the reader understand the environment within which the City's financial activities take place. 154
Operating InformationThese schedules contain service and infrastructure data to help the reader understand how the information in the City's financial report relates to the services the City provides and the activities it performs. 157
Sources: Unless otherwise noted, the information in these schedules is derived from the comprehensive annual financial reports for the relevant year.
STATISTICAL SECTION
This part of the City of Miami, Florida's comprehensive annual financial report presents detailed statistical information in order to provide the reader context in understanding what the information contained in the financial statements, note disclosures, and required supplementary information says about the City's overall financial health.

139
2003 2004 2005 2006 2007 2008 2009 2010 2011 2012Primary Government
Invested in Capital Assets, Net of Related Debt 618,784,135$ 586,493,178$ 608,958,407$ 640,931,069$ 730,272,844$ 773,959,639$ 791,005,790$ 752,506,507$ 693,247,304$ 657,451,573$
Restricted 114,327,395 149,143,544 153,641,905 188,895,278 102,602,464 147,706,831 77,576,635 88,296,965 95,873,418 90,077,677
Unrestricted (Deficit) (35,234,348) (64,134,990) (82,047,220) (98,069,477) (93,712,582) (211,485,639) (242,954,199) (306,024,093) (341,277,310) (332,017,000)
Total Primary Government Net Assets 697,877,182$ 671,501,732$ 680,553,092$ 731,756,870$ 739,162,726$ 710,180,831$ 625,628,226$ 534,779,379$ 447,843,412$ 415,512,250$
Notes:(1) The City does not have any business-type activities for financial reporting purposes.
CITY OF MIAMI, FLORIDANET ASSETS BY COMPONENT
LAST TEN FISCAL YEARS(ACCRUAL BASIS OF ACCOUNTING)

140
2003 2004 2005 2006 2007 2008 2009 2010 2011 2012ExpensesGovernmental Activities:
General Government 85,176,588$ 85,252,892$ 78,336,822$ 85,315,437$ 121,694,219$ 140,680,932$ 155,197,585$ 152,726,749$ 164,006,228$ 104,494,781$ Planning and Development 13,579,968 13,148,696 16,259,651 16,911,621 16,923,477 16,217,858 15,465,304 12,019,294 10,801,128 16,396,997 Community Development 32,088,517 40,349,703 55,264,647 41,054,245 35,486,773 42,029,139 37,126,171 39,654,938 40,851,610 38,099,612 Community Redevelopment Areas 6,477,916 4,618,714 4,968,422 6,331,328 7,011,132 13,904,297 20,565,676 29,288,203 4,695,820 17,040,767 Public Works 60,708,046 49,498,193 70,987,541 65,958,181 75,073,321 72,572,813 72,003,282 69,969,816 65,604,107 83,062,109 Public Safety 226,580,865 282,427,868 325,533,600 347,976,631 343,470,082 370,007,019 375,402,446 371,351,024 333,431,248 352,869,205 Public Facilities 10,561,373 17,458,726 12,949,751 14,917,431 16,691,365 15,354,423 13,179,074 16,848,482 11,242,062 16,330,343 Parks and Recreation 20,152,074 44,275,606 24,293,055 25,718,056 39,893,208 39,550,244 43,440,769 39,775,607 39,222,959 44,977,172 Interest on Long-Term Debt 19,489,387 23,235,705 22,201,669 21,560,094 23,859,254 27,206,895 36,091,032 27,532,637 43,336,330 37,425,666 Contribution to Port Tunnel - - - - - - - - 50,000,000 - Unallocated Depreciation 25,765,567 26,147,570 26,147,088 26,690,642 29,548,332 - - - - -
Total Primary Government Expenses 500,580,301 586,413,673 636,942,246 652,433,666 709,651,163 737,523,620 768,471,339 759,166,750 763,191,492 710,696,652
Program RevenuesGovernmental Activities:
Charges for Services:General Government 38,112,181 48,955,278 41,774,235 51,161,759 33,403,595 40,062,337 35,586,957 38,703,437 48,813,671 51,263,550 Planning and Development 12,192,540 14,352,919 23,964,447 22,799,725 24,558,217 13,076,692 9,611,336 9,719,151 13,124,742 15,327,935 Community Development 2,058,660 2,069,068 777,291 4,053,520 2,301,538 702,888 - 154,505 1,584,506 709,171 Community Redevelopment Areas 310,182 220,517 45,163 214,142 1,414,979 1,140,923 1,064,942 1,274,758 224,476 39,141 Public Works 39,697,353 42,608,182 47,278,720 51,888,525 46,587,956 48,488,699 47,792,238 46,479,565 49,349,451 41,533,411 Public Safety 48,061,754 48,507,121 47,488,375 39,193,653 22,952,364 16,577,772 17,785,328 22,152,448 15,996,730 23,321,360 Public Facilities 16,273,110 16,736,649 22,792,948 25,137,318 6,558,800 16,660,099 15,458,604 14,636,371 18,243,535 27,352,799 Parks and Recreation 2,446,385 3,308,314 1,901,403 2,406,099 3,488,492 4,106,702 4,827,158 6,247,234 6,223,804 7,183,856
Operating Grants and Contributions 34,441,899 42,967,708 59,414,862 34,889,443 71,070,882 63,179,016 64,645,980 73,139,270 94,339,110 88,366,485 Capital Grants and Contributions 9,646,560 19,952,074 38,161,382 72,067,622 69,140,730 54,174,136 33,964,265 27,113,487 21,824,134 29,302,530
Total Primary Government Program Revenues 203,240,624 239,677,830 283,598,826 303,811,806 281,477,553 258,169,264 230,736,808 239,620,226 269,724,159 284,400,238
Net (Expense)/RevenueTotal Primary Government Net Expense (297,339,677)$ (346,735,843)$ (353,343,420)$ (348,621,860)$ (428,173,610)$ (479,354,356)$ (537,734,531)$ (519,546,524)$ (493,467,333)$ (426,296,414)$
General Revenues and Other Changes in Net AssetsGovernmental Activities:
TaxesProperty Taxes, Levied for General Purposes 146,828,411$ 163,056,413$ 191,640,650$ 226,508,118$ 275,012,727$ 269,785,445$ 283,516,182$ 264,548,387$ 233,193,302$ 223,386,063$ Property Taxes, Levied for Debt Service 19,941,880 19,932,162 20,368,722 19,966,467 19,886,776 21,327,853 21,377,549 22,662,573 28,131,853 26,887,032 Franchise Taxes 31,556,387 35,024,215 35,918,724 41,342,214 42,257,282 42,298,452 42,823,572 43,120,713 44,881,126 44,649,826 State Revenue Sharing - Unrestricted 9,104,046 10,351,506 12,581,352 12,947,019 13,073,886 12,187,197 22,566,791 10,516,183 11,429,920 12,367,171 Sales and Other Use Tax 22,721,472 22,279,656 23,422,160 25,800,341 25,505,412 24,860,795 10,791,455 22,665,743 25,987,633 25,803,387 Public Service Taxes 58,900,480 60,025,832 61,114,292 57,991,178 58,099,069 62,257,072 64,010,537 61,966,455 59,426,883 58,045,986
Investment Earnings - Unrestricted 8,833,535 5,618,813 5,866,114 14,477,950 23,837,450 17,655,647 7,718,282 3,217,623 2,393,381 2,825,787 Gain (Loss) on Disposal of Capital Assets - - (3,387,124) 1,502,044 - - - - - Other 1,077,289 4,072,796 1,891,124 768,767 - - 377,558 - 1,087,268 - Special Item - Impairment Loss on Capital Assets (23,595,180) - - - - -
Total Primary Government 298,963,500 320,361,393 349,416,014 399,802,054 435,579,466 450,372,461 453,181,926 428,697,677 406,531,366 393,965,252
Change in Net AssetsTotal Primary Government 1,623,823$ (26,374,450)$ (3,927,406)$ 51,180,194$ 7,405,856$ (28,981,895)$ (84,552,605)$ (90,848,847)$ (86,935,967)$ (32,331,162)$
Notes:(1) The City does not have any business-type activities for financial reporting purposes.
CITY OF MIAMI, FLORIDACHANGES IN NET ASSETSLAST TEN FISCAL YEARS
(ACCRUAL BASIS OF ACCOUNTING)

141
CITY OF MIAMI, FLORIDAGOVERNMENTAL ACTIVITIES TAX REVENUES BY SOURCE
LAST FIVE FISCAL YEARS(ACCRUAL BASIS OF ACCOUNTING)
Ad Valorem Ad Valorem Sales CommunicationFiscal Taxes Taxes Franchise and Other ServiceYear General Purpose Debt Service Taxes Use Taxes Taxes Total2008 269,785,445$ 21,327,853$ 42,298,452$ 24,860,795$ 62,257,072$ 420,529,617$ 2009 283,516,182 21,377,549 42,823,572 22,566,791 64,010,537 434,294,631 2010 264,548,387 22,662,573 43,120,713 22,665,743 61,966,455 414,963,871 2011 233,193,302 28,131,853 44,881,126 25,987,633 59,426,883 391,620,797 2012 223,386,064 26,887,032 26,649,826 17,793,928 58,045,986 352,762,836

142
2010 2011 2012 (1)Fund Balances (Deficit):Non-Spendable Fund Balance
Non Spendable 3,807,847$ 4,897,155$ 8,140,534$ Spendable Fund Balance
Restricted 444,801,965 382,350,429 333,198,913 Committed 20,740,827 18,349,332 16,512,138 Assigned 16,230,193 18,908,221 52,161,359 Unassigned (19,468,939) (4,978,082) (9,323,713)
Total Fund Balances (Deficit) 466,111,893$ 419,527,055$ 400,689,231$
Notes:(1) Data not available prior to fiscal 2010 implementation of Governmental Accounting Standards Board Statement No. 54,
Basic Financial Statements and Management's Discussion and Analysis for State and Local Governments.
FUND BALANCES OF GOVERNMENTAL FUNDS
(MODIFIED ACCRUAL BASIS OF ACCOUNTING)
CITY OF MIAMI, FLORIDA
LAST THREE FISCAL YEARS

143
2008 2009 2010 2011 2012RevenuesProperty Taxes 291,113,299$ 304,893,731$ 287,210,960$ 261,325,154$ 250,273,095$ Franchise and Other Taxes 104,555,524 106,834,109 105,089,565 104,309,077 102,511,480 Licenses and Permits 29,844,868 26,105,211 25,348,038 34,030,742 35,725,571 Fines and Forfeitures 6,977,788 7,441,420 5,207,735 6,453,984 5,538,484 Intergovernmental Revenues 157,268,610 141,254,258 153,415,564 170,755,377 152,387,409 Charges for Services 86,386,721 85,926,635 88,420,225 94,710,889 106,715,608 Interest 17,655,770 7,718,282 3,217,854 2,393,382 2,825,787 Impact Fees 4,679,000 332,175 12,089 1,355,126 4,337,998 Other 10,102,809 10,757,077 9,105,815 10,102,466 14,933,656 Total Revenues 708,584,389 691,262,898 677,027,845 685,436,197 675,249,088
ExpendituresGeneral Government 77,127,072 78,888,172 68,278,497 67,930,182 66,093,488 Planning and Development 11,236,136 11,349,570 9,340,192 8,328,270 7,922,368 Community Development 41,036,697 36,413,108 39,157,777 40,432,177 36,706,327 Community Redevelopment Areas 15,946,941 20,144,229 29,084,137 4,394,953 22,040,767 Public Works 55,068,379 55,172,871 51,337,220 46,644,162 48,948,960 Public Safety 265,497,659 266,284,837 249,748,875 218,697,938 221,065,814 Public Facilities 13,019,718 11,660,410 12,555,541 9,802,765 12,708,442 Parks and Recreation 29,056,137 33,211,002 27,544,737 26,540,255 25,879,413 Contribution to Port Tunnel - - - 50,000,000 - Risk Management 28,796,859 13,107,068 22,354,729 26,546,382 48,659,416 Pensions 65,116,477 66,906,558 89,975,265 72,194,979 72,843,201 Organizational Support 27,751,691 41,314,516 32,218,742 30,523,550 - Debt Service:
Principal 21,343,143 23,566,021 27,261,275 29,492,004 22,934,190 Interest and Other Charges 28,920,735 31,928,202 38,064,683 39,647,545 41,185,461
Debt Issuance Costs - - - 2,048,181 - Capital Outlay 114,576,911 106,862,901 55,695,847 113,887,530 66,882,320 Total Expenditures 794,494,555 796,809,465 752,617,517 787,110,873 693,870,167 Excess (Deficiencies) of Revenues - Over (Under) Expenditures (85,910,166) (105,546,567) (75,589,672) (101,674,676) (18,621,079)
- Other Financing Sources (Uses)Transfers In 227,562,830 196,098,575 146,557,421 100,559,730 114,263,228 Transfers Out (227,562,830) (196,098,575) (146,557,421) (100,559,730) (114,263,228) Sale of Property - - - 1,087,268 - Proceeds Received From Refunding 133,098,930 - - 68,894,025 - Payment To Escrow Agent For Refunding - (32,366,235) - (68,571,500) - Proceeds Received From Long-Term Debt - 108,490,000 - 1,712,325 - Premium (Discount) Long-Term Debt 1,344,956 (793,980) - - - Issuance of Debt - - - 51,750,975 - Capital Leases - - (1,392,209) - - Sale of Capital Assets - - 166,370,000 - - Total Other Financing Sources 134,443,886 75,329,785 164,977,791 54,873,093 - Net Change In Fund Balances 48,533,720$ (30,216,782)$ 89,388,119$ (46,801,583)$ (18,621,079)$
Debt Service as a Percentage of Non-Capital Expenditures 7.71% 8.04% 9.37% 10.27% 10.23%
CITY OF MIAMI, FLORIDACHANGES IN FUND BALANCES OF GOVERNMENTAL FUNDS
LAST FIVE FISCAL YEARS(MODIFIED ACCRUAL BASIS OF ACCOUNTING)

144
(MODIFIED ACCRUAL BASIS OF ACCOUNTING)
Ad Valorem Ad Valorem Sales CommunicationFiscal Taxes Taxes Franchise and Other ServicesYear General Purpose Debt Service Taxes Use Taxes Taxes Total2008 269,785,445$ 21,327,853$ 42,298,452$ 24,860,795$ 62,257,072$ 420,529,617$ 2009 283,516,182 21,377,549 42,823,572 22,566,791 64,010,537 434,294,631 2010 264,548,387 22,662,573 43,120,713 22,665,743 61,966,455 414,963,871 2011 233,193,302 28,131,853 44,881,126 25,987,633 59,426,883 391,620,797 2012 223,386,063 26,887,032 44,649,826 25,803,387 58,045,986 378,772,294
CITY OF MIAMI, FLORIDAGENERAL GOVERNMENTAL TAX REVENUES BY SOURCE
LAST FIVE FISCAL YEARS

145
CITY OF MIAMI, FLORIDANET ASSESSED VALUE AND ESTIMATED ACTUAL VALUE OF TAXABLE PROPERTY
Net AssessedTotal Value as a
Fiscal Year Net Direct Estimated Percentage ofEnded Residential Commercial Personal Assessed Tax Actual Estimated Actual
September 30, Property Property Property Value Rate Value Value (1)2003 7,679,048,886$ 7,380,571,799$ 1,878,266,085$ 16,937,886,770$ 8.47 24,759,964,620$ 68.41%2004 8,789,474,779 8,369,950,851 1,711,697,688 18,871,123,318 8.50 27,717,908,682 68.08%2005 10,364,157,774 9,870,433,741 1,695,110,542 21,929,702,057 8.64 32,133,104,422 68.25%2006 12,959,276,770 12,341,927,389 1,676,173,129 26,977,377,288 8.33 39,120,899,711 68.96%2007 20,320,801,612 11,038,460,135 1,673,647,599 33,032,909,346 7.88 47,925,276,742 68.93%2008 24,279,025,389 11,727,240,945 1,749,572,760 37,755,839,094 9.00 55,249,891,635 68.34%2009 23,572,178,928 11,890,691,413 1,686,320,651 37,149,190,992 9.26 52,185,972,858 71.19%2010 23,341,894,079 11,921,087,043 1,686,540,244 36,949,521,366 9.26 52,146,883,603 70.86%2011 18,536,983,090 10,078,997,005 1,736,766,113 30,352,746,208 9.84 42,365,151,484 71.65%2012 19,106,566,634 10,336,397,326 1,890,870,077 31,333,834,037 10.07 43,557,261,093 71.94%
Source: Miami-Dade County Property Appraiser's Office.
Note: Property in the City is reassessed each year. State law requires the Property Appraiser to appraise property at 100% of market value.The Florida Constitution was amended, effective January 1, 1995, to limit annual increases in assessed value of property with homesteadexemption to 3 percent per year or the amount of the Consumer Price Index, whichever is lower. The increase is not automatic since noassessed value shall exceed market value. Tax rates are per $1,000 of assessed value.
(1) Includes tax-exempt property.
LAST TEN FISCAL YEARS
Real Property

146
Miami-Dade Miami-Dade South Florida Florida Total County Miami-Dade County Water Inland Direct and
Fiscal Tax Roll General Debt Total School Miami-Dade Children's Library Management Environmental Navigation OverlappingYear Year Operations Service City Board County Trust System District Projects District Rates2003 2002 8.8500 1.2180 10.0680 9.3520 6.2790 - 0.4860 0.5970 - 0.0385 26.8205 2004 2003 8.7625 1.0800 9.8425 9.2000 6.2540 0.5000 0.4860 0.5970 - 0.0385 26.9180 2005 2004 8.71625 0.9500 9.6663 8.6870 6.2200 0.4442 0.4860 0.5970 0.1000 0.0385 26.23895 2006 2005 8.49950 0.7650 9.2645 8.4380 6.1200 0.4288 0.4860 0.5970 0.1000 0.0385 25.47280 2007 2006 8.37450 0.6210 8.9955 8.1050 5.9000 0.4223 0.4860 0.5970 0.1000 0.0385 24.64430 2008 2007 7.29990 0.5776 7.8775 7.9480 4.8646 0.4223 0.3842 0.5346 0.0894 0.0345 22.15510 2009 2008 7.67400 0.6595 8.3335 7.9950 5.1229 0.5000 0.3822 0.5346 0.0894 0.0345 22.99210 2010 2009 7.67400 0.9701 8.6441 8.2490 5.8725 0.5000 0.2840 0.5346 0.0894 0.0345 24.20810 2011 2010 7.57100 0.9300 8.5010 8.0050 5.0900 0.5000 0.1795 0.3739 0.0624 0.0345 22.74630 2012 2011 7.57100 0.9000 8.4710 7.9980 4.9885 0.5000 0.1725 0.3676 0.0613 0.0345 22.59340
Sources: City of Miami, Florida Finance Department and Miami-Dade County Property Appraiser's Office.
Note: All millage rates are based on $1 for every $1,000 of assessed value.(1) Overlapping rates are those of local and county governments that apply to property owners within the City of Miami, Florida. Not all overlapping rates
apply to all City of Miami, Florida property owners (i.e. the rates for special districts apply only to the proportion of the government's property ownerswhose property is located within the geographic boundaries of the special district).
City of Miami, Florida Overlapping Rates (1)
CITY OF MIAMI, FLORIDAPROPERTY TAX RATES - DIRECT AND OVERLAPPING GOVERNMENTS
LAST TEN FISCAL YEARS
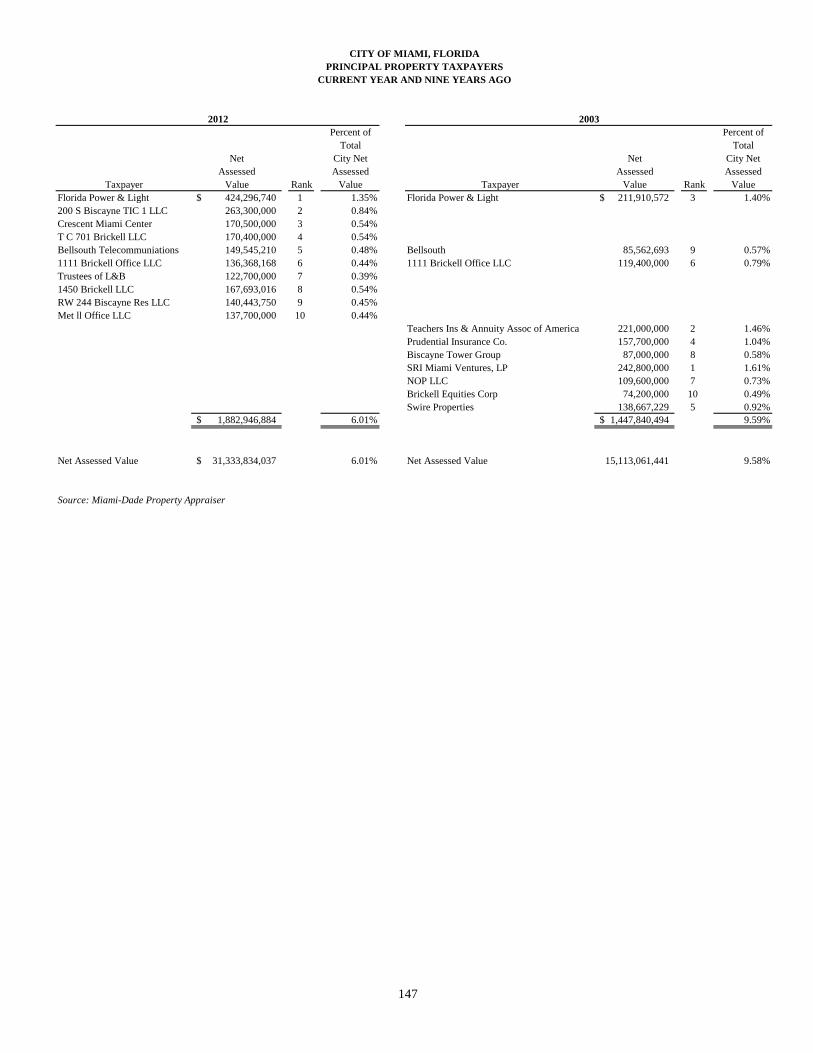
147
Percent of Percent ofTotal Total
Net City Net Net City NetAssessed Assessed Assessed Assessed
Taxpayer Value Rank Value Taxpayer Value Rank ValueFlorida Power & Light 424,296,740$ 1 1.35% Florida Power & Light 211,910,572$ 3 1.40%200 S Biscayne TIC 1 LLC 263,300,000 2 0.84%Crescent Miami Center 170,500,000 3 0.54%T C 701 Brickell LLC 170,400,000 4 0.54%Bellsouth Telecommuniations 149,545,210 5 0.48% Bellsouth 85,562,693 9 0.57%1111 Brickell Office LLC 136,368,168 6 0.44% 1111 Brickell Office LLC 119,400,000 6 0.79%Trustees of L&B 122,700,000 7 0.39%1450 Brickell LLC 167,693,016 8 0.54%RW 244 Biscayne Res LLC 140,443,750 9 0.45%Met ll Office LLC 137,700,000 10 0.44%
Teachers Ins & Annuity Assoc of America 221,000,000 2 1.46%Prudential Insurance Co. 157,700,000 4 1.04%Biscayne Tower Group 87,000,000 8 0.58%SRI Miami Ventures, LP 242,800,000 1 1.61%NOP LLC 109,600,000 7 0.73%Brickell Equities Corp 74,200,000 10 0.49%Swire Properties 138,667,229 5 0.92%
1,882,946,884$ 6.01% 1,447,840,494$ 9.59%
Net Assessed Value 31,333,834,037$ 6.01% Net Assessed Value 15,113,061,441 9.58%
Source: Miami-Dade Property Appraiser
2012 2003
CITY OF MIAMI, FLORIDAPRINCIPAL PROPERTY TAXPAYERS
CURRENT YEAR AND NINE YEARS AGO

148
CITY OF MIAMI, FLORIDAPROPERTY TAX LEVIES AND COLLECTIONS
LAST TEN FISCAL YEARS
Total TaxesFiscal Year Levied for Collections of
Ended Fiscal Percent Delinquent PercentSeptember 30, Year Amount of Levy Taxes Amount of Levy
2003 170,530,644$ 163,801,712$ 96.05% 1,474,980$ 165,276,692$ 96.92%2004 185,739,031 183,378,517 98.73% 3,123,437 186,501,954 100.41%2005 211,977,983 205,393,073 96.89% 2,698,741 208,091,814 98.17%2006 249,931,912 244,215,621 96.82% 2,121,712 246,337,333 98.56%2007 297,147,536 291,072,303 97.76% 3,178,849 294,251,152 99.03%2008 297,421,622 285,910,801 96.13% 5,202,498 291,113,299 97.88%2009 309,582,783 298,355,830 96.37% 7,537,901 305,893,731 98.81%2010 319,395,358 275,812,810 86.35% 11,398,150 287,210,960 89.92%2011 258,028,695 240,648,308 93.26% 20,676,849 261,325,157 101.28%2012 265,428,908 238,225,003 89.75% 12,048,092 250,273,095 94.29%
Note 1: The County Tax Collector does not allocate delinquent taxes collected by the original tax year levied. Consequently,all collections of delinquent taxes are applied to the immediately prior tax year and, as a result, the percentage for collectionsto date may exceed 100%.
Collected withinthe Fiscal Year
of the Levy to DateTotal Collections

149
Fiscal Year General Percent ofEnded Obligation Revenue Loans Capital Personal Per
September 30, Bonds Bonds Payable Leases Total Income (1) Capita (1)2003 236,549,956$ 151,566,324$ 28,230,764$ - 416,347,044$ 0.00% 1,042 2004 225,944,956 145,130,260 25,567,364 2,525,936 399,168,516 2.08% 999 2005 215,729,956 138,676,431 23,465,964 1,921,177 379,793,528 2.09% 951 2006 205,306,932 132,131,060 21,216,564 1,298,941 359,953,497 2.33% 993 2007 245,689,409 125,969,708 24,120,164 658,722 396,438,003 2.56% 1,094 2008 235,393,765 198,484,539 73,656,764 - 507,535,068 3.30% 1,400 2009 276,113,503 199,629,250 89,426,363 - 565,169,117 3.39% 1,559 2010 265,804,455 358,571,022 79,902,293 - 704,277,770 2.99% 1,943 2011 251,566,791 418,172,682 57,119,793 - 726,859,266 2.64% 2,005 2012 239,988,415 407,366,796 55,150,970 - 702,506,181 N/A 1,938
Notes: Details regarding the City's outstanding debt can be found in the notes to the financial statements.
(1) See the Schedule of Demographic and Economic Statistics on page 154 for personal income and population data.
N/A: Information not available
Governmental Activities
CITY OF MIAMI, FLORIDARATIOS OF OUTSTANDING DEBT BY TYPE
LAST TEN FISCAL YEARS

150
Percentage of Less Amounts Estimated Actual
Fiscal Year General Available in TaxableEnded Obligation Debt Service Value of Per
September 30, Bonds Fund Total Property (1) Capita (2)2003 236,549,956$ 1,410,866$ 235,139,090$ 0.540% 588.65$ 2004 225,944,956 966,126 224,978,830 0.531% 563.21 2005 215,729,956 1,512,591 214,217,365 0.411% 536.27 2006 205,306,932 1,994,991 203,311,941 0.390% 560.91 2007 245,689,409 2,304,217 243,385,192 0.441% 671.46 2008 235,393,765 2,138,512 233,255,253 0.487% 643.52 2009 276,113,503 1,496,363 274,617,140 0.702% 757.63 2010 265,804,455 (41,370) 265,845,825 0.827% 733.43 2011 251,566,791 336,520 251,230,271 0.906% 693.11 2012 239,988,415 1,951,991 238,036,424 0.961% 656.71
Note: Details regarding the City's outstanding debt can be found in the notes to the financial statements
(1) See the Schedule of Assessed Value and Estimated Actual Value of Taxable Property on page 145 for property value data.
(2) See the Schedule of Demographic and Economic Statistics on page 154 for population data.
CITY OF MIAMI, FLORIDARATIOS OF GENERAL BONDED DEBT OUTSTANDING
LAST TEN FISCAL YEARS

151
Percentage Amount Net Applicable to Applicable toDebt the City of the City of
Government Unit Outstanding Miami (1) Miami
Debt Repaid With Property Taxes:Miami-Dade County 1,025,042,100$ 19.00% 194,757,999$ Miami-Dade County School Board 186,140,000 19.00% 35,366,600
Subtotal, Overlapping Debt 230,124,599
City of Miami, Florida Direct Debt(excludes special obligation, revenue bonds, loans and capital leases) 238,036,424
Total Direct and Overlapping Debt 468,161,023$
Sources: Data provided by the Miami-Dade County Finance Department and the Miami-Dade County School Board.
Note:Overlapping governments are those that coincide, at least in part, with the geographic boundaries of the City.This schedule estimates the portion of the outstanding debt of those overlapping governments that is borne by theresidents and businesses of the City of Miami. This process recognizes that, when considering the City's ability toissue and repay long-term debt, the entire debt burden borne by the residents and businesses should be taken intoaccount. However, this does not imply that every taxpayer is a resident, and therefore responsible for repaying thedebt, of each overlapping government.
(1) For debt repaid with property taxes, the percentage of overlapping debt applicable is estimated using taxableassessed property values. Value that is within the City's boundaries and dividing it by the County's and School Board's total taxable assessed value. This approach was also used for the other debt.
CITY OF MIAMI, FLORIDADIRECT AND OVERLAPPING GOVERNMENTAL ACTIVITIES DEBT
AS OF SEPTEMBER 30, 2012

152
2003 2004 2005 2006 2007 2008 2009 2010 2011 2012Debt Limit 2,540,683,016$ 2,830,668,498$ 3,289,455,309$ 4,046,606,593$ 4,954,936,402$ 5,400,939,950$ 5,372,349,771$ 5,370,833,756$ 4,383,368,821$ 4,533,761,443$
Total Net Debt Applicable to Limit 236,549,956 224,978,830 214,217,365 203,311,941 243,385,192 233,255,253 274,617,140 265,845,825 251,230,271 238,036,424
Legal Debt Margin 2,304,133,060$ 2,605,689,668$ 3,075,237,944$ 3,843,294,652$ 4,711,551,210$ 5,167,684,697$ 5,097,732,631$ 5,104,987,931$ 4,132,138,550$ 4,295,725,019$
Total Net Debt Applicable to the 9.31% 7.95% 6.51% 5.02% 4.91% 4.32% 5.11% 4.95% 5.73% 5.25%Limit as a Percentage of Debt Limit
31,333,834,037$ Assessed Value (1,108,757,753) Less Homestead Exempt Valuation 30,225,076,284 Total Assessed Value
Debt Limit for Bonds 4,533,761,443 (15% of Total Assessed Value)Present Debt Application to Debt Limitation 239,988,415 General Obligation Debt (1,951,991) Less Amount Available in Debt Service Fund 238,036,424 Total Net Debt Applicable to Limit 4,295,725,019$ Legal Debt Margin
CITY OF MIAMI, FLORIDALEGAL DEBT MARGIN INFORMATION
LAST TEN FISCAL YEARS

153
CITY OF MIAMI, FLORIDAPLEDGED REVENUE COVERAGE
LAST TEN FISCAL YEARS
Fiscal YearEnded Ad-Valorem 2x Annual
September 30, Revenues (1) Principal Interest Debt Service Coverage (2)2003 250,581,519$ 7,809,464$ 13,997,817$ 43,614,562$ 5.75 2004 260,251,789 9,099,464 12,625,974 43,450,876 5.99 2005 261,901,194 8,555,229 12,491,326 42,093,110 6.22 2006 289,038,101 8,795,771 12,519,779 42,631,100 6.78 2007 294,252,080 10,514,753 14,627,989 50,285,484 5.85 2008 291,113,298 10,465,644 11,379,849 43,690,986 6.66 2009 304,893,731 10,335,262 12,228,340 45,127,204 6.76 2010 287,210,960 10,309,047 13,865,476 48,349,046 5.94 2011 261,325,154 14,237,664 13,782,766 56,040,860 4.66 2012 250,273,095 11,578,375 13,673,035 50,502,820 4.96
Note:(1) Ad valorem revenues shall mean all legally available revenues and taxes of the governmental unit
in the Funds (defined as the general fund, special revenue funds, the capital project funds,the special assessment funds, and the expandable trust fund(s)) derived from any source whatever other than ad valorem taxation on real and personal property, including appropriated fund balances in the funds and applicable operating transfers (in).Non-Ad Valorem Revenues are required to be two times greater than projected debt service.
(2) The Sunshine State Government Financing Loans require that available non-ad valorem revenues be two times the annual projected debt service for all debt other than general obligation debt of the City.
Debt Service

154
Personal Income(Amounts
Expressed in Personal Median School UnemploymentYear Population (1) Thousands) (2) Income (2) Age (1) Enrollment (3) Rate (4)2003 362,470 10,001,635 27,593 37 371,482 7.5%2004 362,470 10,539,178 29,076 37 369,578 5.7%2005 362,470 11,362,347 31,437 37 361,550 4.7%2006 362,470 12,219,589 33,712 37 365,784 3.4%2007 362,470 13,074,655 36,071 38 346,629 3.9%2008 362,470 13,007,961 35,887 38 344,806 6.1%2009 362,470 13,178,322 36,357 38 345,570 11.1%2010 399,457 14,738,365 36,896 38 345,458 11.1%2011 399,457 15,113,056 37,834 38 347,133 11.5%2012 399,457 N/A N/A 38 345,635 8.7%
Sources:(1) United States Census Bureau(2) Bureau of Economic Analysis, U.S. Department of Commerce(3) Miami-Dade County School Board Budget Office(4) Florida Agency for Workplace Innovation, Office of Workforce Information Services, Labor Market Statistics
N/A Information not available
CITY OF MIAMI, FLORIDADEMOGRAPHIC AND ECONOMIC STATISTICS
LAST TEN FISCAL YEARS

155
Percentage of Percentage ofTotal County Total County
Employer Employees Rank Employment Employees Rank EmploymentMiami-Dade County Public Schools 48,571 1 4.80% 45,886 1 4.47%Miami-Dade County 29,000 2 2.87% 32,000 2 3.12%U.S. Federal Government 19,500 3 1.93% - - 0.00%State of Florida 17,100 4 1.69% - - 0.00%University of Miami 16,000 5 1.58% - - 0.00%Baptist Health South Florida 13,376 6 1.32% 7,000 5 0.68%Public Health Trust/Jackson Memorial Hospit 12,571 7 1.24% 11,700 3 1.14%Publix Supermarkets 10,800 8 1.07% 4,000 10 0.39%American Airlines 9,000 9 0.89% 9,000 4 0.88%Florida International University 8,000 10 0.79% - - 0.00%Precision Response Corporation - - 0.00% 6,000 6 0.59%United Parcel Service - - 0.00% 5,000 7 0.49%BellSouth - - 0.00% 4,700 8 0.46%Carnival Cruise Lines - - 0.00% 4,000 9 0.39%Total 183,918 18.18% 129,286 12.61%
Source: The Beacon Council/U.S. Department of Labor - Bureau of Labor Statistics
2012 2003
CURRENT YEAR AND NINE YEARS AGO
CITY OF MIAMI, FLORIDAPRINCIPAL EMPLOYERS

156
2003 2004 2005 2006 2007 2008 2009 2010 2011 2012Number of Employees:
General Government 587 594 617 641 644 641 511 538 505 533 Planning and Development 140 138 147 141 142 128 123 102 96 111 Community Development 91 77 73 61 52 61 55 54 60 43 Public Works 498 497 505 542 526 525 521 436 442 442 Public Safety 2,248 2,140 2,138 2,222 2,288 2,310 2,390 2,368 2,283 2,282 Public Facilities 33 43 45 55 56 54 41 41 41 41 Parks and Recreation 141 148 188 190 191 207 265 186 182 178
Total Number of Employees 3,738 3,637 3,713 3,852 3,899 3,926 3,906 3,725 3,609 3,630
Source: City of Miami, Budget Department
CITY OF MIAMI, FLORIDAFULL-TIME EQUIVALENT CITY GOVERNMENT EMPLOYEES BY FUNCTION
LAST TEN FISCAL YEARS

157
Function/Program 2003 2004 2005 2006 2007 2008 2009 2010 2011 2012Community Development:
Entitlements/Grants Received 35,569,042$ 32,351,101$ 37,191,063$ 30,816,293$ 29,943,482$ 30,267,482$ 26,275,445$ 37,815,004$ 33,490,572$ 24,364,465$
Public Safety:Police:
Part 1 Crimes - (1) 33,527 30,966 29,455 26,219 27,302 27,907 25,761 26,097 27,045 28,070 Part 1 Arrests - (1) 6,729 6,662 5,728 4,359 4,635 4,741 4,536 4,393 4,295 4,166 Part 2 Arrests - (2) 26,786 38,467 33,385 33,408 32,738 31,211 32,826 26,670 22,269 25,155
Fire:Number of Fire Calls 15,571 17,889 19,017 12,694 14,472 18,191 10,411 14,493 16,686 15,122 Number of EMS Calls 62,784 64,500 67,300 70,423 72,757 69,870 73,017 76,747 81,638 79,279 Number of Alarms 78,355 82,389 86,318 83,117 87,227 88,061 88,847 91,240 98,324 94,401
Planning and Development:Certificate of Use Permits Issued 20,625 20,422 21,123 21,142 22,000 21,482 22,724 20,156 20,775 20,907 Occupational Licenses Issued 39,040 39,422 40,371 34,197 42,000 22,498 22,092 29,548 22,478 23,117
Culture and Recreation:Summer Food Program - Meals Served (Lunches) 124,701 122,749 89,324 55,126 104,472 N/A N/A 58,785 92,737 98,129 Summer Food Program - Meals Served (Snacks) 146,786 115,837 100,870 61,000 114,670 N/A N/A 62,983 87,963 106,449
Solid Waste:Refuse Collected (Tons/Day) 768 793 578 713 629 717 N/A 566 551 586 Recyclables Collected (Tons/Day) 24 21 72 10 13 16 N/A 11 14 14
Sources: Various City DepartmentsNote: Indicators are not available for the general government function.
(1) Part 1 crimes and arrests include murder, rape, robbery, aggravated assault, burglary, larceny, and motor vehicle theft.(2) Part 2 arrests include all other arrests that are not Part 1 crimes.N/AInformation not available.
CITY OF MIAMI, FLORIDAOPERATING INDICATORS BY FUNCTION
LAST TEN FISCAL YEARS

158
Function/Program 2003 2004 2005 2006 2007 2008 2009 2010 2011 2012Public Safety:
Police:Police Stations 1 1 1 1 1 1 1 1 1 1 Police Sub-Stations 2 2 2 2 2 3 3 3 3 3
Fire:Fire Stations 12 12 14 14 14 14 14 14 14 14
Solid Waste:Collection Trucks 172 176 152 151 175 181 N/A 160 160 144
Public Works:Streets (Miles- Paved) 658.9 658.9 660.0 667.4 662.2 662.2 662.1 662.1 662.1 662.1 Streets (Miles - Unpaved) 1.4 1.4 1.4 3.1 1.2 N/A 1.12 1.12 1.12 1.12
Transportation:Street Resurfacing (Miles) 25.0 33.5 33.5 17.9 23.3 21.6 N/A 15.8 18.3 23.65
Culture and Recreation:Parks Acreage 800 800 800 800 894 894 894 894 894 897 Parks 110 111 111 112 112 112 112 112 112 127 Swimming Pools 10 10 10 12 11 11 15 15 15 15 Tennis Courts 53 53 53 53 55 55 61 61 61 61 Community Centers 30 31 30 32 32 32 34 34 34 34 Basketball Courts 63 63 61 63 63 63 71 71 71 71 Water Playgrounds - 1 1 1 2 2 2 2 2 3 Soccer Fields 6 7 7 7 11 11 13 13 13 13 Football Fields 12 12 12 12 10 10 9 9 9 9 Baseball Fields 25 25 21 25 27 27 30 30 30 30 Open Practice Fields - - - - 2 2 2 2 2 2 Cricket Field - - - - 1 1 1 1 1 1
Sources: Various City DepartmentsNote: No capital asset indicators are available for the general government function.N/AInformation not available.
LAST TEN FISCAL YEARSCAPITAL ASSET STATISTICS BY FUNCTION/PROGRAM
CITY OF MIAMI, FLORIDA


![INT-1 - 2020-cover [PBC] (CAFR FY20 - City of Ypsilanti](https://img.pdfslide.net/doc/110x75/623e34a71d15680aba1ba0df/int-1-2020-cover-pbc-cafr-fy20-city-of-ypsilanti-.jpg)