Embed Size (px)
Citation preview


City of Tucson, ArizonaComprehensive Annual Financial Report
Fiscal Year Ended June 30, 2005
Prepared by: The Department of Finance,Accounting Division


Introductory Section

INTRODUCTORY SECTION
Letter of Transmittal vCity of Tucson Officials ixCity of Tucson Organizational Chart xCertificate of Achievement for Excellence in Financial Reporting xi
FINANCIAL SECTION
Independent Auditors' Report 1Management's Discussion and Analysis (Required Supplementary Information) 3
Basic Financial Statements:Government-wide Financial Statements:
Statement of Net Assets 17Statement of Activities 18
Fund Financial Statements:Governmental Funds:
Balance Sheet 20Reconciliation of the Balance Sheet for Governmental Funds to the Statement of Net Assets 21Statement of Revenues, Expenditures, and Changes in Fund Balances - Governmental Funds 22Reconciliation of the Statement of Revenues, Expenditures, and Changes in Fund Balances - Governmental Funds 23
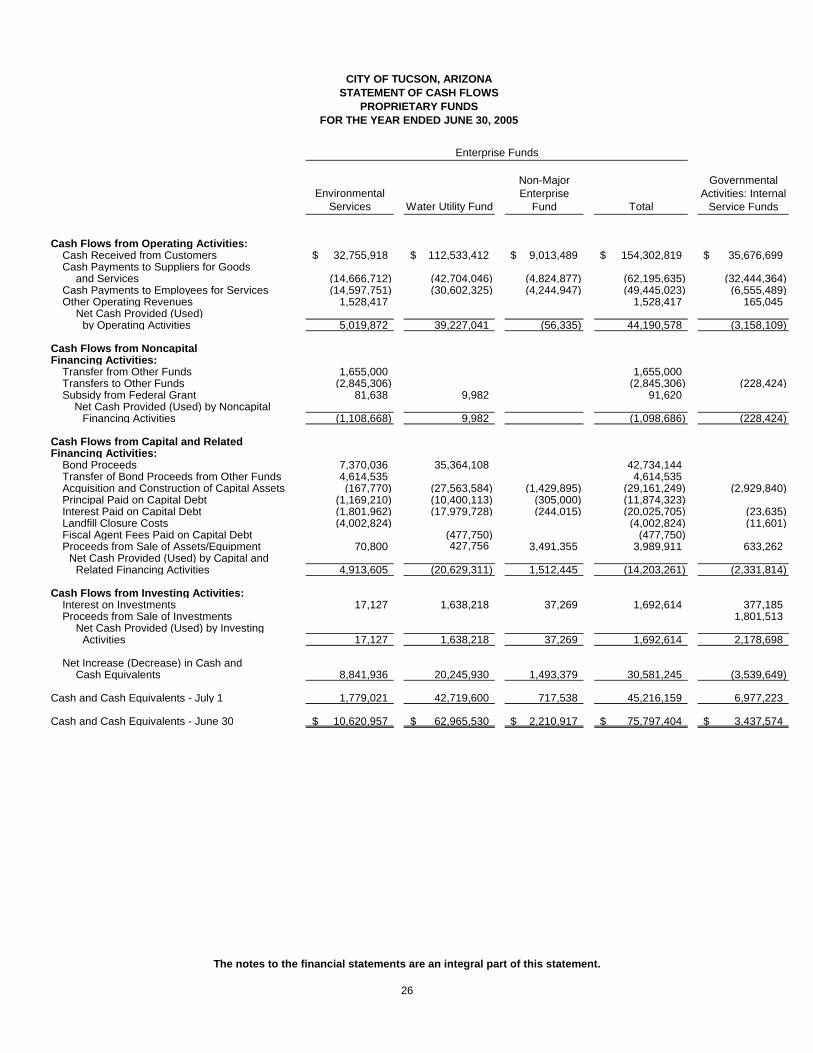
Proprietary Funds:Statement of Net Assets 24Statement of Revenues, Expenses, and Changes in Fund Net Assets 25Statement of Cash Flows 26
Fiduciary Funds:Statement of Fiduciary Net Assets 28Statement of Changes in Fiduciary Net Assets 29
Notes to Basic Financial Statements
Note 1 - Summary of Significant Accounting Policies 31Note 2 - Accounting Restatements 40Note 3 - Property Tax 41Note 4 - Individual Fund Disclosures 42Note 5 - Deposits and Investments 42Note 6 - Interfund Balances and Transfers 52Note 7 - Capital Assets 54Note 8 - Changes in Long-term Debt 55Note 9 - Lease Obligations 57Note 10 - Contracts Payable 58Note 11 - Bond Issues 58Note 12 - Advance Refunding/Defeasance of Debt 62Note 13 - Landfills 63Note 14 - Deferred Compensation Plan 64Note 15 - Single Employer and Agent Multiple-Employer Retirement Systems 64Note 16 - Self Insurance Program 68Note 17 - Post-Retirement Health Care and Life Insurance Benefits 68Note 18 - Contingencies and Commitments 69Note 19 - Significant Discretely Presented Component Unit Transactions 70
CITY OF TUCSON, ARIZONAComprehensive Annual Financial Report
Table of ContentsFor the Year Ended June 30, 2005
Page
i

REQUIRED SUPPLEMENTARY INFORMATION
Schedule of Revenues, Expenditures, and Changes in Fund Balance Original Budget, Final Budget and Actual - Major Funds:
General Fund 71Note to Required Supplementary Information 72
COMBINING STATEMENTS AND INDIVIDUAL FUND STATEMENTS AND SCHEDULES
Combining Statements:Nonmajor Funds:
Balance Sheets 73Statements of Revenues, Expenditures, and Changes in Fund Balances 84
Internal Service Funds:Statement of Net Assets 95Statement of Revenues, Expenses, and Changes in Fund Net Assets 96Statement of Cash Flows 97
Fiduciary Funds:Statement of Fiduciary Net Assets - All Pension Trust Funds 98Statement of Changes in Fiduciary Net Assets - All Pension Trust Funds 99Statement of Fiduciary Assets and Liabilities - All Agency Funds 100
Schedule of Revenues, Expenditures, and Changes in Fund Balance Budget and Actual - Nonmajor Governmental Funds:
Library Fund 102Public Safety Academy Fund 103TEAM/Parkwise 103Convention Center Fund 104H.U.R.F. Fund 105Civic Contribution Fund 105Human and Community Development Fund 106Development Fee Fund 107Miscellaneous Housing Grant Funds 107Public Housing Fund 108Public Housing HOME Program Fund 109Other Federal Grants Fund 109Non-Federal Grants Fund 110Mass Transit Fund 111Special Assessment Bond and Interest Debt Service Fund 112General Obligation Bond and Interest Debt Service Fund 113Street and Highway Bond and Interest Debt Service Fund 113Special Assessments Construction Fund 1162000 Street and Highway Improvement Bond Capital Project Funds 1171994 Street and Highway Improvement Bond Capital Project Funds 1172000 General Obligation Bond Capital Project Funds 1181994 General Obligation Bond Capital Project Funds 1191984 General Obligation Bond Capital Project Funds 119
Schedule of Income - Budget and Actual - Enterprise Funds:Environmental Services Fund 121Golf Course Fund 122Water Utility Fund 123
Revenues, Expenses and Flow of Funds Per Ordinance No. 6347 - Water Utility Fund 124
ii
Page
For the Year Ended June 30, 2005
Comprehensive Annual Financial ReportTable of Contents
CITY OF TUCSON, ARIZONA

(Continued)Table
STATISTICAL SECTION (UNAUDITED)
General Governmental Expenditures by Function I 127General Revenues by Source II 128Property Tax Levies and Collections III 129Assessed and Estimated Actual Value of Taxable Property IV 130Property Tax Rates - Direct and Overlapping Per $100 Assessed Valuation V 131Principal Taxpayers VI 132Special Assessment Collections VII 133Legal Debt Margin VIII 134Ratio of Net General Bonded Debt to Assessed Value and Net Bonded Debt Per Capita IX 135Property Tax Requirements for General Debt Service X 136Ratio of Annual Debt Service Expenditures for General Bonded Debt to Total General Expenditures XI 137Computation of Direct and Overlapping Debt XII 138Schedule of Water Revenue Bond Coverage XIII 139Demographic Statistics XIV 140Building Permits, Bank Deposits and Retail Sales XV 141Miscellaneous Statistics XVI 142
GLOSSARY 143
iii
Page
CITY OF TUCSON, ARIZONAComprehensive Annual Financial Report
Table of ContentsFor the Year Ended June 30, 2005

CITY HALL • 255 W. ALAMEDA • PO BOX 27210 • TUCSON, AZ 85726-7210(520) 791-4893 • FAX (520) 791-4941 • TTY (520) 791-2639
www.cityoftucson.org
v
CITY OFTUCSONFINANCE DEPARTMENTADMINISTRATION
December 7, 2005
Citizens of City of Tucson andHonorable Mayor and CouncilCity of Tucson, Arizona:
Formal Transmittal
I am pleased to submit the Comprehensive Annual Financial Report (CAFR) forthe City of Tucson, Arizona (City) for the fiscal year ended June 30, 2005, asrequired by Chapter XXIX of the City Charter. The CAFR was prepared by theCity’s Accounting Division in accordance with accounting principles generallyaccepted in the United States of America.
Responsibility for both the accuracy of the data and the completeness and fairnessof the presentation, including all disclosures, rests with the City’s management.To provide a reasonable basis for making these representations, the City hasestablished a comprehensive internal control framework that is designed both toprotect the government’s assets from loss, theft, or misuse and to providereasonable rather than absolute assurance that the financial statements will be freeof material misstatement. To the best of our knowledge and belief, the encloseddata are accurate in all material respects and are reported in a manner designed topresent fairly the financial position and results of operations of the various fundsand component units of the City. All disclosures necessary to enable the reader togain an understanding of the City's financial activities have been included.
The City Charter requires an annual independent audit. The City engagedHeinfeld, Meech, and Company, P.C. to express an opinion on the financialstatements based on their audit. The goal of the independent audit was to providereasonable assurance that the financial statements are free of materialmisstatement. The audit includes examining, on a test basis, evidence supportingthe amounts and disclosures in the financial statements, assessing the accountingprinciples used and significant estimates made by management, and evaluatingthe overall financial statement presentation. The independent auditor’s report ispresented as the first component of the financial section of this report. Heinfeld,Meech, and Company, P.C. also audited the City’s federal financial assistanceprogram, complying with the provisions of the Single Audit Act and U.S. Officeof Management and Budget Circular A-133, Audits of States, Local Governments,and Non-Profit Organizations.
The CAFR is presented in three sections: introductory, financial, and statistical.The introductory section includes a list of principal officials, the City'sorganizational chart and this transmittal letter. The financial section includes theindependent auditor’s report, the management’s discussion and analysis (MD&A),

vi
the basic financial statements that include financial statements on a government-wide and fundbasis, required supplementary information, and combining statements and individual fundstatements and schedules. The statistical section includes selected financial and demographicinformation, generally presented on a multi-year basis. This transmittal letter is designed tocomplement the MD&A and should be read in conjunction with it.
Government Profile
The history of life in the Tucson valley goes back more than 300 years with its founding as amission site. As the second largest city in the State of Arizona, the City of Tucson wasincorporated on February 7, 1887, under the provisions of Article 13, Sections 1 through 6 of theConstitution of Arizona and Title 9 of the Arizona Revised Statutes. The City operates under aCouncil-Manager form of government. All funds and entities related to the City are controlledby the Mayor and Council and are included in the basic financial statements. These funds andentities provide a full range of services including General Government, Police, Fire,Environmental Services, Transportation, Library, Parks and Recreation, Golf, and Water.
A component unit is a separate legal entity that is included in the reporting entity due to thesignificance of its financial or operational relationships with the City. The Rio NuevoMultipurpose Facilities District is presented separately from the City in the basic financialstatements. Additional information concerning the City’s component units is provided in thenotes to the basic financial statements.
Tucson, like all cities in the State of Arizona, is subject to numerous budget and related legalrequirements. Article IX, Section 20(1) of the Arizona Constitution sets out limits on the City’slegal budget capacity. In general, the Mayor and Council cannot authorize expenditures of localrevenues in excess of the expenditure limitation determined annually by the State of Arizona’sEconomic Estimates Commission. This limitation is based on the City’s actual expendituresincurred during 1979-80 adjusted to reflect subsequent inflation and population growth.
ARS 42-17106 requires that no expenditure be made for a purpose not included in the adoptedbudget. The City of Tucson defines “purpose” as a series of departments organized into thefollowing six program categories: Elected and Official, Neighborhood Services, Environmentand Development, Strategic Initiatives, Support Services, and Non-departmental. The Directorof Budget and Research and the City Manager approves changes with purpose categories andMayor and Council approves changes between purposes.
Chapter XIII, Sections 3 and 4 of the Tucson Charter require that on or before the first Mondayin May, the City Manager submit to the Mayor and Council an estimate of the revenues requiredfor the next fiscal year, and that on or before the first Monday in June, the City Manager submithis recommended budget for the fiscal year beginning July 1. Beginning July 1 of each fiscalyear, the adopted budget is implemented, monitored, and changed within the limits of the law, asnecessary. The Budget and Research and Finance Departments are charged with thisresponsibility.
Assessing Economic Condition
The Arizona economy continues to grow at a measured pace. This growth has been driven inpart by a large population growth. This has also been true for Arizona’s two largest metropolitanareas, Phoenix and Tucson. Figure 1 illustrates the population growth for Tucson Metropolitanarea as compared to the Phoenix Metropolitan area. For Tucson, this population growth has ledto above average job growth in the construction, education and health services and the retail

vii
trade. Along with the job growth, personal income has also continued to increase. Next year,this growth rate will continue although at a more sustainable rate. Figures 2 through 4 provideTucson and Phoenix Metropolitan area comparisons for retail sales, unemployment, and percapita personnel trends.
FIGURE 1 FIGURE 2
FIGURE 3 FIGURE 4
The improvement in the economy and the population increases have resulted in significant taxrevenue gains for the State of Arizona. However, the City’s share of state revenues will havemixed results, beginning in fiscal year 2007, due to mid-decade census update. This includes aprojected 17% increase for urban revenue sharing (individual and corporate income tax),minimal change in state shared sales taxes and a 1.3% projected decrease in Highway UserRevenue Funds. The 2003 legislative changes made it possible for jurisdictions to update theirpopulation estimates. The concern is that the City of Tucson is growing at a slower rate relativeto other Arizona cities since State revenue sharing is based on population. The City’s share isexpected to drop from 12% to 11%. This is a major impetus to continue with our revenuediversification strategies.
PO PULATIO N GRO WTH( In Tho us and s )
3,886
3,501
3,3893,2943,196
956907891878861
-
500
1,000
1,500
2,000
2,500
3,000
3,500
4,000
4,500
2001 2002 2003 2004 2005
Y e a r
Phoenix Metro Tucson Metro
AGGREGATE RETAIL SALES( In Tho us a nd s )
39,386 38,275 40,030
44,933
50,089
8,921 8,702 8,998 9,975 10,777
-
10,000
20,000
30,000
40,000
50,000
60,000
2001 2002 2003 2004 2005
Y e a r
Phoenix Metro Tucson Metro
UNEMPLO YMENT RATE
3.8%4.0%
5.2%5.4%
3.7%
4.1%
3.7%
4.5%4.8%
3.1%
0.0%
1.0%
2.0%
3.0%
4.0%
5.0%
6.0%
2001 2002 2003 2004 2005
Y e a rPhoenix Metro Tucson Metro
PERSO NAL INCO MEP e r C a p it a
31,84030,22428,86828,16027,886
27,599
26,25224,92825,03624,324
-
5,000
10,000
15,000
20,000
25,000
30,000
35,000
2001 2002 2003 2004 2005
Y e a rPhoenix Metro Tucson Metro


Financial Section


Managem
ent’s Discussion and Analysis

CITY OF TUCSON, ARIZONAMANAGEMENT’S DISCUSSION AND ANALYSIS
For the Year Ended June 30, 2005
3
This section of the City’s annual financial report presents discussion and analysis of the City’s financialperformance during the fiscal year that ended on June 30, 2005. Please read it in conjunction with the transmittalletter at the front of the report and the City’s financial statements, which immediately follow this section. The MD&Aincludes a description of the basic financial statements for government, condensed financial information along withanalyses of balances and financial position, descriptions of significant asset and debt activity, discussions ofbudgetary matters and significant issues affecting financial position.
FINANCIAL HIGHLIGHTS
Government-wide
• The assets of the City exceeded its liabilities by $1.68 billion (reported as net assets), an increase of $27.3million from last year. Governmental activities had a $11.1 million increase in net assets, while business-typeactivities had a $16.2 increase.
Fund Level
• The City’s governmental funds reported a combined fund balance of $172.6 million, an increase of $22.4 millionfrom last fiscal year. Within the combined fund balance total, $48.7 million is unreserved, while $123.8 millionis reserved for specific purposes. A significant portion of the unreserved fund balance ($15.3 million) originatesfrom one of the City’s special revenue funds, Highway User Revenue Fund (H.U.R.F.). The ArizonaConstitution requires that H.U.R.F. funds be used solely for highway and street purposes.
• The General Fund reported a fund balance of $98.1 million, which represents a $24.7 million increase from lastyear. The unreserved/undesignated balance is $28.3 million. This represents 7.5% of total general fundexpenditures for the fiscal year.
• On a current financial resource basis, revenues raised during the year were $2.0 million less than budgeted forthe General Fund, while expenditures were $30.4 million less than budgeted.
OVERVIEW OF FINANCIAL STATEMENTS
This annual report consists of a series of financial statements. The Statement of Net Assets and the Statement ofActivities provide information about the activities of the City as a whole (government-wide financial statements) andpresent a longer-term view of the City’s finances. For governmental activities, these statements tell how serviceswere financed in the short term as well as what remains for future spending. Fund financial statements also reportthe City’s operations in more detail than the government-wide financial statements by providing information aboutthe City’s most significant funds. The remaining statements provide financial information about activities for whichthe City acts solely as a trustee or agent for the benefit of those outside the government.
Basic Financial Statements
The basic financial statements present two types of statements that reflect different views of the City. The first twostatements represent the government-wide financial statements, and they provide short and long-term informationabout the City’s overall financial status. The fund financial statements provide a short-term view of the City’soperations at a more detailed level.
The financial statements also include notes that explain some of the information in the financial statements andprovide more detailed data. Additionally, the statements are followed by a section of Required SupplementaryInformation that provides a major fund budgetary analysis. The Combining and Individual Fund Schedules showcombining statements for nonmajor governmental funds and internal service funds, along with budget to actualcomparisons on individual funds.

CITY OF TUCSON, ARIZONAMANAGEMENT’S DISCUSSION AND ANALYSIS
For the Year Ended June 30, 2005
4
Figure A below summarizes the structure and contents of the financial statements:
Figure AMajor Features of the City’s Government-wide and Fund Financial Statements
Fund Financial StatementsGovernmental Proprietary FiduciaryGovernment-wide
Statements Funds Funds Funds
Scope Entire Citygovernment (exceptfiduciary funds)
The activities of theCity that are notproprietary orfiduciary
Activities the Cityoperates similar toprivate businesses
Instances inwhich the City isthe trustee oragent forsomeone else’sresources, suchas the retirementplan for Cityemployees
Required financialstatements
Statement of NetAssets
Statement ofActivities
Balance Sheet
Statement ofRevenues,Expenditures andChanges in FundBalances
Statement of NetAssets
Statement ofRevenues,Expenses, andChanges in NetAssets
Statement of CashFlows
Statement ofFiduciary NetAssets
Statement ofChanges inFiduciary NetAssets
Accounting basis andmeasurement focus
Accrual accountingand economicresources focus
Modified accrualaccounting andcurrent financialresources focus
Accrual accountingand economicresources focus
Accrualaccounting andeconomicresources focus
Type of asset/liabilityinformation
All assets andliabilities, bothfinancial andcapital, and short-term and long-term
Only assetsexpected to beused up andliabilities that comedue during the yearor soon thereafter;no capital assets orlong-term debtincluded
All assets andliabilities, bothfinancial andcapital, and short-term and long-term
All assets andliabilities, bothfinancial andcapital, and short-term and long-term
Type of inflow/outflowinformation
All revenues andexpenses duringthe year, regardlessof when cash isreceived or paid
Revenues for whichcash is receivedduring or soon afterthe end of the year;expenditures whengoods or serviceshave been receivedand payment dueduring the year orsoon thereafter
All revenues andexpenses duringthe year, regardlessof when cash isreceived or paid
All revenues andexpenses duringthe year,regardless ofwhen cash isreceived or paid

CITY OF TUCSON, ARIZONAMANAGEMENT’S DISCUSSION AND ANALYSIS
For the Year Ended June 30, 2005
5
Government-wide Financial Statements
The government-wide financial statements report information about the City as a whole using accounting methodssimilar to those used by private-sector companies. The Statement of Net Assets (pg 17) includes all of thegovernment’s assets and liabilities. All of the current year’s revenues and expenses are accounted for in theStatement of Activities (pg 18) regardless of when cash is received or paid. These two statements report the City’snet assets and how they have changed. Net assets, the difference between the City’s assets and liabilities, is oneway to measure financial health, or position. Increasing net assets show improvement in position, while decreasingnet assets indicate deterioration. To assess the overall health of the City, additional non-financial factors, such aschanges in bond ratings, changes in the City’s property tax base, projected business privilege tax collection trends,and the condition of the City’s infrastructure, should be considered.
Two activities exist in the government-wide financial statements. The first activity, governmental, represents mostof the City’s basic services such as police, fire, transportation or parks. Business privilege taxes, property taxes,state revenue sharing, and grants finance most of these activities. The second activity, business-type, representsthose areas in which the City charges fees to customers to help cover the costs of certain services it provides. TheCity’s enterprise funds, Tucson Water Utility, Environmental Services Utility, and Golf Course, are consideredbusiness-type activities.
Fund Financial Statements
The fund financial statements provide more detailed information about the City’s funds by focusing on the mostsignificant or “major” funds rather than the City as a whole. Funds are accounting entities that the City uses to trackspecific funding sources and expenditures/expenses for particular programs. Some funds are required by State lawor by bond covenants, while Mayor and Council set up other funds for management purposes.
There are three types of fund financial statements: governmental, proprietary, and fiduciary. As described below,the governmental fund statements use a different accounting approach from the proprietary and fiduciarystatements.
• Governmental fund statements disclose how general government services, such as police and parks andrecreation, were financed in the short-term as well as what remains for future expenditures. These funds arereported using the modified accrual basis of accounting, which measures cash and all other financial assetsthat can readily be converted to cash. Consequently, the governmental funds statements provide a detailedshort-term view that helps determine whether there are more or fewer financial resources that can be spent inthe near future to finance the City’s programs. The relationship (or differences) between governmentalactivities, reported in the government-wide financial statements, and governmental funds is provided in areconciliation following the respective fund financial statements. Reconciling items include: converting fundcapital expenditures to capital assets, reducing long-term debt by debt service principal expenditures, andincreasing long-term debt by bond/lease proceeds.
• Proprietary fund statements contain funds from fees charged to customers for services provided by the City andare reported in the same manner as the government-wide financial statements. Because both types ofstatements utilize the full accrual basis of accounting, the total enterprise column on the Statement of NetAssets and the Statement of Changes in Net Assets provides the same, but more detailed, financial informationas the business-type activity columns in the government-wide financial statements. In addition, a Statement ofCash Flows is provided. Internal service funds are combined into a single column on these statements, andthey are reported as part of governmental activities in the government-wide financial statements.
• Fiduciary fund statements represent funds for which the City acts as a trustee, and like the proprietary funds,they also use the full accrual basis of accounting. The City is responsible for ensuring that the assets reportedin these funds are used for their intended purposes. These activities are excluded from the City’s government-wide financial statements because the City cannot use these assets to finance its operations.

CITY OF TUCSON, ARIZONAMANAGEMENT’S DISCUSSION AND ANALYSIS
For the Year Ended June 30, 2005
6
FINANCIAL ANALYSIS OF THE CITY AS A WHOLE
The combined net assets for the primary government increased 1.65% over the course of the year to $1.68 billion.Governmental activities contributed to 40.6% of this increase, while business-type activities contributed 59.4%. Asshown in Table B-1 below, the largest component of net assets represents the City’s investment in capital assets(i.e., land, buildings, equipment and infrastructure), net of accumulated depreciation and related debt. The secondlargest component of net assets represents restricted net assets, the use of which is restricted by external sourcessuch as debt covenants, enabling legislation or grant stipulations. The final component of net assets isunrestricted. The City has a deficit balance in Business Type Activities primarily due to incurring liabilities, such ascompensated absences, and environmental and solid waste mandates, with no corresponding assets.
Restated Restated Restated2005 2004 2005 2004 2005 2004
Current and Other Assets $ 320,277,323 $ 295,033,729 $ 117,201,523 $ 86,717,704 $ 437,478,846 $ 381,751,433 Capital Assets 1,460,774,434 1,404,163,300 975,556,549 956,550,916 2,436,330,983 2,360,714,216
Total Assets 1,781,051,757 1,699,197,029 1,092,758,072 1,043,268,620 2,873,809,829 2,742,465,649Current and Other Liabilities 156,289,297 142,458,055 49,232,621 51,446,452 205,521,918 193,904,507 Long-term Debt Outstanding 525,592,968 468,651,196 467,662,108 432,176,047 993,255,076 900,827,243
Total Liabilities 681,882,265 611,109,251 516,894,729 483,622,499 1,198,776,994 1,094,731,750Net Assets:
Invested in Capital Assets, Net of Related Debt 998,221,324 998,966,917 594,423,874 576,958,002 1,592,645,198 1,575,924,919
Restricted 82,813,522 69,416,688 9,013,682 2,670,658 91,827,204 72,087,346 Unrestricted (Deficit) 18,134,646 19,704,173 (27,574,213) (19,982,539) (9,439,567) (278,366)
Total net assets $ 1,099,169,492 $ 1,088,087,778 $ 575,863,343 $ 559,646,121 $ 1,675,032,835 $ 1,647,733,899
Table B-1City of Tucson
Statement of Net Assets
Activities Activities GovernmentGovernmental Business-type Total Primary

CITY OF TUCSON, ARIZONAMANAGEMENT’S DISCUSSION AND ANALYSIS
For the Year Ended June 30, 2005
7
Table B-2, below, shows condensed financial information derived from the government-wide Statement of Activities(pg 18) and reflects how the City’s net assets changed during the course of the fiscal year:
2005 2004 2005 2004 2005 2004RevenuesProgram Revenues:
Charges for Services $ 93,414,087 86,991,199 $ 155,834,538 $ 124,071,913 $ 249,248,625 $ 211,063,112 Operating Grants and Contributions 127,785,107 96,836,225 127,785,107 96,836,225 Capital Grants and Contributions 26,158,108 74,014,269 15,396,024 11,889,083 41,554,132 85,903,352
Total Program Revenues 247,357,302 257,841,693 171,230,562 135,960,996 418,587,864 393,802,689 General Revenues:
Taxes:Property Taxes 30,203,848 27,329,989 30,203,848 27,329,989 Business Privilege Taxes 183,102,463 177,117,183 183,102,463 177,117,183 Public Utility Taxes 7,654,851 7,887,631 7,654,851 7,887,631 Transient Occupancy Taxes 10,768,492 9,145,965 10,768,492 9,145,965 Occupational Taxes 2,098,216 2,049,759 2,098,216 2,049,759 Liquor Taxes 740,742 713,674 740,742 713,674
Unrestricted Grants and Contributions 114,662,691 106,317,054 114,662,691 106,317,054 Investment Income (Loss) 2,605,029 1,037,894 2,902,021 705,809 5,507,050 1,743,703 Miscellaneous 7,100,302 5,782,790 7,100,302 5,782,790
Total General Revenues 358,936,634 337,381,939 2,902,021 705,809 361,838,655 338,087,748Total Revenues 606,293,936 595,223,632 174,132,583 136,666,805 780,426,519 731,890,437
ExpensesElected and Official 15,418,836 15,724,295 15,418,836 15,724,295 Support Services 58,587,923 42,465,015 58,587,923 42,465,015 Neighborhood Services 337,049,181 295,870,113 337,049,181 295,870,113 Environment and Development 131,039,748 149,983,180 131,039,748 149,983,180 Strategic Initiatives 14,039,464 13,359,186 14,039,464 13,359,186 Non-Departmental 12,788,223 10,439,491 12,788,223 10,439,491 Interest on Long-term Debt 22,270,724 23,701,247 22,270,724 23,701,247 Fiscal Agent and Other 46,301 32,158 46,301 32,158 Environmental Services 39,464,082 - 39,464,082 - Golf 10,064,093 9,323,864 10,064,093 9,323,864 Water 112,359,007 104,427,551 112,359,007 104,427,551
Total Expenses 591,240,400 551,574,685 161,887,182 113,751,415 753,127,582 665,326,100
Changes in Net Assets before transfers 15,053,536 43,648,947 12,245,401 22,915,390 27,298,937 66,564,337Transfers (3,971,822) 3,971,822 - - Changes in Net Assets $ 11,081,714 $ 43,648,947 $ 16,217,223 $ 22,915,390 $ 27,298,937 $ 66,564,337
Table B-2City of Tucson
Change in Net Assets
Governmental Business-type Total PrimaryActivities Activities Government

CITY OF TUCSON, ARIZONAMANAGEMENT’S DISCUSSION AND ANALYSIS
For the Year Ended June 30, 2005
8
Governmental Activities
Total expenses for governmental activities for Fiscal year 2005 were $591.2 million. Program revenues, includingcharges for services and restricted grants or contributions, covered 41.8% of these costs. General revenuescovered the remaining 58.2% of governmental costs. Components of general revenues primarily include businessprivilege taxes, unrestricted grants and contributions, property taxes and investment earnings.
Operating Grants and Contributions increased 32% from fiscal year 2004. The Community Block DevelopmentGrant drew $2.3 million dollars less in fiscal year 2005 based on entitlement monies awarded to the differentagencies. Capital Grants and Contributions decreased 64.7% from fiscal year 2004. The Mass Transit Fund had a$3.0 million dollar decrease due to the completion of the Downtown Intermodel Center. The MiscellaneousHousing Grant Fund decreased $3.1 million due to the Robert Kennedy Home Revitalization, the South ParkScattered Homes, the South Park Hope IV Streets, and the South Park Wellness Center having expenditures infiscal year 2004 and not in fiscal year 2005.
The following chart depicts both program and general revenues generated by governmental activities for fiscal year2005:
Governmental Activities-Revenue Sources For the Fiscal Year Ended June 30, 2005
Investment Earnings & Miscellaneous
2%
Charges for Services16%
Operating Grants & Contributions
21%
Capital Grants & Contributions
4%
Property Taxes5%
Grants & Contributions Unrestricted
19%
Other Taxes4%
Business Privilege Taxes29%

CITY OF TUCSON, ARIZONAMANAGEMENT’S DISCUSSION AND ANALYSIS
For the Year Ended June 30, 2005
9
Net expenses, program revenues less expenses, generated from governmental activities are presented by functionin Table B-3 below to illustrate how much support each function receives from the City’s general revenues:
Neighborhood Services represents a significant portion (70%) of the total net expense for governmental activities.The following chart illustrates the departmental composition of net expense for Neighborhood Services:
Function Net Exp/Rev Percentage Net Expense PercentageElected and Official $ (14,637,970) 4% $ (15,261,077) 5%Support Services (26,827,590) 8% (24,593,142) 8%Neighborhood Services (239,181,212) 70% (193,915,623) 66%Environment and Development (23,548,521) 7% (37,793,063) 13%Strategic Initiatives (10,542,681) 3% (10,246,430) 3%Non-Departmental (6,828,099) 2% 11,809,748 -4%Interest on Long-term Debt (22,270,724) 6% (23,701,247) 8%Fiscal Agent Fees and Other (46,301) 0% (32,158) 0% Total Net Expense $ (343,883,098) 100% $ (293,732,992) 100%
2005 2004
Table B-3City of Tucson
Net Expense/Revenue -Governmental Activities
Neighborhood Services-Net Expenses/Revenues by DepartmentFor Fiscal Year ended June 30, 2005
Police 49%
Fire 22%
Parks and Recreation15%
Other9%
Library 5%

CITY OF TUCSON, ARIZONAMANAGEMENT’S DISCUSSION AND ANALYSIS
For the Year Ended June 30, 2005
10
Police, Fire, Parks and Recreation, and Library are major governmental activities within the Neighborhood Servicesfunction that are being funded by City general revenues.
Business-type Activities
The Water Utility Fund, the Environmental Service Fund, and the Golf Course Fund are the City’s business-typeactivities. The Water Utility Fund and the Environmental Service Fund are major funds for the City and have amajor impact on the change in net assets for this activity.
On July 1, 2005 Mayor and Council approved a residential refuse collection fee and the Environmental ServicesFund was restated from a Special Revenue Fund (Governmental) to an Enterprise Fund (Business-type). The netassets for business-type activities increased by $16.2 million during the fiscal year.
Environmental Revenues
• Total program revenues increased in fiscal year 2005. Due to the new residential refuse fee there was a $18million dollar increase in charges for services. New residential fees range from $14 to $34 per residence,depending on the number and size of the refuse containers.
Environmental Expenses
• Total operating expenses increased $10 million dollars. An increase in labor cost due to cost of living, merits,and increased hours worked explains $1.9 million. Fleet service charges and equipment purchases account foranother $1.6 million. Due to the change from a governmental fund to an enterprise fund with it’s owndepreciable assets, Environmental Services had $7.3 million in depreciation expense.
Water Revenues
• Total program revenues decreased in fiscal year 2005. In fiscal year 2004 operating revenue was $114.5million and in fiscal year 2005 it is $111.3. This decrease is due to a reclassification of a revenue account. Infiscal year 2004 the System Equity Fee was recorded under Charges for Services, while in fiscal year 2005 ithas been moved to Capital Contribution in non-operating revenues.
Water Expenses
• Total operating expenses increased in fiscal year 2005. The increase in expenses is due partly to an increasein labor cost of $3.2 million (cost of living and merit increases) and $2 million maintenance and enhancementsof existing water systems.
FINANCIAL ANALYSIS OF THE CITY’S FUNDS
The City had one major governmental fund in fiscal year 2005, the General Fund. General Fund expendituresincreased 19.3% from last fiscal year.
Revenues in the General Fund increased 10.4%. This includes increase in miscellaneous fees for DevelopmentServices, Parks and Recreation, and City Courts. The unreserved portion of fund balance increase is primarily dueto the conversion of the Environmental Services fund to a self-supporting business-type activity. This allowed$18.4 reserved for environmental mandates to increase the unreserved fund balance.

CITY OF TUCSON, ARIZONAMANAGEMENT’S DISCUSSION AND ANALYSIS
For the Year Ended June 30, 2005
11
General Fund Revenues
• Business privilege taxes increased $2.3 million and Property taxes increased $4.5 million, each a majorrevenue source for the City. The growth in these revenue sources from the prior fiscal year shows an upturn inthe economy.
• A new local use tax from last fiscal year increased $1.6 million dollars. This taxes major purchase madeoutside the Tucson City limits.
• Beginning in fiscal year 2005, Parks and Transportation billable charges automatically creates AccountsReceivable and Revenue once the expenditure hits. The timely accounting of these revenues explains this$2.9 million dollar increase.
• In fiscal year 2005 Facilities Management, Communications, Architecture and Engineering began chargingother departments for services performed. This resulted in a new revenue source for the General Fund. Forthe fiscal year the revenue generated by charging other funds was $15 million dollars.
• On July 6, 2005, Pima County acted to preserve the A-7 Ranch (a.k.a. Bellotta Ranch) by purchasing it fromthe City for $1.9 million dollars.
• A $28.9 dollar increase in Other Financing Sources is largely due to the issuance of Certificates of Participationfor the lease purchase of certain real property and improvements thereto. Specifically the Pennington Garage,the Police Substation, and the Train Depot.
General Fund Expenditures
• General Fund expenditures increased $60.8 million dollars. Personal Services represents the majority of theincrease. This is due to the City covering the rising pension and employee health cost. Cost of living and meritincreases were also given in fiscal year 2005.
General Fund Budgetary Highlights
The City’s annual budget is the legally adopted expenditure control document of the City. The budgetarycomparison schedule for the General Fund (pg 71) shows the original budget, the final budget, and actual revenuesand expenditures for the fiscal year.
The variance between the budgeted amounts for total revenues is $2.0 million.
• The negative variance of $8.8 million for Other Agencies revenues is due to a $4.8 million underestimate ofrevenues from the State for auto lieu tax, sales tax, and income tax. The economy did better than anticipatedso actual revenues were higher than budgeted. Transportation’s adopted budget included $5.0 million ofrevenue that was not available to spend in fiscal year 2005 because the actual costs were incurred in fiscalyear 2004. Delays in project expenditures created an $8.6 million variance because intergovernmentalagreements could not be billed.
• Charges for Services had a positive variance of $12.3 million. The largest portion of this variance ($15.2million) is due to the difference of budget treatment and accounting for Facilities Management,Communications, Architecture and Engineering. In the budget the expenditures and revenues net to zero andno revenue is budgeted for these departments.
CITY OF TUCSON, ARIZONAMANAGEMENT’S DISCUSSION AND ANALYSIS
For the Year Ended June 30, 2005
12
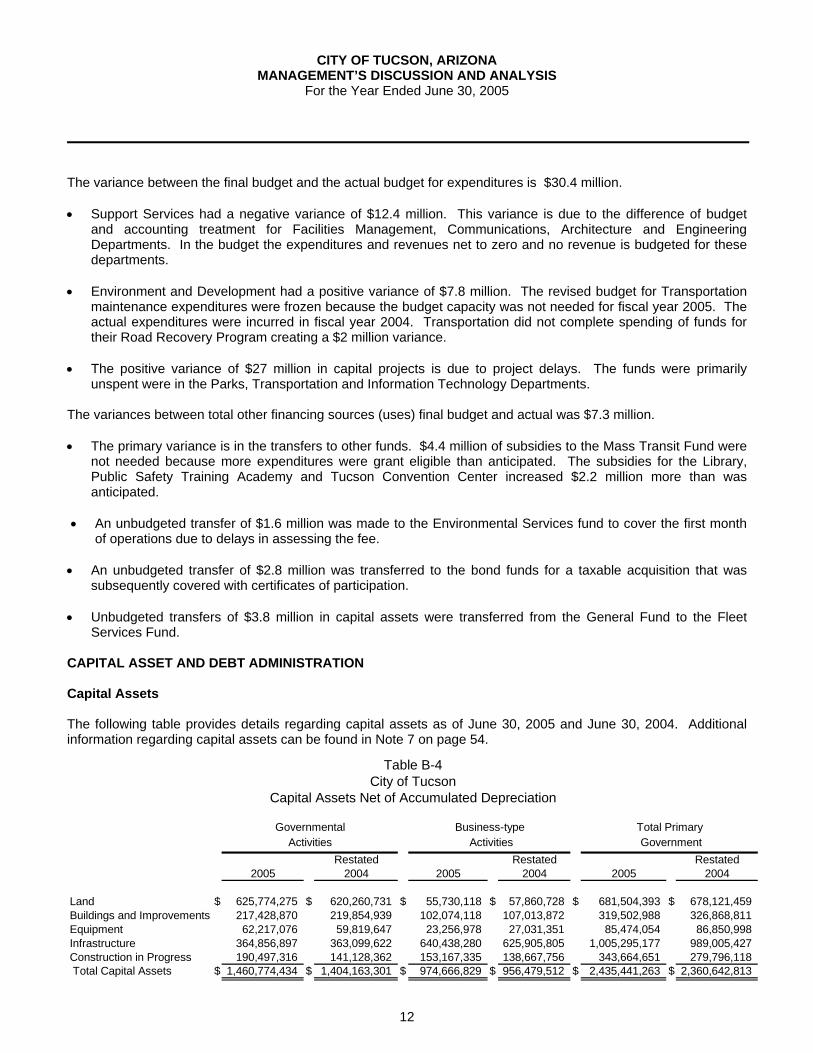
The variance between the final budget and the actual budget for expenditures is $30.4 million.
• Support Services had a negative variance of $12.4 million. This variance is due to the difference of budgetand accounting treatment for Facilities Management, Communications, Architecture and EngineeringDepartments. In the budget the expenditures and revenues net to zero and no revenue is budgeted for thesedepartments.
• Environment and Development had a positive variance of $7.8 million. The revised budget for Transportationmaintenance expenditures were frozen because the budget capacity was not needed for fiscal year 2005. Theactual expenditures were incurred in fiscal year 2004. Transportation did not complete spending of funds fortheir Road Recovery Program creating a $2 million variance.
• The positive variance of $27 million in capital projects is due to project delays. The funds were primarilyunspent were in the Parks, Transportation and Information Technology Departments.
The variances between total other financing sources (uses) final budget and actual was $7.3 million.
• The primary variance is in the transfers to other funds. $4.4 million of subsidies to the Mass Transit Fund werenot needed because more expenditures were grant eligible than anticipated. The subsidies for the Library,Public Safety Training Academy and Tucson Convention Center increased $2.2 million more than wasanticipated.
• An unbudgeted transfer of $1.6 million was made to the Environmental Services fund to cover the first monthof operations due to delays in assessing the fee.
• An unbudgeted transfer of $2.8 million was transferred to the bond funds for a taxable acquisition that wassubsequently covered with certificates of participation.
• Unbudgeted transfers of $3.8 million in capital assets were transferred from the General Fund to the FleetServices Fund.
CAPITAL ASSET AND DEBT ADMINISTRATION
Capital Assets
The following table provides details regarding capital assets as of June 30, 2005 and June 30, 2004. Additionalinformation regarding capital assets can be found in Note 7 on page 54.
Restated Restated Restated2005 2004 2005 2004 2005 2004
Land $ 625,774,275 $ 620,260,731 $ 55,730,118 $ 57,860,728 $ 681,504,393 $ 678,121,459Buildings and Improvements 217,428,870 219,854,939 102,074,118 107,013,872 319,502,988 326,868,811Equipment 62,217,076 59,819,647 23,256,978 27,031,351 85,474,054 86,850,998Infrastructure 364,856,897 363,099,622 640,438,280 625,905,805 1,005,295,177 989,005,427Construction in Progress 190,497,316 141,128,362 153,167,335 138,667,756 343,664,651 279,796,118 Total Capital Assets $ 1,460,774,434 $ 1,404,163,301 $ 974,666,829 $ 956,479,512 $ 2,435,441,263 $ 2,360,642,813
Activities Activities Government
Table B-4City of Tucson
Capital Assets Net of Accumulated Depreciation
Governmental Business-type Total Primary

CITY OF TUCSON, ARIZONAMANAGEMENT’S DISCUSSION AND ANALYSIS
For the Year Ended June 30, 2005
13
Governmental Activities
Significant capital asset additions for governmental activities for the fiscal year include:
• Additions in public infrastructure improvements totaled $17.5 million. Infrastructure improvements includestreets, sidewalks, street lighting, traffic signals and drainage. Additions to land include a $6.3 million increaseto right-of-way.
• $9.4 million was spent in fiscal year 2005 for the construction of the Pennington Street Garage. The 750-spacegarage is a solar-powered and fully automated 24-hour facility and will open in fiscal year 2006.
• The Fire Department spent $2.5 million on a new station, Fire Station 21, that will open in 2006.
• A helicopter, ambulances, and other equipment were purchased in fiscal year 2005 through capital leases inthe amount of $1.64 million. $3.9 million of capital lease proceeds was used to purchase vehicles for FleetServices. Twenty-seven buses were purchased this year for $2.3 million.
• A new web based financial software system was added in fiscal year 2005 for $1.95 million.
• Other significant capital projects that were capitalized (expenditures may be in previous years) in fiscal year2005 include the Santa Rosa Center upgrade for $2.45 million and the Jacobs Park Pool replacement for $1.4million.
Business-type Activities
Business-type activities had a net increase of $18.2 million in capital assets during the fiscal year; most of thisincrease originates from the water utility. Tucson Water has a five-year capital program, which provides for theconstruction, expansion, and replacement of both potable and reclaimed water systems. During the fiscal year,$14.5 million of the net increase in capital assets was incurred in the distribution and collection systems.
At the conversion of Environmental Services from a governmental fund to an Enterprise (Business-type), on July 1,2005, the beginning balance for the Governmental and Business Type capital assets, net of depreciation has beenrestated. The total restated amount from the conversion was $33.1 million.

CITY OF TUCSON, ARIZONAMANAGEMENT’S DISCUSSION AND ANALYSIS
For the Year Ended June 30, 2005
14
Long-term Debt
The following table illustrates the City’s long-term debt as of June 30, 2005 and June 30, 2004. Additionalinformation regarding long-term debt can be found in Notes 8 through 12 starting on page 55.
As shown in Table B-5, outstanding debt for the City totaled $1 billion with 54.4% attributed to governmentalactivities and the remaining 45.6% attributed to business-type activities. The following information describessignificant changes in long-term debt for the fiscal year:
• In governmental activities, the City issued $17.9 million in general obligation bonds and $6 million in street andhighway user revenue bonds during fiscal year 2005. The general obligation bonds will fund improvements forparks, libraries, street lighting, sidewalks, drainage facilities, and public safety. The street and highway userrevenue bonds will be used to improve, construct, and maintain City streets.
• In business-type activities, the Water Infrastructure Finance Authority of Arizona (WIFA) approved a new $3.0million low-interest loan for Tucson Water projects. WIFA funding is used to finance improvements to thedrinking water systems that would normally be funded by selling water revenue bonds at market rates. TheCity issued $31.7 million in water system revenue bonded debt during fiscal year 2005. This funding is used tofinance water system improvements.
• The City took advantage of lower interest rates during the fiscal year with several refundings. In governmentalactivities, the debt scheduled after July 1, 2005 of the 1997 GO Bonds, the 1998 GO Bonds, the 1999 GOBonds, the 2000-A GO Bond were partially or completely retired with a $34.2 million refunding, saving the Cityin $1.07 million in gross debt obligation. The City issued another $21.7 million refunding to retire all or partialdebt scheduled after July 1, 2005 of the 1995 Refunding GO Bonds, the 1994-C GO Bonds, and the 1999 GOBonds. This refunding saved the City $1.4 million in gross debt service obligation. The City also issued $39.9Jr. Streets and Highway User Revenue Bonds to retire all or partial debt scheduled after July 1, 2005 of the1198 Jr. S&H Bonds, the 2000 Jr. S&H Bonds, the 2001 Jr. S&H Bonds and the 1997 SR. S&H Bonds. Savingthe City $1.26 million in gross debt service obligation.
Restated Restated Restated2005 2004 2005 2004 2005 2004
General Obiligation Debt $ 248,797,183 $ 239,790,152 $ 42,386,887 $ 34,661,430 $ 291,184,070 $ 274,451,582Street & Highway Revenue Bonds 153,515,000 156,475,000 153,515,000 156,475,000Certificates of Participation 89,875,000 43,335,000 4,320,000 4,625,000 94,195,000 47,960,000 Federal Highway Loan 1,300,000 2,100,000 1,300,000 2,100,000 Special Assessment Bonds 3,575,600 4,028,500 3,575,600 4,028,500 Water Revenue Bonds 388,324,735 364,700,668 388,324,735 364,700,668Deferred Amount on Refundings and Premiums 5,256,885 1,373,406 376,019 (1,048,501) 5,632,904 324,905 Landfill Closure/Post Closure Costs 42,535,670 47,211,999 42,535,670 47,211,999 Contracts/Capital Leases Payable 4,661,279 850,084 3,049,416 3,232,481 7,710,695 4,082,565 Compensated Absences 28,051,169 25,614,453 4,637,854 4,510,697 32,689,023 30,125,150 Claims and Judgments 45,064,770 39,712,642 45,064,770 39,712,642 Total $ 580,096,886 $ 513,279,237 $ 485,630,581 $ 457,893,774 $ 1,065,727,467 $ 971,173,011
City of TucsonLong-term Debt
Table B-5
Governmental Business-type Total PrimaryActivities Activities Government

CITY OF TUCSON, ARIZONAMANAGEMENT’S DISCUSSION AND ANALYSIS
For the Year Ended June 30, 2005
15
• In business-type activities, the Water Utility took advantage of lower interest rates with one refunding. The Cityissued a $55.1 million refunding partially or completely retiring the debt scheduled after July 1, 2005 for the1994-B Water System Revenue Bond (WSR Bond), the 1994-C WSR Bond, the 1994-D WSR Bond, the 2000-A WSR Bond, and the 2000-C WSR Bond. This refunding saved the City $3.1 million in gross debt serviceobligation.
• Proceeds from lease purchase contracts and Certificates of Participation increased $55.9 million. This included$40.5 million towards Pennington Garage, Police Substation, Streets, and the Train Depot. $11.2 million wasused for apparatus replacement, fire mobile data terminals, police helicopters, and Starr Pass. The remaining$4.2 million was used for vehicle purchases.
Bond Ratings
Table B-6 illustrates previous and current bond ratings for Fiscal year 2005:
CONTACTING THE CITY’S FINANCIAL MANAGEMENT
This financial report is designed to provide our citizens, taxpayers, customers, investors and creditors with ageneral overview of the City’s finances and to demonstrate the City’s accountability for the money it receives. Ifyou have any questions about this report or need additional financial information, contact the Accounting Division,255 W. Alameda, Tucson, Arizona 85701, (520) 791-4561, www.cityoftucson.org.
Type of Bond: Previous Current Previous Current Previous CurrentGeneral Obligation Bonds Aa3 Aa3 AA AA N/R AAStreet & Highway User Revenue Bonds Senior Lien A1 A1 A+ A+ N/R AA- Junior Lien A2 A2 A A N/R A+Water System Revenue Bonds Senior Lien Aa3 Aa3 A+ A+ AA AA Junior Lien N/R N/R N/R N/R N/R N/RCertificates of Participation A1 A1 AA AA- AA- AA-Rio Nuevo Multipurpose Facilities District Aa3 Aa3 AA- AA- N/R N/R
FitchRating
Table B-6City of Tucson
Fiscal Year 2005 Bond Ratings
RatingStandard and Poors
RatingMoody's


Basic Financial Statem
ents

CITY OF TUCSON, ARIZONASTATEMENT OF NET ASSETS
JUNE 30, 2005
Primary GovernmentComponent
UnitGovernmental
ActivitiesBusiness-type
Activities Total Rio NuevoASSETSCurrent assets: Pooled Cash and Investments 69,019,264$ 32,648,205$ 101,667,469$ $ Cash and Investments - Restricted 43,149,199 43,149,199 Cash and Investments with Fiscal
Agent - Restricted 55,428,202 17,688,470 73,116,672 Taxes Receivable, Net 42,149,964 42,149,964 2,307,681 Accounts Receivable, Net 37,734,429 18,541,309 56,275,738 8,734 Special Assessments Receivable 3,474,061 3,474,061 Due from Other Agencies 8,575,817 48,553 8,624,370 Interest Receivable 788,590 187,310 975,900 Inventories 1,983,786 374,149 2,357,935 Other Assets 4,759,060 4,759,060 566,289 Other Assets - Restricted 18,698,382 541,801 19,240,183 1,511,767 Total current assets 242,611,555 113,178,996 355,790,551 4,394,471
Noncurrent assets: Long Term Investments 1,068,261 1,068,261 Long Term Accounts Receivable 11,126,310 1,376,912 12,503,222 Long Term Notes Receivable 61,309,500 61,309,500 Deferred Charges 4,161,697 2,645,615 6,807,312 359,226 Land and Construction in Progress 816,271,591 208,897,453 1,025,169,044 20,989,661 Other Capital Assets, Net 644,502,843 765,769,376 1,410,272,219 27,335,244 Goodwill, Net 163,978 163,978 Water Rights, Net 725,742 725,742 Total noncurrent assets 1,538,440,202 979,579,076 2,518,019,278 48,684,131 Total assets 1,781,051,757 1,092,758,072 2,873,809,829 53,078,602
LIABILITIESCurrent liabilities: Accounts Payable 28,409,717 6,044,943 34,454,660 39,316 Accrued Payroll Liabilities 5,000,062 818,835 5,818,897 10,193 Accrued Interest Payable 14,555 14,699 29,254 23,914 Due to Other Agencies 472,909 1,055,286 1,528,195 244,929 Refundable Deposits 7,399,734 2,823,935 10,223,669
Liabilities Payable from Restricted Assets 25,875,864 20,480,301 46,356,165 Deferred Revenue 34,612,538 26,149 34,638,687 Current portion of Long Term Liabilities 54,503,918 17,968,473 72,472,391 2,665,000 Total current liabilities 156,289,297 49,232,621 205,521,918 2,983,352
Noncurrent liabilities: Notes and Loans Payable 14,577,549 Long Term Liabilities 525,592,968 467,662,108 993,255,076 19,463,566 Total non-current liabilities 525,592,968 467,662,108 993,255,076 34,041,115 Total liabilities 681,882,265 516,894,729 1,198,776,994 37,024,467
NET ASSETSInvested in Capital Assets, Net of Related Debt 998,221,324 594,423,874 1,592,645,198 26,555,565 Restricted for: Debt Service 14,273,336 994,202 15,267,538 Capital 28,522,281 8,019,480 36,541,761 1,511,768 Grants and Entitlements 14,973,775 14,973,775 Self Insurance Mandates 18,619,069 18,619,069 Transportation 3,542,301 3,542,301 Other Purposes 2,733,158 2,733,158 Permanent Endowments: Expendable 7,146 7,146 Unexpendable 142,456 142,456 Unrestricted 18,134,646 (27,574,213) (9,439,567) (12,013,198) Total net assets 1,099,169,492$ 575,863,343$ 1,675,032,835$ 16,054,135$
The notes to the financial statements are an integral part of this statement.
17

Program Revenues
Functions/Programs ExpensesCharges for
Services
Operating Grants and
Contributions
Capital Grants and
ContributionsPrimary Government Governmental activities: Elected and Official $ 15,418,836 346,333$ 434,533$ $ Support Services 58,587,923 31,699,633 60,700 Neighborhood Services 337,049,181 30,438,190 63,902,486 3,527,293 Environment and Development 131,039,748 27,275,045 62,555,867 17,660,315 Strategic Initiatives 14,039,464 3,328,561 168,222 Non-Departmental 12,788,223 326,325 663,299 4,970,500 Interest 22,270,724 Fiscal Agent Fees and Other 46,301 Total governmental activities 591,240,400 93,414,087 127,785,107 26,158,108
Business-type activities: Environmental Services 39,464,082 35,506,968 237,555 Golf 10,064,093 8,980,101 841,000 Water 112,359,007 111,347,469 14,317,469 Total business-type activities 161,887,182 155,834,538 15,396,024 Total primary government 753,127,582$ 249,248,625$ 127,785,107$ 41,554,132$
Component Unit: Rio Nuevo 3,896,873$ 3,788,163$
General revenues: Taxes: Property Taxes Business Privilege Taxes Public Utility Taxes Transient Occupancy Taxes Occupational Taxes Liquor Taxes Unrestricted Grants and Contributions Contributions from City of Tucson Investment Income (Loss) Miscellaneous
Transfers Total general revenues and transfers
Changes in net assets
Net assets, beginning of year, restated
Net assets, end of year
The notes to the financial statements are an integral part of this statement.
CITY OF TUCSON, ARIZONASTATEMENT OF ACTIVITIESYEAR ENDED JUNE 30, 2005
18

Net (Expense) Revenue and Changes in Net Assets
Primary GovernmentComponent
Unit
Governmental Activities
Business-type Activities Totals Rio Nuevo
(14,637,970)$ $ (14,637,970)$ (26,827,590) (26,827,590)
(239,181,212) (239,181,212) (23,548,521) (23,548,521) (10,542,681) (10,542,681) (6,828,099) (6,828,099)
(22,270,724) (22,270,724) (46,301) (46,301)
(343,883,098) (343,883,098)
(3,719,559) (3,719,559) (242,992) (242,992)
13,305,931 13,305,931 9,343,380 9,343,380
(343,883,098)$ 9,343,380$ (334,539,718)$
(108,710)$
30,203,848 30,203,848 183,102,463 183,102,463 8,655,986
7,654,851 7,654,851 10,768,492 10,768,492 2,098,216 2,098,216
740,742 740,742 114,662,691 114,662,691
400,000 2,605,029 2,902,021 5,507,050 (3,460) 7,100,302 7,100,302
(3,971,822) 3,971,822 354,964,812 6,873,843 361,838,655 9,052,526
11,081,714 16,217,223 27,298,937 8,943,816
1,088,087,778 559,646,120 1,647,733,898 7,110,319
1,099,169,492$ 575,863,343$ 1,675,032,835$ 16,054,135$
19

CITY OF TUCSON, ARIZONABALANCE SHEET - GOVERNMENTAL FUNDS
JUNE 30, 2005
General Fund
Non-Major Governmental
Funds
Total Governmental
FundsASSETSPooled Cash and Investments 3,442,557$ 62,139,133$ 65,581,690$ Cash/Investments with Fiscal Agent 24,843,838 30,584,364 55,428,202 Long Term Investments 1,068,261 1,068,261 Taxes Receivable - Current 42,149,964 42,149,964 Accounts Receivable, Net 14,333,076 12,137,101 26,470,177 Special Assessments Receivable 3,474,061 3,474,061 Notes and Loans Receivable 18,963,638 42,345,862 61,309,500 Advances to Other Funds 7,180,590 7,180,590 Due from Other Agencies 8,044,252 531,565 8,575,817 Interfund Receivable 21,713,112 6,838,635 28,551,747 Grants and Entitlements Receivable 22,169,637 22,169,637 Interest Receivable 88,645 235,388 324,033 Inventories 1,983,786 1,983,786 Other Assets 34,287 4,724,773 4,759,060 Total assets 142,777,745$ 186,248,780$ 329,026,525$
LIABILITIES AND FUND BALANCESLiabilities: Accounts Payable 12,759,915$ 10,550,663$ 23,310,578$ Accrued Payroll Liabilities 3,805,256 1,095,322 4,900,578 Advances from Other Funds 7,180,590 7,180,590 Interfund Payable 6,838,635 21,713,112 28,551,747 Due to Other Agencies 472,032 472,032 Refundable Deposits 5,578,098 1,821,438 7,399,536 Bonds and Interest Payable, including Special Assessments 25,875,864 25,875,864 Deferred Revenue 15,734,349 43,043,152 58,777,501 Total liabilities 44,716,253 111,752,173 156,468,426
Fund balances (deficits): Reserved for Debt Service 3,272,423 7,244,409 10,516,832 Reserved for Capital Improvements 23,573,238 44,790,048 68,363,286 Reserved for Advances and Deposits 23,670,882 13,170 23,684,052 Reserved for Inventories 1,983,786 1,983,786 Reserve for Other Purposes 2,491,303 16,797,576 19,288,879 Unreserved: Undesignated 28,315,663 28,315,663 Designated 14,754,197 14,754,197 Unreserved reported in: Special revenue funds 9,331,994 9,331,994 Capital projects funds (3,680,590) (3,680,590) Total fund balances 98,061,492 74,496,607 172,558,099
Total liabilities and fund balances 142,777,745$ 186,248,780$ 329,026,525$
The notes to the financial statements are an integral part of this statement.
20
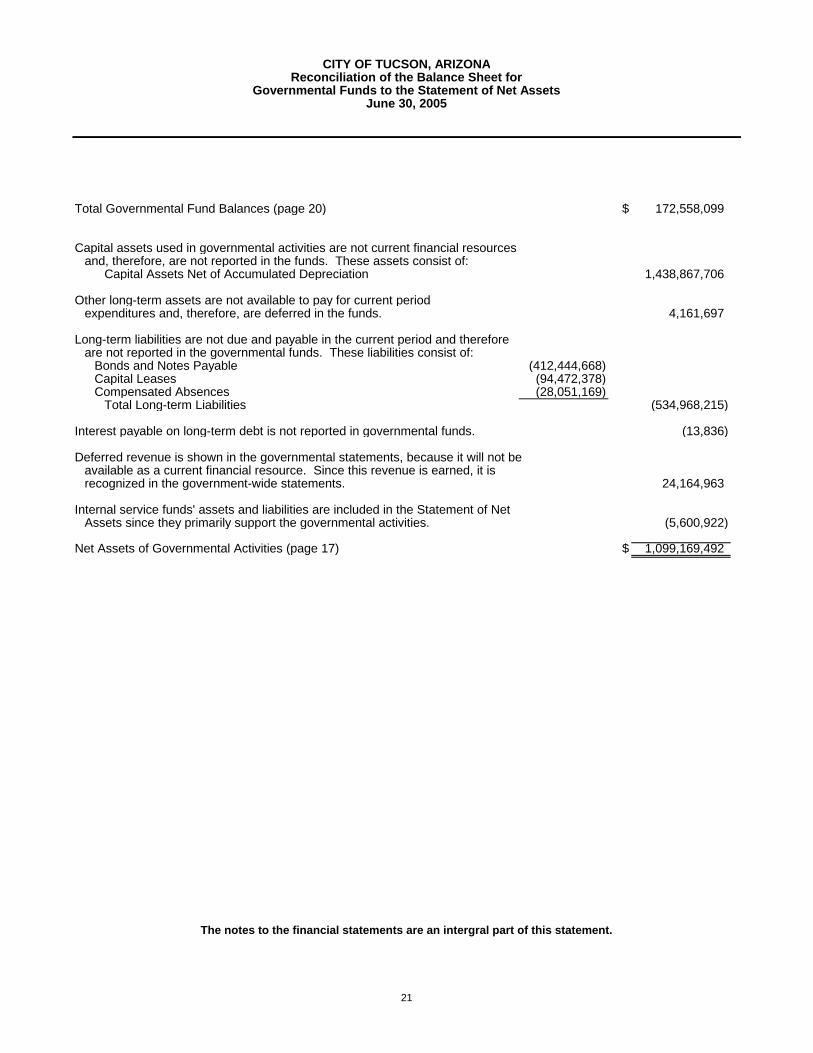
Total Governmental Fund Balances (page 20) $ 172,558,099
Capital assets used in governmental activities are not current financial resourcesand, therefore, are not reported in the funds. These assets consist of:
Capital Assets Net of Accumulated Depreciation 1,438,867,706
Other long-term assets are not available to pay for current period expenditures and, therefore, are deferred in the funds. 4,161,697
Long-term liabilities are not due and payable in the current period and therefore are not reported in the governmental funds. These liabilities consist of:
Bonds and Notes Payable (412,444,668)Capital Leases (94,472,378)Compensated Absences (28,051,169)
Total Long-term Liabilities (534,968,215)
Interest payable on long-term debt is not reported in governmental funds. (13,836)
Deferred revenue is shown in the governmental statements, because it will not beavailable as a current financial resource. Since this revenue is earned, it isrecognized in the government-wide statements. 24,164,963
Internal service funds' assets and liabilities are included in the Statement of NetAssets since they primarily support the governmental activities. (5,600,922)
Net Assets of Governmental Activities (page 17) $ 1,099,169,492
The notes to the financial statements are an intergral part of this statement.
CITY OF TUCSON, ARIZONAReconciliation of the Balance Sheet for
Governmental Funds to the Statement of Net AssetsJune 30, 2005
21

CITY OF TUCSON, ARIZONASTATEMENT OF REVENUES, EXPENDITURES AND CHANGES IN FUND BALANCES -
GOVERNMENTAL FUNDSYEAR ENDED JUNE 30, 2005
General Fund
Non-Major Governmental
Funds
Total Governmental
FundsRevenues: Taxes 211,795,324$ 21,274,250$ 233,069,574$ Licenses and Permits 18,593,626 908,798 19,502,424 Fines and Forfeitures 10,341,491 1,216,870 11,558,361 Use of Money and Property 2,621,347 3,283,583 5,904,930 Federal Grants and Contributions 70,681,079 70,681,079 Other Agencies 126,372,735 69,638,196 196,010,931 Charges for Services 39,266,187 16,461,320 55,727,507 Special Assessments 863,322 863,322 Miscellaneous 4,564,314 2,785,180 7,349,494 Total revenues 413,555,024 187,112,598 600,667,622
Expenditures: Current - Elected and Official 14,622,301 313,819 14,936,120 Support Services 53,927,885 40,546 53,968,431 Neighborhood Services 229,908,518 81,115,494 311,024,012 Environment and Development 17,844,265 85,666,475 103,510,740 Strategic Initiatives 2,457,817 10,839,519 13,297,336 Non-Departmental 11,502,112 474,713 11,976,825 Capital Outlay 3,432,523 5,411,497 8,844,020 Capital Projects 34,699,532 52,027,944 86,727,476 Debt service - Principal 4,214,239 18,177,114 22,391,353 Interest 2,834,308 19,436,416 22,270,724 Fiscal Agent Fees and Other 23,598 22,703 46,301 Issuance Cost of Debt 997,378 1,366,394 2,363,772 Total expenditures 376,464,476 274,892,634 651,357,110
Excess (deficiency) of revenues over expenditures 37,090,548 (87,780,036) (50,689,488)
Other financing sources (uses): Face Amount of Bond Proceeds 109,719,606 109,719,606 Lease Purchase and Contracts Proceeds 44,784,153 11,124,130 55,908,283 Premium on Issuance of Debt 1,332,519 6,722,376 8,054,895 Transfers from Other Funds 2,726,435 62,579,246 65,305,681 Payment to Refunded Bond Escrow Agent (1,465,000) (90,978,595) (92,443,595) Transfers to Other Funds (59,769,496) (13,646,437) (73,415,933) Total other financing sources (uses) (12,391,389) 85,520,326 73,128,937
Changes in fund balances 24,699,159 (2,259,710) 22,439,449
Fund balances, beginning of year 73,362,333 76,756,317 150,118,650
Fund balances, end of year 98,061,492$ 74,496,607$ 172,558,099$
The notes to the financial statements are an integral part of this statement.
22
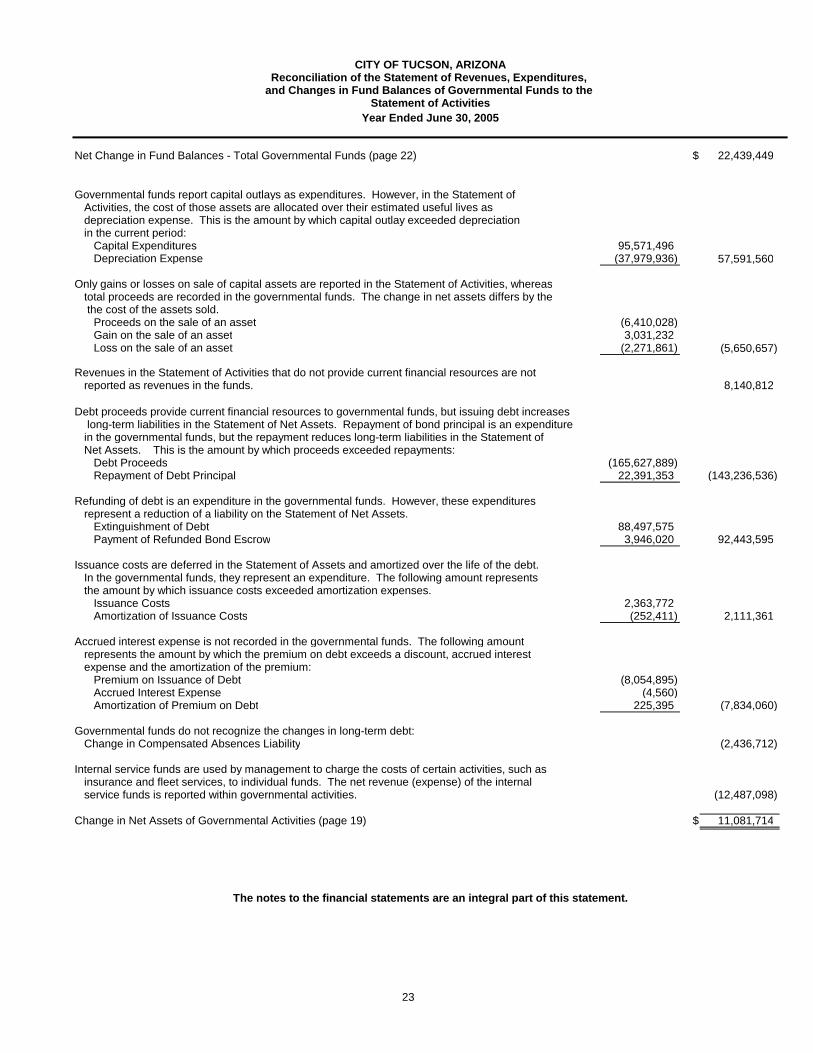
Net Change in Fund Balances - Total Governmental Funds (page 22) $ 22,439,449
Governmental funds report capital outlays as expenditures. However, in the Statement of Activities, the cost of those assets are allocated over their estimated useful lives asdepreciation expense. This is the amount by which capital outlay exceeded depreciation in the current period:
Capital Expenditures 95,571,496Depreciation Expense (37,979,936) 57,591,560
Only gains or losses on sale of capital assets are reported in the Statement of Activities, whereastotal proceeds are recorded in the governmental funds. The change in net assets differs by the the cost of the assets sold.
Proceeds on the sale of an asset (6,410,028) Gain on the sale of an asset 3,031,232 Loss on the sale of an asset (2,271,861) (5,650,657)
Revenues in the Statement of Activities that do not provide current financial resources are notreported as revenues in the funds. 8,140,812
Debt proceeds provide current financial resources to governmental funds, but issuing debt increases long-term liabilities in the Statement of Net Assets. Repayment of bond principal is an expenditurein the governmental funds, but the repayment reduces long-term liabilities in the Statement ofNet Assets. This is the amount by which proceeds exceeded repayments:
Debt Proceeds (165,627,889)Repayment of Debt Principal 22,391,353 (143,236,536)
Refunding of debt is an expenditure in the governmental funds. However, these expendituresrepresent a reduction of a liability on the Statement of Net Assets.
Extinguishment of Debt 88,497,575Payment of Refunded Bond Escrow 3,946,020 92,443,595
Issuance costs are deferred in the Statement of Assets and amortized over the life of the debt.In the governmental funds, they represent an expenditure. The following amount representsthe amount by which issuance costs exceeded amortization expenses.
Issuance Costs 2,363,772Amortization of Issuance Costs (252,411) 2,111,361
Accrued interest expense is not recorded in the governmental funds. The following amountrepresents the amount by which the premium on debt exceeds a discount, accrued interest expense and the amortization of the premium:
Premium on Issuance of Debt (8,054,895)Accrued Interest Expense (4,560)Amortization of Premium on Debt 225,395 (7,834,060)
Governmental funds do not recognize the changes in long-term debt:Change in Compensated Absences Liability (2,436,712)
Internal service funds are used by management to charge the costs of certain activities, such as insurance and fleet services, to individual funds. The net revenue (expense) of the internalservice funds is reported within governmental activities. (12,487,098)
Change in Net Assets of Governmental Activities (page 19) $ 11,081,714
The notes to the financial statements are an integral part of this statement.
CITY OF TUCSON, ARIZONAReconciliation of the Statement of Revenues, Expenditures,
and Changes in Fund Balances of Governmental Funds to the Statement of Activities
Year Ended June 30, 2005
23

CITY OF TUCSON, ARIZONASTATEMENT OF NET ASSETS
PROPRIETARY FUNDSJUNE 30, 2005
Enterprise Funds
Environmental Services Water Utility Fund
Non-Major Enterprise Fund Total
Governmental Activities: Internal
Service FundsASSETSCurrent assets: Pooled Cash and Investments $ 2,708,946 $ 27,728,342 $ 2,210,917 $ 32,648,205 $ 3,437,574 Cash and Investments - Restricted 7,912,011 35,237,188 43,149,199 Cash and Investments with
Fiscal Agent - Restricted 853,145 16,773,007 62,318 17,688,470 Accounts Receivable, Net 2,910,047 15,627,166 4,096 18,541,309 220,925 Due from Other Agencies 48,553 48,553 Interest Receivable 6,004 179,974 1,332 187,310 464,557 Inventories 122,308 251,841 374,149 Other Assets - Restricted 541,801 541,801 18,698,382 Total current assets 14,438,706 96,209,786 2,530,504 113,178,996 22,821,438
Noncurrent assets: Long Term Accounts Receivable 1,376,912 1,376,912 Deferred Charges 164,924 2,422,724 57,967 2,645,615 Land and Construction in Progress 10,229,518 192,680,790 5,987,145 208,897,453 30,242 Other Capital Assets, Net 16,521,589 737,354,243 11,893,544 765,769,376 21,876,486 Goodwill, Net 159,079 4,899 163,978 Water Rights, Net 725,742 725,742 Total noncurrent assets 26,916,031 934,719,490 17,943,555 979,579,076 21,906,728 Total assets 41,354,737 1,030,929,276 20,474,059 1,092,758,072 44,728,166
LIABILITIESCurrent liabilities: Accounts Payable 1,200,978 4,531,997 311,968 6,044,943 5,099,139 Accrued Payroll Liabilities 215,226 543,171 60,438 818,835 99,484 Accrued Interest Payable 14,699 14,699 719 Due to Other Agencies 2,234 1,041,960 11,092 1,055,286 877 Refundable Deposits 28,904 2,795,031 2,823,935 198 Current Portion of Bonds Payable 11,083,842 11,083,842 Current Portion of Contracts Payable 1,264,071 115,661 320,000 1,699,732 24,711 Current Portion of Claims Payable 10,029,456 Current Portion of Compensated Absences 632,826 1,896,492 85,068 2,614,386 Liabilities Payable from Restricted Assets 853,146 19,627,155 20,480,301 Deferred Revenue 5,000 21,149 26,149 Current portion of Long Term Liabilities 2,570,513 2,570,513 Total current liabilities 6,782,597 41,640,309 809,715 49,232,621 15,254,584
Noncurrent liabilities: Bonds Payable 41,888,811 378,284,018 420,172,829 Contracts Payable 1,185,875 483,809 3,830,970 5,500,654 39,190 Claims Payable 35,035,314 Compensated Absences 608,641 1,296,667 118,160 2,023,468 Long Term Liabilities 39,965,157 39,965,157 Total non-current liabilities 83,648,484 380,064,494 3,949,130 467,662,108 35,074,504 Total liabilities 90,431,081 421,704,803 4,758,845 516,894,729 50,329,088
NET ASSETSInvested in Capital Assets, Net of Related Debt 3,949,080 576,713,350 13,761,444 594,423,874 21,842,827 Restricted for Debt Service 853,145 141,057 994,202 Restricted for Capital 7,912,011 45,151 62,318 8,019,480 79,313 Restricted for Other Purposes 18,619,069 Unrestricted (61,790,580) 32,324,915 1,891,452 (27,574,213) (46,142,131) Total net assets $ (49,076,344) $ 609,224,473 $ 15,715,214 $ 575,863,343 $ (5,600,922)
The notes to the financial statements are an integral part of this statement.
24
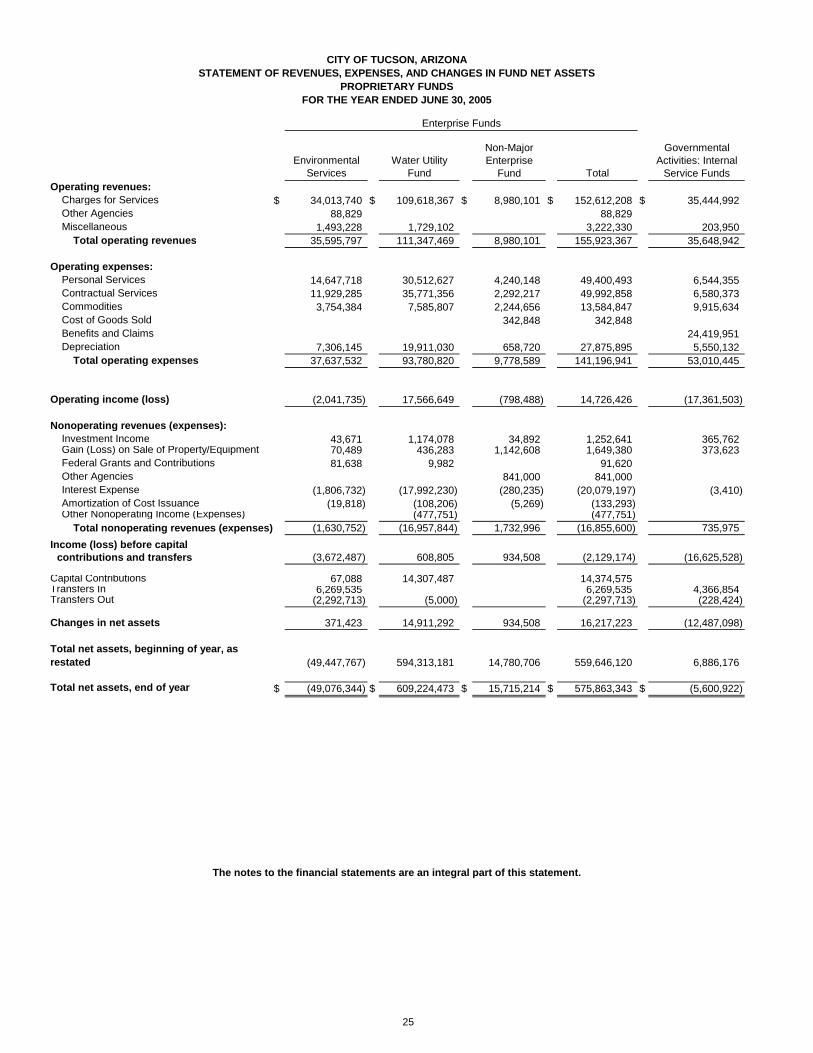
Enterprise Funds
Environmental Services
Water Utility Fund
Non-Major Enterprise
Fund Total
Governmental Activities: Internal
Service FundsOperating revenues: Charges for Services $ 34,013,740 $ 109,618,367 $ 8,980,101 $ 152,612,208 $ 35,444,992 Other Agencies 88,829 88,829 Miscellaneous 1,493,228 1,729,102 3,222,330 203,950 Total operating revenues 35,595,797 111,347,469 8,980,101 155,923,367 35,648,942
Operating expenses: Personal Services 14,647,718 30,512,627 4,240,148 49,400,493 6,544,355 Contractual Services 11,929,285 35,771,356 2,292,217 49,992,858 6,580,373 Commodities 3,754,384 7,585,807 2,244,656 13,584,847 9,915,634 Cost of Goods Sold 342,848 342,848 Benefits and Claims 24,419,951 Depreciation 7,306,145 19,911,030 658,720 27,875,895 5,550,132 Total operating expenses 37,637,532 93,780,820 9,778,589 141,196,941 53,010,445
Operating income (loss) (2,041,735) 17,566,649 (798,488) 14,726,426 (17,361,503)
Nonoperating revenues (expenses): Investment Income 43,671 1,174,078 34,892 1,252,641 365,762 Gain (Loss) on Sale of Property/Equipment 70,489 436,283 1,142,608 1,649,380 373,623 Federal Grants and Contributions 81,638 9,982 91,620 Other Agencies 841,000 841,000 Interest Expense (1,806,732) (17,992,230) (280,235) (20,079,197) (3,410) Amortization of Cost Issuance (19,818) (108,206) (5,269) (133,293) Other Nonoperating Income (Expenses) (477,751) (477,751) Total nonoperating revenues (expenses) (1,630,752) (16,957,844) 1,732,996 (16,855,600) 735,975
Income (loss) before capital contributions and transfers (3,672,487) 608,805 934,508 (2,129,174) (16,625,528)
Capital Contributions 67,088 14,307,487 14,374,575 Transfers In 6,269,535 6,269,535 4,366,854 Transfers Out (2,292,713) (5,000) (2,297,713) (228,424)
Changes in net assets 371,423 14,911,292 934,508 16,217,223 (12,487,098)
Total net assets, beginning of year, as restated (49,447,767) 594,313,181 14,780,706 559,646,120 6,886,176
Total net assets, end of year $ (49,076,344) $ 609,224,473 $ 15,715,214 $ 575,863,343 $ (5,600,922)
CITY OF TUCSON, ARIZONASTATEMENT OF REVENUES, EXPENSES, AND CHANGES IN FUND NET ASSETS
PROPRIETARY FUNDSFOR THE YEAR ENDED JUNE 30, 2005
The notes to the financial statements are an integral part of this statement.
25
Enterprise Funds
Environmental Services Water Utility Fund
Non-Major Enterprise
Fund Total
Governmental Activities: Internal
Service Funds
Cash Flows from Operating Activities:Cash Received from Customers 32,755,918$ 112,533,412$ 9,013,489$ 154,302,819$ 35,676,699$ Cash Payments to Suppliers for Goods
and Services (14,666,712) (42,704,046) (4,824,877) (62,195,635) (32,444,364)Cash Payments to Employees for Services (14,597,751) (30,602,325) (4,244,947) (49,445,023) (6,555,489)Other Operating Revenues 1,528,417 1,528,417 165,045
Net Cash Provided (Used)by Operating Activities 5,019,872 39,227,041 (56,335) 44,190,578 (3,158,109)
Cash Flows from Noncapital Financing Activities:
Transfer from Other Funds 1,655,000 1,655,000Transfers to Other Funds (2,845,306) (2,845,306) (228,424)Subsidy from Federal Grant 81,638 9,982 91,620 Net Cash Provided (Used) by Noncapital
Financing Activities (1,108,668) 9,982 (1,098,686) (228,424)
Cash Flows from Capital and Related Financing Activities:
Bond Proceeds 7,370,036 35,364,108 42,734,144Transfer of Bond Proceeds from Other Funds 4,614,535 4,614,535Acquisition and Construction of Capital Assets (167,770) (27,563,584) (1,429,895) (29,161,249) (2,929,840)Principal Paid on Capital Debt (1,169,210) (10,400,113) (305,000) (11,874,323)Interest Paid on Capital Debt (1,801,962) (17,979,728) (244,015) (20,025,705) (23,635)Landfill Closure Costs (4,002,824) (4,002,824) (11,601)Fiscal Agent Fees Paid on Capital Debt (477,750) (477,750)Proceeds from Sale of Assets/Equipment 70,800 427,756 3,491,355 3,989,911 633,262
Net Cash Provided (Used) by Capital and Related Financing Activities 4,913,605 (20,629,311) 1,512,445 (14,203,261) (2,331,814)
Cash Flows from Investing Activities:Interest on Investments 17,127 1,638,218 37,269 1,692,614 377,185Proceeds from Sale of Investments 1,801,513
Net Cash Provided (Used) by Investing Activities 17,127 1,638,218 37,269 1,692,614 2,178,698
Net Increase (Decrease) in Cash and Cash Equivalents 8,841,936 20,245,930 1,493,379 30,581,245 (3,539,649)
Cash and Cash Equivalents - July 1 1,779,021 42,719,600 717,538 45,216,159 6,977,223
Cash and Cash Equivalents - June 30 10,620,957$ 62,965,530$ 2,210,917$ 75,797,404$ 3,437,574$
CITY OF TUCSON, ARIZONASTATEMENT OF CASH FLOWS
PROPRIETARY FUNDSFOR THE YEAR ENDED JUNE 30, 2005
The notes to the financial statements are an integral part of this statement.
26

Enterprise Funds
Environmental Services
Water Utility Fund
Non-Major Enterprise
Fund Total
Governmental Activities: Internal
Service Funds
Reconciliation of Operating Income (Loss)to Net Cash Provided (Used) by OperatingActivities:
Operating Income (2,041,735)$ 17,566,649$ (798,488)$ 14,726,426$ (17,361,503)$ Adjustments to Reconcile Operating Income to Net Cash Provided by Operating Activities:
Depreciation/Goodwill Amortization 7,306,145 19,911,030 658,720 27,875,895 5,550,132Provision for Landfill Closure 673,504 673,504Other Adjustments 80,381 80,381Decrease (Increase) in Assets: -
Accounts Receivable (1,790,561) (1,238,041) 41,086 (2,987,516) (113,589)Internal Receivable 441,100 441,100 245,910Due from Other Agencies (48,553) 143,700 95,147 62,782Prepaid Expense 1,505 2,316 3,821Inventory (14,699) 1,637 (13,062)Long Term Accounts Receivable 258,095 258,095
Increase (Decrease) in Liabilities:Accounts Payable 900,050 366,218 67,098 1,333,366 4,261,002Accrued Payroll Liabilities (29,556) (127,623) (6,089) (163,268) (11,134)Accrued Compensated Absences 79,523 37,925 117,448Unearned Receipts (5) (5)Customer/Refundable Deposits 6,171 2,165,894 2,172,065 198Due to Other Agencies (4,004) 169,383 (16,208) 149,171 225Due to Other Funds - Unrestricted (552,593) (12,990) (565,583) (1,144,260)Claims and Judgements Payable 5,352,128
Decrease in Other Operating Liabilities (6,407) (6,407)
Net Cash Provided (Used) by Operating Activities 5,019,872$ 39,227,041$ (56,335)$ 44,190,578$ (3,158,109)$
Noncash investing, capital and financing activities:
CITY OF TUCSON, ARIZONASTATEMENT OF CASH FLOWS
PROPRIETARY FUNDSFOR THE YEAR ENDED JUNE 30, 2005
During the year developers contributed water systems valued at $6,869,239. Other noncash transactions include $146,003 write off of the Rita Ranch payable. The Water Utility Fund holds a long term promissory note for $1,500,000 from Starr Pass Resort Developers LLC for the construction of certain water systems on Starr Pass's behalf.
In the Fleet Service Internal Service Fund, City funds contributed vehicles and equipment with a net book value of $4,366,854.
The notes to the financial statements are an integral part of this statement.
27

CITY OF TUCSON, ARIZONASTATEMENT OF FIDUCIARY FUNDS NET ASSETS
JUNE 30, 2005
Pension Trust AgencyASSETSPooled Cash and Investments 1,566,343$ 2,815,950$ Accounts Receivable, Net 2,924,700 Employer Contributions 837,577 Employee Contributions 513,342 Interest Receivable 5,896 Interest and Dividends 2,193,035 Due from Brokers 4,783,586 Short-term Investments 5,761,617 Sercurities Lending Collateral 47,449,522 U.S. Government Obligations 113,479,991 Bonds and Preferred Stocks 44,510,967 Other Assets 292,330 Common Stocks 284,758,229 International Investments 81,560,958 Mutual Funds 74,123,361 Real Estate 30,232,095 Other Capital Assets, Net 10,748 Total assets 691,781,371 6,038,876$
LIABILITIESAccounts Payable 504,241 2,799,300 Accrued Payroll Liabilities 3,295 Due to Other Agencies 48,000 3,239,576 Due to Securities Borrowers 47,449,522 Due to Brokers 14,286,225 Refundable Deposits 2,035 Total liabilities 62,293,318 6,038,876$
NET ASSETSHeld in trust 629,488,053$
The notes to the financial statements are an integral part of this statement.
28

CITY OF TUCSON, ARIZONASTATEMENT OF CHANGES IN FIDUCIARY NET ASSETS
FIDUCIARY FUNDYEAR ENDED JUNE 30, 2005
Pension TrustAdditions: Employer 21,423,488$ Employees 15,701,987 Other Plans 857,399 Net Increase (Decrease) in Fair Value of Investment 34,285,740
Interest, Dividends and Other Income 17,085,504 Securities Lending Income 1,171,410
Less: Investment Activity Expense (2,598,968)
Less: Securities Lending Expense (1,076,589) Miscellaneous Additions 43,387 Total additions 86,893,358
Deductions: Payments to Participants 32,318,565
Refunds and Transfers to Other Plans 5,276,381 Administrative Expense 530,469 Total deductions 38,125,415
Changes in net assets 48,767,943
Net assets, beginning of year 580,720,110
Net assets, end of year 629,488,053$
The notes to the financial statements are an integral part of this statement.
29


CITY OF TUCSON, ARIZONANOTES TO BASIC FINANCIAL STATEMENTS
For the Year Ended June 30, 2005
31
Note 1 - SUMMARY OF SIGNIFICANT ACCOUNTING POLICIES:
The accounting and reporting framework and the most significant accounting principles and practices of the City ofTucson (City) are discussed in subsequent sections of this note. The accounting policies of the City conform toaccounting principles generally accepted in the United States of America as applicable to governments. Thefollowing is a summary of the more significant policies:
A. Reporting Entity
These financial statements represent the City and its component units. The component units of the City arediscussed below:
The Rio Nuevo Multipurpose Facilities District (District) was created in July 1999 to take advantage of a Statelaw under which the State will provide incremental tax financing to help develop multipurpose facilities in thedowntown Tucson area. The District is governed by a Board of Directors appointed by the Mayors andCouncils of the Cities of Tucson and South Tucson. Through a weighted-average voting system, the Citymaintains control of the District. The governing body of the District is not substantially the same as thegoverning body of the City, and the District will provide revitalization and economic development opportunitiesin the downtown area of the City. Therefore, the District is included within these basic financial statements as adiscretely presented component unit. Separately issued financial statements are not prepared.
The Tucson Supplemental Retirement System (System or TSRS) is a single-employer defined benefit planestablished by the City and administered by a seven-member Board of Trustees. Although the system is aseparate legal entity and presents separate financial statements, its sole purpose is to provide servicesexclusively to the City; therefore, it is included as a Pension Trust Fund in these basic financial statements.
B. Government-wide and Fund Financial Statements
The government-wide financial statements (i.e., Statement of Net Assets and Statement of Activities) reportinformation on all nonfiduciary activities of the primary government. Governmental activities, which arenormally supported by taxes and intergovernmental revenues, include all governmental funds, along withinternal service funds. Business-type activities, which rely to a significant extent on fees and charges forservices, include the enterprise funds and are reported separately from the governmental activities.
The Statement of Net Assets reports the assets and liabilities of the primary government. The net asset sectionof this statement represents the residual amount of assets less their associated liabilities. The net assetsection is divided into three categories. The first category is Invested in Capital Assets, Net of Related Debt,which includes all capital assets, net of accumulated depreciation, less any debt outstanding associated withthe assets. Capital assets cannot readily be sold and converted into cash. The second category is RestrictedNet Assets, which includes those assets, net of their related debt, that have a constraint placed on their use.The constraints are either: 1) externally imposed by creditors, such as through debt covenants, grantors,contributors, or laws and regulations of other governments, or 2) imposed by law through constitutionalprovisions or enabling legislation. The final section is Unrestricted Net Assets, and this represents net assetsthat generally can be used for any purpose. However, they are not necessarily in a spendable form, like cash.
The Statement of Activities shows the degree to which direct expenses of various City functions are offset byprogram revenues. Direct expenses are those that are clearly identifiable with a specific function or segment.Program revenues include: 1) charges for services, fines and forfeitures, and licenses and fees, and 2) grantsand contributions that are restricted to meeting the operational or capital requirements of a particular function orsegment. Taxes and other items, which are not specifically identifiable with a particular function or segment,are reported as general revenues at the bottom of the statement. The general revenues support the net costsof the functions and segments not covered by program revenues.

CITY OF TUCSON, ARIZONANOTES TO BASIC FINANCIAL STATEMENTS
For the Year Ended June 30, 2005
32
Note 1 - SUMMARY OF SIGNIFICANT ACCOUNTING POLICIES (Continued):
Separate financial statements are provided for the governmental funds, proprietary funds, and fiduciary fundseven though the latter are excluded from the government-wide financial statements. In general, majorindividual funds are reported as separate columns in the fund financial statements, while nonmajor funds aredisplayed in aggregate.
C. Basis of Presentation
The accounts of the City are organized on the basis of funds, each of which is considered a separateaccounting entity. The City accounts for the operations of each fund through a separate set of self-balancingaccounts that comprise its assets, liabilities, fund equity, revenues, and expenditures or expenses, asappropriate. Government resources are allocated to and accounted for in individual funds based upon thepurposes for which they are to be spent and the means by which spending activities are controlled.
1. Governmental Funds
Major Fund:
General Fund - This fund is the general operating fund of the City. It is used to account for all financialresources of the general government, except those required to be accounted for in another fund.
Nonmajor Funds:
Special Revenue Funds - These funds and certain other governmental funds are used to account for theproceeds of specific revenue sources (other than proprietary and fiduciary functions) that are restricted toexpenditures for specified purposes. This includes federal grants and various City functions such asTucson Convention Center and Library.
Debt Service Funds - These funds and certain other governmental funds are used to account for theaccumulation of resources for, and the payment of, long-term debt principal, interest, and related costs forGeneral Obligation, Street and Highway, and Special Assessment Bonds.
Capital Project Funds - These funds are used to account for financial resources to be used for theacquisition or construction of major capital facilities (other than those financed by General, SpecialRevenue, or Proprietary Funds) using proceeds from the sale of General Obligation, Street and Highway,and Special Assessment Bonds.
Permanent Fund - This fund is used to account for non-City contributions legally restricted so that onlyearnings, and not principal, may be used to finance City programs.
2. Enterprise Funds
These funds are used to account for certain operations that provide services to the general public for a fee.Enterprise funds are required for any activity whose principal revenue sources meet any of the followingcriteria: 1) any activity that has issued debt backed solely by the fees and charges of the activity; 2) if thecost of providing services for an activity, including capital costs such as depreciation or debt service, mustlegally be recovered through fees and charges; or 3) it is the policy of the City to establish activity fees orcharges to recover the cost of providing services, including capital costs.

CITY OF TUCSON, ARIZONANOTES TO BASIC FINANCIAL STATEMENTS
For the Year Ended June 30, 2005
33
Note 1 - SUMMARY OF SIGNIFICANT ACCOUNTING POLICIES (Continued):
The City has three enterprise funds:
Major Funds:
The Water Utility Fund accounts for the financing and operation of all activities necessary to provide waterservices to the Tucson metropolitan area. Since the Water Utility is a segment accounted for within anindividual fund, no further segment information is presented in these notes.
The Environmental Services Fund accounts for the financing and operation of all activities necessary toprovide solid waste services to residential and commercial customers in the Tucson metropolitan area.Since the Environmental Services Fund is a segment accounted for within an individual fund, no furthersegment information is presented in these notes.
Nonmajor Fund:
The Golf Course Fund accounts for the financing and operation of the City's golf courses, driving ranges,pro shops and clubhouses. Since the Golf Fund is a segment accounted for within an individual fund, nofurther segment information is presented in these notes.
3. Internal Service Funds
These funds are used to account for the financing of self insurance and motor pool (fleet) services providedto City departments on a cost-reimbursement basis. Because the principal users of the internal servicefunds are equally divided between governmental and business-type activities, the assets and liabilities ofthe internal service funds are allocated between the respective columns on the government-wideStatement of Net Assets. The costs of the internal service fund services are spread to the appropriatefunctions on the government-wide Statement of Activities, and the revenues and expenses within theinternal service funds are eliminated from the government-wide financial statements to avoid any "doubling-up" effect of these revenues and expenses.
4. Fiduciary Funds
These funds are used to account for assets held by the City in a trustee capacity or as an agent forindividuals, private organizations, other governments, and/or other funds. These include Pension Trust andAgency Funds. The Pension Trust Funds, which include the City’s pension and deferred compensationplan, are accounted for in essentially the same manner as proprietary funds. Agency Funds, which includecollections for payment of medical insurance premiums and Pima County sewer collections, are custodial innature (assets equal liabilities) and do not involve the measurement of results of operations.
D. Basis of Accounting
The accounting and reporting treatment applied to a fund is determined by its measurement focus. Thegovernment-wide financial statements are reported on the flow of economic resources measurement focus andthe accrual basis of accounting, as are the proprietary and pension trust fund financial statements. Revenuesare recorded when earned and expenses are recorded when a liability is incurred, regardless of the timing ofthe related cash flows.

CITY OF TUCSON, ARIZONANOTES TO BASIC FINANCIAL STATEMENTS
For the Year Ended June 30, 2005
34
Note 1 - SUMMARY OF SIGNIFICANT ACCOUNTING POLICIES (Continued):
Governmental fund financial statements are reported using the current financial resources measurement focusand the modified accrual basis of accounting. Revenues are recognized as soon as they are susceptible toaccrual (i.e., when they are both "measurable and available"). "Measurable" means that the amount of thetransaction can be determined, and "available" means collectible within the current period or soon enoughthereafter to be used to pay liabilities of the current period. For this purpose, the City considers revenues to beavailable if they are collected within sixty days of the end of the current fiscal year. Expenditures generally arerecorded when the related liability is incurred. However, principal and interest on long-term debt are recordedas fund liabilities when the payment is due or when amounts have been accumulated in the debt service fundfor payment early in the following fiscal year. Certain compensated absences, and claims and judgmentexpenditures are recorded when payment is due. In general, only matured assets and liabilities are shown onthe balance sheets, and unreserved fund balance is considered a measure of "available spendable resources."
Major revenue sources susceptible to accrual are property taxes and special assessments when anenforceable legal claim has arisen, grants and similar items when all eligibility requirements are met, andprivilege and other taxes. Other receipts become measurable and available when cash is received by the Cityand are recognized as revenue at that time.
Governmental fund inventories, deposits, and long-term advances receivable do not represent "availablespendable resources" and are offset by fund balance reserve accounts.
The City's proprietary funds apply all applicable Financial Accounting Standards Board (FASB) Statements, aswell as the following pronouncements issued on or before November 30, 1989, unless those pronouncementsconflict or contradict Governmental Accounting Standards Board (GASB) pronouncements: FinancialAccounting Standards Board Statements and Interpretations, Accounting Principles Board Opinions, andAccounting Research Bulletins of the Committee on Accounting Procedure.
On the proprietary fund financial statements, operating revenues are those that flow directly from the operationsof that activity, (i.e., charges to customers or users who purchase or use the goods or services of that activity).Operating expenses are those that are incurred to provide those goods or services. Non-operating revenuesand expenses are items like investment income and interest expense that are not a result of the directoperations of the activity. Water connection fees for the Water Utility, established at an amount necessary torecover related costs, are recorded as non-operating revenues.
The City does not currently employ an indirect cost allocation system. The general fund and certain other fundscharge service fees to other operating funds to support general services used by the operating funds (likeaccounting and maintenance). These fees are shown as expenditure credits to prevent the "doubling-up" effectwithin the funds.
E. Budgetary Information
On June 3, 1980, the voters of the State of Arizona approved an expenditure limitation that is applicable to alllocal governments. This limitation, based on expenditures of the 1979-80 fiscal year, restricts the growth ofexpenditures based on a factor of increases in population and inflation. Certain expenditures are held to beexcludable. The limitation is set by the State Economic Estimates Commission prior to April 1 of each year forthe following fiscal year.

CITY OF TUCSON, ARIZONANOTES TO BASIC FINANCIAL STATEMENTS
For the Year Ended June 30, 2005
35
Note 1 - SUMMARY OF SIGNIFICANT ACCOUNTING POLICIES (Continued):
The City, therefore, formulates its annual budget to ensure compliance with the applicable provisions of thislimitation. The City uses the following procedures and policies in establishing the budgetary data reflected inthe financial statements:
1. On or before the first Monday in June of each year, the City Manager submits to the Mayor and Council aproposed operating budget for the fiscal year commencing the following July 1. The budget includesproposed operating and capital expenditures and the means of financing them.
2. Public hearings are conducted to obtain taxpayer comments.
3. Prior to July 1, Mayor and Council legally enact the budget through passage of a resolution. Legal controlover the budget derives from State statutes that prohibit the City from exceeding its adopted budget bypurpose. Purpose is defined as a series of departments/offices as follows: Elected Officials, NeighborhoodServices, Environment and Development, Strategic Initiatives, Support Services and Non-Departmental.Transfers between programs can be made upon Mayor and Council approval.
4. All appropriations lapse at year-end.
5. Supplementary budgetary appropriations would require approval of Mayor and Council; none werenecessary during the fiscal year ended June 30, 2005.
F. Encumbrances
The City of Tucson utilizes an encumbrance accounting system under which purchase orders, contracts andother commitments for the expenditure of monies are recorded in order to reserve that portion of the applicableappropriation. All appropriations lapse on the last day of the fiscal year. Any outstanding commitments that theCity intends to honor are re-budgeted in the new fiscal year. At June 30, 2005, the City intended to honor$69,790,781 of outstanding encumbrances in the new year.
General Fund $ 24,313,917 Library Fund 94,017 Public Safety Academy 23,970 TEAM/Parkwise Fund 1,964,632 Convention Center Fund 87,535 H.U.R.F. Fund 1,769,916 Civic Contribution Fund 110,528 Human and Community Development Fund 3,137,672 Public Housing Fund 26,680 Miscellaneous Housing Grant Fund 3,393,651 Development Fee Fund 296,433 2000 Street and Highway 932,440 1994 General Obligation 207,955 2000 General Obligation 13,112,616 Other Federal Grants Fund 3,717,023 Non-Federal Grants Fund 551,473 Mass Transit Fund 16,050,323
$ 69,790,781

CITY OF TUCSON, ARIZONANOTES TO BASIC FINANCIAL STATEMENTS
For the Year Ended June 30, 2005
36
Note 1 - SUMMARY OF SIGNIFICANT ACCOUNTING POLICIES (Continued):
G. Cash and Cash Equivalents
For purposes of the statements of cash flows, which are prepared for the enterprise and internal service funds,the City considers all highly-liquid investments (including the funds' participation in the investment pool accountand appropriate restricted assets) to be cash equivalents. Individual fund investments with an initial maturity of3 months or less when purchased are considered to be cash equivalents.
H. Investments
Investments are reported at fair value. The fair value of the pooled investments is based on current marketprices. Securities traded on a national or international exchange are valued at the last reported sales price atcurrent exchange rates. Investments that do not have an established market price are reported at estimatedfair value.
Interest and dividend income is recognized on the modified accrual basis, except for proprietary funds that areon the accrual basis. Changes in the fair value of investments are recognized as revenue on a monthly basis.
Income from pooled investments is allocated to the individual funds based on each fund's monthly averagedaily cash balance in relation to the total pooled investments. City management has determined that theinvestment income related to certain funds should be allocated to the General Fund. This is the case forcertain special revenue funds. Income from non-pooled investments is recorded based on the specificinvestments held by the fund. All other interest income is recorded in the fund that earned the interest.
I. Accounts/Notes Receivable
Accounts Receivable of the major and nonmajor governmental and proprietary funds and fiduciary funds as ofJune 30, 2005, are reported in the accompanying basic financial statements net of allowance for doubtfulaccounts, as follows:
The Water Utility Funds' assets and revenues include $6,671,005 for water sales delivered, but unbilled at June30, 2005.
The Community Services Department provides many loans to homeowners through Housing and UrbanDevelopment financing. The loans are placed on each homeowner's title as a lien against the property namingthe City as the lienholder. Dependent upon the homeowner's qualification, an affordability period (from 5 to 20years) is determined. Each lien is forgiven evenly over the determined affordability period. The City onlyreceives a payoff if a property is sold prior to the end of the affordability period (some sales do not result inpayment to the City). Less than 10% of these liens have resulted in payoffs to the City in the past 5 years andhave totaled approximately 5% of the original loans. As of June 30, 2005, these loans totaled $7,214,072. Dueto the immateriality and infrequent payoff of these loans, notes receivable are not recorded, and the revenuesfor such amounts are recorded when payments are received.
OtherNonmajor Internal Environmental Water Non-Major
General Governmental Services Services Utility Enterprise FiduciaryFund Funds Funds Fund Fund Fund Funds
Accounts Receivable $ 15,739,385 $ 12,763,072 $ 220,925 $ 2,990,428 $ 15,906,700 $ 4,096 $ 2,924,700 Less: Allowance for Doubtful Accounts 1,406,309 625,971 80,381 279,534
$ 14,333,076 $ 12,137,101 $ 220,925 $ 2,910,047 $ 15,627,166 $ 4,096 $ 2,924,700

CITY OF TUCSON, ARIZONANOTES TO BASIC FINANCIAL STATEMENTS
For the Year Ended June 30, 2005
37
Note 1 - SUMMARY OF SIGNIFICANT ACCOUNTING POLICIES (Continued):
J. Inventories/Prepaids
Inventories and prepaid items are reported using the consumption method. Inventories of the governmentaland enterprise funds consist primarily of expendable supplies held for consumption. These inventories aremaintained on a perpetual system and are primarily valued using the weighted-average cost method, which isnot in excess of market. At the time inventories/prepaids are consumed, expenditures are recorded in thegovernmental funds and expenses are recorded in the enterprise funds. In the governmental funds, areservation of fund balance is established for the inventory amount. Certain payments to vendors reflect costsapplicable to future accounting periods and are recorded as prepaid items. A reservation of funds isestablished for prepaid items that are material.
K. Restricted Assets/Liabilities
In accordance with applicable covenants of enterprise fund bond issues or other agreements, appropriateassets and liabilities have been restricted. When both restricted and unrestricted resources are available foruse, it is the City's policy to use restricted resources first, then unrestricted resources, as they are needed.
L. Capital Assets
Capital assets, which include property, equipment, buildings, and infrastructure assets (such as roads, bridges,curbs and gutters, streets and sidewalks, drainage systems, and lighting systems), are depreciated andreported in the applicable governmental or business-type activity columns in the government-wide financialstatements. No capital assets or depreciation are shown in the governmental fund financial statements.
Capital assets have an estimated useful life greater than one year and are valued at historical cost or estimatedhistorical cost if actual historical cost is not available. The estimated useful lives for City assets are determinedon a variety of methods that include engineering estimates, industry standards, and replacement cycles.Additions subsequent to that date are stated at cost. Donated capital assets are valued at their estimated fairvalue on the date donated. The capitalization threshold for equipment is $5,000.
The cost of normal maintenance and repairs that do not add to the value of the asset or materially extend assetlives is not capitalized. Construction of capital assets and improvements are capitalized when the project iscompleted.
Capital assets are depreciated using the straight-line method over the following estimated useful lives. Landand construction-in-progress are not depreciated.
The City's policy is to capitalize interest on proprietary fund capital projects if it is material, based upon theweighted-average interest method. No interest costs have been capitalized during the fiscal year in the WaterUtility, Environmental Services, or Golf Course Funds as the amounts were not material. Interest on generalgovernment capital projects is not capitalized.
Neither the Water Utility Fund, the Environmental Services Fund, nor the Golf Course Fund levies specialassessments to construct or purchase capital assets.
Buildings and Building Improvements 20-40Improvements Other Than Buildings 10-40Wells, Tanks and Improvements 40-100Machinery and Equipment 3-20
Estimated Useful Life (Years)

CITY OF TUCSON, ARIZONANOTES TO BASIC FINANCIAL STATEMENTS
For the Year Ended June 30, 2005
38
Note 1 - SUMMARY OF SIGNIFICANT ACCOUNTING POLICIES (Continued):
M. Goodwill and Water Rights
Enterprise fund goodwill is recorded upon acquisition of water companies or golf courses and represents theexcess of cost over the fair market value at the time of acquisition. Goodwill is being amortized over forty (40)years on the straight-line method. The total goodwill and the amount amortized at June 30, 2005, were$1,122,154/$963,075 and $65,184/$60,285 for the Water Utility Fund and Golf Course Fund, respectively.
Water rights are recorded at historical cost and amortized over 40 years using the straight-line method. Totalwater rights and the amount amortized at June 30, 2005 were $749,157/$23,415 for the Water Utility Fund.
N. Long-term Obligations
In the government-wide financial statements and for the proprietary fund types in the fund financial statements,long-term debt and other long-term obligations are reported as liabilities in the applicable governmentalactivities, business-type activities, or proprietary fund type Statement of Net Assets. Bond premiums anddiscounts, as well as issuance costs and the difference between the reacquisition price and the net carryingamount of the old debt, are deferred and amortized over the life of the bonds using the straight-line method.Bonds payable are reported net of the applicable bond premium or discount.
In the fund financial statements, governmental fund types recognize bond premiums and discounts, as well asbond issuance costs, during the current period. The face amount of debt issued is reported as other financingsources. Premiums received on debt issuances are reported as other financing sources, while discounts arereported as other financing uses. Issuance costs, whether or not withheld from the actual debt proceedsreceived, are reported as debt service expenditures.
The amount capitalized under capital leases is the lesser of the present value of the minimum lease paymentsor the fair value of the leased properties at the beginning of the respective lease terms. When a governmentalfund type acquires a capital asset through a capital lease agreement, the acquisition is reflected as anexpenditure and other financing source. Capitalized leases of proprietary funds are accounted for entirelywithin the respective proprietary fund by capitalizing the asset acquired and recording the lease obligation as aliability.
Bonds and other long-term liabilities expected to be financed from proprietary fund operations are accountedfor in those funds.
Compensated absences are recognized as fund liabilities to the extent the liabilities mature or come due forpayment each period in the governmental fund statements. These costs are accrued and reported as liabilitiesin the Statement of Net Assets.
O. Fund Equity
In the fund financial statements, governmental funds report reservations of fund balance for amounts that arenot available for appropriation or are legally restricted by outside parties to use for a specific purpose.Designations of fund balance represent tentative management plans that are subject to change.
1. In addition to the reserves for inventories, the City has established other reservations of fund balances asfollows:
Reserved for Debt Service represents amounts maintained under the provisions of various bondordinances or amounts reserved for future debt service requirements.

CITY OF TUCSON, ARIZONANOTES TO BASIC FINANCIAL STATEMENTS
For the Year Ended June 30, 2005
39
Note 1 - SUMMARY OF SIGNIFICANT ACCOUNTING POLICIES (Continued):
Reserved for Capital represents the following: proceeds from capital lease agreements to be used forvarious capital projects and other various construction projects in the General Fund ($23,573,238); fundsreserved for equipment purchases and construction projects ($4,523,908) in the Special Revenue Funds;and bond proceeds reserved for construction projects ($40,266,140) in the Capital Project Funds.
Reserved for Advances and Deposits represent amounts the City has advanced to or deposited withoutside agencies or other funds.
Reserved for Employees' Retirement Benefits represents the equity of the Tucson SupplementalRetirement System ($559,142,198) and the Deferred Compensation Fund ($70,345,855), which arereserved for future payments to their respective members.
Reserved for Other Purposes represents amounts reserved for purposes designated by contributors in thespecial revenue and permanent funds; reserves for grant compliance purposes; reserves for prepaidexpenditures in various special revenue funds; and reserves for the following purposes in the GeneralFund:
2. The City had the following designations of unreserved fund balance in the General Fund as of June 30,2005:
P. Interfund Transactions
Transactions that would be treated as revenue, expenditures or expenses if they involved organizationsexternal to the governmental unit are accounted for as revenue, expenditures or expenses in the fundsinvolved. Transactions which constitute reimbursements of a fund for expenditures or expenses initially madefrom that fund which are properly applicable to another fund are recorded as expenditures or expenses in thereimbursing fund and as reductions of the expenditures or expenses in the fund that is reimbursed.
Generally, the effect of interfund activity has been removed from the government-wide financial statements.Net interfund activity and balances between governmental activities and business-type activities are shown inthe Statement of Net Assets as Internal Receivables/Payables. The "doubling-up" effect of internal servicefund activity has been removed by adjusting the expenses shown in the various functions within the Statementof Activities.
City Courts Projects $ 809,977Police Projects 532,294Low Income Housing Maintenance 636,755Civano 234,026Information Technology 115,292Community Resources Center 96,118Open Spaces 43,785Communications 911 23,056Total General Fund Reserved for Other Purposes $ 2,491,303
Carry Forward Designation $ 8,213,700Emergency Communications 4,477,946Development Services 2,061,598Neighborhood/Community Reinvestment 953Total General Fund Designated $ 14,754,197

CITY OF TUCSON, ARIZONANOTES TO BASIC FINANCIAL STATEMENTS
For the Year Ended June 30, 2005
40
Note 1 - SUMMARY OF SIGNIFICANT ACCOUNTING POLICIES (Continued):
Q. Donor-Restricted Endowments
The City receives gifts and donations from individuals/organizations to support various City functions. The netappreciation of investments was $53,829 and is included in restricted net assets as Expendable PermanentEndowments ($3,118) and as Restricted for Other Purposes ($50,711). Investment income is expended basedon restrictions conveyed in the endowment agreements. If agreements do not stipulate the use of investmentincome, it is used to cover administrative costs. There are no state laws governing the expenditure ofinvestment income for City donations.
R. Use of Estimates
The preparation of basic financial statements in conformity with generally accepted accounting principlesrequires management to make estimates and assumptions that affect the reported amounts of assets andliabilities and disclosure of contingent assets and liabilities at the date of the financial statements and thereported amounts of revenue and expenses/expenditures during the reporting period. Actual results coulddiffer from those estimates.
Note 2 - ACCOUNTING RESTATEMENTS:
On July 1, 2004, the City changed the reporting of the Environmental Service Fund from a special revenue to anenterprise fund. This change resulted in a fund reclassification for governmental activities and business-typeactivities. The change to the governmental activities resulted in an adjustment to Invested in Capital Assets, Net ofRelated Debt, in the amount of ($534,055) and an adjustment to Unrestricted Net Assets of $48,913,711. The fundreclassification resulted in a decrease ($2,292,713) to unreserved fund balance in the non-major governmentalfunds. The change to the business-type activities resulted in an adjustment to Invested in Capital Assets, Net ofRelated Debt, in the amount of $7,474,257 and an adjustment to Unrestricted Net Assets of $56,922,023.
A review of the federal transit authority grants resulted in recognition of prior year revenue for authorized grantexpenditures. This resulted in a prior period adjustment to Unrestricted Net Assets in the amount of $1,896,505.
During a reconciliation of the capital assets within the Government activities, adjustments were required to correctprior year capitalization errors. This resulted in a prior period adjustment to Invested in Capital Assets, Net ofRelated Debt, in the amount of ($7,076,830.)
The impact of all the accounting restatements to Governmental activities discussed above is summarized below:
RestatedJuly 1 July 1
Net Assets:Invested in Capital Assets, Net of Related Debt 1,002,677,211$ 996,134,436$ Restricted For:
Debt Service 11,200,169 11,200,169 Capital Projects 5,711,957 5,711,957 Housing Programs 9,040,055 9,040,055 Other Purposes 43,313,979 43,313,979 Permanent Endowments Expendable 8,072 8,072 Unexpendable 142,456 142,456
Unrestricted (Deficit) (28,273,562) 22,536,654 Total Net Assets 1,043,820,337$ 1,088,087,778$
Governmental Activities:

CITY OF TUCSON, ARIZONANOTES TO BASIC FINANCIAL STATEMENTS
For the Year Ended June 30, 2005
41
Note 2- ACCOUNTING RESTATEMENTS (Continued):
The impact of the fund reclassification to Business-type activities is summarized below:
The City implemented GASB Statement No. 40, Deposit and Investment Risk Disclosures, for fiscal year 2005.There was no impact to the financial statements. See financial statement Note 5 Deposits and Investments.
Note 3 - PROPERTY TAX:
Property taxes are levied and collected by the Pima County Treasurer on behalf of the City. Property taxes arelevied no later than the third Monday in August and are payable in two installments. Taxes become delinquent afterthe first business days of November and May, respectively, and a lien against the assessed property attaches ifpayments are not received by those dates.
The State Constitution and State law specify a property tax levy limitation system. The system consists of twolevies: a limited levy known as the primary property tax levy and an unlimited levy referred to as the secondary levy,which may be used only to retire bond indebtedness.
The primary property tax levy is limited to an increase of 2% over the previous year's maximum allowable primarylevy, plus an increased dollar amount due to a net gain in property not taxed the previous year. Also, the primaryproperty tax from all taxing jurisdictions for homeowners may not exceed 1% of their homes' market values. If thecombined primary property tax (for the City, County, etc.) exceeds 1% of the market value of the homes, the schooldistricts will reduce their rates until the homeowners' aggregate rate is equal to or less than the allowable 1%. TheState will then subsidize the school districts for the reduced revenue. This 1% limitation applies to primary propertytaxes and does not affect the secondary property tax levy.
There is also a control on the assessed value of property for primary tax purposes. The base year for the taxsystem is fiscal year 1978-79. From this base year, two assessed values evolve. The primary assessed values arecontrolled by being allowed to grow or increase by no more than 10% a year. The dollar amount of the secondaryproperty tax levy is unlimited, and the actual full cash value of property is used in determining the tax rate.
RestatedJuly 1 July 1
Net Assets:Invested in Capital Assets, Net of Related Debt 569,483,745$ 576,958,002$ Restricted For:
Debt Service 31,996 31,996 Capital Projects 2,638,662 2,638,662
Unrestricted (Deficit) 36,939,484 (19,982,540) Total Net Assets 609,093,887$ 559,646,120$
Business-type Activities

CITY OF TUCSON, ARIZONANOTES TO BASIC FINANCIAL STATEMENTS
For the Year Ended June 30, 2005
42
Note 4 - INDIVIDUAL FUND DISCLOSURES:
At June 30, 2005, the following funds had deficit fund balances/net assets:
The deficit in the Special Assessment Construction Capital Projects Fund is due to the project expenditures beingincurred prior to the sale of the bonds. The deficit in the Self Insurance Internal Service Fund will be funded byincreases to user charges in future years. The deficit in the Environmental Services Fund will be funded byincreases to user charges in future years. The deficit in the Development Fee Fund is due to the construction of aroad leading to a school prior to the start of collection for development fees. The deficit will be funded by impactfees collected beginning in Fiscal Year 2006.
Note 5 - DEPOSITS AND INVESTMENTS:
The City maintains an investment pool that is available for use by all City funds. Each fund's portion of this pool isreported on the financial statements as "Pooled Cash and Investments." A single master custodian holds all assetsof the investment pool. In addition, certain cash deposits and investments are also held separately by various Cityfunds in separate accounts.
The majority of deposits and investments of the Tucson Supplemental Retirement System (TSRS) Fund and theCity of Tucson Employees Voluntary Deferred Compensation Fund are held separately from those of other Cityfunds by a master custodian. However, biweekly contributions to these two funds are held in the investment pool tocover recurring expenditures.
A. Deposits
At year-end, the book value of the City's cash and deposits was $923,959,016 and the bank balance was$893,155,919. The difference of $30,803,097 represents deposits in transit, outstanding checks, and otherreconciling items at June 30, 2005. This total bank balance was covered by federal depository insurance orcollateral held by the City's agents in the City's name.
Cash with fiscal agents in the General Fund $24,843,838, the other non-major governmental funds $30,584,364,and the enterprise funds $17,688,470 on June 30, 2005, were covered by collateral held in the fiscal agents' trustdepartments but not in the City's name. Each trust department pledges a pool of collateral against all trust depositsit holds.
B. Investments
For the City investment pool, the City Charter and State Statutes authorize the City to invest in obligations of theU.S. Government, its agencies and instrumentalities, money market funds consisting of the above, repurchaseagreements, bank certificates of deposit, commercial paper rated A-1/P-1, corporate bonds and notes rated AAA orAA, and the State of Arizona Local Government Investment Pool. Operating and capital projects funds may beinvested for a maximum of 3 years based on projected construction schedules.
The Tucson Supplemental Retirement System (TSRS) and the Deferred Compensation Fund are trusts eachgoverned by separate management boards. The City Code provides that these boards will make investments inaccordance with the “prudent person rule” and each board has approved investment policies. The DeferredCompensation Board authorizes investments in U.S. government obligations and agency issues, corporate bonds,real estate, and money market funds.
Development Fee Fund $ (3,306,894) Special Assessment Construction Fund $ (3,680,590) Self Insurance Fund $ (29,794,105) Environmental Services Fund $ (49,076,344)

CITY OF TUCSON, ARIZONANOTES TO BASIC FINANCIAL STATEMENTS
For the Year Ended June 30, 2005
43
Note 5 - DEPOSITS AND INVESTMENTS (Continued):
The Tucson Supplemental Retirement System Board authorizes domestic and foreign investments including U.S.Government obligations and agency issues, corporate bonds, stocks, real estate, and money market funds. Theinvestment policy also establishes the asset mix and target allocations for each asset class permitted.
Short-term investments for these trusts may be made up of commercial paper, time deposits, guaranteed insurancecontracts, money market funds or any other short-term investment fund (STIF) vehicle permitted.
The City's deposits and investments for all funds at fiscal year-end are listed below. These deposits andinvestments are held by the City or its agents in the City's name and are either insured, registered or collateralized.A portion of these investments are subject to credit risk (including custodial credit risk and concentrations of creditrisk), interest rate risk and/or foreign currency risk which are all discussed in the sections that follow.
Fair ValueU.S. Issues: U.S. Treasury Notes & Bonds not on Securities Loan 23,454,991$ U.S. Agency & Other Bonds not on Securities Loan 162,511,639 Corporate Bonds not on Securities Loan 51,543,493 Corporate Stock not on Securities Loan 270,263,394 Non-U.S. Issues: International Bonds not on Securities Loan 372,707 International Stock not on Securities Loan 74,432,876
582,579,100
Investments Held by Broker-Dealers Under Securities Loans with Cash Collateral: U.S. Treasury Notes & Bonds 12,366,029 U.S. Agency & Other Bonds 9,390,643 U.S. Corporate Bonds 2,983,486 U.S. Stock 14,517,023 International Bonds 144,120 International Stock 6,611,255
46,012,556
Securities Lending Short-Term Collateral Investment Pool 47,449,522 Money Market Funds/Short-Term Investments 112,759,285 Bond Mutual Funds 74,123,361 Real Estate 30,232,095
264,564,263
Total Deposits and Investments 893,155,919$
City of Tucson Deposits and Investments

CITY OF TUCSON, ARIZONANOTES TO BASIC FINANCIAL STATEMENTS
For the Year Ended June 30, 2005
44
Note 5-DEPOSITS AND INVESTMENTS (Continued):
C. Credit Risk
As defined by the Governmental Accounting Standards Board (GASB) in Statement 40, credit risk is the risk that anissuer or other counterparty to an investment will not fulfill its obligations. Associated with credit risk isconcentration of credit risk and custodial credit risk. Concentration of credit risk is the risk of loss attributed to themagnitude of a government’s investment in a single issuer. Custodial credit risk for deposits is the risk that, in theevent of the failure of a depository financial institution, a government will not be able to recover deposits or will notbe able to recover collateral securities that are in the possession of an outside party. The custodial credit risk forinvestments is the risk that, in the event of the failure of the counterparty to a transaction, a government will not beable to recover the value of investment or collateral securities that are in the possession of an outside party.
The City has the following investment policies governing the City investment pool account that addresses thevarious credit risks defined above. Investments shall be limited to the following instruments and percentages:
• Obligations of the U.S. Government, its agencies and instrumentalities• Repurchase agreements whose underlying collateral is commercial paper rated A-1/P-1 with maturities not to
exceed 180 days or rated A-2/P-2 with maturities not to exceed 60 days• Bonds, notes and debentures issued by U.S. corporations rated “AAA” or “AA” by Moody’s and Standard &
Poors• Money market funds, CD’s, etc., either insured by an agency of the federal government or collateralized by
obligations of the U.S. Government, its agencies and instrumentalities or General Obligation municipal bondsrated A or better at 105% of the amount on deposit calculated on market values. The collateral must be held bythe Trust department of the financial institution or delivered to the City’s agent
• Except for direct obligations of the U.S. Treasury, not more than 25% of the portfolio shall be invested insecurities issued by a single agency or instrumentality of the United States. Not more than 5% of the portfolioshall be invested in securities of any other entity
• A minimum of 15% of the portfolio shall be in highly liquid securities• Not more that 25% of the portfolio shall be invested in corporate bonds, notes and commercial paper
The City’s investment pool account had the following credit risk structure as of June 30, 2005:
Investment Type
Credit Rating
(1) Fair ValuePercent of
Grand TotalMoney Market Funds:Wells Fargo Treasury Plus MM AAA 65,163,574$ 43.55%
Corporate Bonds:Citigroup Inc. Senior Global Nts AA3 5,059,350 Sallie Mae Mid Term Note A2 4,978,850
10,038,200 6.71%
Federal Agency:Federal Home Loan Mortgage Corp AAA 14,408,124 9.63%Federal Home Loan Bank AAA 20,357,278 13.61%Federal Farm Credit Bank AAA 24,684,400 16.50%Federal National Mortgage Corp AAA 14,962,550 10.00%
74,412,352
Grand Total 149,614,126$ 100.00%(1) Per Moody's
Investment Pool AccountCredit Risk Structure

CITY OF TUCSON, ARIZONANOTES TO BASIC FINANCIAL STATEMENTS
For the Year Ended June 30, 2005
45
Note 5- DEPOSITS AND INVESTMENTS (Continued):
The City also maintains funds in specific accounts outside of the investment pool account to meet certainoperational and legal requirements. As of June 30, 2005 these funds consisted of: a U.S. Treasury Note with a fairmarket value of $18,586,455, a U.S. Agency Bond with a fair market value of $1,244,504 and several cash balanceaccounts totaling $32,461,598. The City of Tucson banking policy for these cash accounts are consistent with theinvestment pool account policy described above.
The TSRS fund presently maintains one internally managed and one externally managed fixed income (bond)account, which are exposed to some form of credit risk. The investment policy guidelines for securities purchasedfor the internally managed fixed income account are as follows:
• With the exception of securities issued by or guaranteed by the U.S. Treasury or U.S. Government agenciesand instrumentalities, the maximum position in a single issuer’s securities should not exceed 5% of theportfolio’s assets at current market value.
• Exposure to corporate bonds should be limited to 50% of the portfolio• The investment manager is expected to maintain a weighted average bond portfolio quality rating of at least
“AA”• Securities, at the time of purchase, shall be rated no lower than “A3” by Moody’s and “A-“ by Standard & Poors
The TSRS Board has given the external fixed income manager discretion to invest in a broad array of public andprivate asset classes, instruments and investment vehicles in order to meet or exceed the agreed upon investmentreturn benchmark. However, the following specific investment policy guidelines pertain to the external fixed incomemanager:
• The maximum position in a single issuer (excluding obligations of U.S. Government and its Agencies) shouldnot exceed 5% of the portfolio’s assets at current market value
• The portfolio should maintain an average quality of a least “A”• Money market instruments must be rated in one of the two highest categories by a nationally recognized rating
agency• The minimum rating of individual issues should be CCC as rated by Moody’s, Standard & Poors or Fitch• Should an issue be downgraded below the minimum, the manager will determine the appropriate action to be
taken
The Deferred Compensation Fund maintains one internally managed fixed income account with an investmentpolicy consistent with the internally managed TSRS fixed income account.

CITY OF TUCSON, ARIZONANOTES TO BASIC FINANCIAL STATEMENTS
For the Year Ended June 30, 2005
46
Note 5- DEPOSITS AND INVESTMENTS (Continued):
The TSRS and Deferred Compensation funds had the following credit risk structure as of June 30, 2005:
Investment Type Holdings
Moody's Average Credit
Rating Fair Value Percent of
Grand TotalCash and Cash Equivalents:Short Term Invesment Fund 1 AA3 1,469,620$ U.S. Treasury Bills - Less than 1 Year 2 AAA 1,051,855 U.S. Agency Issue - Less than 1 Year 1 AAA 198,357
Sub Total 4 2,719,832 1.64% U.S. Treasury Issues 8 AAA 8,015,621 4.83%
U.S. Agency & Other Government Obligations 68 AA1 57,411,362 34.61%
Call Options 2 N/R 25,375 0.01%
U.S. Corporate Bonds:CMO Corporate 2 AAA 558,568 Banks & Finance 16 A2 12,915,904 Industrials 11 A3 9,558,898 Utilities 2 BAA1 554,060
Sub Total 31 23,587,430 14.22%
International Bonds 2 BA2 516,827 0.31%
Fixed Income Swaps 30 N/R (521,947) -0.31%
Bond Mutual Funds 4 AAA - B 74,123,360 44.69%
Grand Total 149 165,877,860$ 100.00%
Investment Type Holdings
Moody's Average Credit
Rating Fair Value Percent of
Grand TotalU.S. Treasury Issues 6 AAA 7,974,440$ 11.50%
U.S. Agency & Other Government Obligations 33 AAA 41,046,129 59.21%
U.S. Corporate Bonds:Banks & Finance 17 A1 15,195,224 Industrials 6 A3 4,077,697 Utilities 2 A3 1,024,840
Sub Total 25 20,297,761 29.29%
Grand Total 64 69,318,330$ 100.00%
Tucson Supplemental Retirement System (TSRS)
Deferred Compensation Fund
Fixed Income AccountsCredit Risk Structure

CITY OF TUCSON, ARIZONANOTES TO BASIC FINANCIAL STATEMENTS
For the Year Ended June 30, 2005
47
Note 5 - DEPOSITS AND INVESTMENTS (Continued):
D. Interest Rate Risk
As defined by the Governmental Accounting Standards Board (GASB) in Statement 40, interest rate risk is the riskthat changes in interest rates will adversely affect the fair value of investments. For fixed income securities, there isan inverse relationship between the change in interest rates and their fair value. For example, in a rising interestrate environment the value of fixed income securities will tend to fall by varying degrees depending on the length oftheir maturities. In general, the value of fixed income securities with a longer duration will tend to decrease morethan shorter duration securities in a rising interest rate environment.
The City’s investment pool account maintains the following investment policy with regard to interest rate risk.
• Surplus and idle money related to the day-to-day operation of the City may be invested in authorizedinvestments with a final maturity not exceeding two years form the date of investment
• Monies not related to the day-to-day operation of the City may be invested for periods up to three years withmaturities base upon anticipated needs
• Not more than 25% of the portfolio shall be invested in securities with a maturity longer than two years• Not more than 50% of the portfolio shall be invested in securities with a maturity longer than eighteen months

CITY OF TUCSON, ARIZONANOTES TO BASIC FINANCIAL STATEMENTS
For the Year Ended June 30, 2005
48
Note 5 – DEPOSITS AND INVESTMENTS (Continued):
The City’s investment pool account had the following maturity structure as of June 30, 2005:
Investment TypeMaturity
DateNext Call Date (1) Fair Value
Percent of Grand Total
Money Market Funds:Wells Fargo Treasury Plus MM 65,163,574$ 43.55%Due in Less Than 1 YearCorporate Bonds:Citigroup Inc. Senior Global Nts 12/01/05 B 5,059,350 Sallie Mae Mid Term Note 12/01/05 B 4,978,850
10,038,200 Federal Agency:FFCB Coupon Notes 04/07/06 C 4,932,800 FHLB Coupon Notes 04/27/06 10/27/05 9,875,000 FNMA Coupon Notes 06/28/06 B 4,971,900
19,779,700$
Due in Less Than 1 Year 19.93%Due Between 1 & 2 YearsFederal Agency:FHLB Coupon Notes 06/30/06 B 4,953,150$ FHLMC Coupon Notes 10/06/06 B 4,541,073 FHLMC Coupon Notes 12/15/06 B 4,937,500 FFCB Coupon Notes 12/15/06 B 4,962,500 FFCB Coupon Notes 04/12/07 C 4,901,550 FHLMC Coupon Notes 04/27/07 10/27/05 4,929,550 FFCB Coupon Notes 06/06/07 B 4,921,900 FFCB Coupon Notes 06/15/07 B 4,965,650 FHLB Coupon Notes 06/29/07 C 1,307,566 FHLB Coupon Notes 06/29/07 B 4,221,563
44,642,002$ Due Between 1 & 2 Years 29.84%
Due in More Than 2 YearsFederal Agency:FNMA Coupon Notes 09/17/07 C 4,998,450$ FNMA Coupon Notes 02/25/08 C 4,992,200
9,990,650 Due in More Than 2 Years 6.68%
Grand Total 149,614,126$ 100.00%
(1) B=Bullet - Not called on designated call date, will run until maturity, unless sold C=Continuous - Callable anytime after initial call date
Investment Pool AccountMaturity Structure

CITY OF TUCSON, ARIZONANOTES TO BASIC FINANCIAL STATEMENTS
For the Year Ended June 30, 2005
49
Note 5 - DEPOSITS AND INVESTMENTS (Continued):
The TSRS and Deferred Compensation Fund’s investment policy regarding interest rate risk for the internallymanaged fixed income accounts is to limit duration to within two years (plus or minus) to their investmentperformance benchmark: the Lehman Brothers (LB) Government/Credit Bond Index. For the externally managedfixed income account for the TSRS Fund, the investment policy is to limit duration to within 30% of the custombenchmark which is defined as 70% LB Mortgage Index, 15% LB Credit Index, 15% LB High Yield Index.
The TSRS and Deferred Compensation funds had the following maturity structure as of June 30, 2005:
Investment Type Less Than 1 1 - 5 6 - 10 More Than Total Fair Short Term Investment Fund $ 1,469,620 $ $ $ $ 1,469,620
U.S. Treasury Issues 1,051,855 1,090,080 1,626,169 5,299,372 9,067,476
U.S. Agency & Other Government Obligations 5,212,907 4,398,149 16,502,065 31,496,599 57,609,720
Call Options 25,375 25,375
U.S. Corporate Bonds 3,158,628 10,627,604 4,792,330 5,008,868 23,587,430
International Bonds 144,225 372,602 516,827
Fixed Income Swaps 224,527 (383,072) (363,402) (521,947)
Bond Mutual Funds (6.7 yrs weighted average) 74,123,360
Total $ 11,062,610 $ 16,712,962 $ 22,537,492 $ 41,441,437 $ 165,877,861Average Modified Duration:
Internal Account 4.95 yrsExternal Account 3.54 yrs
Investment Type Less Than 1 1 - 5 6 - 10 More Than Total Fair U.S. Treasury Issues $ $ 4,987,740 $ 2,986,700 $ $ 7,974,440
U.S. Agency & Other Government Obligations 2,004,478 8,140,890 24,717,756 6,183,005 41,046,129
U.S. Corporate Bonds 3,416,200 14,242,271 2,639,291 20,297,762
Total $ 5,420,678 $ 27,370,901 $ 27,704,456 $ 8,822,296 $ 69,318,331 Average Modified Duration:
Internal Account 5.23 yrs
Fixed Income AccountsMaturity Structure
Investment Maturities (in Years)
Investment Maturities (in Years)
Tucson Supplemental Retirement System (TSRS)
Deferred Compensation Fund

CITY OF TUCSON, ARIZONANOTES TO BASIC FINANCIAL STATEMENTS
For the Year Ended June 30, 2005
50
Note 5 - DEPOSITS AND INVESTMENTS (Continued):
E. Foreign Currency Risk
As defined by the Governmental Accounting Standards Board (GASB) in Statement 40, foreign currency risk is therisk that changes in exchange rates will adversely affect the fair value of an investment or a deposit. The exposureto foreign currency risk is currently limited to some of the investments within the TSRS Fund. The TSRS Board hasgiven the Fund’s international equity managers discretion to invest in a broad array of common and preferredstocks, convertibles and warrants of companies headquartered outside of the United States in order to meet orexceed their agreed upon investment return benchmarks. However, the following specific investment policyguidelines pertain to these managers:
• Investments in any single country market should not exceed more than 4 times the weight of the country in thebenchmark index or 50% of portfolio assets, whichever is lower.
• If a country has a greater than 50% weight in the index, the maximum exposure to that country in the portfoliomay be as high as its weight in the index
• No more than 30% of each manager’s portfolio should be invested in “emerging markets” (i.e., markets that arenot included in the Morgan Stanley Capital International Europe, Australia and Far East index)
• Managers are permitted to enter into hedging strategies, including cross-currency hedges, using forwardcurrency exchange contracts and currency options
• Derivatives should not be used for the purpose of speculation or for leveraging the portfolio
The TSRS fund had the following foreign currency risk exposure as of June 30, 2005:
Currency Fair Value (1)Percent of
TotalAUSTRALIAN DOLLAR $ 842,456 0.15%
BRITISH POUND STERLING 13,294,825 2.39%
CANADIAN DOLLAR 1,379,523 0.25%
EURO CURRENCY UNIT 12,982,933 2.33%
HONG KONG DOLLAR 1,571,874 0.28%
JAPANESE YEN 7,614,425 1.37%
NEW ZEALAND DOLLAR 620,406 0.11%
NORWEGIAN KRONE 1,082,390 0.19%
SINGAPORE DOLLAR 436,099 0.08%
SOUTH KOREAN WON 2,017,456 0.36%
SWISS FRANC 2,737,144 0.49%
U.S. DOLLAR 511,629,955 91.99%
TOTAL $ 556,209,486 100.00%
(1) The majority of the asset value is held in equity securities
Tucson Supplemental Retirement System (TSRS)Foreign Currency Risk Exposure

CITY OF TUCSON, ARIZONANOTES TO BASIC FINANCIAL STATEMENTS
For the Year Ended June 30, 2005
51
Note 5 - DEPOSITS AND INVESTMENTS (Continued):
F. Securities Lending
The City Code, the Board of Trustees for the Tucson Supplemental Retirement System and the Board of Trusteesfor the Deferred Compensation Fund permit the custodian bank, Mellon Trust, to lend securities to broker-dealersand other entities. Each loan is executed with a simultaneous agreement to return the collateral for the samesecurities in the future. The custodian bank lends U.S. securities for collateral initially valued at 102% of the marketvalue plus any accrued interest. Non-U.S. securities are loaned for collateral initially valued at 105% of the marketvalue of the securities plus any accrued interest. Collateral is marked-to-market daily. If the market value of thepledged collateral falls below the specified levels, additional collateral is required to be pledged by the close of thenext business day.
In the event of a borrower's default, the custodian bank is obligated to indemnify the lender if, and to the extent that,the fair value of the collateral is insufficient to replace the loaned securities. Mellon Trust's responsibilities includeperforming appropriate borrower and collateral investment credit analysis, demanding adequate types and levels ofcollateral, and complying with applicable Department of Labor and Federal Financial Institutions ExaminationCouncil regulations covering securities lending.
Although the average term of the security loans is one week, each loan can be terminated at will by either thelender or the borrower. Cash collateral is invested in a short-term investment pool, which on average had aweighted maturity of 30 days. The relationship between the maturities of the investment pool and the security loansare affected by the maturities of the loans made by other entities that use the agent's pool.
The lender cannot pledge or sell collateral securities received until, and unless, a borrower defaults. There were nosignificant violations of legal or contractual provisions and no borrower or lending agent default losses known to thesecurities lending agent. As of June 30, 2005, the lenders had no credit risk exposure to borrowers because thefair value of collateral held exceeded the fair value of securities loaned.
G. Derivatives
The Tucson Supplemental Retirement System permits the use of foreign exchange contracts by its internationalequity and external fixed income managers. Derivatives are also permitted in the portfolio, including financialfutures, forwards, options and swaps on fixed income securities.
Forward foreign exchange contracts for the purchase or sale of foreign currency were entered into to settle specifictransactions, for investment and hedging purposes and to modify the foreign currency exposure of internationalsecurities held. The duration of these contracts typically was three months or less and, for those used to settlespecific transactions, typically was three business days. During the terms of such forward contracts, the Systemwas exposed to counterparty risk, which is the risk of loss of the amount expected to be delivered under a forwardagreement in the event of the default or bankruptcy of a forward agreement counterparty. This risk is controlledthrough dealing with a number of different counterparties reasonably deemed to be creditworthy by the manager.
The System also permits the use of financial futures and options by its external fixed income manager to reduce oreliminate undesirable/unintended risks, to maintain desirable risks so as to improve the portfolio’s return patterns,and to enhance portfolio liquidity, flexibility and/or efficiency. The external fixed income manager used long andshort positions in exchange-traded government futures during the year to modify exposure to various parts of theyield curve and to modify the risk characteristics of the portfolio. The government futures positions were fullysupported by cash and cash equivalents. The net market exposure as of June 30, 2005 was $2,990,306.Additionally, forward and mortgage “to be announced” securities (TBAs) were used in the portfolio during theperiod; the net market value of these positions was $3,246,732 and $5,472,750, respectively. As of the same date,the portfolio contained net market exposure to put and call options (including swaptions) of $112,580.

CITY OF TUCSON, ARIZONANOTES TO BASIC FINANCIAL STATEMENTS
For the Year Ended June 30, 2005
52
Note 5 - DEPOSITS AND INVESTMENTS (Continued):
Interest rate swaps are used to provide high-grade agency/corporate exposure. Swaps also provide an effectiveand inexpensive means by which to quickly adjust portfolio duration, maturity mix and sector exposure. Swaps areover-the-counter transactions as opposed to being traded on an organized exchange. Counterparty risk is limitedby execution under standardized International Swap and Derivatives Association Agreements. These standardizedcontracts reduce legal risk and increase speed of execution that, in turn, improves liquidity. A swaption is simply anoption on a swap and is used for the same purposes as options and swaps. Credit default swaps provide attractivemeans of hedging event risk and increasing/decreasing credit exposure. These securities are backed by high-grade liquid securities and are subject to the System’s minimum quality and issuer limits. The portfolio held thefollowing net market exposure in swaps and credit default swaps of $(9,366,342) and 955,898, respectively.
Note 6 - INTERFUND BALANCES AND TRANSFERS:
The following governmental interfund receivables/payables are eliminated in the consolidation of the fundstatements and government-wide financial statements. The enterprise due from/to other funds balance is includedas Internal Receivable/Payable on the government-wide Statement of Net Assets.
There are interfund receivables/payables classified as Due from/to Other Agencies as listed below that are notincluded on the government-wide financial statements (Fiduciary Funds) on the Statement of Net Assets.
The Due from/to Other Agencies balances at June 30, 2005, were as follows:
Interfund InterfundFund Receivables Payables
Governmental Funds: General Fund $ 21,713,112 $ 6,838,635 Other Nonmajor Governmental Funds 6,838,635 21,713,112 Total Governmental Funds $ 28,551,747 $ 28,551,747
Due DueFund from to
Governmental Funds: General Fund $ 8,044,252 $ Other Nonmajor Governmental Funds 531,565 472,032 Total Governmental Funds 8,575,817 472,032 Internal Service Funds: Fleet Services Fund 66 Self Insurance Fund 811 Total Internal Service Funds 877 Enterprise Funds: Environmental Services Fund 48,553 2,234 Golf Course Fund 11,092 Water Utility Fund 1,041,960 Total Enterprise Funds 48,553 1,055,286 Fiduciary Funds: Deferred Compensation 46,348 Supplemental Retirement Fund 1,652 Total Fiduciary Funds 48,000
Total All Funds $ 8,624,370 $ 1,576,195

CITY OF TUCSON, ARIZONANOTES TO BASIC FINANCIAL STATEMENTS
For the Year Ended June 30, 2005
53
Note 6- INTERFUND BALANANCES AND TRANSFERS (Continued):
The Advances to/from Other Funds are long-term loans for capital expenditures, which have not been reimbursed,between the General Fund and the Special Assessment Capital Project, and Development Fee Funds. Thesebalances are eliminated in the consolidation of the government-wide financial statements.
Advances to/from Other Funds balances at June 30, 2005, were as follows:
Transfers are primarily: 1) to move receipts restricted to debt service from the funds collecting the receipts to thedebt service funds when payment is due, 2) capital assets purchased by one fund for another fund, and 3)operational subsidies from the General Fund to various funds. All transfers are consistent with the operation of thegovernmental funds. Transfers made during the year ended June 30, 2005, were as follows:
Transfers TransfersFund to from
Governmental Funds: General Fund $ 59,769,496 $ 2,726,435 Other Nonmajor Governmental Funds 13,646,437 62,579,246Total Governmental Funds 73,415,933 65,305,681
Internal Service Funds: Fleet Services Fund 4,366,854 Self Insurance Fund 228,424Total Internal Service Funds 228,424 4,366,854Enterprise Fund: Environmental Services Fund 2,292,713 6,269,535 Water Utility Fund 5,000Total Enterprise Fund 2,297,713 6,269,535Total All Funds $ 75,942,070 $ 75,942,070
Advances Advances Fund to from
Governmental Funds: General Fund $ 7,180,590 $ Other Nonmajor Governmental Funds 7,180,590 Total Governmental Funds $ 7,180,590 $ 7,180,590

CITY OF TUCSON, ARIZONANOTES TO BASIC FINANCIAL STATEMENTS
For the Year Ended June 30, 2005
54
Note 7 - CAPITAL ASSETS:
The following is a summary of changes in capital assets as of June 30, 2005:
RestatedBeginning Ending Balance Additions Retirements Balance
Governmental Activities:Land $ 620,260,731 $ 8,972,287 $ (3,458,743) $ 625,774,275 Construction-in-Progress 141,128,362 81,453,874 (32,084,920) 190,497,316
Capital Assets being Depreciated:Buildings and Improvements 354,319,483 10,698,186 (1,695,752) 363,321,917 Equipment 169,517,871 18,419,803 (6,081,856) 181,855,818 Infrastructure 657,563,819 17,562,096 675,125,915
Totals at Historical Cost 1,942,790,266 137,106,246 (43,321,271) 2,036,575,241 Less Accumulated Depreciation for:
Buildings and Improvements 134,464,544 11,963,662 (535,159) 145,893,047 Equipment 109,698,224 15,761,583 (5,821,065) 119,638,742 Infrastructure 294,464,197 15,804,821 310,269,018
Total Accumulated Depreciation 538,626,965 43,530,066 (6,356,224) 575,800,807 Governmental Activities Capital Assets, Net $ 1,404,163,301 $ 93,576,180 $ (36,965,047) $ 1,460,774,434
Business-Type Activities:Land $ 57,860,728 $ 229,137 $ (2,359,747) $ 55,730,118 Construction-in-Progress 138,667,756 40,443,559 (25,943,980) 153,167,335
Capital Assets Being Depreciated:Buildings and Improvements 142,073,852 967,071 143,040,923 Equipment 56,970,759 3,431,754 (2,245,154) 58,157,359 Distribution and Collection Systems 836,781,004 30,316,347 (1,871,310) 865,226,041
Totals at Historical Cost 1,232,354,099 75,387,868 (32,420,191) 1,275,321,776 Less Accumulated Depreciation for:
Buildings and Improvements 35,059,980 5,906,825 40,966,805 Equipment 29,939,408 7,060,885 (2,099,912) 34,900,381 Distribution and Collective Systems 210,875,199 14,899,051 (986,489) 224,787,761
Total Accumulated Depreciation 275,874,587 27,866,761 (3,086,401) 300,654,947 Business-Type Activities Capital Assets, Net $ 956,479,512 $ 47,521,107 $ (29,333,790) $ 974,666,829
Depreciation expense was charged to governmental functions as follows:Elected and Official $ 146,571 Support Services 7,029,823 Neighborhood Services 12,199,730 Environment and Development 23,013,436 Strategic Initiatives 484,190 Non-Departmental 656,316
Total Depreciation Expense $ 43,530,066

CITY OF TUCSON, ARIZONANOTES TO BASIC FINANCIAL STATEMENTS
For the Year Ended June 30, 2005
55
Note 7 - CAPITAL ASSETS (Continued):
Note 8 - CHANGES IN LONG-TERM DEBT:
The following is a summary of changes in long-term debt as of June 30, 2005:
Discretely presented component unit:Activity for the Rio Nuevo District for the fiscal year ended June 30, 2005, was as follows:
Beginning Ending Balance Additions Retirements Balance
Component Unit:Land $ 8,275,461 $ 1,095,240 $ - $ 9,370,701 Construction-in-Progress 4,608,501 7,010,459 - 11,618,960
Capital Assets being Depreciated:Buildings and Improvements 29,488,169 105,681 - 29,593,850 Equipment 59,583 - - 59,583
Totals at Historical Cost 42,431,714 8,211,380 50,643,094 Less Accumulated Depreciation for:
Buildings and Improvements 1,551,530 734,653 2,286,183 Equipment 22,089 9,917 32,006
Total Accumulated Depreciation 1,573,619 744,570 2,318,189 District Capital Assets, Net $ 40,858,095 $ 7,466,810 $ $ 48,324,905
RestatedBeginning Ending Amounts DueBalance Additions Reductions Balance Within One Yr.
Governmental Activities:Bonds and Notes Payable:General Obligation Debt $ 239,790,152 $ 63,724,606 $ (54,717,576) $ 248,797,182 $ 9,695,000Street & Highway Revenue Bonds 156,475,000 45,995,000 (48,955,000) 153,515,000 9,250,000Certificates of Participation 43,335,000 51,700,000 (5,160,000) 89,875,000 6,040,000Federal Highway Loan 2,100,000 (800,000) 1,300,000 1,300,000Special Assessment Bonds 4,028,500 (452,900) 3,575,600 441,600Deferred Amount:
on Premiums 8,131,271 8,054,895 (1,071,381) 15,114,785on Discounts (140,446) 7,392 (133,054)on Refundings (6,617,419) (3,946,020) 838,594 (9,724,845)
Total Bonds and Notes Payable 447,102,058 165,528,481 (110,310,871) 502,319,668 26,726,600
Other Liabilities:Claims and Judgments 39,712,642 24,312,447 (18,960,319) 45,064,770 10,029,456Compensated Absences 25,614,453 18,970,650 (16,533,934) 28,051,169 16,642,991Contracts Payable 850,084 4,208,283 (397,088) 4,661,279 1,104,871 Total Other Liabilities 66,177,179 47,491,380 (35,891,341) 77,777,218 27,777,318
Governmental Activities Long TermLiabilities $ 513,279,237 $ 213,019,861 $ (146,202,212) $ 580,096,886 $ 54,503,918

CITY OF TUCSON, ARIZONANOTES TO BASIC FINANCIAL STATEMENTS
For the Year Ended June 30, 2005
56
Note 8- CHANGES IN LONG-TERM DEBT (Continued):
RestatedBeginning Ending Amounts DueBalance Additions Reductions Balance Within One Yr.
Business-type Activities:Bonds and Notes Payable:Enterprise Bonds $ 364,700,668 $ 89,849,180 $ (66,225,113) $ 388,324,735 $ 11,083,842General Obligation Debt 34,661,430 17,547,882 (9,822,425) 42,386,887Certificates of Participation 4,625,000 (305,000) 4,320,000 320,000Deferred Amount:
on Premiums 6,177,848 6,506,341 (456,172) 12,228,017on Discounts (41,400) 3,450 (37,950)on Refundings (7,184,949) (5,167,496) 538,397 (11,814,048)
Total Bonds and Notes Payable 402,938,597 108,735,907 (76,266,863) 435,407,641 11,403,842
Other Liabilities:Landfill Closure/Post Closure Costs 47,211,999 7,966,388 (12,642,717) 42,535,670 2,570,513Compensated Absences 4,510,697 2,435,490 (2,308,333) 4,637,854 2,614,386Contracts Payable 3,232,481 1,405,671 (1,588,736) 3,049,416 1,379,732
Total Other Liabilities 54,955,177 11,807,549 (16,539,786) 50,222,940 6,564,631
Business-type Activities Long TermLiabilities $ 457,893,774 $ 120,543,456 $ (92,806,649) $ 485,630,581 $ 17,968,473
Discretely presented component unit:Activity for the Rio Nuevo District for the fiscal year ended June 30, 2005, was as follows:
Beginning Ending Amounts DueBalance Additions Reductions Balance Within One Yr.
Component Unit Activities:Bonds and Notes Payable:Certificates of Participation $ 24,050,000 $ - $ (2,540,000) $ 21,510,000 $ 2,665,000
Deferred Amount: on Premiums 706,932 - (88,366) 618,566 -
District Activities Long TermLiabilities 24,756,932 - (2,628,366) 22,128,566 2,665,000

CITY OF TUCSON, ARIZONANOTES TO BASIC FINANCIAL STATEMENTS
For the Year Ended June 30, 2005
57
Note 9 - LEASE OBLIGATIONS:
A. Capital Leases
The City has entered into several long-term capital leases involving the acquisition of real estate and equipmentfor general city purposes; these commitments are expected to be funded by the City's General, SpecialRevenue and Internal Service Funds.
Below is a schedule by years of future minimum lease payments under the capital leases as of June 30, 2005.
Assets purchased through capital leases for Governmental Activities include buildings ($24,171,000),improvements other than buildings ($46,057), equipment ($7,924,403) and land ($9,950,000).
Assets purchased through capital leases for Business-Type Activities include equipment ($6,949,011).
B. Operating Leases
Operating lease expenditures for the fiscal year were $7,829,277. Minimum future lease payments on non-cancelable operating leases at June 30, 2005, were as follows:
General Years ending June 30, City Funds2006 $ 11,166,4942007 10,778,6652008 10,532,5052009 10,518,5302010 9,223,0772011-2015 34,922,5472016-2020 27,426,8632021-2023 17,867,963Total Minimum Lease Payments 132,436,644Less: Amount Representing Interest (interest rates range from 3.85% to 12.00%) 37,900,365Present Value of Net Minimum Lease Payments $ 94,536,279
Years ending June 30, 2006 $ 7,930,0522007 6,265,9692008 5,434,1192009 4,153,2442010 4,161,0662011-2015 9,111,9812016-2020 1,116,7382021-2025 1,279,6442026-2030 1,483,4582031-2035 1,719,734 Total Minimum Future Lease Payments $ 42,656,005

CITY OF TUCSON, ARIZONANOTES TO BASIC FINANCIAL STATEMENTS
For the Year Ended June 30, 2005
58
Note 10 - CONTRACTS PAYABLE:
Long-term Contracts Payable for the Enterprise Funds as of June 30, 2005, were:
Water, Environmental Services and Golf contracts bear interest rates of up to 3.57% and 3.6%, respectively.These contracts mature through June 2016, with varying payment terms.
The City purchased the Metropolitan Water Company, an Arizona limited partnership, on October 1, 1992, for$14,176,000. A down payment of $5,176,000 was made, and a 13-year note at 7% annual interest was executedfor the $9,000,000 balance. Also on October 1, 1992, the City sold these assets and miscellaneous improvementsto the Metropolitan Water Improvement District and the Oro Valley Domestic Water Improvement District for$14,497,204 in cash. Adequate sales proceeds were invested in U.S. Treasury Strips with maturities scheduled tomeet all future payment obligations by the City to the previous owners of the Metropolitan Water Company. Theseinvestments are reported as restricted assets of the Water Utility Fund.
Note 11 - BOND ISSUES:
A. Enterprise Funds
Water Environmental Golf
Equipment Contracts $ 599,470 $ 2,449,946 $ 4,320,000 Less Current Portion 115,661 1,264,071 320,000 Long-Term Contracts Payable $ 483,809 $ 1,185,875 $ 4,000,000
BalanceInterest Maturity Original Outstanding
Series Rates Date AmountGO Series 2000-A (2000) 7.250 July 2013 430,000$ 430,000$ GO Series 1994-A (1995) 7.375 July 2013 2,449,830 2,449,830 GO Series 1994-B (1996) 7.625 July 2015 1,178,967 1,178,967 GO Bonds Series 2000-E (2005) 3.000 July 2017 7,921,000 7,921,000 GO Series 1999 4.500 July 2019 1,520,492 1,520,492 GO Series 2000-B (2001) 4.875 July 2020 3,630,000 3,630,000 GO Refunding Bonds Series 2003 3.000 July 2020 4,639,832 4,639,832 GO Refunding Bonds Series 2005 5.000 July 2020 8,697,446 8,697,446 GO Refunding Bonds Series 1998 5.250 July 2021 8,281,372 8,281,372 GO Series 2000-C (2003) 3.300 July 2021 2,201,000 2,201,000 GO Refunding Bonds Series 2005-B 4.000 July 2021 1,436,948 1,436,948
42,386,887$ 42,386,887$
June 30, 2005
Environmental Services General Obligation Bonds Issued and Outstanding

CITY OF TUCSON, ARIZONANOTES TO BASIC FINANCIAL STATEMENTS
For the Year Ended June 30, 2005
59
Note 11 - BOND ISSUES (Continued):
Water Revenue Bonds will provide funds to improve the potable and reclaimed water systems and ensurecompliance with water quality requirements of the Environment Protection Agency and the Arizona Departmentof Environmental Quality.
BalanceInterest Maturity Original Outstanding
Series Rates Date Amount1994 Series B (1997) 4.50-6.25 % 2007 $ 11,700,000 $ 2,000,0001994 Series C (1999) 4.75-6.75 2009 33,400,000 4,100,0001984 Series D (1991) 9.75 2010 48,000,000 3,000,0001999A Refunding 5.00 2010 14,045,000 10,085,0001993 March (Refunding) 5.25-5.50 2014 35,360,000 17,585,0002001A April (Refunding) 5.00 2016 40,850,000 32,785,0001994 Series A (1996) 6.0-8.0 2018 33,000,000 3,000,0002002 Refunding 5.50 2018 57,820,000 55,890,0002003 Refunding 5.00 2018 12,000,000 12,000,0001997 July (Refunding) 4.20-5.125 2021 32,980,000 32,205,0002000 Series B (2002) 3.5-5.125 2021 18,900,000 17,400,0002000 Series C (2003) 4.25-5.25 2021 16,300,000 9,400,0002005 Refunding 4.00-5.00 2022 55,110,000 55,020,0002000 Series A (2001) 5.0-7.5 2023 37,800,000 36,000,0002000 Series D (2004) 4.0-5.0 2023 18,765,000 18,765,0001994 Series D (2000) 5.25-7.25 2024 23,740,000 11,315,0002005 Series A (2005) 3.00-5.00 2025 31,665,000 31,665,0001998A Water Infrastructure Finance Authority (WIFA) 3.425 2017 6,000,000 4,387,921 2000 Water Infrastructure Finance Authority (WIF1) 4.125 2020 5,120,000 4,342,384 2000 Water Infrastructure Finance Authority (WIF2) 4.125 2020 7,780,000 6,681,969 2001 Water Infrastructure Finance Authority (WIF3) 3.430 2021 8,800,000 7,756,581 2003 Water Infrastructure Finance Authority (WIF4) 3.48 2022 8,300,000 7,655,774 12000 Water Infrastructure Finance Authority (WIF5) 3.75 2023 3,000,000 2,882,228 22004 Water Infrastructure Finance authority (WIF6) 3.255 2023 2,500,000 2,402,8772005 Water Infrastructure Finance authority (WIF7) - - 3
$ 562,935,000 $ 388,324,734
(1) Balance of proceeds recognized; see loan repayment schedule for WIF4.(2) Balance of proceeds recognized; see loan repayment schedule for WIF5.(3) WIF7 was not drawn down during FY2005 and will be recognized in FY2006. Loan amount for WIF7 is $2,997,000.
June 30, 2005
Water Utility Revenue Bonds Issued and Outstanding

CITY OF TUCSON, ARIZONANOTES TO BASIC FINANCIAL STATEMENTS
For the Year Ended June 30, 2005
60
Note 11 - BOND ISSUES (Continued):
B. General City Funds
General Obligation Bonds provide funds for construction of police and fire facilities, street lighting and sidewalkimprovements, drainage system improvements, environmental safety improvements, parks and libraryimprovements and the payment of costs relating to the issuance of the bonds. Debt service payments arescheduled annually from July 1, 2006 to July 1, 2021. General Obligation Bonds are payable from propertytaxes and from Environmental Service fees.
Street and Highway User Revenue Bonds provide funds to improve, construct and reconstruct streets andhighways in the City, to acquire rights-of-way for such purposes by purchase, condemnation or otherwise, andto pay costs relating to the issuance of the bonds. Debt service payments are scheduled annually from July 1,2006 to July 1, 2018. All Street and Highway Revenue Bonds are payable from state motor vehicle fuel taxes.
On June 30, 2005, the City issued $17,894,000 General Obligation Bonds. The bonds represent the fifthinstallment of bonds to be issued pursuant to the May 16, 2000, voter authorization.
On June 13, 2005, the City issued $6,000,000 Junior Lien Street and Highway User Revenue Bonds. Thebonds represent the fourth installment of bonds to be issued pursuant to the May 16, 2000, voter authorization.
Interest Maturity OriginalSeries Rates Date Amount
1991 Refunding 6.20-7.50 % 2008 $ 21,555,000 $ 5,770,0001984 Series E and F 6.17 2012 25,000,000 2,143,0601992 Refunding 6.40-6.5 2012 51,550,000 14,195,0001993 Refunding 4.40-4.90 2013 17,006,000 1,326,0101984 Series G (1994) 7.625 2014 21,540,000 3,140,0001994 Series A (1995) 5.38-7.38 2020 23,600,000 4,150,1701994 Series B (1996) 7.63 2015 24,745,000 2,566,0331994 Series C (1997) 5.00-7.00 2021 10,510,000 2,510,0001997 Refunding 4.40-5.25 2019 20,170,000 19,625,0001998 Refunding 4.25-5.50 2021 26,470,000 17,903,6281994 Series D (1998) 4.25-6.25 2018 11,010,000 6,760,0001994 Series E (1999) 4.50-7.00 2019 13,855,000 1,939,5082000 Series A (2000) 5.25-7.25 2020 18,840,000 2,760,0002000 Series B (2001) 4.625-5.75 2020 26,680,000 23,050,0002002 Refunding 5.00 2012 25,035,000 17,565,0002000 Series C (2003) 2.50-4.50 2021 29,840,000 27,639,0002003 Refunding 2.25-5.00 2020 22,465,000 17,120,1682000 Series D (2004) 3.50-5.00 2021 15,000,000 15,000,0002005 Series Refunding 2.25-5.00 2020 25,542,554 25,452,5542005-B Series Refunding 4.00-5.00 2021 20,288,052 20,288,0522000-E Series (2005) 3.00-5.00 2017 17,894,000 17,894,000Total $ 468,595,606 $ 248,797,183
General Obligation Bonds Issued and Outstanding
June 30, 2005Outstanding
Balance

CITY OF TUCSON, ARIZONANOTES TO BASIC FINANCIAL STATEMENTS
For the Year Ended June 30, 2005
61
Note 11 - BOND ISSUES (Continued):
At June 30, 2005, bonds payable were:
C. Special Assessments
Special assessments on City-owned property were $62,982 of the $3,575,600 total assessment. Theremaining assessments of $3,512,618 represent a contingent liability for all other special assessment issues.The City has a contingent liability to the extent that prepaid assessments and proceeds from liens foreclosedagainst properties within the special assessment districts are insufficient to retire outstanding bonds.
BalanceInterest Maturity Original Outstanding
Series Rates Date Amount
1994 Series A (1995) 5.00-7.00 2015 $ 10,900,000 $ 3,900,0001996 Refunding 4.20-6.00 2010 7,425,000 7,325,0001994 Series B (1996) 5.50-7.50 2016 10,025,000 2,275,0001994 Series C (1997) 5.00-7.00 2016 5,000,000 1,000,0001994 Series D (1998) 4.75-6.60 2018 14,675,000 3,750,0001994 Series E (2000) 5.00-7.00 2018 19,400,000 6,000,0001994 Series F (2001) & 2000 Series A (2001) 4.75-6.00 2018 15,500,000 3,250,0002003 Refunding 4.50 2009 33,760,000 25,535,0002003 Refunding 4.50 2012 30,665,000 25,930,0002003 Series A Refunding 2.50-5.00 2016 15,055,000 15,055,0002003 Series B (2003) 3.375-3.50 2015 5,000,000 5,000,0002000 Series C (2004) 4.125-5.00 2018 8,500,000 8,500,0002005 Series Refunding 3.75-5.00 2018 39,995,000 39,995,0002000-D Series (2005) 4.00-5.00 2018 6,000,000 6,000,000Total $ 221,900,000 $ 153,515,000
Street and Highway Issued and Outstanding
June 30, 2005

CITY OF TUCSON, ARIZONANOTES TO BASIC FINANCIAL STATEMENTS
For the Year Ended June 30, 2005
62
Note 11 – BOND ISSUES (Continued):
D. Annual Principal and Interest Requirements
Following is a summary of debt service requirements to maturity, including principal and interest:
Note 12 - ADVANCE REFUNDING/DEFEASANCE OF DEBT:
On December 16, 2004, the City issued $55,110,000 Water System Revenue Bonds to refund all or partial debtscheduled after July 1, 2005 of the 1994 and 2000 Water System Revenue Bonds and to pay costs relating to theissuance of the bonds. The interest rate on the bonds ranges from 3.0-5.0% with a final maturity due July 1, 2022.Debt service payments are scheduled semi-annually at amounts that range from $90,000 to $6,830,000. Theeconomic gain resulting from this refunding is $3,103,789 (based upon NPV from delivery date.) The difference incash flow requirements to service the old debt ($56,225,000) and the cash flows to service the new debt($55,111,000) is $2,235,018.
Governmental ActivitiesYears Ending General Obligation Street and Highway Special AssessmentJune 30, Principal Interest Principal Interest Principal Interest
2006 $ 9,695,000 $ 12,009,308 $ 9,250,000 $ 7,680,267 $ 441,600 $ 164,510 2007 11,558,460 13,136,322 9,600,000 7,263,235 393,500 143,415 2008 13,884,437 11,020,692 10,000,000 6,831,205 347,500 125,134 2009 14,326,846 10,331,031 10,645,000 6,381,660 295,000 109,610 2010 15,061,846 9,620,376 11,160,000 5,903,175 305,000 95,227 2011-2015 74,234,283 43,651,367 60,970,000 19,693,888 1,188,000 276,452 2016-2020 93,088,511 17,833,751 41,890,000 4,136,200 605,000 46,625 2021-2025 16,947,800 826,140 Total $ 248,797,183 $ 118,428,987 $ 153,515,000 $ 57,889,630 $ 3,575,600 $ 960,973
Years EndingJune 30, Principal Interest Principal Interest Principal Interest
2006 $ 1,300,000 $ 18,920 $ $ 2,104,727 $ 11,083,842 $ 19,380,436 2007 2,103,883 13,070,033 18,806,869 2008 320,563 2,103,883 14,183,783 18,123,384 2009 713,154 2,094,266 15,515,194 17,379,566 2010 713,154 2,072,871 17,149,373 16,575,012 2011-2015 9,311,327 9,399,040 102,724,413 68,384,925 2016-2020 26,676,489 5,472,494 128,890,074 40,132,670 2021-2025 4,652,200 231,798 85,708,022 9,441,501 Total $ 1,300,000 $ 18,920 $ 42,386,887 $ 25,582,962 $ 388,324,734 $ 208,224,363
Water ServicesRevenue Bonds
Federal Highway Business-Type ActivitiesGovernmental Activities
Extension LoanEnvironmental Services
General Obligation Bonds

CITY OF TUCSON, ARIZONANOTES TO BASIC FINANCIAL STATEMENTS
For the Year Ended June 30, 2005
63
Note 12 - ADVANCE REFUNDING/DEFEASANCE OF DEBT (Continued):
On January 27, 2005, the City issued $34,240,000 General Obligation Bonds to refund all or partial debt scheduledafter July 1, 2005 of the 1997 GO Bonds, the 1998 GO Bonds, the 1999 GO Bonds, the 2000-A GO Bond and topay costs relating to the issuance of the bonds. The interest rate on the bonds ranges from 2.25-5.0% with the finalmaturity due July 1, 2020. Debt service payments are scheduled semi-annually at amounts that range from$779,990 to $6,933,500. The economic gain resulting from this refunding is $1,076,112 (based upon NPV fromdelivery date.) The difference in cash flow requirements to service the old debt ($56,263,550) and the cash flows toservice the new debt ($54,815,602) is $1,447,948.
On April 6, 2005, the City issued $21,725,000 General Obligation Bonds to refund all or partial debt scheduled afterJuly 1, 2005 of the 1995 Refunding GO Bonds, the 1994-C GO Bonds, and the 1999 GO Bonds and to pay costsrelating to the issuance of the bonds. The interest rate on the bonds ranges from 3.0-5.0% with the final maturitydue July 1, 2021. Debt service payments are scheduled semi-annually at amounts that range from $56,513 to$4,010,363. The economic gain resulting from this refunding is $1,424,103 (based upon NPV from delivery date.)The difference in cash flow requirements to service the old debt ($29,070,850) and the cash flows to service thenew debt ($27,304,784) is $1,766,066.
On May 18, 2005, the City issued $39,995,000 Jr. Streets and Highway User Revenue Bonds to refund all or partialdebt scheduled after July 1, 2005 of the 1998 Jr. S&H Bonds, the 2000 Jr. S&H Bonds, the 2001 Jr. S&H Bondsand the 1997 Sr. S&H Bonds, and to pay costs relating to the issuance of the bonds. The interest rate on the bondsranges from 3.75-5.0% with the final maturity due July 1, 2018. Debt service payments are scheduled semi-annually at amounts that range from $238,105 to $11,093,250. The economic gain resulting from this refunding is$1,267,269 (based upon NPV from delivery date.) The difference in cash flow requirements to service the old debt($64,341,281) and the cash flows to service the new debt ($62,898,458) is $1,442,823.
In prior years, the City has defeased various bond issues by creating irrevocable trusts. The proceeds from theadvance refundings have been deposited in these trusts and invested in U.S. Governmental Securities that aredesigned to meet the requirements of the refunded debt. The debt associated with the refunding issues, as well asdefeased debt outstanding, but removed, is Water Utility debt of $184,935,000 and General Obligation and Streetand Highway debt of $66,412,000 and $48,325,000, respectively.
Note 13 - LANDFILLS:
The U.S. Environmental Protection Agency ruling "Solid Waste Disposal Facility Criteria" requires the City to incurspecified landfill closure and post-closure care costs. Closure requirements have been established for municipallandfills that received solid waste after October 9, 1991. Additional thirty-year post-closure monitoring andmaintenance functions are required of landfills that accepted solid waste after October 9, 1993. Although closureand post-closure care costs will be paid only near or after the date that the landfill stops accepting waste, the Cityrecords a liability for these required costs based upon each landfill's percentage of capacity used through June 30,2005. The total closure and post-closure cost estimates are based on what it would cost to perform those functionsin 2005. Actual costs will likely vary due to inflation, changes in technology, or changes in regulations.
In addition to the federal requirements discussed above, the City must comply with certain Federal/Staterequirements dealing with aquifer protection or clean-up. The recognition of this liability is also based on thepercentage of landfill capacity used, and cost estimates are in current dollars.

CITY OF TUCSON, ARIZONANOTES TO BASIC FINANCIAL STATEMENTS
For the Year Ended June 30, 2005
64
Note 13 – LANDFILLS (Continued):
Total liability for closure/post-closure costs, including aquifer protection and clean-up, is as follows:
Revised estimates of closure and post-closure costs are made annually.
The operation of the landfills is a function of the City's Environmental Management Department that is accountedfor as an enterprise fund. The June 30, 2005, liability for closure and post-closure costs is $42,535,670, whichrepresents the cumulative amount reported to date based on the estimated capacity of the landfills.
Note 14 - DEFERRED COMPENSATION PLAN:
The City offers its employees an internally administered Deferred Compensation Plan created in accordance withInternal Revenue Code Section 457. The plan, available to all City employees, permits the employees to defer aportion of their salaries until future years. The amount deferred is not available to employees until termination,retirement, death, or unforeseeable emergency.
Federal law requires all assets and income of Internal Revenue Code Section 457 deferred compensation plans tobe held in trust, custodial accounts, or annuity contracts for the exclusive benefit of the participants and theirbeneficiaries; therefore, the internally-administered Deferred Compensation Plan is reported as a Trust Fund.
Note 15 - SINGLE-EMPLOYER AND AGENT MULTIPLE-EMPLOYER RETIREMENT SYSTEMS:
A. Description of Plans
1. Tucson Supplemental Retirement System The Tucson Supplemental Retirement System (System orTSRS) is a single-employer defined benefit plan for City employees. It was established in the City Charterto provide its members with a supplement to the retirement and disability benefits of the social securitysystem. The System is governed by a seven-member Board of Trustees consisting of: a chairman who isappointed by the Mayor and Council, the City's Directors of Human Resources and Finance, two memberselected by the membership of the System, an ex-officio retired member, and a member appointed by theCity Manager. Benefit provisions and changes in benefits or funding are recommended by the Board ofDirectors and must be approved by Mayor and Council. The TSRS issues a publicly available financialreport that includes financial statements and required supplementary information. The financial statementsmay be obtained from their administrative office located at 255 W. Alameda Street, Tucson, AZ 85701.
Estimated Closure/Estimated Liability Postclosure Cost Estimated
Closure/Post- Recognized to be Recognized RemainingLandfill Site Closure Costs at 6/30/05 in Future Years Life in Years
Los Reales 86 % $ 30,872,000 $ 25,687,288 $ 5,184,712 4Harrison 100 % 6,813,000 6,813,000 Irvington 100 % 4,492,000 4,492,000 Vincent Mullins 100 % 4,302,382 4,302,382 Silverbell 100 % 1,241,000 1,241,000
Totals $ 47,720,382 $ 42,535,670 $ 5,184,712
Landfill CapacityUsed as of
6/30/05

CITY OF TUCSON, ARIZONANOTES TO BASIC FINANCIAL STATEMENTS
For the Year Ended June 30, 2005
65
Note 15 - SINGLE-EMPLOYER AND AGENT MULTIPLE-EMPLOYER RETIREMENT SYSTEMS (Continued):
2. Arizona Public Safety Personnel Retirement System The City contributes to the Arizona Public SafetyPersonnel Retirement System (System or APSPRS), an agent multiple-employer public employeeretirement system established by the Arizona Revised Statutes. All commissioned Police and Fireemployees of the City participate in the System. The Fund Manager and 215 Local Boards jointlyadminister the System. The Fund Manager is a five-member board. The governor appoints threemembers, and two members are appointed by the state legislature. Each eligible group participating in theSystem has a five-member Local Board. Three members are appointed by the chief elected official of theorganization, and two members are elected by the active members of the eligible group. The FundManager is responsible for the investment of the System's assets. The Local Board is responsible fordetermining eligibility for membership, service credits, eligibility for benefits, timing of benefit payments, andthe amount of benefits for its eligible group of employees. APSPRS issues a publicly available financialreport that includes financial statements and required supplementary information. The financial statementsmay be obtained from their administrative office located at 3010 East Camelback Road, Suite 200,Phoenix, AZ 85016.
3. Arizona Elected Officials' Retirement Plan The City contributes to the Arizona Elected Officials' RetirementPlan (Plan or AEORP), a cost-sharing, multiple-employer public employee retirement plan. At June 30,2005, the City had 7 covered officials. Covered payroll for the year then ended was $186,000 (out of thetotal City payroll of $263,901,238). All elected officials of the City are members of the Plan.
State statutes require that the total contribution for an elected official be sufficient to meet the actuarially-determined normal cost, plus the amount needed to amortize any unfunded liability. At the City, coveredofficials are required to contribute 7% of their salary to the Plan. The City contributes the remainingamounts necessary to finance benefits. The City's contribution for the year was $25,058 and electedofficials contributed $13,521 contributions, including amounts for current officials as well as for past officialspermitted to join the plan pursuant to 1987 legislation.
No additional disclosures regarding AEORP are provided due to its immateriality to these financialstatements as a whole. Financial statements for the Plan are available by contacting Arizona ElectedOfficials' Retirement System at 3010 East Camelback Road, Suite 200, Phoenix, AZ 85016.
B. Funding Policy
1. Tucson Supplemental Retirement System Currently, employee contributions are 5% of their annualcovered payroll and are made through payroll deductions. A reserve is established for contributions andearnings allocations, less amounts transferred to reserves for retirement and disability and amountsreserved for terminated employees. If an employee leaves covered employment before attaining five years'service credit, the accumulated contributions plus interest are refunded to the employee or his designatedbeneficiary. The City contributes the remaining amounts necessary to finance employee participation in theSystem and to fund the costs of administering the System. The City's contribution rate for the year endedJune 30, 2005 was 14.06%.
2. Arizona Public Safety Personnel Retirement System Employees covered by APSPRS are required by Statestatutes to contribute 5% of their salary to the System. The System's funding policy provides for actuariallydetermined employer contribution rates which will provide assets sufficient to pay benefits when due. Forthe fiscal year ended June 30, 2005, the required employer contribution rates were 13.33% and 14.69%,respectively, for Police and Fire.
If a member leaves covered employment or dies and no benefit is payable, accumulated membercontributions are refunded to the member or designated beneficiary.

CITY OF TUCSON, ARIZONANOTES TO BASIC FINANCIAL STATEMENTS
For the Year Ended June 30, 2005
66
Note 15 - SINGLE-EMPLOYER AND AGENT MULTIPLE-EMPLOYER RETIREMENT SYSTEMS (Continued):
C. Summary of Significant Accounting Policies
1. Tucson Supplemental Retirement System The System's financial statements are prepared using theaccrual basis of accounting. Employee and employer contributions are recognized as revenues in theperiod in which employee services are performed. Benefits and refunds are recognized when due andpayable in accordance with the System.
At June 30, 2005, there were no individual investments, that represented 5% or more of System net assets,other than those issued or guaranteed by the United States government, and there were no long-termcontracts for contributions to the System.
2. Arizona Public Safety Personnel Retirement System The System's financial statements are prepared usingthe accrual basis of accounting. Employee and employer contributions are recognized as revenues in theperiod in which employee services are performed. Investment income, net of administrative andinvestment expenses, is allocated to each employer group based on the average relative fund size for eachemployer group for that year.
Investments are reported at fair value. Short-term investments are reported at cost, which approximatesfair value. Equity securities are valued at the last reported sales price. Fixed-income securities are valuedusing the last reported sales price or the estimated fair market value as determined by fixed-incomebroker/dealers. Investment income is recognized as earned. Realized gains and losses on sales andexchanges of fixed-income securities are recognized on the transaction date.
At June 30, 2005, there were no individual investments, other than those issued or guaranteed by theUnited States government, that represented 5% or more of System net assets, and there were nolong-term contracts for contributions to the System.
D. Annual Pension Cost:
The annual pension cost, net pension obligation for the current year, and other related information for bothsystems follow:
TSRS
Police Fire
Actuarial Valuation Date June 30, 2005 June 30, 2005 June 30, 2005Actuarial Cost Method Individual Entry Age Individual Entry Age Individual Entry AgeAm ortization Method Level Percent of Payroll, Level Percent of Payroll, Level Percent of Payroll,
Closed Open OpenRem aining Am ortization Period Closed 17 Years from Open 20 years from Open 20 years from
June 30, 2005 June 30, 2005 June 30, 2005
Asset Valuation Method 4-Year Sm oothed Market 4-Year Sm oothed Market 4-Year Sm oothed Market
Actuarial Assum ptions: Investm ent Rate of Return 7.75% 8.50% 8.50% Projected Salary Increases* 4.25% - 9.25% 6.00% - 9.00% 6.00% - 9.00% Inflation 4.25% 5.00% 5.00% Cost-of-Living Adjustm ent As approved by None None
TSRS Board
*Projected salary increases include inflation.
Actuarial Inform ation APSPRS

CITY OF TUCSON, ARIZONANOTES TO BASIC FINANCIAL STATEMENTS
For the Year Ended June 30, 2005
67
Note 15 – SINGLE EMPLOYER AND AGENT MULTIPLE-EMPLOYER RETIREMENT SYSTEMS (Continued):
The Tucson Supplemental Retirement System (TSRS) issues a publicly available financial report that includesfinancial statements and required supplementary information. The financial statements may be obtained from theiradministrative office located at 255 W. Alameda, Tucson, AZ 85701.
The Arizona Public Safety Personnel Retirement System (APSPRS) issues a publicly available financial report thatincludes financial statements and required supplementary information. The financial statements may be obtainedfrom their administrative office located at 3010 East Camelback Road, Suite 200, Phoenix, AZ 85016.
Fiscal Year Annual Pension Percentage of Net PensionEnded 6/30 APC Contributed
TSRS 2005 $ 25,958 100 $ 02004 23,644 100 02003 21,657 100 0
Police 2005 7,141 100 02004 5,140 100 02003 2,992 100 0
Fire 2005 4,621 100 02004 2,653 100 02003 1,725 100 0
Dollar amounts are in thousands
Cost (APC) Obligation
Three Year Trend Information
%
ActuarialValuation
DateJune 30
TSRS2005 $ 538,789 $ 693,871 $ 155,082 $ 77.6 % $ 162,149 95.6 %2004 494,987 645,351 150,364 76.7 149,782 100.42003 458,857 601,173 142,316 76.3 143,164 99.4
Police2005 333,251 415,094 81,843 80.3 52,700 155.32004 328,655 364,754 36,099 90.1 50,399 71.62003 333,213 333,808 595 99.8 52,996 1.1
Fire2005 228,850 286,348 57,498 79.9 29,843 192.72004 228,828 253,304 24,475 90.3 27,426 89.22003 235,483 239,023 3,540 98.5 27,907 12.7
Dollar amounts are in thousands.
Unfunded(Overfunded) AAL as a Percentage
of Active AnnualFunded
Ratio(a) / (b)
Member CoveredPayroll
(c)Payroll
(b-a) / (c)Entry Age
(b)
Unfunded(Overfunded)
AAL(b) - (a)
Assets (a)
Schedule of Funding Progress
ActiveMemberCovered
ActuarialValue of
ActuarialAccrued Liability

CITY OF TUCSON, ARIZONANOTES TO BASIC FINANCIAL STATEMENTS
For the Year Ended June 30, 2005
68
Note 16 - SELF INSURANCE PROGRAM:
The City is exposed to various risks of losses related to tort; theft of, damage to, and destruction of assets; errorsand omissions; injuries to employees; and natural disasters. The City has obtained commercial coverage forProperty Insurance, Public Employee Fidelity Bonds, Crime Insurance, Aircraft Insurance and MiscellaneousInsurance (i.e., surety bonds, special event insurance as needed, and fine arts coverage). The City retains all ofthe risk not covered by commercial carriers and has effectively managed risk through various employee educationand prevention programs.
All risk management activities are accounted for in the Self Insurance Fund, an Internal Service Fund. There havenot been any settlements in excess of the insurance coverage provided by this fund in the previous three years.
Annually, the City estimates the liabilities for unpaid claims using a historical cost information method. Claims andexpenses are recognized when it is probable that a loss has been incurred, and the amount of the loss can bereasonably estimated. Claims accounted for include reported and paid claims, reported but unpaid claims, andincurred but not reported (IBNR) claims. Unpaid claim liability amounts are reported at gross (no discounting).
Changes in the Self Insurance Fund's aggregate claims liabilities for the fiscal years ended June 30, 2005, and2004, are as follows:
Note 17 - POST-RETIREMENT HEALTH CARE AND LIFE INSURANCE BENEFITS:
In addition to the pension benefits described in Note 15, the City offers a health insurance benefit to thoseemployees who: have qualified to receive a monthly retirement allowance from the Tucson SupplementalRetirement System or from the Arizona Public Safety Retirement System (Police and Fire); are less than 65 yearsof age; and are not Medicare-eligible.
These benefits apply only to those employees who retired after March 1, 1981, and were above the minimumeligible age that was in effect on the date of their retirement. Public Safety employees who retired after February 1,1982, and who were below the minimum eligible age in effect on the date of their retirement are covered for aperiod not to exceed five years. After that point, the retiree pays 100% of the premium.
As of June 30, 2005, the City contributed towards the medical premiums of 750 retirees. Depending upon the dateof retirement, the City pays between 75% and 100% of the medical insurance premiums for eligible retirees andtheir dependents.
The costs associated with this retirement benefit are expended as the appropriate medical insurance premiums arepaid. During the 2004-05 fiscal year, the City's portion of retiree medical insurance premiums was $3,520,805.
On June 30, 2005, there were 2,295 retirees receiving City-paid life insurance benefits. The costs associated withthe life insurance premiums are expended as the insurance premium is paid. During the fiscal year, the City’s costfor retiree life insurance was $91,377.
2005 2004
Beginning of fiscal year liability $ 39,712,642 $ 44,460,352 Current year claims and changes in estimates 24,419,951 4,775,169 Claim Payments (19,067,823) (9,522,879) Balance at fiscal year end $ 45,064,770 $ 39,712,642

CITY OF TUCSON, ARIZONANOTES TO BASIC FINANCIAL STATEMENTS
For the Year Ended June 30, 2005
69
Note 18 - CONTINGENCIES AND COMMITMENTS:
A. Litigation
The City is subject to a number of lawsuits, investigations and other claims (some of which involve substantialamounts) that are incidental to the ordinary course of its operations, including those related to wrongful deathand personal injury matters. Although the City Attorney does not currently possess sufficient information toreasonably estimate the amounts of the liabilities to be recorded upon the settlement of such claims andlawsuits, some claims could be significant to the City's operations. While the ultimate resolution of suchlawsuits, investigations, and claims cannot be determined at this time, in the opinion of City management,based on the advice of the City Attorney, the resolution of these matters will not have a material adverse effecton the City's financial position.
B. Central Arizona Project Water Purchase Contract
The Central Arizona Water Conservation District (CAWCD) is the entity responsible for contracting with theSecretary of Interior for Central Arizona Project (CAP) water and for subcontracting with users within the Stateof Arizona. Under a contract between the City, CAWCD and the Department of the Interior, the City currentlyhas the right to receive 135,966 acre-feet of CAP water each year. In return, the City agreed to pay a capitalfinancing charge that is designed to recover a portion of the Federal Government's CAP construction costs.This charge, which must be paid regardless of whether the City orders any CAP water, is adjusted annually andis on a per-acre-foot allocation basis; the CAP capital financing for the year was $3,807,048. In addition,commodity charges, which are designed to cover CAWCD operating and maintenance expenses, are based onthe quantity of CAP water taken by the City. The commodity charge for the year was $4,586,269.
C. Construction and Other Commitments
In governmental fund types, construction and other commitments, if significant, are appropriately identifiablethrough reservations of fund balance.
D. Federal and State Grants
Accounts received or receivable from grantor agencies are subject to audit and adjustment by grantoragencies, principally the Federal government. Any disallowed claims, including amounts already collected,may constitute a liability of the applicable funds. The amount, if any, of expenditures which may be disallowedby the grantor cannot be determined at this time, although the City expects such amounts, if any, to beimmaterial.
E. Sale of Tucson House
On November 1, 1997, the City sold the Tucson House, a public housing apartment complex, to a limitedpartnership that has renovated the complex with money obtained through Federal Home Loan Bank (FHLB)subsidies. Notes and interest receivables have been established for: the sales price, certain construction costspaid by the City, and accrued interest due on the notes at 7.5%. These amounts have been recorded asdeferred revenue, and totaled $14,462,237 at June 30, 2005.
According to the terms of the subsidy agreement, the Tucson House's units must be operated as affordablehousing for a period of 15 years after the renovation was completed, at the end of which time the City has theoption to repurchase the renovated Tucson House in exchange for forgiveness of the debt. If the terms areviolated, the City will be jointly liable (with the limited partnership) for repayment of the subsidy to FHLB. Thelikelihood of the Tucson House not being operated as a public housing facility is considered remote by the City.

CITY OF TUCSON, ARIZONANOTES TO BASIC FINANCIAL STATEMENTS
For the Year Ended June 30, 2005
70
Note 18 - CONTINGENCIES AND COMMITMENTS: (Continued)
F. Financing of Posadas Sentinel Low-income Housing
On November 1, 1999, the City entered into a capital lease with Posadas Sentinel LLLP (Posadas), wherebythe City leased various properties to Posadas for 75 years. Under the terms of the lease, Posadas will developand operate the properties solely as low-income residential housing facilities. The Posadas is financing thisdevelopment through low-income housing tax credits from the State of Arizona, and through a $10,002,000 lineof credit from the City, which has been recorded by the City as notes receivable. The note balance, withaccrued interest at 7.5% thereon, was $13,089,155 at June 30, 2005.
Eligibility of Posadas Sentinel LLLP for the tax credits requires that the properties be operated as affordablehousing for a period of 15 years after the development is completed, at the end of which time the leaseagreement may be terminated in exchange for forgiveness of the associated debt. The City has made certaincommitments to ensure eligibility for the tax credit, and therefore has potential associated liability. Thelikelihood of such liability occurring is considered remote by the City.
G. Financing of South Park Low-income Housing
On December 2, 2002, the City entered into a capital lease with South Park Development Partners LLLP(South Park), whereby the City leased various properties to South Park for 75 years. Under the terms of thelease, South Park will develop and operate the properties solely as low-income residential housing facilities.South Park is financing this development through low-income housing tax credits from the State of Arizona, andthrough a $5,473,733 line of credit from the City, which has been recorded by the City as a notes receivable.The note balance, with accrued interest at 5.77% thereon, was $5,829,472 at June 30, 2005.
Eligibility of South Park for the tax credits requires that the properties be operated as affordable housing for aperiod of 15 years after the development is completed, at the end of which time the lease agreement may beterminated in exchange for forgiveness of the associated debt. The City has made certain commitments toensure eligibility for the tax credit, and therefore has potential associated liability. The likelihood of such liabilityoccurring is considered remote by the City.
H. Starr Pass Resort Developments Lease
On May 11, 2005, The City entered into a sublease agreement with Starr Pass Resort Developments LLC. TheCity is acquiring, among other property, an interest in the real property and the improvements to a parkinggarage structure located on the Starr Pass grounds. The City issued Certificates of Participation for $2,640,000to pay ground rent to Starr Pass Resort Developments. Under the terms of the lease, Starr Pass will developand operate the properties. The Resort is paying the City under the sublease the amount equal to the debtservice. A notes receivable has been recorded by the City for $2,640,000.
Note 19 - SIGNIFICANT DISCRETELY PRESENTED COMPONENT UNIT TRANSACTIONS:
The Rio Nuevo Multipurpose Facilities District (District) is a legally separate entity created to revitalize downtownTucson. The District is being funded by tax increment financing (TIF). This State TIF revenue stream did not beginuntil July 2003; therefore, the substantial project/development expenses incurred by the District were being coveredby the City as of June 30, 2005. This coverage resulted in the City’s recording a long-term receivable in theamount of $14,577,549.
On November 3, 2005, the Rio Nuevo Multipurpose Facilities District issued $5,800,000 Junior Lien Excise TaxRevenue Bonds. The interest rate on the bonds ranges from 4.9% to 6.0% with the final maturity due on July 1,2013. Debt service payments are scheduled annually at amounts that range from $510,000 to $1,710,000.

Required Supplementary
Information

Budgeted Amounts
Original Final Actual
Variance with Final Budget
Positive (Negative)
Revenues: Taxes 210,342,120$ 210,342,120$ 211,795,324$ 1,453,204$ Licenses and Permits 16,707,940 16,707,940 18,593,626 1,885,686 Fines and Forfeitures 12,622,160 12,622,160 10,341,491 (2,280,669) Use of Money and Property 1,760,230 1,760,230 2,621,347 861,117 Federal Grants and Contributions 1,800,000 1,800,000 (1,800,000) Other Agencies 135,245,610 135,245,610 126,372,735 (8,872,875) Charges for Services 26,994,860 26,994,860 39,266,187 12,271,327 Miscellaneous 10,109,590 10,109,590 4,564,314 (5,545,276) Total revenues 415,582,510 415,582,510 413,555,024 (2,027,486)
Expenditures: Current - Elected and Official 16,252,830 16,235,364 14,622,301 1,613,063 Support Services 41,097,490 41,518,075 53,927,885 (12,409,810) Neighborhood Services 232,874,660 234,232,278 229,908,518 4,323,760 Environment and Development 42,233,420 25,644,902 17,844,265 7,800,637 Strategic Initiatives 2,685,970 2,685,970 2,457,817 228,153 Non-Departmental 10,009,910 9,080,867 11,502,112 (2,421,245) Environmental Services 1,100,000 Capital Outlay 3,039,820 6,763,115 3,432,523 3,330,592 Capital Projects 52,197,700 61,694,622 34,699,532 26,995,090 Debt service - Principal 5,785,590 5,242,870 4,214,239 1,028,631 Interest 3,231,320 3,049,410 2,834,308 215,102 Fiscal Agent Fees and Other 708,630 23,598 685,032 Issuance Cost of Debt 32,300 32,300 997,378 (965,078) Total expenditures 410,541,010 406,888,403 376,464,476 30,423,927
Excess (deficiency) of revenues over expenditures 5,041,500 8,694,107 37,090,548 28,396,441
Other financing sources (uses): Lease Purchase and Contracts Proceeds 48,723,580 48,723,580 44,784,153 (3,939,427) Premium on Issuance of Debt 1,332,519 1,332,519 Transfers from Other Funds 2,726,435 2,726,435
Payment to Refunded Bond Escrow Agent (1,465,000) (1,465,000) Transfers to Other Funds (53,765,080) (53,765,080) (59,769,496) (6,004,416) Total other financing sources (uses) (5,041,500) (5,041,500) (12,391,389) (7,349,889)
Change in fund balances 3,652,607 24,699,159 21,046,552
Fund balances, July 1, 2004 73,362,333 73,362,333
Fund balances, June 30, 2005 $ 3,652,607$ 98,061,492$ 94,408,885$
The notes to the financial statements are an integral part of this statement.
CITY OF TUCSON, ARIZONASCHEDULE OF REVENUES, EXPENDITURES AND
CHANGES IN FUND BALANCES - BUDGET AND ACTUAL - GENERAL FUNDYEAR ENDED JUNE 30, 2005
71

CITY OF TUCSON, ARIZONANOTE TO REQUIRED SUPPLEMENTARY INFORMATION
For the Year Ended June 30, 2005
72
NOTE 1 - BUDGET INFORMATION:
The City prepares a legally adopted annual operating budget for the General Fund. The City’s budget is adoptedusing a basis of accounting consistent with generally accepted accounting principles (GAAP), with immaterialexceptions (e.g., beginning fund balance is budgeted as a revenue source). The City’s actuals are presented on aGAAP basis; therefore, no reconciliation is necessary.

Combining Statem
ents and Individual FundStatem
ents and Schedules

Special Revenue Debt Service
Capital Projects
Civic Endowment
Fund
TotalNon-Major
Governmental Funds
ASSETSPooled Cash and Investments 19,839,777$ 6,936,461$ 35,213,803$ 149,092$ 62,139,133$ Cash/Investments with Fiscal Agent 4,709,214 25,875,150 30,584,364 Long Term Investments 1,068,261 1,068,261 Accounts Receivable, Net 12,137,101 12,137,101 Special Assessments Receivable 3,474,061 3,474,061 Notes and Loans Receivable 42,345,862 42,345,862 Due from Other Agencies 474,650 56,915 531,565 Interfund Receivable 6,838,635 6,838,635 Grants and Entitlements Receivable 22,169,637 22,169,637 Interest Receivable 89,859 4,846 140,173 510 235,388 Other Assets 4,724,773 4,724,773 Total assets 107,559,134$ 36,290,518$ 42,249,526$ 149,602$ 186,248,780$
LIABILITIES AND FUND BALANCESLiabilities: Accounts Payable 8,517,366$ 62,430$ 1,970,867$ $ 10,550,663$ Accrued Payroll Liabilities 1,095,322 1,095,322 Advances from Other Funds 3,500,000 3,680,590 7,180,590 Interfund Payable 21,708,761 4,351 21,713,112 Due to Other Agencies 463,864 8,168 472,032 Refundable Deposits 1,722,430 99,008 1,821,438 Bonds and Interest Payable, including Special Assessments 714 25,875,150 25,875,864 Deferred Revenue 39,572,162 3,470,990 43,043,152 Total liabilities 76,580,619 29,507,578 5,663,976 111,752,173
Fund balances: Reserved for Debt Service 461,469 6,782,940 7,244,409 Reserved for Capital Improvements 4,523,908 40,266,140 44,790,048 Reserved for Advances and Deposits 13,170 13,170 Reserve for Other Purposes 16,647,974 149,602 16,797,576 Unreserved: Undesignated 9,331,994 (3,680,590) 5,651,404 Total fund balances 30,978,515 6,782,940 36,585,550 149,602 74,496,607
Total liabilities and fund balances 107,559,134$ 36,290,518$ 42,249,526$ 149,602$ 186,248,780$
CITY OF TUCSON, ARIZONACOMBINING BALANCE SHEET - ALL NON-MAJOR GOVERNMENTAL FUNDS - BY FUND TYPE
JUNE 30, 2005
73

CITY OF TUCSON, ARIZONACOMBINING BALANCE SHEET - ALL SPECIAL REVENUE FUNDS
JUNE 30, 2005
Library FundPublic Safety
Academy Fund Team/ParkwiseConvention Center Fund
ASSETSPooled Cash and Investments 212,473$ 169,597$ 43,853$ 2,148,250$ Cash/Investments with Fiscal Agent 4,320,809 Long Term Investments 1,068,261 Accounts Receivable, Net 74,749 40,107 161,041 Notes and Loans Receivable Due from Other Agencies 110,139 Grants and Entitlements Receivable Interest Receivable 9,993 Other Assets 3,227 Total assets 287,222$ 172,824$ 5,593,162$ 2,309,291$
LIABILITIES AND FUND BALANCESLiabilities: Accounts Payable 65,412$ 98,851$ 2,296,310$ 76,205$ Accrued Payroll Liabilities 212,534 72,107 13,195 40,184 Advances from Other Funds Interfund Payable 925,675 Due to Other Agencies 949 1,866 965 Refundable Deposits 5,281 876,730 Bonds and Interest Payable, including Special Assessments 714 Deferred Revenue Total liabilities 278,895 172,824 3,241,175 994,084
Fund balances (deficits): Reserved for Debt Service 461,469
Reserved for Capital Improvements 4,330,802
Reserved for Advances and Deposits 3,505 9,665 Reserve for Other Purposes 4,822 299,570 1,068,261 1,305,542 Unreserved: Undesignated (761,039) (3,047,076) Total fund balances 8,327 2,351,987 1,315,207
Total liabilities and fund balances 287,222$ 172,824$ 5,593,162$ 2,309,291$
74

H.U.R.F. Fund
Civic Contribution
Fund
Community Development
FundDevelopment
Fee Fund
Miscellaneous Housing Grant
FundPublic Housing
Fund
12,322,894$ 2,518,824$ $ 257,161$ $ 1,281,837$ 72,111
7,863,897 818 230,076
4,473,789 19,497,053 10,678,448 111,095 118,873
1,699,786 5,865,014 222,712 61,709 7,804 3,731 6,622 1,357 16,856 1,953,714
20,433,063$ 2,526,628$ 6,173,575$ 260,892$ 25,498,614$ 14,373,409$
1,230,843$ 70,118$ 393,206$ 67,786$ 566,450$ 323,387$ 326,737 23,529 8,076 78,994
3,500,000 1,202,591 4,699,784
705 215 71,287 229,691 24,704 1,919 725,611
26,667 19,590,894 10,695,652
1,558,285 70,333 1,741,984 3,567,786 24,867,123 12,053,335
193,106
3,542,301 2,456,295 4,431,591 16,856 2,400,498
15,332,477 (3,500,000) 614,635 (80,424) 18,874,778 2,456,295 4,431,591 (3,306,894) 631,491 2,320,074
20,433,063$ 2,526,628$ 6,173,575$ 260,892$ 25,498,614$ 14,373,409$
(Continued)
75

CITY OF TUCSON, ARIZONACOMBINING BALANCE SHEET - ALL SPECIAL REVENUE FUNDS
JUNE 30, 2005(Concluded)
Public Housing HOME
Program FundOther Federal Grants Fund
Non-Federal Grants Fund
Mass Transit Fund
ASSETSPooled Cash and Investments $ $ 884,888$ $ Cash/Investments with Fiscal Agent 316,294 Long Term Investments Accounts Receivable, Net 3,766,413 Notes and Loans Receivable 7,696,572 Due from Other Agencies 134,543 Grants and Entitlements Receivable 1,751,475 8,679,428 422,485 3,528,737 Interest Receivable Other Assets 533 581 2,748,505 Total assets 9,448,047$ 8,996,255$ 1,307,954$ 10,178,198$
LIABILITIES AND FUND BALANCESLiabilities: Accounts Payable 168,675$ 1,015,396$ 102,841$ 2,041,886$ Accrued Payroll Liabilities 13,045 38,976 11,604 256,341 Advances from Other Funds Interfund Payable 1,486,469 6,504,833 6,889,409 Due to Other Agencies 6,014 44 152,128 Refundable Deposits 83,286 2,951 1,948 Bonds and Interest Payable, including Special Assessments Deferred Revenue 7,696,572 1,166,859 364,976 30,542 Total liabilities 9,448,047 8,735,029 479,465 9,372,254
Fund balances (deficits): Reserved for Debt Service
Reserved for Capital Improvements
Reserved for Advances and Deposits Reserve for Other Purposes 316,294 805,944 Unreserved: Undesignated (55,068) 828,489 Total fund balances 261,226 828,489 805,944
Total liabilities and fund balances 9,448,047$ 8,996,255$ 1,307,954$ 10,178,198$
76

Totals
19,839,777$ 4,709,214 1,068,261
12,137,101 42,345,862
474,650 22,169,637
89,859 4,724,773
107,559,134$
8,517,366$ 1,095,322 3,500,000
21,708,761 463,864
1,722,430
714 39,572,162 76,580,619
461,469
4,523,908
13,170 16,647,974
9,331,994 30,978,515
107,559,134$
77

CITY OF TUCSON, ARIZONACOMBINING BALANCE SHEET - ALL DEBT SERVICE FUNDS
JUNE 30, 2005
Assessment Bond and
Interest Fund
Obligation Bond and
Interest Fund
Highway Bond and Interest
Fund TotalsASSETSPooled Cash and Investments 1,558,119$ 5,317,340$ 61,002$ 6,936,461$ Cash/Investments with Fiscal Agent 87,889 14,275,575 11,511,686 25,875,150 Special Assessments Receivable 3,474,061 3,474,061 Interest Receivable 4,846 4,846 Total assets 5,124,915$ 19,592,915$ 11,572,688$ 36,290,518$
LIABILITIES AND FUND BALANCESLiabilities: Accounts Payable 1,428$ $ 61,002$ 62,430$ Refundable Deposits 99,008 99,008 Bonds and Interest Payable, including Special Assessments 87,889 14,275,575 11,511,686 25,875,150 Deferred Revenue 3,470,990 3,470,990 Total liabilities 3,659,315 14,275,575 11,572,688 29,507,578
Fund balances: Reserved for Debt Service 1,465,600 5,317,340 6,782,940 Total fund balances 1,465,600 5,317,340 6,782,940
Total liabilities and fund balances 5,124,915$ 19,592,915$ 11,572,688$ 36,290,518$
78


CITY OF TUCSON, ARIZONACOMBINING BALANCE SHEET - ALL CAPITAL PROJECTS FUNDS
JUNE 30, 2005
Special Assessment Construction
Fund
2000 Street and Highway
Improvement
1994 Street and Highway
Improvement2000 General
Obligation FundASSETSPooled Cash and Investments $ 5,742,331$ $ 28,740,995$ Due from Other Agencies 51,651 Interfund Receivable 6,838,635 Interest Receivable 13,639 1,089 111,648 Total assets $ 5,755,970$ 1,089$ 35,742,929$
LIABILITIES AND FUND BALANCESLiabilities: Accounts Payable $ 236,356$ $ 1,731,980$ Advances from Other Funds 3,680,590 Interfund Payable 1,089 Due to Other Agencies 8,168 Total liabilities 3,680,590 236,356 1,089 1,740,148
Fund balances (deficits):
Reserved for Capital Improvements 5,519,614 34,002,781 Unreserved: Undesignated (3,680,590) Total fund balances (3,680,590) 5,519,614 34,002,781
Total liabilities and fund balances $ 5,755,970$ 1,089$ 35,742,929$
80

1994 General Obligation Fund
1984 General Obligation Fund Totals
730,477$ $ 35,213,803$ 2,693 2,571 56,915
6,838,635 13,106 691 140,173
746,276$ 3,262$ 42,249,526$
2,531$ $ 1,970,867$ 3,680,590 3,262 4,351 8,168
2,531 3,262 5,663,976
743,745 40,266,140
(3,680,590) 743,745 36,585,550
746,276$ 3,262$ 42,249,526$
81

CITY OF TUCSON, ARIZONACOMBINING BALANCE SHEET - ALL PERMANENT FUNDS
JUNE 30, 2005
Civic Endowment
FundASSETSPooled Cash and Investments 149,092$ Interest Receivable 510 Total assets 149,602$
Fund balances: Reserve for Other Purposes 149,602 Total fund balances 149,602
Total liabilities and fund balances 149,602$
82


CITY OF TUCSON, ARIZONACOMBINING STATEMENT OF REVENUES, EXPENDITURES AND CHANGES IN FUND BALANCES -
ALL NON-MAJOR GOVERNMENTAL FUNDS - BY FUND TYPEYEAR ENDED JUNE 30, 2005
Special Revenue Debt Service Capital ProjectsRevenues: Taxes $ 21,274,250$ $ Licenses and Permits 908,798 Fines and Forfeitures 1,207,715 9,155 Use of Money and Property 2,565,807 31,788 682,870 Federal Grants and Contributions 70,681,079 Other Agencies 61,893,835 7,744,361 Charges for Services 16,461,320 Special Assessments 857,396 5,926 Miscellaneous 2,785,180 Total revenues 156,503,734 29,916,950 688,796
Expenditures: Current - Elected and Official 313,819 Support Services 40,546 Neighborhood Services 81,060,951 50,498 Environment and Development 84,053,369 1,613,106 Strategic Initiatives 10,839,519 Non-Departmental 474,713 Capital Outlay 4,701,097 710,400 Capital Projects 29,735,619 22,292,325 Debt service - Principal 654,214 17,522,900 Interest 519,474 18,916,942 Fiscal Agent Fees and Other 22,703 Issuance Cost of Debt 1,104,152 262,242 Total expenditures 212,393,321 37,566,697 24,928,571
Excess (deficiency) of revenues over expenditures (55,889,587) (7,649,747) (24,239,775)
Other financing sources (uses): Face Amount of Bond Proceeds 85,825,606 23,894,000 Lease Purchase and Contracts Proceeds 11,124,130 Premium on Issuance of Debt 6,112,787 609,589 Transfers from Other Funds 51,458,391 7,813,815 3,307,040 Payment to Refunded Bond Escrow Agent (90,978,595) Transfers to Other Funds (8,469,997) (5,176,440) Total other financing sources (uses) 54,112,524 8,773,613 22,634,189
Change in fund balances (1,777,063) 1,123,866 (1,605,586)
Fund balances, beginning of year, as restated 32,755,578 5,659,074 38,191,136
Fund balances, end of year 30,978,515$ 6,782,940$ 36,585,550$
84

Civic Endowment
Fund
TotalNon-Major
Governmental Funds
$ 21,274,250$ 908,798 1,216,870
3,118 3,283,583 70,681,079 69,638,196 16,461,320 863,322 2,785,180
3,118 187,112,598
313,819 40,546
4,045 81,115,494 85,666,475 10,839,519 474,713 5,411,497 52,027,944
18,177,114 19,436,416 22,703 1,366,394
4,045 274,892,634
(927) (87,780,036)
109,719,606 11,124,130 6,722,376 62,579,246 (90,978,595) (13,646,437) 85,520,326
(927) (2,259,710)
150,529 76,756,317
149,602$ 74,496,607$
85

CITY OF TUCSON, ARIZONACOMBINING STATEMENT OF REVENUES, EXPENDITURES AND CHANGES IN FUND BALANCES -
ALL SPECIAL REVENUE FUNDSYEAR ENDED JUNE 30, 2005
Library FundPublic Safety
Academy Fund Team/ParkwiseRevenues: Licenses and Permits $ $ $ Fines and Forfeitures 483,703 546,058 Use of Money and Property 4,038 203,105 Federal Grants and Contributions Other Agencies 9,165,359 150,000 1,000,000 Charges for Services 92,309 158,045 1,779,619 Miscellaneous 220 737 142 Total revenues 9,741,591 312,820 3,528,924
Expenditures: Current - Elected and Official Support Services Neighborhood Services 19,707,025 5,792,512 Environment and Development 1,882,937 Strategic Initiatives Non-Departmental 200 Capital Outlay 82,689 37,414 Capital Projects 9,799,612 Debt service - Principal 240,000 51,000 Interest 28,475 379,689 Total expenditures 19,789,714 6,098,401 12,113,438
Excess (deficiency) of revenues over expenditures (10,048,123) (5,785,581) (8,584,514)
Other financing sources (uses): Lease Purchase and Contracts Proceeds 10,502,000 Transfers from Other Funds 10,052,144 5,691,866 28,794 Transfers to Other Funds Total other financing sources (uses) 10,052,144 5,691,866 10,530,794
Change in fund balances 4,021 (93,715) 1,946,280
Fund balances, beginning of year, as restated 4,306 93,715 405,707
Fund balances (deficits), end of year 8,327$ $ 2,351,987$
86

Convention Center Fund H.U.R.F. Fund
Civic Contribution
Fund
Human and Community
Development Fund
Development Fee Fund
Miscellaneous Housing Grant
Fund
$ 908,798$ $ $ $ $ 10,620
36,529 832,738 50,711 1,357,323 22,834 5,560,361 5,109,561 42,730,782
3,366,470 141,646 911,353 749,889 614,635
3,544,645 45,394,291 800,600 6,917,684 22,834 5,724,196
1,034 341,806 222,685 6,243,996 5,035,491 31,465,827
10,523,005 24,955 133,285 239,835
6,220 449,235 13,563 74,050 7,116,317 280,638 182,706 3,329,728 54,266
51,937 12,285 52,025 8,805
10,529,225 39,716,982 529,312 6,594,640 3,329,728 5,163,807
(6,984,580) 5,677,309 271,288 323,044 (3,306,894) 560,389
476,915 7,043,378 11,087 55,027
(8,387,093) (28,485) 7,043,378 (7,899,091) (28,485) 55,027
58,798 (2,221,782) 242,803 378,071 (3,306,894) 560,389
1,256,409 21,096,560 2,213,492 4,053,520 71,102
1,315,207$ 18,874,778$ 2,456,295$ 4,431,591$ (3,306,894)$ 631,491$
(Continued)87

CITY OF TUCSON, ARIZONACOMBINING STATEMENT OF REVENUES, EXPENDITURES AND CHANGES IN FUND BALANCES -
ALL SPECIAL REVENUE FUNDSYEAR ENDED JUNE 30, 2005
(Concluded)
Public Housing Fund
Public Housing HOME Program
FundOther Federal Grants Fund
Revenues: Licenses and Permits $ $ $ Fines and Forfeitures 167,334 Use of Money and Property 46,530 4,019 Federal Grants and Contributions 32,351,976 3,651,166 12,722,401 Other Agencies Charges for Services 2,737,454 Miscellaneous 101,172 175,899 Total revenues 35,237,132 3,827,065 12,893,754
Expenditures: Current - Elected and Official 243,285 Support Services 22,012 Neighborhood Services 34,339,413 3,682,630 4,672,466 Environment and Development 1,281,289 Strategic Initiatives 121,353 Non-Departmental Capital Outlay 145,215 1,519,619 Capital Projects 467,518 4,799,869 Debt service - Principal 86,503 212,489 Interest 50,480 Total expenditures 34,621,611 4,150,148 12,872,382
Excess (deficiency) of revenues over expenditures 615,521 (323,083) 21,372
Other financing sources (uses): Lease Purchase and Contracts Proceeds 145,215 Transfers from Other Funds Transfers to Other Funds (54,419) Total other financing sources (uses) 145,215 (54,419)
Change in fund balances 760,736 (323,083) (33,047)
Fund balances, beginning of year, as restated 1,559,338 323,083 294,273
Fund balances (deficits), end of year 2,320,074$ $ 261,226$
88

Non-Federal Grants Fund
Mass Transit Fund Totals
$ $ 908,798$ 1,207,715 7,980 2,565,807 11,285,614 70,681,079
2,681,761 6,165,933 61,893,835 8,327,423 16,461,320 89,487 2,785,180
2,681,761 25,876,437 156,503,734
69,500 313,819 18,534 40,546
1,022,927 81,060,951 407,582 49,015,734 84,053,369
36,921 10,839,519 234,678 474,713
23,320 2,349,772 4,701,097 206,908 3,498,057 29,735,619
654,214 519,474
2,020,370 54,863,563 212,393,321
661,391 (28,987,126) (55,889,587)
11,124,130 28,576,095 51,458,391 (8,469,997) 28,576,095 54,112,524
661,391 (411,031) (1,777,063)
167,098 1,216,975 32,755,578
828,489$ 805,944$ 30,978,515$
89

CITY OF TUCSON, ARIZONACOMBINING STATEMENT OF REVENUES, EXPENDITURES AND CHANGES IN FUND BALANCES -
ALL DEBT SERVICE FUNDSYEAR ENDED JUNE 30, 2005
Special Assessment Bond and
Interest Fund
General Obligation Bond and
Interest Fund
Street and Highway Bond
and Interest Fund Totals
Revenues: Taxes $ 21,274,250$ $ 21,274,250$ Fines and Forfeitures 9,155 9,155 Use of Money and Property 31,788 31,788 Other Agencies 7,744,361 7,744,361 Special Assessments 857,396 857,396 Total revenues 898,339 21,274,250 7,744,361 29,916,950
Expenditures: Debt service - Principal 452,900 8,690,000 8,380,000 17,522,900 Interest 187,446 11,688,578 7,040,918 18,916,942 Fiscal Agent Fees and Other 12,235 9,968 500 22,703 Issuance Cost of Debt 534,935 569,217 1,104,152 Total expenditures 652,581 20,923,481 15,990,635 37,566,697
Excess (deficiency) of revenues over expenditures 245,758 350,769 (8,246,274) (7,649,747)
Other financing sources (uses): Face Amount of Bond Proceeds 45,830,606 39,995,000 85,825,606 Premium on Issuance of Debt 2,478,873 3,633,914 6,112,787 Transfers from Other Funds 136,758 7,677,057 7,813,815 Payment to Refunded Bond Escrow Agent (47,918,898) (43,059,697) (90,978,595) Total other financing sources (uses) 527,339 8,246,274 8,773,613
Change in fund balances 245,758 878,108 1,123,866
Fund balances, beginning of year 1,219,842 4,439,232 5,659,074
Fund balances, end of year 1,465,600$ 5,317,340$ $ 6,782,940$
90


CITY OF TUCSON, ARIZONACOMBINING STATEMENT OF REVENUES, EXPENDITURES AND CHANGES IN FUND BALANCES -
ALL CAPITAL PROJECTS FUNDSYEAR ENDED JUNE 30, 2005
Special Assessment Construction
Fund
2000 Street and Highway
Improvement
1994 Street and Highway
ImprovementRevenues: Use of Money and Property $ 51,612$ 4,643$ Special Assessments 5,926 Total revenues 5,926 51,612 4,643
Expenditures: Current - Neighborhood Services Environment and Development 1,609,564 3,542 Capital Outlay Capital Projects 202,963 3,056,939 618,519 Debt service - Issuance Cost of Debt 94,155 Total expenditures 202,963 4,760,658 622,061
Excess (deficiency) of revenues over expenditures (197,037) (4,709,046) (617,418)
Other financing sources (uses): Face Amount of Bond Proceeds 6,000,000 Premium on Issuance of Debt 304,745 Transfers from Other Funds 464,205 Transfers to Other Funds (203,470) (221,677) Total other financing sources (uses) 260,735 6,083,068
Change in fund balances 63,698 1,374,022 (617,418)
Fund balances (deficits), beginning of year (3,744,288) 4,145,592 617,418
Fund balances (deficits), end of year (3,680,590)$ 5,519,614$ $
92

2000 General Obligation Fund
1994 General Obligation Fund
1984 General Obligation Fund Totals
565,921$ 57,101$ 3,593$ 682,870$ 5,926
565,921 57,101 3,593 688,796
18,341 32,157 50,498 1,613,106
525,604 184,796 710,400 16,373,485 1,896,052 144,367 22,292,325
168,087 262,242 17,085,517 2,113,005 144,367 24,928,571
(16,519,596) (2,055,904) (140,774) (24,239,775)
17,894,000 23,894,000 304,844 609,589
2,842,835 3,307,040 (3,633,398) (1,117,895) (5,176,440) 17,408,281 (1,117,895) 22,634,189
888,685 (3,173,799) (140,774) (1,605,586)
33,114,096 3,917,544 140,774 38,191,136
34,002,781$ 743,745$ $ 36,585,550$
93

CITY OF TUCSON, ARIZONACOMBINING STATEMENT OF REVENUES, EXPENDITURES AND CHANGES IN FUND BALANCES -
ALL PERMANENT FUNDSYEAR ENDED JUNE 30, 2005
Civic Endowment
FundRevenues: Use of Money and Property 3,118$ Total revenues 3,118
Expenditures: Current - Neighborhood Services 4,045 Total expenditures 4,045
Change in fund balances (927)
Fund balances, beginning of year 150,529
Fund balances, end of year 149,602$
94

CITY OF TUCSON, ARIZONACOMBINING STATEMENT OF NET ASSETS - ALL INTERNAL SERVICE FUNDS
JUNE 30, 2005
Fleet Services Fund
Self Insurance Fund Totals
ASSETSCurrent assets: Pooled Cash and Investments 2,573,108$ 864,466$ 3,437,574$ Accounts Receivable, Net 208,583 12,342 220,925 Interest Receivable 17,887 446,670 464,557 Other Assets - Restricted 79,313 18,619,069 18,698,382 Total current assets 2,878,891 19,942,547 22,821,438
Noncurrent assets: Land and Construction in Progress 30,242 30,242 Other Capital Assets, Net 21,787,379 89,107 21,876,486 Total noncurrent assets 21,787,379 119,349 21,906,728 Total assets 24,666,270 20,061,896 44,728,166
LIABILITIESCurrent liabilities: Accounts Payable 323,030$ 4,776,109$ 5,099,139$ Accrued Payroll Liabilities 85,173 14,311 99,484 Accrued Interest Payable 719 719 Due to Other Agencies 66 811 877 Refundable Deposits 198 198
Current Portion of Contracts Payable 24,711 24,711 Current Portion of Claims Payable 10,029,456 10,029,456 Total current liabilities 433,897 14,820,687 15,254,584
Noncurrent liabilities: Contracts Payable 39,190 39,190 Claims Payable 35,035,314 35,035,314 Total non-current liabilities 39,190 35,035,314 35,074,504 Total liabilities 473,087 49,856,001 50,329,088
NET ASSETSInvested in Capital Assets, Net of Related Debt 21,723,478 119,349 21,842,827 Restricted for Capital 79,313 79,313 Restricted for Other Purposes 18,619,069 18,619,069 Unrestricted 2,390,392 (48,532,523) (46,142,131) Total net assets 24,193,183$ (29,794,105)$ (5,600,922)$
95

CITY OF TUCSON, ARIZONACOMBINING STATEMENT OF REVENUES, EXPENSES, AND CHANGES IN FUND NET ASSETS -
ALL INTERNAL SERVICE FUNDSFOR THE YEAR ENDED JUNE 30, 2005
Fleet Services Fund
Self Insurance Fund Totals
Operating revenues: Charges for Services 17,493,118$ 17,951,874$ 35,444,992$ Miscellaneous 165,045 38,905 203,950 Total operating revenues 17,658,163 17,990,779 35,648,942
Operating expenses: Personal Services 5,570,121 974,234 6,544,355 Contractual Services 2,947,206 3,633,167 6,580,373 Commodities 9,707,105 208,529 9,915,634 Benefits and Claims 24,419,951 24,419,951 Depreciation 5,547,064 3,068 5,550,132 Total operating expenses 23,771,496 29,238,949 53,010,445
Operating loss (6,113,333) (11,248,170) (17,361,503)
Nonoperating revenues (expenses): Investment Income 83,846 281,916 365,762 Gain (Loss) on Sale of Property/Equipment 373,623 373,623 Interest Expense (3,410) (3,410) Total nonoperating revenues (expenses) 454,059 281,916 735,975
Income (loss) before operating transfers (5,659,274) (10,966,254) (16,625,528)
Transfers In 4,366,854 4,366,854 Transfers Out (228,424) (228,424)
Change in net assets (1,292,420) (11,194,678) (12,487,098)
Total net assets, beginning of year, as restated 25,485,603 (18,599,427) 6,886,176
Total net assets, end of year 24,193,183$ (29,794,105)$ (5,600,922)$
96

Fleet Services Fund
Self Insurance Fund Total
Cash Flows from Operating Activities:Cash Received from Customers 17,454,852$ 18,221,847$ 35,676,699$ Cash Payments to Suppliers for Goods and Services (13,036,719) (19,407,645) (32,444,364)Cash Payments to Employees for Services (5,578,457) (977,032) (6,555,489)Other Operating Revenues 165,045 165,045
Net Cash Provided (Used) by Operating Activities (995,279) (2,162,830) (3,158,109)
Cash Flows from Noncapital Financing Activities:Transfers to Other Funds (228,424) (228,424) Net Cash Provided (Used) by Noncapital Financing Activities (228,424) (228,424)
Cash Flows from Capital and Related Financing Activities:
Acquisition and Construction of Capital Assets (2,929,840) (2,929,840)Principal Paid on Capital Debt (23,635) (23,635)Interest Paid on Capital Debt (11,601) (11,601)Proceeds from Sale of Assets/Equipment 633,262 633,262
Net Cash Provided (Used) by Capital and RelatedFinancing Activities (2,331,814) (2,331,814)
Cash Flows from Investing Activities:Interest on Investments 78,778 298,407 377,185Proceeds from Sale of Investments 1,801,513 1,801,513
Net Cash Provided (Used) by Investing Activities 78,778 2,099,920 2,178,698
Net Increase (Decrease) in Cash and Cash Equivalents (3,248,315) (291,334) (3,539,649)
Cash and Cash Equivalents - July 1 5,821,423 1,155,800 6,977,223
Cash and Cash Equivalents - June 30 2,573,108$ 864,466$ 3,437,574$
Reconciliation of Operating Income (Loss) to Net Cash Provided (Used) by Operating Activities:Operating Income (Loss) (6,113,333)$ (11,248,170)$ (17,361,503)$ Adjustments to Reconcile Operating Income (Loss) toNet Cash Provided (Used) by Operating Activities:
Depreciation/Goodwill Amortization 5,547,064 3,068 5,550,132Decrease (Increase) in Assets:
Accounts Receivable (101,247) (12,342) (113,589)Internal Receivable 2,500 243,410 245,910Due from Other Agencies 62,782 62,782
Increase (Decrease) in Liabilities:Accounts Payable (384,793) 4,645,795 4,261,002Accrued Payroll Liabilities (8,336) (2,798) (11,134)Customer/Refundable Deposits 198 198Due to Other Agencies (114) 339 225Due to Other Funds - Unrestricted (1,144,260) (1,144,260)Claims and Judgements Payable 5,352,128 5,352,128
Net Cash Provided (Used) by Operating Activities (995,279)$ (2,162,830)$ (3,158,109)$
Noncash investing, capital and financing activities:
In the Fleet Service Internal Service Fund, City funds contributed vehicles and equipment with a net book valueof $4,366,854.
CITY OF TUCSON, ARIZONACOMBINING STATEMENT OF CASH FLOWS -
ALL INTERNAL SERVICE FUNDSFOR THE YEAR ENDED JUNE 30, 2005
97

CITY OF TUCSON, ARIZONACOMBINING STATEMENT OF FIDUCIARY NET ASSETS -
ALL PENSION TRUST FUNDSJUNE 30, 2005
Deferred Compensation
PlanSupplemental
Retirement Fund TotalsASSETSPooled Cash and Investments $ 1,566,343$ 1,566,343$ Employer Contributions 837,577 837,577 Employee Contributions 198,060 315,282 513,342 Interest and Dividends 895,609 1,297,426 2,193,035 Due from Brokers 4,783,586 4,783,586 Short-term Investments 5,761,617 5,761,617 Sercurities Lending Collateral 14,290,998 33,158,524 47,449,522 U.S. Government Obligations 49,020,569 64,459,422 113,479,991 Bonds and Preferred Stocks 20,297,761 24,213,206 44,510,967 Common Stocks 284,758,229 284,758,229 International Investments 81,560,958 81,560,958 Mutual Funds 74,123,361 74,123,361 Real Estate 30,232,095 30,232,095 Other Capital Assets, Net 10,748 10,748 Total assets 84,702,997 607,078,374 691,781,371
LIABILITIESAccounts Payable 19,617 484,624 504,241 Accrued Payroll Liabilities 3,295 3,295 Due to Other Agencies 46,348 1,652 48,000 Due to Securities Borrowers 14,290,998 33,158,524 47,449,522 Due to Brokers 14,286,225 14,286,225 Refundable Deposits 179 1,856 2,035 Total liabilities 14,357,142 47,936,176 62,293,318
NET ASSETSHeld in trust 70,345,855$ 559,142,198$ 629,488,053$
98

CITY OF TUCSON, ARIZONACOMBINING STATEMENT OF CHANGES IN FIDUCIARY NET ASSETS-
ALL PENSION TRUST FUNDSJUNE 30, 2005
Deferred Compensation
PlanSupplemental
Retirement Fund TotalsAdditions: Employer $ 21,423,488$ 21,423,488$ Employees 6,090,870 9,611,117 15,701,987 Other Plans 857,399 857,399 Net Increase (Decrease) in Fair Value of Investment 308,414 33,977,326 34,285,740 Interest, Dividends and Other Income 3,613,079 13,472,425 17,085,504 Securities Lending Income 291,933 879,477 1,171,410 Less: Investment Activity Expense (17,912) (2,581,056) (2,598,968) Less: Securities Lending Expense (257,388) (819,201) (1,076,589) Miscellaneous Additions 43,387 43,387 Total additions 10,028,996 76,864,362 86,893,358
Deductions: Payments to Participants 960,771 31,357,794 32,318,565 Refunds and Transfers to Other Plans 3,837,704 1,438,677 5,276,381 Administrative Expense 141,166 389,303 530,469 Total deductions 4,939,641 33,185,774 38,125,415
Changes in net assets 5,089,355 43,678,588 48,767,943
Net assets, beginning of year 65,256,500 515,463,610 580,720,110
Net assets, end of year 70,345,855$ 559,142,198$ 629,488,053$
99

CITY OF TUCSON, ARIZONACOMBINING STATEMENT OF FIDUCIARY ASSETS AND LIABILITIES
ALL AGENCY FUNDSJUNE 30, 2005
Balance Balance July 1, 2004 Additions Deductions July 1, 2005
Sewer User Fee FundAssetsPooled Cash and Investments 1,239,055$ 82,459,119$ 80,974,563$ 2,723,611$ Accounts Receivable, Net 2,660,045 80,513,757 80,284,467 2,889,335 Interest Receivable 5,166 182,454 181,724 5,896 Total assets 3,904,266$ 163,155,330$ 161,440,754$ 5,618,842$
LiabilitiesAccounts Payable 43,793,203 41,413,937 2,379,266 Due to Other Agencies 3,904,266 111,279,713 111,944,403 3,239,576 Total liabilities 3,904,266$ 155,072,916$ 153,358,340$ 5,618,842$
Employee Prepaid Insurance FundAssetsPooled Cash and Investments $ 148,791,772$ 148,699,433$ 92,339$ Accounts Receivable, Net 1,715,894 151,302 1,831,831 35,365 Other 292,330 292,330 Total assets 1,715,894$ 149,235,404$ 150,531,264$ 420,034$
LiabilitiesAccounts Payable 511,733 152,347,134 152,438,833 420,034 Due to Other Agencies 1,204,161 1,204,161 2,408,322 - Total liabilities 1,715,894$ 153,551,295$ 154,847,155$ 420,034$
TotalsAssetsPooled Cash and Investments 1,239,055$ 231,250,891$ 229,673,996$ 2,815,950$ Accounts Receivable, Net 4,375,939 80,665,059 82,116,298 2,924,700 Interest Receivable 5,166 182,454 181,724 5,896 Other 292,330 292,330 Total assets 5,620,160$ 312,390,734$ 311,972,018$ 6,038,876$
LiabilitiesAccounts Payable 511,733 196,140,337 193,852,770 2,799,300 Due to Other Agencies 5,108,427 112,483,874 114,352,725 3,239,576 Total liabilities 5,620,160$ 308,624,211$ 308,205,495$ 6,038,876$
100

101
BUDGET AND ACTUALNONMAJOR
GOVERNMENTAL FUNDS

CITY OF TUCSON, ARIZONACOMBINING SCHEDULE OF REVENUES, EXPENDITURES AND CHANGES INFUND BALANCES - BUDGET AND ACTUAL - ALL SPECIAL REVENUE FUNDS
YEAR ENDED JUNE 30, 2005
Library Fund
Budget Actual
Variance - Positive
(Negative)Revenues: Licenses and Permits $ $ $ Fines and Forfeitures 570,000 483,703 (86,297) Use of Money and Property Federal Grants and Contributions Other Agencies 9,840,330 9,165,359 (674,971) Charges for Services 92,309 92,309 Miscellaneous 220 220 Total revenues 10,410,330 9,741,591 (668,739)
Expenditures: Current - Elected and Official Support Services Neighborhood Services 19,297,210 19,707,025 (409,815) Environment and Development Strategic Initiatives Non-Departmental Capital Outlay 118,240 82,689 35,551 Capital Projects Debt service - Principal Interest Fiscal Agent Fees and Other Total expenditures 19,415,450 19,789,714 (374,264)
Excess (deficiency) of revenues over expenditures (9,005,120) (10,048,123) (1,043,003)
Other financing sources (uses): Lease Purchase and Contracts Proceeds Transfers from Other Funds 9,005,120 10,052,144 1,047,024 Transfers to Other Funds Total other financing sources (uses) 9,005,120 10,052,144 1,047,024
Change in fund balances 4,021 4,021
Fund balances, July 1, 2004, as restated 4,306 4,306
Fund balances (deficits), June 30, 2005 $ 8,327$ 8,327$
102

Public Safety Academy Fund Team/Parkwise
Budget Actual
Variance - Positive
(Negative) Budget Actual
Variance - Positive
(Negative)
$ $ $ 840,000$ $ (840,000)$ 326,000 546,058 220,058
4,038 4,038 203,105 203,105
190,000 150,000 (40,000) 1,000,000 1,000,000 661,580 158,045 (503,535) 1,690,000 1,779,619 89,619
737 737 1,773,480 142 (1,773,338) 851,580 312,820 (538,760) 4,629,480 3,528,924 (1,100,556)
5,549,060 5,792,512 (243,452) 105,960 105,960 2,429,308 1,882,937 546,371
3,519 200 3,319 42,500 37,414 5,086
11,005,233 9,799,612 1,205,621
240,000 240,000 85,000 51,000 34,000 27,310 28,475 (1,165) 387,290 379,689 7,601
113,170 113,170 5,858,870 6,098,401 (239,531) 14,129,480 12,113,438 2,016,042
(5,007,290) (5,785,581) (778,291) (9,500,000) (8,584,514) 915,486
9,500,000 10,502,000 1,002,000 4,917,960 5,691,866 773,906 28,794 28,794
4,917,960 5,691,866 773,906 9,500,000 10,530,794 1,030,794
(89,330) (93,715) (4,385) 1,946,280 1,946,280
93,715 93,715 405,707 405,707
(89,330)$ $ 89,330$ $ 2,351,987$ 2,351,987$
(Continued)103

CITY OF TUCSON, ARIZONACOMBINING SCHEDULE OF REVENUES, EXPENDITURES AND CHANGES INFUND BALANCES - BUDGET AND ACTUAL - ALL SPECIAL REVENUE FUNDS
YEAR ENDED JUNE 30, 2005(Continued)
Convention Center Fund
Budget Actual
Variance - Positive
(Negative)Revenues: Licenses and Permits $ $ $ Fines and Forfeitures Use of Money and Property 36,529 36,529 Federal Grants and Contributions Other Agencies Charges for Services 3,820,000 3,366,470 (453,530) Miscellaneous 141,646 141,646 Total revenues 3,820,000 3,544,645 (275,355)
Expenditures: Current - Elected and Official Support Services Neighborhood Services Environment and Development Strategic Initiatives 9,629,730 10,523,005 (893,275) Non-Departmental Capital Outlay 650,000 6,220 643,780 Capital Projects Debt service - Principal Interest Fiscal Agent Fees and Other Total expenditures 10,279,730 10,529,225 (249,495)
Excess (deficiency) of revenues over expenditures (6,459,730) (6,984,580) (524,850)
Other financing sources (uses): Lease Purchase and Contracts Proceeds Transfers from Other Funds 6,459,730 7,043,378 583,648 Transfers to Other Funds Total other financing sources (uses) 6,459,730 7,043,378 583,648
Change in fund balances 58,798 58,798
Fund balances, July 1, 2004, as restated 1,256,409 1,256,409
Fund balances (deficits), June 30, 2005 $ 1,315,207$ 1,315,207$
*The Civic Contribution Fund Fund was included in the budget, however, the budget was -0-.104

H.U.R.F. Fund Civic Contribution Fund
Budget Actual
Variance - Positive
(Negative) Budget* Actual
Variance - Positive
(Negative)
1,100,000$ 908,798$ (191,202)$ $ $ $ 10,620 10,620
464,000 832,738 368,738 50,711 50,711
32,465,010 42,730,782 10,265,772
14,171,020 911,353 (13,259,667) 749,889 749,889 48,200,030 45,394,291 (2,805,739) 800,600 800,600
1,034 (1,034)
1,680,935 341,806 1,339,129 222,685 (222,685) 31,987,426 31,465,827 521,599
24,955 (24,955) 411,330 239,835 171,495
1,286,284 449,235 837,049 12,941,851 7,116,317 5,825,534 280,638 (280,638)
248,630 51,937 196,693 89,150 52,025 37,125
48,645,606 39,716,982 8,928,624 529,312 (529,312)
(445,576) 5,677,309 6,122,885 271,288 271,288
557,000 476,915 (80,085) 11,087 11,087 (8,387,093) (8,387,093) (28,485) (28,485)
557,000 (7,899,091) (8,456,091) (28,485) (28,485)
111,424 (2,221,782) (2,333,206) 242,803 242,803
21,096,560 21,096,560 2,213,492 2,213,492
111,424$ 18,874,778$ 18,763,354$ $ 2,456,295$ 2,456,295$
(Continued)105
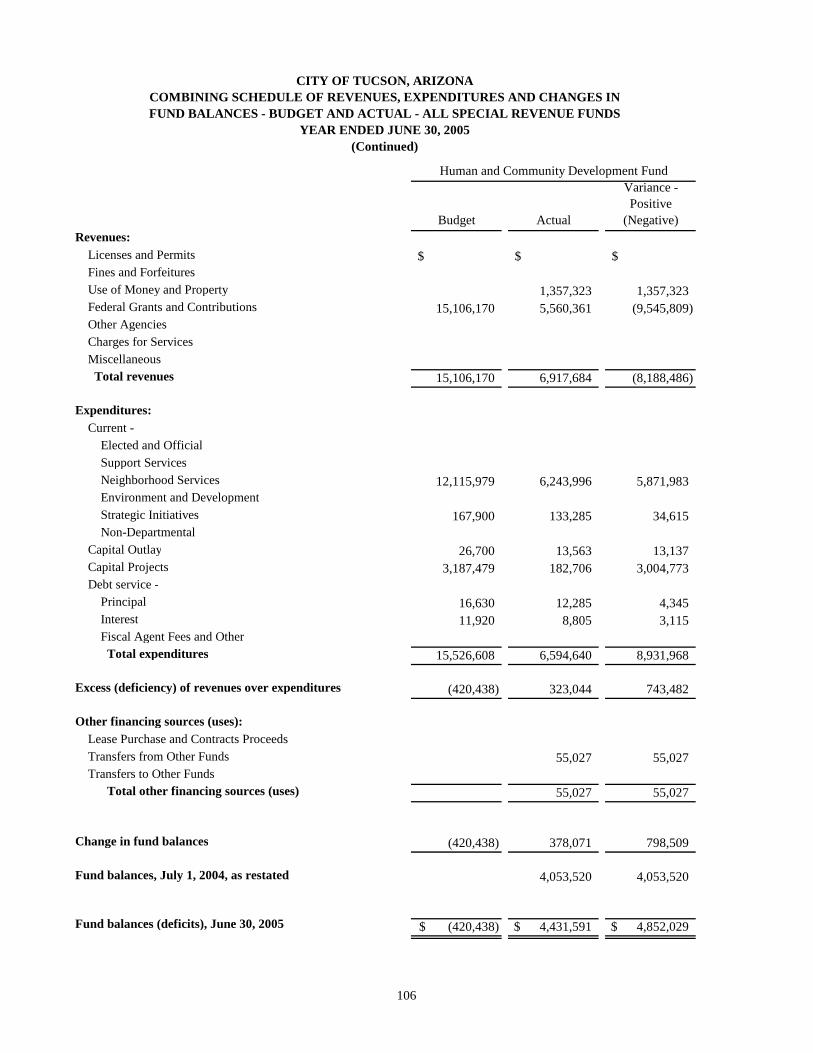
CITY OF TUCSON, ARIZONACOMBINING SCHEDULE OF REVENUES, EXPENDITURES AND CHANGES INFUND BALANCES - BUDGET AND ACTUAL - ALL SPECIAL REVENUE FUNDS
YEAR ENDED JUNE 30, 2005(Continued)
Human and Community Development Fund
Budget Actual
Variance - Positive
(Negative)Revenues: Licenses and Permits $ $ $ Fines and Forfeitures Use of Money and Property 1,357,323 1,357,323 Federal Grants and Contributions 15,106,170 5,560,361 (9,545,809) Other Agencies Charges for Services Miscellaneous Total revenues 15,106,170 6,917,684 (8,188,486)
Expenditures: Current - Elected and Official Support Services Neighborhood Services 12,115,979 6,243,996 5,871,983 Environment and Development Strategic Initiatives 167,900 133,285 34,615 Non-Departmental Capital Outlay 26,700 13,563 13,137 Capital Projects 3,187,479 182,706 3,004,773 Debt service - Principal 16,630 12,285 4,345 Interest 11,920 8,805 3,115 Fiscal Agent Fees and Other Total expenditures 15,526,608 6,594,640 8,931,968
Excess (deficiency) of revenues over expenditures (420,438) 323,044 743,482
Other financing sources (uses): Lease Purchase and Contracts Proceeds Transfers from Other Funds 55,027 55,027 Transfers to Other Funds Total other financing sources (uses) 55,027 55,027
Change in fund balances (420,438) 378,071 798,509
Fund balances, July 1, 2004, as restated 4,053,520 4,053,520
Fund balances (deficits), June 30, 2005 (420,438)$ 4,431,591$ 4,852,029$
106

Development Fee Fund Miscellaneous Housing Grant Fund
Budget Actual
Variance - Positive
(Negative) Budget Actual
Variance - Positive
(Negative)
$ $ $ $ $ $
22,834 22,834 18,660,630 5,109,561 (13,551,069)
614,635 614,635 22,834 22,834 18,660,630 5,724,196 (12,936,434)
9,571,350 5,035,491 4,535,859
25,125 74,050 (48,925) 3,500,000 3,329,728 170,272 1,267,654 54,266 1,213,388
3,500,000 3,329,728 170,272 10,864,129 5,163,807 5,700,322
(3,500,000) (3,306,894) 193,106 7,796,501 560,389 (7,236,112)
(3,500,000) (3,306,894) 193,106 7,796,501 560,389 (7,236,112)
71,102 71,102
(3,500,000)$ (3,306,894)$ 193,106$ 7,796,501$ 631,491$ (7,165,010)$
(Continued)107

CITY OF TUCSON, ARIZONACOMBINING SCHEDULE OF REVENUES, EXPENDITURES AND CHANGES INFUND BALANCES - BUDGET AND ACTUAL - ALL SPECIAL REVENUE FUNDS
YEAR ENDED JUNE 30, 2005(Continued)
Public Housing Fund
Budget Actual
Variance - Positive
(Negative)Revenues: Licenses and Permits $ $ $ Fines and Forfeitures Use of Money and Property 46,530 46,530 Federal Grants and Contributions 31,301,290 32,351,976 1,050,686 Other Agencies Charges for Services 2,680,860 2,737,454 56,594 Miscellaneous 101,172 101,172 Total revenues 33,982,150 35,237,132 1,254,982
Expenditures: Current - Elected and Official Support Services Neighborhood Services 35,018,269 34,339,413 678,856 Environment and Development Strategic Initiatives Non-Departmental Capital Outlay 8,090 145,215 (137,125) Capital Projects Debt service - Principal 50,280 86,503 (36,223) Interest 35,540 50,480 (14,940) Fiscal Agent Fees and Other Total expenditures 35,112,179 34,621,611 490,568
Excess (deficiency) of revenues over expenditures (1,130,029) 615,521 1,745,550
Other financing sources (uses): Lease Purchase and Contracts Proceeds 145,215 145,215 Transfers from Other Funds Transfers to Other Funds Total other financing sources (uses) 145,215 145,215
Change in fund balances (1,130,029) 760,736 1,890,765
Fund balances, July 1, 2004, as restated 1,559,338 1,559,338
Fund balances (deficits), June 30, 2005 (1,130,029)$ 2,320,074$ 3,450,103$
108

Public Housing HOME Program Fund Other Federal Grants Fund
Budget Actual
Variance - Positive
(Negative) Budget Actual
Variance - Positive
(Negative)
$ $ $ $ $ $ 167,334 167,334 4,019 4,019
9,344,710 3,651,166 (5,693,544) 22,532,510 12,722,401 (9,810,109)
175,899 175,899 9,344,710 3,827,065 (5,517,645) 22,532,510 12,893,754 (9,638,756)
378,130 243,285 134,845 1,500,000 22,012 1,477,988
9,651,558 3,682,630 5,968,928 6,773,093 4,672,466 2,100,627 1,037,990 1,281,289 (243,299)
612,650 121,353 491,297
21,240 21,240 3,260,771 1,519,619 1,741,152 821,789 467,518 354,271 11,671,000 4,799,869 6,871,131
3,460 3,460 212,489 (212,489) 2,480 2,480
10,500,527 4,150,148 6,350,379 25,233,634 12,872,382 12,361,252
(1,155,817) (323,083) 832,734 (2,701,124) 21,372 2,722,496
(54,419) (54,419) (54,419) (54,419)
(1,155,817) (323,083) 832,734 (2,701,124) (33,047) 2,668,077
323,083 323,083 294,273 294,273
(1,155,817)$ $ 1,155,817$ (2,701,124)$ 261,226$ 2,962,350$
(Continued)109

CITY OF TUCSON, ARIZONACOMBINING SCHEDULE OF REVENUES, EXPENDITURES AND CHANGES INFUND BALANCES - BUDGET AND ACTUAL - ALL SPECIAL REVENUE FUNDS
YEAR ENDED JUNE 30, 2005(Concluded)
Non-Federal Grants Fund
Budget Actual
Variance - Positive
(Negative)Revenues: Licenses and Permits $ $ $ Fines and Forfeitures Use of Money and Property Federal Grants and Contributions Other Agencies 8,307,830 2,681,761 (5,626,069) Charges for Services Miscellaneous Total revenues 8,307,830 2,681,761 (5,626,069)
Expenditures: Current - Elected and Official 138,300 69,500 68,800 Support Services 1,535,000 18,534 1,516,466 Neighborhood Services 4,601,841 1,022,927 3,578,914 Environment and Development 853,470 407,582 445,888 Strategic Initiatives 284,280 36,921 247,359 Non-Departmental 200,000 234,678 (34,678) Capital Outlay 375,939 23,320 352,619 Capital Projects 319,000 206,908 112,092 Debt service - Principal Interest Fiscal Agent Fees and Other Total expenditures 8,307,830 2,020,370 6,287,460
Excess (deficiency) of revenues over expenditures 661,391 661,391
Other financing sources (uses): Lease Purchase and Contracts Proceeds Transfers from Other Funds Transfers to Other Funds Total other financing sources (uses)
Change in fund balances 661,391 661,391
Fund balances, July 1, 2004, as restated 167,098 167,098
Fund balances (deficits), June 30, 2005 $ 828,489$ 828,489$
110

Mass Transit Fund Totals
Budget Actual
Variance - Positive
(Negative) Budget Actual
Variance - Positive
(Negative)
$ $ $ 1,940,000$ 908,798$ (1,031,202)$ 896,000 1,207,715 311,715
7,980 7,980 464,000 2,565,807 2,101,807 32,459,730 11,285,614 (21,174,116) 129,405,040 70,681,079 (58,723,961)
5,346,230 6,165,933 819,703 56,149,400 61,893,835 5,744,435 8,125,000 8,327,423 202,423 16,977,440 16,461,320 (516,120) 1,940,800 89,487 (1,851,313) 17,885,300 2,785,180 (15,100,120)
47,871,760 25,876,437 (21,995,323) 223,717,180 156,503,734 (67,213,446)
516,430 313,819 202,611 3,035,000 40,546 2,994,454
104,365,255 81,060,951 23,304,304 51,504,477 49,015,734 2,488,743 87,812,671 84,053,369 3,759,302
10,694,560 10,839,519 (144,959) 614,849 474,713 140,136
14,004,950 2,349,772 11,655,178 19,819,839 4,701,097 15,118,742 11,969,410 3,498,057 8,471,353 56,683,416 29,735,619 26,947,797
644,000 654,214 (10,214) 553,690 519,474 34,216 113,170 113,170
77,478,837 54,863,563 22,615,274 284,852,880 212,393,321 72,459,559
(29,607,077) (28,987,126) 619,951 (61,135,700) (55,889,587) 5,246,113
10,057,000 11,124,130 1,067,130 33,382,270 28,576,095 (4,806,175) 53,765,080 51,458,391 (2,306,689)
(8,469,997) (8,469,997) 33,382,270 28,576,095 (4,806,175) 63,822,080 54,112,524 (9,709,556)
3,775,193 (411,031) (4,186,224) 2,686,380 (1,777,063) (4,463,443)
1,216,975 1,216,975 32,755,578 32,755,578
3,775,193$ 805,944$ (2,969,249)$ 2,686,380$ 30,978,515$ 28,292,135$
111
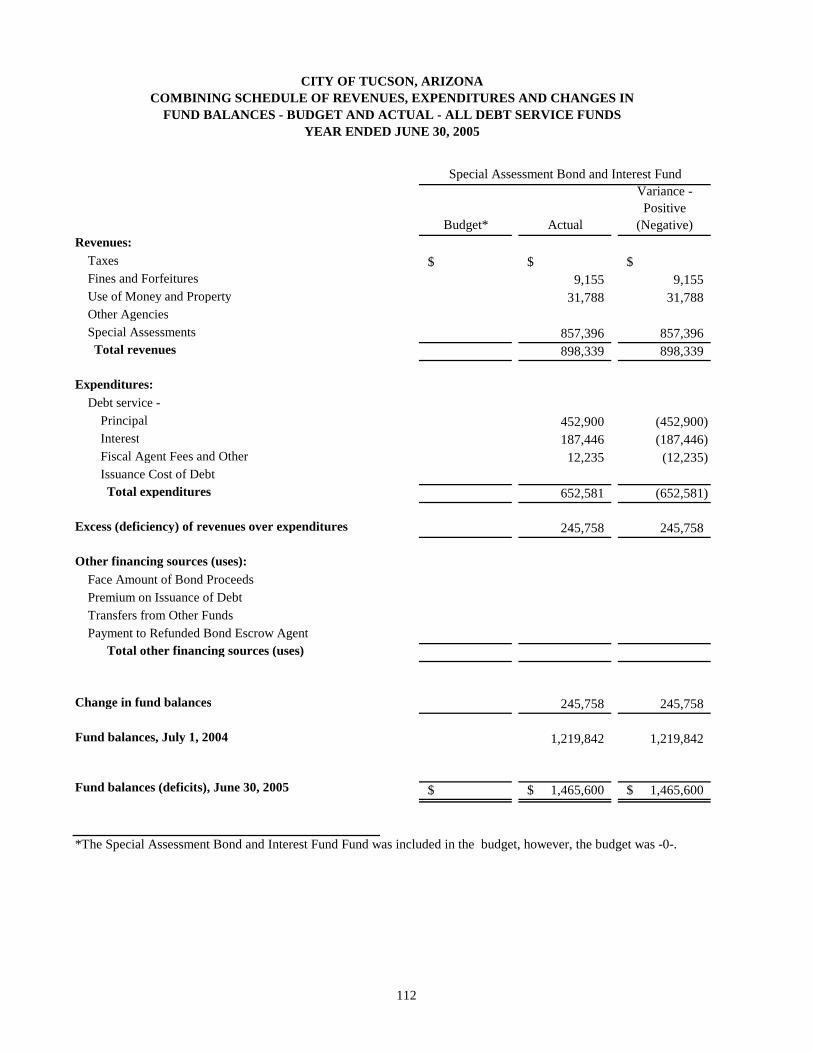
CITY OF TUCSON, ARIZONACOMBINING SCHEDULE OF REVENUES, EXPENDITURES AND CHANGES IN
FUND BALANCES - BUDGET AND ACTUAL - ALL DEBT SERVICE FUNDSYEAR ENDED JUNE 30, 2005
Special Assessment Bond and Interest Fund
Budget* Actual
Variance - Positive
(Negative)Revenues: Taxes $ $ $ Fines and Forfeitures 9,155 9,155 Use of Money and Property 31,788 31,788 Other Agencies Special Assessments 857,396 857,396 Total revenues 898,339 898,339
Expenditures: Debt service - Principal 452,900 (452,900) Interest 187,446 (187,446) Fiscal Agent Fees and Other 12,235 (12,235) Issuance Cost of Debt Total expenditures 652,581 (652,581)
Excess (deficiency) of revenues over expenditures 245,758 245,758
Other financing sources (uses): Face Amount of Bond Proceeds Premium on Issuance of Debt Transfers from Other Funds Payment to Refunded Bond Escrow Agent Total other financing sources (uses)
Change in fund balances 245,758 245,758
Fund balances, July 1, 2004 1,219,842 1,219,842
Fund balances (deficits), June 30, 2005 $ 1,465,600$ 1,465,600$
*The Special Assessment Bond and Interest Fund Fund was included in the budget, however, the budget was -0-.
112
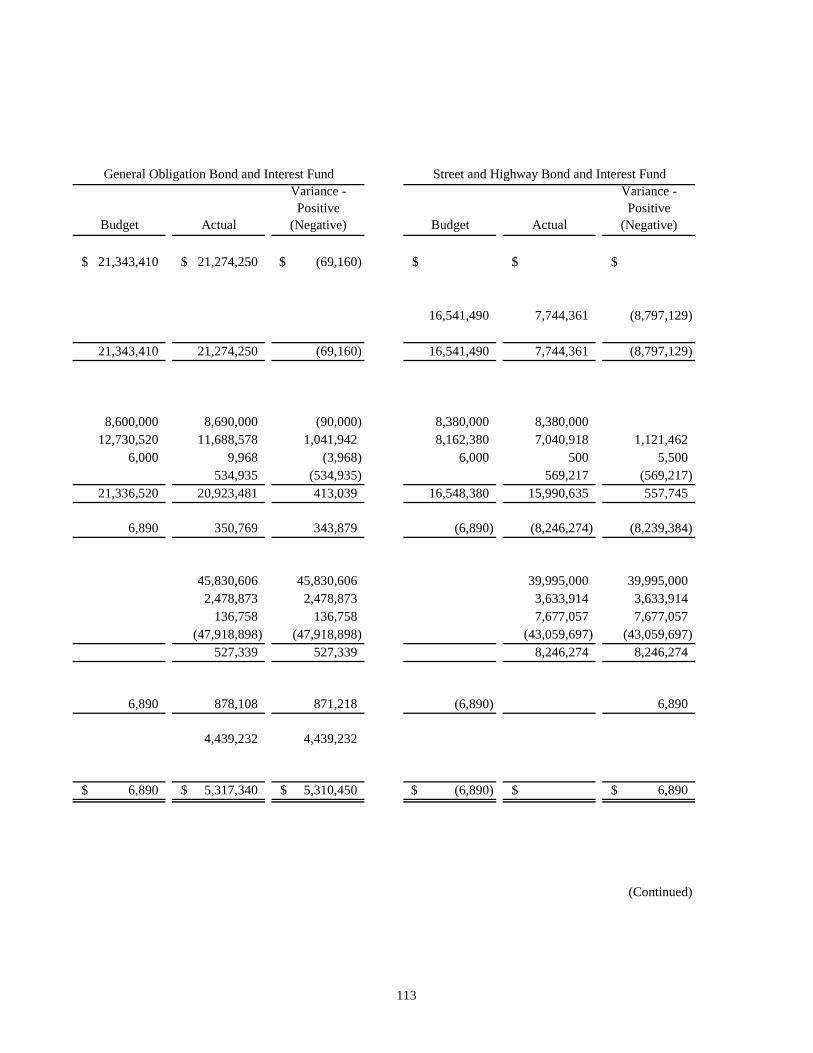
General Obligation Bond and Interest Fund Street and Highway Bond and Interest Fund
Budget Actual
Variance - Positive
(Negative) Budget Actual
Variance - Positive
(Negative)
21,343,410$ 21,274,250$ (69,160)$ $ $ $
16,541,490 7,744,361 (8,797,129)
21,343,410 21,274,250 (69,160) 16,541,490 7,744,361 (8,797,129)
8,600,000 8,690,000 (90,000) 8,380,000 8,380,000 12,730,520 11,688,578 1,041,942 8,162,380 7,040,918 1,121,462
6,000 9,968 (3,968) 6,000 500 5,500 534,935 (534,935) 569,217 (569,217)
21,336,520 20,923,481 413,039 16,548,380 15,990,635 557,745
6,890 350,769 343,879 (6,890) (8,246,274) (8,239,384)
45,830,606 45,830,606 39,995,000 39,995,000 2,478,873 2,478,873 3,633,914 3,633,914 136,758 136,758 7,677,057 7,677,057 (47,918,898) (47,918,898) (43,059,697) (43,059,697) 527,339 527,339 8,246,274 8,246,274
6,890 878,108 871,218 (6,890) 6,890
4,439,232 4,439,232
6,890$ 5,317,340$ 5,310,450$ (6,890)$ $ 6,890$
(Continued)
113

CITY OF TUCSON, ARIZONACOMBINING SCHEDULE OF REVENUES, EXPENDITURES AND CHANGES IN
FUND BALANCES - BUDGET AND ACTUAL - ALL DEBT SERVICE FUNDSYEAR ENDED JUNE 30, 2005
(Concluded)
Totals
Budget Actual
Variance - Positive
(Negative)Revenues: Taxes 21,343,410$ 21,274,250$ (69,160)$ Fines and Forfeitures 9,155 9,155 Use of Money and Property 31,788 31,788 Other Agencies 16,541,490 7,744,361 (8,797,129) Special Assessments 857,396 857,396 Total revenues 37,884,900 29,916,950 (7,967,950)
Expenditures: Debt service - Principal 16,980,000 17,522,900 (542,900) Interest 20,892,900 18,916,942 1,975,958 Fiscal Agent Fees and Other 12,000 22,703 (10,703) Issuance Cost of Debt 1,104,152 (1,104,152) Total expenditures 37,884,900 37,566,697 318,203
Excess (deficiency) of revenues over expenditures (7,649,747) (7,649,747)
Other financing sources (uses): Face Amount of Bond Proceeds 85,825,606 85,825,606 Premium on Issuance of Debt 6,112,787 6,112,787 Transfers from Other Funds 7,813,815 7,813,815 Payment to Refunded Bond Escrow Agent (90,978,595) (90,978,595) Total other financing sources (uses) 8,773,613 8,773,613
Change in fund balances 1,123,866 1,123,866
Fund balances, July 1, 2004 5,659,074 5,659,074
Fund balances (deficits), June 30, 2005 $ 6,782,940$ 6,782,940$
114


CITY OF TUCSON, ARIZONACOMBINING SCHEDULE OF REVENUES, EXPENDITURES AND CHANGES IN
FUND BALANCES - BUDGET AND ACTUAL - ALL CAPITAL PROJECTS FUNDSYEAR ENDED JUNE 30, 2005
Special Assessment Construction Fund
Budget Actual
Variance - Positive
(Negative)Revenues: Use of Money and Property $ $ $ Special Assessments 5,926 5,926 Total revenues 5,926 5,926
Expenditures: Current - Neighborhood Services Environment and Development Environmental Services Capital Outlay Capital Projects 785,000 202,963 582,037 Debt service - Issuance Cost of Debt Total expenditures 785,000 202,963 582,037
Excess (deficiency) of revenues over expenditures (785,000) (197,037) 587,963
Other financing sources (uses): Face Amount of Bond Proceeds Premium on Issuance of Debt Transfers from Other Funds 464,205 464,205 Transfers to Other Funds (203,470) (203,470) Total other financing sources (uses) 260,735 260,735
Change in fund balances (785,000) 63,698 848,698
Fund balances (deficits), July 1, 2004 (3,744,288) (3,744,288)
Fund balances (deficits), June 30, 2005 (785,000)$ (3,680,590)$ (2,895,590)$
116

2000 Street and Highway Improvement 1994 Street and Highway Improvement
Budget Actual
Variance - Positive
(Negative) Budget Actual
Variance - Positive
(Negative)
$ 51,612$ 51,612$ $ 4,643$ 4,643$
51,612 51,612 4,643 4,643
2,175,567 1,609,564 566,003 9,639 3,542 6,097
7,246,628 3,056,939 4,189,689 620,612 618,519 2,093
94,155 (94,155) 9,422,195 4,760,658 4,661,537 630,251 622,061 8,190
(9,422,195) (4,709,046) 4,713,149 (630,251) (617,418) 12,833
4,773,300 6,000,000 1,226,700 304,745 304,745
(221,677) (221,677) 4,773,300 6,083,068 1,309,768
(4,648,895) 1,374,022 6,022,917 (630,251) (617,418) 12,833
4,145,592 4,145,592 617,418 617,418
(4,648,895)$ 5,519,614$ 10,168,509$ (630,251)$ $ 630,251$
(Continued)
117

CITY OF TUCSON, ARIZONACOMBINING SCHEDULE OF REVENUES, EXPENDITURES AND CHANGES IN
FUND BALANCES - BUDGET AND ACTUAL - ALL CAPITAL PROJECTS FUNDSYEAR ENDED JUNE 30, 2005
(Continued)
2000 General Obligation Fund
Budget Actual
Variance - Positive
(Negative)Revenues: Use of Money and Property $ 565,921$ 565,921$ Special Assessments Total revenues 565,921 565,921
Expenditures: Current - Neighborhood Services 500,359 18,341 482,018 Environment and Development Environmental Services 2,289,664 2,289,664 Capital Outlay 351,315 525,604 (174,289) Capital Projects 55,082,064 16,373,485 38,708,579 Debt service - Issuance Cost of Debt 168,087 (168,087) Total expenditures 58,223,402 17,085,517 41,137,885
Excess (deficiency) of revenues over expenditures (58,223,402) (16,519,596) 41,703,806
Other financing sources (uses): Face Amount of Bond Proceeds 60,032,900 17,894,000 (42,138,900) Premium on Issuance of Debt 304,844 304,844 Transfers from Other Funds 2,842,835 2,842,835 Transfers to Other Funds (3,633,398) (3,633,398) Total other financing sources (uses) 60,032,900 17,408,281 (42,624,619)
Change in fund balances 1,809,498 888,685 (920,813)
Fund balances (deficits), July 1, 2004 33,114,096 33,114,096
Fund balances (deficits), June 30, 2005 1,809,498$ 34,002,781$ 32,193,283$
118

1994 General Obligation Fund 1984 General Obligation Fund
Budget Actual
Variance - Positive
(Negative) Budget Actual
Variance - Positive
(Negative)
$ 57,101$ 57,101$ $ 3,593$ 3,593$
57,101 57,101 3,593 3,593
725,076 32,157 692,919 521,785 521,785
184,796 (184,796) 1,856,430 1,896,052 (39,622) 382,423 144,367 238,056
3,103,291 2,113,005 990,286 382,423 144,367 238,056
(3,103,291) (2,055,904) 1,047,387 (382,423) (140,774) 241,649
(1,117,895) (1,117,895) (1,117,895) (1,117,895)
(3,103,291) (3,173,799) (70,508) (382,423) (140,774) 241,649
3,917,544 3,917,544 140,774 140,774
(3,103,291)$ 743,745$ 3,847,036$ (382,423)$ $ 382,423$
(Continued)
119

CITY OF TUCSON, ARIZONACOMBINING SCHEDULE OF REVENUES, EXPENDITURES AND CHANGES IN
FUND BALANCES - BUDGET AND ACTUAL - ALL CAPITAL PROJECTS FUNDSYEAR ENDED JUNE 30, 2005
(Concluded)
Totals
Budget Actual
Variance - Positive
(Negative)Revenues: Use of Money and Property $ 682,870$ 682,870$ Special Assessments 5,926 5,926 Total revenues 688,796 688,796
Expenditures: Current - Neighborhood Services 1,225,435 50,498 1,174,937 Environment and Development 2,706,991 1,613,106 1,093,885 Environmental Services 2,289,664 2,289,664 Capital Outlay 351,315 710,400 (359,085) Capital Projects 65,973,157 22,292,325 43,680,832 Debt service - Issuance Cost of Debt 262,242 (262,242) Total expenditures 72,546,562 24,928,571 47,617,991
Excess (deficiency) of revenues over expenditures (72,546,562) (24,239,775) 48,306,787
Other financing sources (uses): Face Amount of Bond Proceeds 64,806,200 23,894,000 (40,912,200) Premium on Issuance of Debt 609,589 609,589 Transfers from Other Funds 3,307,040 3,307,040 Transfers to Other Funds (5,176,440) (5,176,440) Total other financing sources (uses) 64,806,200 22,634,189 (42,172,011)
Change in fund balances (7,740,362) (1,605,586) 6,134,776
Fund balances (deficits), July 1, 2004 38,191,136 38,191,136
Fund balances (deficits), June 30, 2005 (7,740,362)$ 36,585,550$ 44,325,912$
120

Operating revenues: Budget Actual
Variance - Positive
(Negative) Fines and Forfeitures $ $ 5,087 $ 5,087 Charges for Services 30,299,070 34,013,740 3,714,670 Miscellaneous 1,488,141 1,488,141 Other Agencies 329,600 88,829 (240,771) Total operating revenues 30,628,670 35,595,797 4,967,127
Operating expenses: Personal Services 14,886,090 14,647,718 (238,372) Contractual Services 23,026,726 11,929,285 (11,097,441) Commodities 10,844,184 3,754,384 (7,089,800) Depreciation 7,306,145 7,306,145 Total operating expenses 48,757,000 37,637,532 (11,119,468)
Operating loss (18,128,330) (2,041,735) 16,086,595
Nonoperating revenues (expenses): Investment Income 43,671 43,671 Gain (Loss) on Sale of Property/Equipment 70,489 70,489 Federal Grants and Contributions 1,510,000 81,638 (1,428,362) Interest Expense (1,806,732) (1,806,732) Amortization of Cost Issuance (19,818) (19,818) Other Non-Operating (Income) Expenses 6,724,140 (6,724,140) Total nonoperating revenues (expenses) 8,234,140 (1,630,752) (9,864,892)
Income (loss) before capital contributionsand transfers (9,894,190) (3,672,487) 6,221,703
Capital Contributions 67,088 67,088 Transfers In 6,269,535 6,269,535 Transfers Out (2,292,713) (2,292,713)
Changes in net assets $ (9,894,190) 371,423 $ 10,265,613
Total net assets, beginning of year, as Restated (49,447,767)
Total net assets, end of year $ (49,076,344)
Environmental Services
CITY OF TUCSON ARIZONASCHEDULE OF REVENUES, EXPENSES AND CHANGES IN FUND NET ASSETS
ENVIRONMENTAL SERVICES FUND - BUDGET TO ACTUALFOR THE YEAR ENDED JUNE 30, 2005
121

Budget Actual
Variance - Positive
(Negative)
Operating revenues: Charges for Services $ 14,068,590 $ 8,980,101 $ (5,088,489) Total operating revenues 14,068,590 8,980,101 (5,088,489)
Operating expenses: Personal Services 5,130,970 4,240,148 (890,822) Contractual Services 3,885,664 2,292,217 (1,593,447) Commodities 4,686,146 2,244,656 (2,441,490) Cost of Goods Sold 342,848 342,848 Depreciation 658,720 658,720 Total operating expenses 13,702,780 9,778,589 (3,924,191)
Operating income (loss) 365,810 (798,488) (1,164,298)
Nonoperating revenues (expenses): Investment Income 34,892 34,892 Gain (Loss) on Sale of Property/Equipment 1,142,608 1,142,608 Interest Expense 365,810 (280,235) (646,045) Amortization of Cost Issuance (5,269) (5,269) Other Nonoperating Income (Expenses) 841,000 841,000 Total nonoperating revenues (expenses) 365,810 1,732,996 1,367,186
Income (loss) before capital contributions and transfers 934,508 934,508
Changes in net assets $ - 934,508 $ 934,508
Total net assets, beginning of year 14,780,706
Total net assets, end of year $ 15,715,214
CITY OF TUCSON, ARIZONASCHEDULE OF REVENUES, EXPENSES, AND CHANGES IN FUND NET ASSETS
GOLF COURSE FUND - BUDGET TO ACTUALFOR THE YEAR ENDED JUNE 30, 2005
Golf Course Fund
122

Budget Actual
Variance - Postive
(Negative)
Operating revenues: Charges for Services $ 125,962,000 $ 109,618,367 $ (16,343,633) Miscellaneous 1,015,280 1,729,102 713,822 Total operating revenues 126,977,280 111,347,469 (15,629,811)
Operating expenses: Personal Services 30,309,630 30,512,627 202,997 Contractual Services 45,399,540 35,771,356 (9,628,184) Commodities 58,832,461 7,585,807 (51,246,654) Depreciation 19,911,030 19,911,030 Total operating expenses 134,541,631 93,780,820 (40,760,811)
Operating income (loss) (7,564,351) 17,566,649 25,131,000
Nonoperating revenues (expenses): Investment Income 1,055,000 1,174,078 119,078 Gain (Loss) on Sale of Property/Equipment 436,283 436,283 Federal Grants and Contributions 9,982 9,982 Interest Expense (17,259,000) (17,992,230) (733,230) Amortization of Cost Issuance (108,206) (108,206) Other Nonoperating Income (Expenses) 17,958,000 (477,751) (18,435,751) Total nonoperating revenues (expenses) 1,754,000 (16,957,844) (18,711,844)
Income (loss) before capital contributions and transfers (5,810,351) 608,805 6,419,156
Capital Contributions 7,583,000 14,307,487 6,724,487 Transfers Out (5,000)
Changes in net assets $ 1,772,649 14,911,292 $ 13,138,643
Total net assets, beginning of year 594,313,181
Total net assets, end of year $ 609,224,473
CITY OF TUCSON, ARIZONASTATEMENT OF REVENUES, EXPENSES, AND CHANGES IN FUND NET ASSETS
WATER UTILITY - BUDGET TO ACTUALFOR THE YEAR ENDED JUNE 30, 2005
Water Utility Fund
123

Revenues:Sale of Water:
Potable Water Sales 93,335,582$ Reclaimed Water Sales 5,652,916Central Arizona Project Surcharge 1,852,266Connection Fees 2,997,238Pima County - Sewer Billing Services 1,914,630
Miscellaneous Revenue: Area Development Fees 439,244$ TCE Clean Up Reimbursement 713,618 Plan Review and Inspection Fees 1,876,780 Other 2,565,194
Total Miscellaneous Revenue 5,594,836Non-Operating Income:
System Equity Fees 7,438,248 Investment Earnings - Operating Funds 489,153 Investment Earnings - Debt Service Fund 141,636Gain on Sale of Property/Equipment 436,283
Total Non-Operating Income 8,505,320Total Revenues 119,852,788
Operation and Maintenance Expenses:Director's Office 5,051,199Business Services 9,820,498Water Operations 19,357,161Planning and Engineering 7,528,793Quality Management 6,042,304Power - Potable System 11,308,490Power - Reclaimed System 839,167CAP Water Purchases:
Commodity 4,565,269Capital Charges 3,807,048
Total CAP Water Purchases 8,372,317General Expenses 2,617,321Capitalized Operation and Maintenance Expense (4,719,504)
Total Operation and Maintenance Expense 66,217,746
Net Revenue Available After Operations (2) 53,635,042$
YEAR ENDED JUNE 30, 2005
CITY OF TUCSON, ARIZONAWATER UTILITY FUND
REVENUES, EXPENSES AND FLOWS OF FUNDSPER ORDINANCE NO. 6347 (1)
124

YEAR ENDED JUNE 30, 2005
CITY OF TUCSON, ARIZONAWATER UTILITY FUND
REVENUES, EXPENSES AND FLOWS OF FUNDSPER ORDINANCE NO. 6347 (1)
Debt Service for Water Revenue Bonds:Interest 17,922,422Principal 9,987,817Fiscal Fees 477,750
Total Debt Service for Water Revenue Bonds 28,387,989
Net Revenue Available After Operations and Water Revenue Bond Debt Service 25,247,053$
(1) This is a special purpose financial statement intended to show compliance with Ordinance 6347. It is not prepared in accordance with Generally Accepted Accounting Principles (GAAP). Financials statements on pages 24 and 25 are presented on a GAAP basis.
(2) Section 5.02 (b) of Ordinance 6347 covenants that the City will issue additional bonds only if Net Revenue Available After Operations has been at least equal to 120% of the maximum future annual debt service requirement. The City's experience has shown that more factorable interest rates (and thus lower debt service costs) can be attained if such coverage is 150% to 200%. For the period ended June 30, 2005, the debt coverage was 171%. An amendment to Section 7.01 or Ordinance 6347 further requires that if the Net Revenue of any fiscal year does not equal or exceed 175% of the Annual Debt Service Requirement for thatfiscal year, the City will deposit additional monies into a required reserve account. For the period ended June 30, 2005, the debt coverage for the Annual Debt Service Requirement is 188%.
125


Statistical Section

CITY OF TUCSON, ARIZONAGeneral Governmental Expenditures by Function (1) TABLE ILast Ten Fiscal Years (unaudited)(dollar amounts in thousands)
1995-96 1996-97 1997-98 1998-99 1999-00 2000-01 2001-02 2002-03 2003-04 2004-05General Government:
Elected and Official $ 17,596 $ 16,379 $ 19,844 $ 18,548 $ 23,868 $ 23,868 $ 16,415 $ 14,357 $ 15,651 $ 14,936Support Services:
Finance 5,335 5,576 5,496 5,818 6,616 6,667 6,954 7,238 8,004 8,927Budget and Research 1,661 1,606 1,644 1,620 1,781 1,889 2,113 1,910 1,791 1,917Procurement 2,394 2,210 2,320 2,682 2,754 3,669 3,168 3,297 2,977 3,379Information Technology 6,007 7,300 7,568 8,682 9,480 9,096 9,131 9,750 9,419 12,868Human Resources 2,239 2,112 2,640 2,645 2,877 2,926 2,801 2,909 2,562 2,818Operations 10,205 11,921 12,818 12,948 16,937 16,811 15,212 16,530 15,122 23,358City Manager Support Services (2) 2,203 765 625 701
Neighborhood Services:Community Services 43,200 42,196 47,165 54,879 50,546 46,934 46,252 52,561 55,604 55,069City Court 6,939 7,257 8,187 8,178 8,570 9,418 9,349 9,570 8,617 9,525Public Defender 1,523 1,540 1,601 1,678 1,858 1,940 2,050 2,232 2,443 2,751Police 63,723 65,167 68,376 77,296 90,271 99,960 100,532 109,876 113,493 124,453Fire 28,957 29,285 30,403 32,805 36,487 39,990 42,156 46,889 49,346 56,882Library 13,125 13,179 13,555 15,123 16,618 18,578 19,728 19,158 18,604 20,068Parks and Recreation 30,458 37,139 33,983 38,113 38,473 37,877 36,041 36,158 34,065 39,331City Manager Neighborhood Services (2) 937 3,293 2,839 2,944
Environment & Development:Planning 2,581 2,603 2,717 2,762 3,028 2,829 3,156 3,259 3,639 3,896Development Services 3,585 3,797 3,847 4,123 4,622 6,076 6,344 7,348 8,267 8,913Environmental Services (5) 18,921 21,252 21,767 21,819 25,013 26,769 26,760 27,785 28,501Transportation 69,173 79,468 85,515 76,676 97,730 93,183 70,181 74,953 80,988 90,525City Manager Environmental Management (2) 2,369 2,969 165 177
Strategic InitiativesConvention Center 4,764 4,739 6,313 5,950 5,101 5,895 9,241 10,748 10,456 10,548Rio Nuevo (4) 172 2,046City Manager Strategic Initiatives (2) 2,686 2,849 2,355 2,749
Nondepartmental 14,518 7,181 8,276 11,382 23,385 11,889 7,544 10,549 8,298 11,577Debt Service 39,233 39,200 39,836 42,036 46,302 50,372 48,523 43,234 46,435 47,072Capital Projects/Outlays (3) 86,893 88,903 69,530 95,572
Total $ 386,137 $ 401,107 $ 423,871 $ 445,763 $ 512,489 $ 518,682 $ 578,739 $ 609,090 $ 599,796 $ 650,956
Includes GAAP basis expenditures, except "Lease Purchase" expenditures which are offset by "Lease Purchase" proceeds, for the General Fund, all Special RevenueFunds, all Capital Project Funds, and General Obligation and Street and Highway Debt Service Funds (Excludes Special Assessment Debt Service).Prior to Fiscal Year 2001-02, these functions were included in Elected and Official.Capital Projects are included in the expenditures of the function to which they are related for Fiscal Years 1994-95 through 2000-01.Rio Nuevo became a Discretely Presented Component Unit in Fiscal Year 2001-02.Environmental Services became an enterprise fund in Fiscal Year 2004-05.
127
(4)(5)
(1)
(2)(3)

CITY OF TUCSON, ARIZONAGeneral Revenues by Source (1) TABLE IILast Ten Fiscal Years (unaudited)(dollar amounts in thousands)
1995-96 1996-97 1997-98 1998-99 1999-00 2000-01 2001-02 2002-03 2003-04 2004-05
Taxes:Property Taxes-Current $ 16,714 $ 18,072 $ 17,352 $ 17,187 $ 18,992 $ 22,173 $ 23,062 $ 24,442 $ 26,958 $ 29,751Property Taxes-Delinquent 1,201 900 824 692 640 445 1,387 143 453Public Utility Taxes 4,142 4,616 5,011 5,279 7,176 6,474 7,853 9,267 7,888 7,655Business Privilege Taxes 117,056 123,044 128,786 137,878 148,180 158,366 158,140 160,781 174,345 176,655Tansient Occupancy Taxes 5,819 6,243 6,428 6,392 7,124 7,013 6,339 6,395 7,172 8,814Other Taxes 2,687 2,846 9,004 9,742
Other Agencies:Auto Lieu Taxes-State 11,899 12,528 12,614 15,772 17,229 18,180 19,058 19,790 21,078 23,188Sales Taxes-State 33,222 31,480 33,205 35,762 35,833 43,551 37,533 38,161 41,217 45,700State Grants 1,470 2,108 1,501 1,677 1,586 2,239 1,708 2,009 1,409 2,682State Revenue Sharing 79,001 77,071 82,258 92,744 99,124 102,286 96,928 97,739 93,413 102,596County Grants 7,858 8,165 8,492 8,477 9,884 8,735 12,549 11,552 13,260 9,161Other 165 554 358 300 783 9,124 9,407 9,166 13,299
Licenses and Permits 12,476 11,499 16,884 14,755 16,530 17,514 18,098 17,088 17,762 19,502
Fines, Forfeitures and Penalties 6,365 7,030 7,996 8,095 6,433 7,443 8,946 10,641 10,220 11,558
Use of Money and Property 5,900 6,773 7,239 6,285 7,602 7,528 7,408 5,031 2,288 5,905
Charges for Current Services 30,671 30,491 30,530 32,213 38,986 40,831 40,432 42,692 57,262 55,727
Special Assessments (2) 1,131 484 684 863
Grants and Contributions On Federal Projects 47,417 61,701 65,582 62,875 60,704 67,801 78,150 71,867 75,141 70,681
Miscellaneous Revenue 18,663 7,798 19,058 9,715 8,250 8,082 2,935 3,505 5,541 6,734
Total $ 399,874 $ 409,684 $ 444,314 $ 456,156 $ 484,573 $ 519,444 $ 533,468 $ 533,697 $ 573,951 $ 600,666
(1) Includes GAAP basis revenues for the General Fund, all Special Revenue Funds, all Capital Project Funds, and General Obligation and Street and Highway Debt Service Funds.
(2) Special Assessment Capital Project Fund revenue (not bond proceeds). New GASB Statement No 34 presentation change in Fiscal Year 2001-02.
128

CITY OF TUCSON, ARIZONAProperty Tax Levies and Collections TABLE IIILast Ten Fiscal Years (unaudited)(dollar amounts in thousands)
OutstandingTotal Delinquent
Collections Taxes asCurrent Percent Delinquent Total as Percent Outstanding Percent of
Fiscal Total Tax of Levy Tax Tax of Current Delinquent CurrentYear Tax Levy Collections Collected Collections Collections Levy Taxes Levy
1995-96 $ 17,945 $ 17,163 95.7 % $ 934 $ 18,097 100.9 % $ 1,306 7.3 %
1996-97 18,343 18,070 98.5 771 18,040 98.3 1,141 6.2
1997-98 17,905 17,328 96.8 683 18,011 100.6 1,078 6.0
1998-99 17,915 16,961 94.7 673 17,634 98.4 1,077 6.0
1999-00 19,832 18,798 94.8 812 19,610 98.9 862 4.3
2000-01 23,017 21,788 94.7 675 22,463 97.6 1,441 6.3
2001-02 23,885 22,478 94.1 979 23,457 98.2 725 3.0
2002-03 25,277 22,871 90.5 897 23,768 94.0 1,712 6.8
2003-04 27,907 26,886 96.3 949 27,835 99.7 2,024 7.3
2004-05 30,021 29,075 96.8 1,217 30,292 100.0 1,644 5.5
129

CITY OF TUCSON, ARIZONAAssessed and Estimated Actual Value of Taxable Property TABLE IVLast Ten Fiscal Years (unaudited)(dollar amounts in thousands)
Ratio of TotalReal Property Personal Property Total Assessed To
Fiscal Assessed Estimated Assessed Estimated Assessed Estimated Total EstimatedYear Value Actual Value Value Actual Value Value Actual Value Actual Value
1995-96 $ 1,337,603 $ 11,583,856 $ 230,911 $ 970,146 $ 1,568,514 $ 12,554,002 0.13
1996-97 1,357,143 11,788,763 241,653 1,131,077 1,598,796 12,919,840 0.12
1997-98 1,543,311 13,383,256 275,598 1,157,684 1,818,909 14,540,940 0.13
1998-99 1,605,984 13,807,855 269,891 1,173,053 1,875,875 14,980,908 0.13
1999-00 1,624,339 12,874,604 320,829 2,542,911 1,945,168 15,417,515 0.13
2000-01 1,713,871 13,515,042 334,750 2,639,735 2,048,621 16,154,777 0.13
2001-02 1,808,505 14,379,728 329,956 2,623,540 2,138,461 17,003,268 0.13
2002-03 1,923,729 15,339,146 345,004 2,750,943 2,268,733 18,090,089 0.13
2003-04 2,056,913 16,322,643 375,071 2,976,377 2,431,984 19,299,020 0.13
2004-05 2,199,393 17,567,010 358,838 2,866,116 2,558,231 20,433,126 0.13
130

CITY OF TUCSON, ARIZONAProperty Tax Rates - Direct and Overlapping TABLE VPer $100 Assessed ValuationLast Ten Fiscal Years (1) (unaudited)
Junior Fiscal School College Year State County City District #1 District Other Total
1995-96 Primary 0.4700 3.5137 0.2000 6.7528 1.1441 0.5300 12.6106 Secondary 1.2325 0.9490 2.1532 0.0742 0.5535 4.9624
1996-97 Primary 3.5137 0.1489 7.1193 1.1691 0.5300 12.4810 Secondary 1.1925 1.0000 2.3515 0.0742 0.5545 5.1727
1997-98 Primary 3.5839 0.1428 7.0576 1.1166 0.5300 12.4309 Secondary 1.5520 (2) 0.8488 1.8525 0.0670 0.1917 4.5120
1998-99 Primary 3.6852 0.1428 7.0800 1.1283 0.5300 12.5663 Secondary 1.5120 0.8173 1.7481 0.0639 0.1915 4.3328
1999-00 Primary 4.0720 0.1428 6.8582 1.1626 0.5217 12.7573 Secondary 1.4931 0.8810 1.9287 0.2070 0.1100 4.6198
2000-01 Primary 4.0720 0.1406 7.1105 1.1709 0.5123 13.0063 Secondary 1.4915 0.9864 1.9389 0.3865 0.1300 4.9333
2001-02 Primary 4.0720 0.1403 8.0889 1.1455 0.4974 13.9441 Secondary 1.5108 0.9799 1.7199 0.4015 0.1300 4.7421
2002-03 Primary 4.0720 0.2089 7.6124 1.1530 0.4889 13.5352 Secondary 1.4278 0.9113 1.6656 0.3803 0.1300 4.5150
2003-04 Primary 4.0720 0.2089 7.1831 1.1358 0.4717 13.0715 Secondary 1.4261 0.9480 1.5779 0.3526 0.1200 4.4246
2004-05 Primary 4.0720 0.3531 6.8278 1.1143 0.4560 12.8232 Secondary 1.4247 0.8316 1.5008 0.2285 0.1200 4.1056
(1) Per Arizona revised Statue 42-301, primary tax levy (no restrictions on use) is limited to an increase of 2 % over theprevious year's maximum allowable primary levy. Secondary tax may be levied in any amount necessary to pay fordebt service or to provide special district funding.
(2) Beginning in 1997-98, the County Secondary Rate includes the Flood Control District rate which was previouslyplaced in the "Other" secondary rate.
131

CITY OF TUCSON, ARIZONAPrincipal Taxpayers TABLE VIJune 30, 2005 (unaudited)(dollar amounts in thousands)
As % of City'sTotal 2003-04
Taxpayers Type of Business Assessed Valuation
Tucson Electric Power Company Electric Utility $ 79,101 3.05 %
Qwest Telephone 61,808 2.42
Southwest Gas Corporation Natural Gas Utility 20,745 0.81
Tucson Mall Retail Stores 19,364 0.76
Park Place Retail Stores 14,934 0.58
AT & T Communications Telephone 8,365 0.33
El Con Mall Retail Stores 7,773 0.30
WC Partners Commerical Rentals 6,899 0.27
HUB Properties Trust Commercial Rentals 6,398 0.25
MCI Worldcom Network Telephone 5,765 0.23 Totals $ 231,152
Sources:Pima County Assessor's OfficeArizona Department of Revenue
Assessed Valuation2004-05
Estimated
132

CITY OF TUCSON, ARIZONASpecial Assessment Collections (1) TABLE VIILast Ten Fiscal Years (unaudited)(dollar amounts in thousands)
Current Current Ratio ofFiscal Assessments Assessments Collections toYear Due Collected (2) Amounts Due (2)
1995-96 $ 1,632 $ 1,632 1.00
1996-97 1,432 1,432 1.00
1997-98 1,145 1,145 1.00
1998-99 947 947 1.00
1999-00 810 810 1.00
2000-01 736 736 1.00
2001-02 (3) 399 322 0.81
2002-03 458 796 1.74
2003-04 386 473 1.23
2004-05 495 654 1.32
(1) Principal only. (2) All delinquent assessments are sold to independent bidders.(3) FY 02 collections included a reduction for a refund to Civano property holders of $160.
133
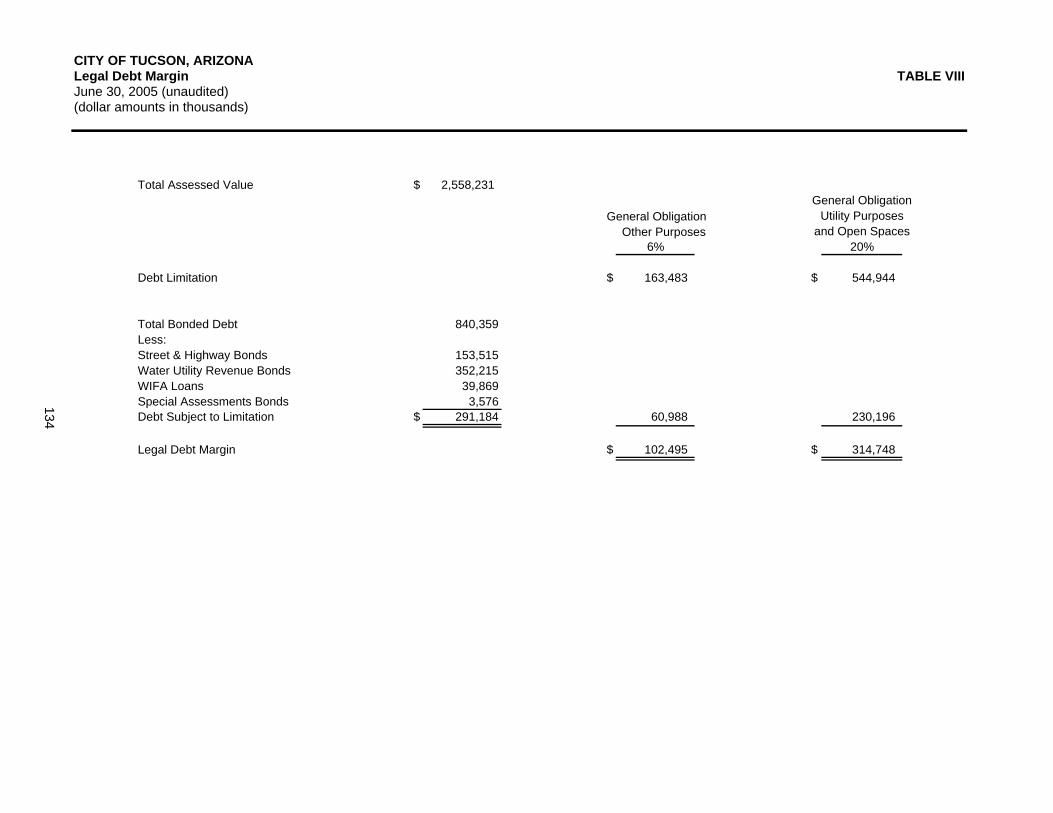
CITY OF TUCSON, ARIZONALegal Debt Margin TABLE VIIIJune 30, 2005 (unaudited)(dollar amounts in thousands)
Total Assessed Value $ 2,558,231General Obligation
Utility Purposesand Open Spaces
6% 20%
Debt Limitation $ 163,483 $ 544,944
Total Bonded Debt 840,359Less:Street & Highway Bonds 153,515Water Utility Revenue Bonds 352,215WIFA Loans 39,869Special Assessments Bonds 3,576Debt Subject to Limitation $ 291,184 60,988 230,196
Legal Debt Margin $ 102,495 $ 314,748
Other PurposesGeneral Obligation
134

CITY OF TUCSON, ARIZONARatio of Net General Bonded Debt TABLE IXto Assessed Value and Net Bonded Debt Per CapitaLast Ten Fiscal Years (unaudited)
Gross Less Debt Net Ratio of Net Net BondedFiscal Assessed Bonded Service Bonded Bonded Debt to Debt PerYear Population Value (in thousands) Debt (in thousands) Funds (in thousands) Debt (in thousands) Assessed Value Capita
1995-96 449,000 $ 1,568,514 $ 194,854 $ 5,056 $ 189,798 0.121 422.71
1996-97 459,000 1,598,796 201,534 5,517 196,017 0.123 427.05
1997-98 466,538 1,818,909 209,159 4,012 205,147 0.113 439.72
1998-99 476,406 1,875,875 217,274 1,586 215,688 0.115 452.73
1999-00 486,810 1,945,168 211,169 315 210,854 0.108 433.13
2000-01 498,307 2,048,621 223,569 1,209 222,360 0.109 446.23
2001-02 508,271 2,138,461 243,099 1,503 241,596 0.113 475.33
2002-03 516,220 2,268,733 266,989 3,195 263,794 0.116 511.01
2003-04 518,878 2,431,984 273,944 4,439 269,505 0.111 519.40
2004-05 521,605 2,558,231 291,184 5,317 285,867 0.112 548.05
135

CITY OF TUCSON, ARIZONAProperty Tax Requirements for General Debt Service TABLE XLast Ten Fiscal Years (unaudited)(dollar amounts in thousands)
Net Tax Rate RequiredFiscal Debt Property Tax Levy(1) for Net GeneralYear Principal Interest Service Primary Secondary Debt Service(2)
1995-96 $ 3,450 $ 10,850 $ 14,300 $ 3,060 $ 14,885 0.91
1996-97 3,830 11,694 15,524 2,355 15,988 0.97
1997-98 5,465 11,478 16,943 2,466 15,439 0.93
1998-99 5,740 12,012 17,752 2,583 15,332 0.93
1999-00 6,105 12,299 18,404 2,695 17,137 0.94
2000-01 6,440 12,868 19,308 2,810 20,207 0.95
2001-02 7,030 13,785 20,815 2,931 20,954 0.97
2002-03 6,570 12,670 19,240 4,342 19,537 0.85
2003-04 8,045 13,973 22,018 4,898 23,009 0.91
2004-05 8,690 11,689 20,379 8,746 21,274 0.80
(1) Primary tax levy (no restrictions on use) is limited to an increase of 2% over the previous years maximum allowable primary levy. Secondary tax may be levied in any amount necessary to meet the City's general obligation debt requirements, subject to City Charter ceiling limitation for combined primary and secondary levies of $1.75 per $100 assessed valuation.
(2) Rate shown is per $100 of assessed valuation and assumes no use of reserved funds or interest earnings in General Obligation Debt Service Fund. Secondary tax levy for Fiscal Year 2004-05 was .8316.
136

CITY OF TUCSON, ARIZONARatio of Annual Debt Service Expenditures for TABLE XIGeneral Bonded Debt to Total General ExpendituresLast Ten Fiscal Years (unaudited)(dollar amounts in thousands)
Ratio ofTotal Total Debt Service
Fiscal Debt General to GeneralYear Principal Interest Service Expenditures(1) Expenditures
1995-96 $ 3,450 $ 10,850 $ 14,300 $ 386,137 .04
1996-97 3,830 11,694 15,524 401,107 .04
1997-98 5,465 11,478 16,943 423,871 .04
1998-99 5,740 12,012 17,752 445,763 .04
1999-00 6,105 12,299 18,404 512,489 .04
2000-01 6,440 12,868 19,308 518,682 .04
2001-02 7,030 13,785 20,815 578,739 .04
2002-03 6,570 12,670 19,240 609,090 .03
2003-04 8,045 13,973 22,018 599,012 .04
2004-05 8,690 11,689 20,379 650,956 .03
(1) Includes GAAP basis expenditures, except "Lease Purchase" expenditures which are offset by "Lease Purchase Proceeds," for the General Fund, all Special Revenue Funds and the General Obligation and Street and Highway Debt Service Funds.
137

CITY OF TUCSON, ARIZONAComputation of Direct and Overlapping Debt TABLE XIIJune 30, 2005 (unaudited)(dollar amounts in thousands)
GeneralObligationNet Debt
Name of Governmental Unit Outstanding
City of Tucson $ 291,184 (1) 100.00 % $ 291,184School District No. 1 313,600 77.92 244,357School District No. 8 12,835 25.41 3,261School District No. 10 99,895 17.53 17,512School District No. 12 51,605 63.19 32,609School District No. 20 17,435 43.93 7,659School District No. 16 39,805 0.01 4School District No. 13 6,170 1.17 72School District No. 30 18,620 0.51 95Pima County 232,105 45.52 105,654Pima County Flood Control District 4,120 41.64 1,716Pima County Community College 80,785 45.52 36,773
Total Direct and Overlapping Debt $ 1,168,159 $ 740,896
(1) Net of Debt Service Funds on Hand.
Percentage
City of Tucson
138
to City of TucsonAmount ApplicableApplicable to

CITY OF TUCSON, ARIZONASchedule of Water Revenue Bond Coverage (1) TABLE XIIILast Ten Fiscal Years (unaudited)(dollar amounts in thousands)
Net RevenueGross Available for
Year Revenue Expenses Debt Service Principal Interest Total Coverage
1995-96 $ 91,463 $ 46,359 $ 45,104 $ 7,280 $ 11,973 $ 19,253 2.34
1996-97 96,187 50,867 45,320 6,865 13,257 20,122 2.25
1997-98 94,884 46,008 48,876 7,516 13,244 20,760 2.25
1998-99 91,377 53,471 37,906 14,825 7,823 22,648 1.67
1999-00 93,486 52,240 41,246 15,869 9,101 24,970 1.65
2000-01 94,810 52,643 42,167 16,688 9,099 25,787 1.64
2001-02 114,282 57,295 56,987 16,575 11,077 27,652 1.64
2002-03 110,444 60,031 50,413 16,575 11,023 27,598 1.83
2003-04 115,299 61,670 53,629 17,075 12,700 29,775 1.80
2004-05 119,853 66,218 53,635 17,510 13,808 31,318 1.71
Debt Service Requirements- Bonds
139
(1) Effective with Fiscal Year 1997/98, this information will show the Maximum Annual Debt Service coverage as defined by Ordinance No. 6347. The debt servicerequirements represent the greatest amount required in any fiscal year as of the current fiscal year or thereafter. In previous years, the coverage ratio wasbased on the current fiscal year debt service requirements. Expenses exclude depreciation, amortization, and other water expenses subordinate to debtservice.

CITY OF TUCSON, ARIZONADemographic Statistics TABLE XIVLast Ten Fiscal Years (unaudited)(dollar amounts in thousands)
PopulationPer Capita Unemployment Area In Per Square
Year Population Income Rate (1) Square Miles Mile
1996 449,000 $ 20 3.6 191.30 2,347.10
1997 459,000 21 3.2 193.51 2,371.97
1998 466,538 22 2.6 194.12 2,403.35
1999 476,406 22 2.7 195.36 2,438.61
2000 486,810 23 2.8 195.46 2,490.59
2001 498,307 24 3.1 223.33 2,231.26
2002 508,271 25 4.5 226.08 2,248.19
2003 516,220 25 4.4 226.13 2,282.85
2004 518,878 25 4.2 226.13 2,294.60
2005 521,605 27 4.7 226.55 2,302.38
(1) Statistics for Pima County as a whole.
Source:City of Tucson, Planning Department
140

CITY OF TUCSON, ARIZONABuilding Permits, Bank Deposits and Retail Sales TABLE XVLast Ten Fiscal Years (unaudited)(dollar amounts in thousands)
Building PermitsCommercial Residential
Year Number Value Number Value
1996 1,443 $ 201,654 5,236 $ 222,537
1997 1,630 170,362 5,923 227,027
1998 1,924 189,849 5,439 276,011
1999 2,027 262,089 4,062 295,924
2000 2,332 214,514 4,233 336,850
2001 2,415 269,156 5,808 386,393
2002 2,148 223,703 5,778 355,394
2003 1,225 108,728 4,013 308,621
2004 1,067 251,068 3,371 351,408
2005 1,038 183,218 2,290 336,331
Sources:Arizona Bankers AssociationCity of Tucson Finance DepartmentCity of Tucson Development Services Center
141

CITY OF TUCSON, ARIZONAMiscellaneous Statistics TABLE XVIJune 30, 2005 (unaudited)(dollar amounts in thousands)
Date of Incorporation: Street Lights:February 7, 1887 Number 17,243
Form of Government: Libraries:Council - Manager Number - Within City 11
- Outside City 10Date of Charter Adoption: Circulation 4,849,449March 7, 1883
City Employees: June 30, 2005 Parks and Recreation:Full Time 5,117 Recreation/ Regional Centers 19 Part Time/Other 2,055 Golf Courses 5 7,172 Parks 125
Playfields 182 Swimming Pools 27
Fire Protection: Water Utility:Commissioned Employees 565 Operable Wells 223Number of Stations 20 Miles of Water Mains 4,480
Number of Water Connections 218,569Police Protection: Potable Water Distributed (in Billion Gallons) 35Commissioned Employees 955Traffic Citations 121,387Felonies 51,837
Miles of Streets: Elections:Residential 1,355 Registered Voters As Of 11/09/03 191,406Collectors 100 Votes Cast in Last CityArterials 287 General Election (40.68% of Voters) 11/4/2003 77,857Interstate 79Area of City in Square Miles 234
142

Glossary

143
Glossary
Accrual basis of accounting. A method of accounting that recognizes the financial effect oftransactions, events, and interfund activities when they occur, regardless of the timing of related cashflows. All proprietary and trust funds use the accrual basis of accounting.
Agent multiple-employer defined benefit pension plan. An aggregation of single-employer plans,with pooled administrative and investment functions. Separate accounts are maintained for eachemployer so that the employer's contributions provide benefits only for the employees of that employer.A separate actuarial valuation is performed for each individual employer's plan to determine theemployer's periodic contribution rate and other information for the individual plan, based on the benefitformula selected by the employer and the individual plan's proportionate share of the pooled assets. Theresults of the individual valuations are aggregated at the administrative level. [SGAS 27]
Basic financial statements. The minimum combination of financial statements and note disclosuresrequired for fair presentation in conformity with GAAP.
Basis of accounting. The timing of recognition, that is, when the effects of transactions or eventsshould be recognized for financial reporting purposes. For example, the effects of transactions or eventscan be recognized on an accrual basis (that is, when the transactions or events take place), or on a cashbasis (that is, when cash is received or paid). Basis of accounting is an essential part of measurementfocus because a particular timing of recognition is necessary to accomplish a particular measurementfocus. [SGAS 11]
Budgetary basis of accounting. The method used to determine when revenues and expenditures arerecognized for budgetary purposes.
Capital and related financing activities. Term used in connection with cash flows reporting. Capitaland related financing activities include (a) acquiring and disposing of capital assets used in providingservices or producing goods, (b) borrowing money for acquiring, constructing, or improving capital assetsand repaying the amounts borrowed, including interest, and (c) paying for capital assets obtained fromvendors on credit. [SGAS 9]
Capital projects fund. Fund type used to account for financial resources to be used for the acquisitionor construction of major capital facilities (other than those financed by proprietary funds and trust funds).
Capitalization threshold. The dollar value at which a government elects to capitalize tangible orintangible assets that are used in operations and that have initial useful lives extending beyond a singlereporting period. For the City, the capitalization threshold is $5,000.
Cash. The term, as used in connection with cash flows reporting, includes not only currency on hand,but also demand deposits with banks or other financial institutions. Cash also includes deposits in otherkinds of accounts or cash management pools that have the general characteristics of demand depositaccounts in that the governmental enterprise may deposit additional cash at any time and also effectivelymay withdraw cash at any time without prior notice or penalty. [SGAS 9]
Cash equivalent. Term used in connection with cash flows reporting. Short-term, highly liquidinvestments that are both (a) readily convertible to known amounts of cash and (b) so near their maturitythat they present insignificant risk of changes in value because of changes in interest rates. Generally,only investments with original maturities of three months or less meet this definition. For this purpose"original maturity" means the original maturity to the entity holding the investment. [SGAS 9]
Collateral. Term used in connection with deposits with financial institutions. Security pledged by afinancial institution to a governmental entity for its deposit.

144
Combining financial statements. Financial statements that report separate columns for individualfunds or component units. Combining financial statements normally are required in a comprehensiveannual financial report to support each column in the basic financial statements that aggregatesinformation from more than one fund or component unit.
Component unit. A legally separate organization for which the elected officials of the primarygovernment are financially accountable. In addition, component units can be other organizations forwhich the nature and significance of their relationship with a primary government are such that exclusionwould cause the reporting entity's financial statements to be misleading or incomplete. [SGAS 14]
Comprehensive annual financial report (CAFR). A financial report that encompasses all funds andcomponent units of the government. The CAFR should contain (a) the basic financial statements andrequired supplementary information, (b) combining statements to support columns in the basic financialstatements that aggregate information from more than one fund or component unit, and (c) individualfund statements as needed. The CAFR is the governmental unit’s official annual report and also shouldcontain introductory information, schedules necessary to demonstrate compliance with finance-relatedlegal and contractual provisions, and statistical data.
Cost-sharing multiple-employer defined benefit pension plan. A single plan with pooling (cost-sharing) arrangements for the participating employers. All risks, rewards, and costs, including benefitcosts, are shared and are not attributed individually to the employers. A single actuarial valuation coversall plan members and the same contribution rate(s) applies for each employer. [SGAS 25]
Current financial resources measurement focus. Measurement focus according to which the aim of aset of financial statements is to report the near-term (current) inflows, outflows, and balances ofexpendable (spendable) financial resources. The current financial resources measurement focus isunique to accounting and financial reporting for state and local governments and is used solely forreporting the financial position and results of operations of governmental funds.
Debt service fund. Governmental fund type used to account for the accumulation of resources for, andthe payment of, general long-term debt principal and interest.
Deferred revenue. Resource inflows that do not yet meet the criteria for revenue recognition. Unearnedamounts are always reported as deferred revenue. In governmental funds, earned amounts also arereported as deferred revenue until they are available to liquidate liabilities of the current period.
Defined benefit pension plan. A pension plan having terms that specify the amount of pensionbenefits to be provided at a future date or after a certain period of time; the amount specified usually is afunction of one or more factors such as age, years of service, and compensation. [SGAS 25]
Designated unreserved fund balance. Management's intended use of available expendable resourcesin governmental funds reflecting actual plans approved by the government’s senior management.Expressed another way, designations reflect a government’s self-imposed limitations on the use ofotherwise available financial resources in governmental funds.
Economic resources measurement focus. Measurement focus under which the aim of a set offinancial statements is to report all inflows, outflows, and balances affecting or reflecting an entity's netassets: The economic resources measurement focus is used for proprietary and fiduciary funds, as wellas for government-wide financial reporting. Business enterprises and not-for-profit organizations in theprivate sector also use it.
Encumbrances. Commitments related to unperformed (executory) contracts for goods or services.
Enterprise fund. Proprietary fund type used to report an activity for which a fee is charged to externalusers for goods or services.

145
Expenditure. Decreases in net financial resources under the current financial resources measurementfocus not properly classified as other financing uses.
Fiduciary funds. Funds used to report assets held in a trustee or agency capacity for others and whichtherefore cannot be used to support the government's own programs. The fiduciary fund categoryincludes pension (and other employee benefit) trust funds, investment trust funds, private-purpose trustfunds, and agency funds.
Financial reporting entity. A primary government, organizations for which the primary government isfinancially accountable, and other organizations for which the nature and significance of their relationshipwith the primary government are such that exclusion would cause the reporting entity's financialstatements to be misleading or incomplete. The nucleus of a financial reporting entity usually is aprimary government. However, a governmental organization other than a primary government (such asa component unit, a joint venture, a jointly governed organization, or other stand-alone government)serves as the nucleus for its own reporting entity when it issues separate financial statements.
Financial resources. Resources that are or will become available for spending. Financial resourcesinclude cash and resources ordinarily expected to be converted to cash (e.g., receivables, investments).Financial resources also may include inventories and prepaids (because they obviate the need to expendcurrent available financial resources).
Financial section. One of the three basic sections of a comprehensive annual financial report. Thefinancial section is used to present the independent auditor's report on the financial statements, the basicfinancial statements (including the notes to the financial statements), required supplementaryinformation, combining statements, individual fund statements and schedules, and supplementaryinformation, as needed.
Fund. A fiscal and accounting entity with a self-balancing set of accounts recording cash and otherfinancial resources, together with all related liabilities and residual equities or balances, and changestherein, that are segregated for the purpose of carrying on specific activities or attaining certainobjectives in accordance with special regulations, restrictions, or limitations.
Fund balance. The difference between assets and liabilities reported in a governmental fund.
Fund classifications. One of the three categories (governmental, proprietary, and fiduciary) used toclassify fund types.
Fund type. One of 11 classifications into which all individual funds can be categorized. Governmentalfund types include the general fund, special revenue funds, debt service funds, capital projects funds,and permanent funds. Proprietary fund types include enterprise funds and internal service funds.Fiduciary fund types include pension (and other employee benefit) trust funds, investment trust funds,private-purpose trust funds, and agency funds.
General fund. The general fund is one of five governmental fund types and typically serves as the chiefoperating fund of a government. The general fund is used to account for all financial resources exceptthose required to be accounted for in another fund.
Generally accepted accounting principles (GAAP). The conventions, rules, and procedures thatserve as the norm for the fair presentation of financial statements. The various sources of GAAP forstate and local government are set forth by SAS No. 69, The Meaning of "Present Fairly in Conformitywith Generally Accepted Accounting Principles" in the Independent Auditor's Report.
Government Finance Officers Association (GFOA). An association of public finance professionalsfounded in 1906 as the Municipal Finance Officers Association. The GFOA has played a major role inthe development and promotion of GAAP for state and local government since its inception and hassponsored the Certificate of Achievement for Excellence in Financial Reporting Program since 1946.

146
Governmental Accounting Standards Board (GASB). The ultimate authoritative accounting andfinancial reporting standard-setting body for state and local governments. The GASB was established inJune 1984 to replace the NCGA.
Governmental funds. Funds generally used to account for tax-supported activities. There are fivedifferent types of governmental funds: the general fund, special revenue funds, debt service funds,capital project funds, and permanent funds.
Internal service funds. Proprietary fund type that may be used to report any activity that providesgoods or services to other funds, departments, or agencies of the primary government and its componentunits, or to other governments, on a cost-reimbursement basis. The goal of an internal service fund is tomeasure the full cost of providing goods or services for the purpose of fully recovering that cost(including the cost of capital assets) through fees or charges.
Introductory section. The first of three essential components of any comprehensive annual financialreport. The introductory section typically provides general information on a government's structure andpersonnel as well as information useful in assessing the government’s financial condition. The contentsof the introductory section normally fall outside the scope of the independent audit of the financialstatements.
Landfill closure and postclosure care costs. Costs incurred to provide for the protection of theenvironment that occur near or after the date that a municipal solid-waste landfill stops accepting solidwaste and during the postclosure period. Closure and postclosure care costs include the cost ofequipment and facilities (e.g., leachate collection systems and final cover) as well as the cost of services(e.g., postclosure maintenance and monitoring costs). [SGAS18]
Legal debt margin. The excess of the amount of debt legally authorized over the amount of debtoutstanding.
Legal defeasance. A situation that occurs when debt is legally satisfied based on certain provisions inthe debt instrument even though the debt is not actually paid. When debt is defeased, it is no longerreported as a liability on the face of the statement of position; only the new debt, if any, is reported as aliability. [SGAS 7]
Legal level of budgetary control. The level at which a government’s management may not reallocateresources without special approval from the legislative body.
Materiality. The magnitude of an omission or misstatement of accounting information that, in the light ofsurrounding circumstances, makes it probable that the judgment of a reasonable person relying on theinformation would have been changed or influenced by the omission or misstatement.1 The objective ofaccountability in governmental financial reporting adds another perspective to materiality. Specifically,accountability requires another perspective to materiality. Specifically, accountability requires materialityto be judged not only in a quantitative manner, but also in a qualitative manner. That is, accountabilityinvolves such issues as legal and contractual compliance that may not have a “material” effect on theentity’s reported operating results and financial position but that would influence or change the judgmentof a reasonable person about how the government has conducted its affairs during the period. [SGAS 11]
Measurement Focus. The objective of a measurement, that is, what is being expressed in reporting anentity’s financial performance and position. A particular measurement focus is accomplished byconsidering not only which resources are measured (for example, financial or economic resources), butalso when the effects of transactions or events involving those resources are recognized (the basis ofaccounting). The measurement focus of government-wide financial statements, proprietary fundfinancial statements, and fiduciary fund financial statements is economic resources. The measurementfocus of governmental fund financial statements is current financial resources.

147
Modified accrual basis of accounting. Basis of accounting according to which (a) revenues arerecognized in the accounting period in which they become available and measurable and (b)expenditures are recognized in the accounting period in which the fund liability is incurred, if measurable,except for unmatured interest on general long-term debt and certain similar accrued obligations, whichshould be recognized when due.
Noncapital financing activities. Term used in connection with cash flows reporting. Noncapitalfinancing activities include borrowing money for purposes other than to acquire, construct, or improvecapital assets and repaying those amounts borrowed, including interest. This category includes proceedsfrom all borrowings (such as revenue anticipation notes) not clearly attributable to acquisition,construction, or improvement of capital assets, regardless of the form of the borrowing. Also includedare certain other interfund and intergovernmental receipts and payments. [SGAS 9]
Operating Activities: Term used in connection with cash flows reporting. Operating activities generallyresult from providing services and producing and delivering goods, and include all transactions and otherevents that are not defined as capital and related financing, noncapital financing, or investing activities.[SGAS 9]
Operating revenues and expenses. Term used in connection with the proprietary fund statement ofrevenues, expenses, and changes in net assets. The term is not defined as such in the authoritativeaccounting and financial reporting standards, although financial statement preparers are advised toconsider the definition of operating activities for cash flows reporting in establishing their own definition.[SGAS 34]
Other financing source. An increase in current financial resources that is reported separately fromrevenues to avoid distorting revenue trends. The use of the other financing sources category is limited toitems so classified by GAAP.
Other financing use. A decrease in current financial resources that is reported separately fromexpenditures to avoid distorting expenditure trends. The use of the other financing uses category islimited to items so classified by GAAP.
Overlapping debt. Proportionate share that property within a government must bear the debts of otherlocal governments located wholly or in part within the geographic boundaries of the reportinggovernment. Except for special assessment debt, the amount of debt of each unit applicable to thereporting unit is arrived at by (1) determining what percentage of the total assessed value of theoverlapping jurisdiction lies within the limits of the reporting unit, and (2) applying this percentage to thetotal debt of the overlapping jurisdiction. Special assessment debt is allocated on the basis of the ratio ofassessments receivable in each jurisdiction, which will be used wholly or in part to pay off the debt, tototal assessments receivable, which will be used wholly or in part for this purpose.
Pension (and other employee benefit) trust funds. A fiduciary fund type used to report resources thatare required to be held in trust for the members and beneficiaries of defined benefit pension plans,defined contribution plans, other postemployment benefit plans, or other employee benefit plans.
Permanent Funds. A fiduciary fund type used to report resources that are legally restricted to the extentthat only earnings, and not principal may be used for purposes that support the reporting government’sprograms – that is, for the benefit of the government or its citizenry.
Post-retirement healthcare benefits. Medical, dental, vision, and other health-related benefitsprovided to retired employees, dependents, and beneficiaries. [SGAS 26]
Proprietary funds. Funds that focus on the determination of operating income, changes in net assets(or cost recovery), financial position, and cash flows. There are two different types of proprietary funds:enterprise funds and internal service funds.

148
Refunding. The issuance of new debt whose proceeds are used to repay previously issued debt. Theproceeds may be used immediately for this purpose (a current refunding), or they may be placed with anescrow agent and invested until they are used to pay principal and interest on the old debt at a futuretime (an advance refunding).
Required supplementary information. Statements, schedules, statistical data, or other informationthat the GASB has determined to be necessary to supplement, although not required to be a part of, thebasic statements. [SGAS 5]
Restricted assets. Assets whose use is subject to constraints that are either (a) externally imposed bycreditors (such as through debt covenants), grantors, contributors, or laws or regulations of othergovernments or (b) imposed by law through constitutional provisions or enabling legislation.
Special revenue fund. A governmental fund type used to account for the proceeds of specific revenuesources (other than for major capital projects) that are legally restricted to expenditure for specifiedpurpose.
Statistical section. The third of three essential components of any comprehensive annual financialreport. The statistical section provides a broad range of trend data covering key financial indicators fromthe past 10 fiscal years (e.g., general government revenues and expenditures, property tax collections,debt burden). It also contains demographic and miscellaneous data useful in assessing a government’sfinancial condition. The contents of the statistical section normally fall outside the scope of theindependent audit of the financial statements.