Embed Size (px)
Citation preview

Q2 2018
City Report
Warsaw City Report Q2 2018Investment market summary updated as of 21st August 2018
COPYRIGHT © JONES LANG LASALLE IP, INC. 2018
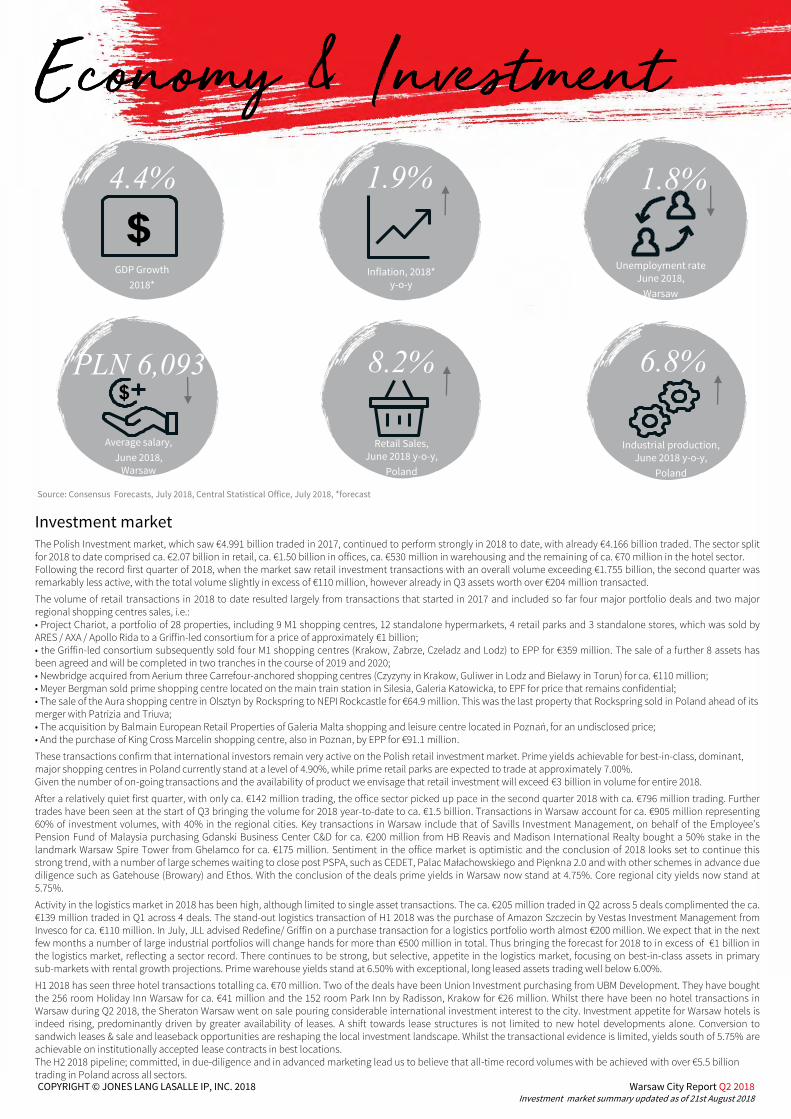
The Polish Investment market, which saw €4.991 billion traded in 2017, continued to perform strongly in 2018 to date, with already €4.166 billion traded. The sector splitfor 2018 to date comprised ca. €2.07 billion in retail, ca. €1.50 billion in offices, ca. €530 million in warehousing and the remaining of ca. €70 million in the hotel sector.Following the record first quarter of 2018, when the market saw retail investment transactions with an overall volume exceeding €1.755 billion, the second quarter wasremarkably less active, with the total volume slightly in excess of €110 million, however already in Q3 assets worth over €204 million transacted.
The volume of retail transactions in 2018 to date resulted largely from transactions that started in 2017 and included so far four major portfolio deals and two majorregional shopping centres sales, i.e.:• Project Chariot, a portfolio of 28 properties, including 9 M1 shopping centres, 12 standalone hypermarkets, 4 retail parks and 3 standalone stores, which was sold byARES / AXA / Apollo Rida to a Griffin-led consortium for a price of approximately €1 billion;• the Griffin-led consortium subsequently sold four M1 shopping centres (Krakow, Zabrze, Czeladz and Lodz) to EPP for €359 million. The sale of a further 8 assets hasbeen agreed and will be completed in two tranches in the course of 2019 and 2020;• Newbridge acquired from Aerium three Carrefour-anchored shopping centres (Czyzyny in Krakow, Guliwer in Lodz and Bielawy in Torun) for ca. €110 million;• Meyer Bergman sold prime shopping centre located on the main train station in Silesia, Galeria Katowicka, to EPF for price that remains confidential;• The sale of the Aura shopping centre in Olsztyn by Rockspring to NEPI Rockcastle for €64.9 million. This was the last property that Rockspring sold in Poland ahead of its merger with Patrizia and Triuva;• The acquisition by Balmain European Retail Properties of Galeria Malta shopping and leisure centre located in Poznań, for an undisclosed price; • And the purchase of King Cross Marcelin shopping centre, also in Poznan, by EPP for €91.1 million.
These transactions confirm that international investors remain very active on the Polish retail investment market. Prime yields achievable for best-in-class, dominant, major shopping centres in Poland currently stand at a level of 4.90%, while prime retail parks are expected to trade at approximately 7.00%.Given the number of on-going transactions and the availability of product we envisage that retail investment will exceed €3 billion in volume for entire 2018.
After a relatively quiet first quarter, with only ca. €142 million trading, the office sector picked up pace in the second quarter 2018 with ca. €796 million trading. Furthertrades have been seen at the start of Q3 bringing the volume for 2018 year-to-date to ca. €1.5 billion. Transactions in Warsaw account for ca. €905 million representing60% of investment volumes, with 40% in the regional cities. Key transactions in Warsaw include that of Savills Investment Management, on behalf of the Employee’sPension Fund of Malaysia purchasing Gdanski Business Center C&D for ca. €200 million from HB Reavis and Madison International Realty bought a 50% stake in thelandmark Warsaw Spire Tower from Ghelamco for ca. €175 million. Sentiment in the office market is optimistic and the conclusion of 2018 looks set to continue thisstrong trend, with a number of large schemes waiting to close post PSPA, such as CEDET, Palac Małachowskiego and Pięnkna 2.0 and with other schemes in advance duediligence such as Gatehouse (Browary) and Ethos. With the conclusion of the deals prime yields in Warsaw now stand at 4.75%. Core regional city yields now stand at5.75%.
Activity in the logistics market in 2018 has been high, although limited to single asset transactions. The ca. €205 million traded in Q2 across 5 deals complimented the ca.€139 million traded in Q1 across 4 deals. The stand-out logistics transaction of H1 2018 was the purchase of Amazon Szczecin by Vestas Investment Management fromInvesco for ca. €110 million. In July, JLL advised Redefine/ Griffin on a purchase transaction for a logistics portfolio worth almost €200 million. We expect that in the nextfew months a number of large industrial portfolios will change hands for more than €500 million in total. Thus bringing the forecast for 2018 to in excess of €1 billion inthe logistics market, reflecting a sector record. There continues to be strong, but selective, appetite in the logistics market, focusing on best-in-class assets in primarysub-markets with rental growth projections. Prime warehouse yields stand at 6.50% with exceptional, long leased assets trading well below 6.00%.
H1 2018 has seen three hotel transactions totalling ca. €70 million. Two of the deals have been Union Investment purchasing from UBM Development. They have boughtthe 256 room Holiday Inn Warsaw for ca. €41 million and the 152 room Park Inn by Radisson, Krakow for €26 million. Whilst there have been no hotel transactions inWarsaw during Q2 2018, the Sheraton Warsaw went on sale pouring considerable international investment interest to the city. Investment appetite for Warsaw hotels isindeed rising, predominantly driven by greater availability of leases. A shift towards lease structures is not limited to new hotel developments alone. Conversion tosandwich leases & sale and leaseback opportunities are reshaping the local investment landscape. Whilst the transactional evidence is limited, yields south of 5.75% areachievable on institutionally accepted lease contracts in best locations.The H2 2018 pipeline; committed, in due-diligence and in advanced marketing lead us to believe that all-time record volumes with be achieved with over €5.5 billion trading in Poland across all sectors.
Investment market
Unemployment rateJune 2018,
Warsaw
GDP Growth
2018*
Average salary,
June 2018, Warsaw
Inflation, 2018*y-o-y
Retail Sales, June 2018 y-o-y,
Poland
Industrial production, June 2018 y-o-y,
Poland
4.4% 1.9% 1.8%
PLN 6,093 8.2% 6.8%
Source: Consensus Forecasts, July 2018, Central Statistical Office, July 2018, *forecast

Warsaw City Report Q2 2018Investment market summary updated as of 21st August 2018
COPYRIGHT © JONES LANG LASALLE IP, INC. 2018
Prime Yields
Poland Investment Volumes
Key Investment Transactions 2018 to date
IndustrialShopping Centre Office
4.90% 4.75% 6.50%
Sector Property name LocationApproximate sale
price (€ million)Vendor Purchaser
Retail Project Chariot (28 retail properties) Various 1,000 Ares/ Axa/ Apollo Rida Griffin led Consortium
RetailM1 Czeladź, M1 Kraków, M1 Łódź, M1
ZabrzeVarious 359 Griffin led Consortium EPP
RetailGuliwer Łódź, Bielawy Toruń, Czyżyny
KrakówVarious 110 Aerium Newbridge
Retail Galeria Katowicka Katowice Confidential Meyer Bergman EPF
Industrial Prologis Park Sochaczew Sochaczew Confidential Prologis Ares
Office Warsaw Spire A (50% of shares) Warsaw 350 (50% of shares) GhelamcoMadison International
Realty
Retail Aura Centrum Olsztyna Olsztyn 65 Rockspring NEPI Rockcastle
Office Quattro Business Park Krakow 140 Starwood Globalworth Poland RE
Industrial Amazon Szczecin Szczecin 110 Invesco Vestas
Office Atrium Centrum & Atrium Plaza Warsaw 80 Peakside CPI
Industrial Panattoni porfolio (9 assets) Various 200 Panattoni JV Redefine/ Griffin
Office Spektrum Tower Warsaw 101 Europa Capital Globalworth Poland RE
Office Crown Square Warsaw Confidential Invesco Menora/ Rothschild
RetailGaleria Malta
Poznań ConfidentialConfidential
Balmain European Retail Properties
OfficePłac Małachowskiego
Warsaw 100 White Star/ Europa Capital Generali Real Estate
Retail King Cross Marcelin Poznań 91 King Cross EPP
Office Gdański Business Centre II (C&D) Warsaw 200 HB Reavis EPF
€ -€ 500
€ 1,000 € 1,500 € 2,000 € 2,500 € 3,000 € 3,500 € 4,000 € 4,500 € 5,000 € 5,500 € 6,000
2004 2005 2006 2007 2008 2009 2010 2011 2012 2013 2014 2015 2016 2017 2018to date
Office Retail Industrial Mixed Residential Hotels
The total volume of investment in Poland to date exceeded €4.17 billion out of which 54% equal to €2.23 billion have beenclosed with JLL involvement. Party whom JLL advised is highlighted in red in the table below.
Warsaw City Report Q2 2018COPYRIGHT © JONES LANG LASALLE IP, INC. 2018
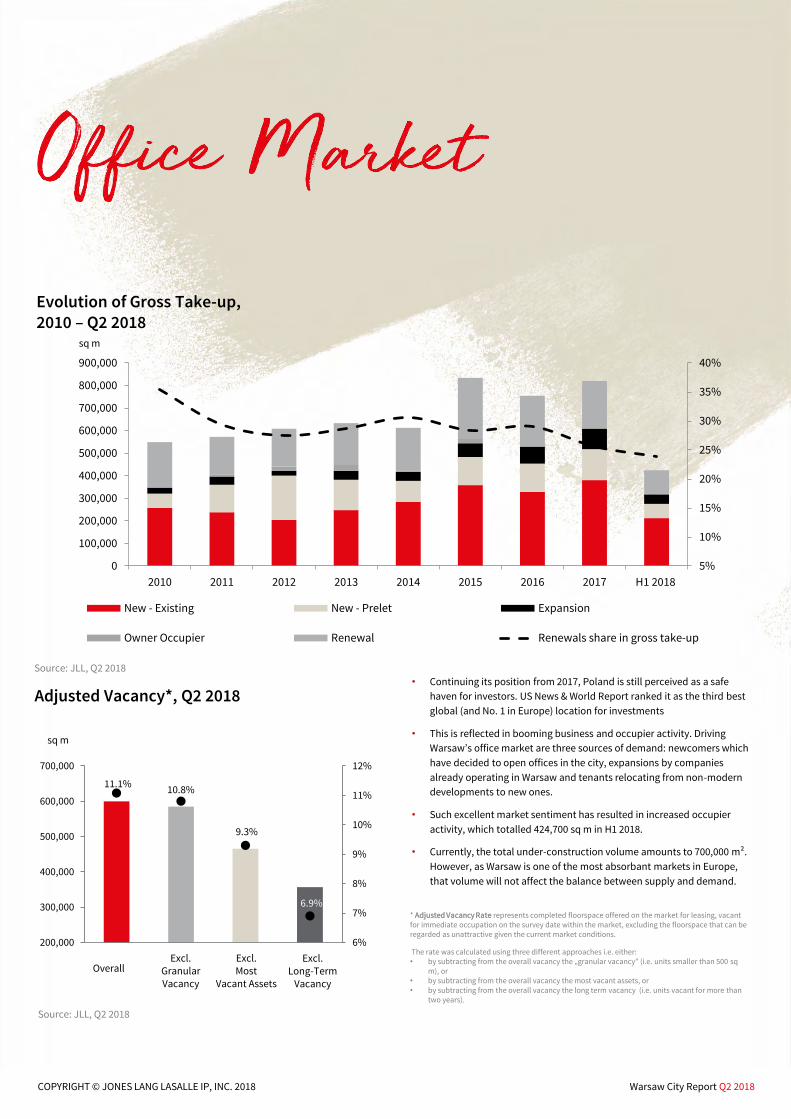
Evolution of Gross Take-up, 2010 – Q2 2018
Adjusted Vacancy*, Q2 2018• Continuing its position from 2017, Poland is still perceived as a safe
haven for investors. US News & World Report ranked it as the third best
global (and No. 1 in Europe) location for investments
• This is reflected in booming business and occupier activity. Driving
Warsaw’s office market are three sources of demand: newcomers which
have decided to open offices in the city, expansions by companies
already operating in Warsaw and tenants relocating from non-modern
developments to new ones.
• Such excellent market sentiment has resulted in increased occupier
activity, which totalled 424,700 sq m in H1 2018.
• Currently, the total under-construction volume amounts to 700,000 m².
However, as Warsaw is one of the most absorbant markets in Europe,
that volume will not affect the balance between supply and demand.
5%
10%
15%
20%
25%
30%
35%
40%
0
100,000
200,000
300,000
400,000
500,000
600,000
700,000
800,000
900,000
2010 2011 2012 2013 2014 2015 2016 2017 H1 2018
New - Existing New - Prelet Expansion
Owner Occupier Renewal Renewals share in gross take-up
* Adjusted Vacancy Rate represents completed floorspace offered on the market for leasing, vacant for immediate occupation on the survey date within the market, excluding the floorspace that can be regarded as unattractive given the current market conditions.
The rate was calculated using three different approaches i.e. either:• by subtracting from the overall vacancy the „granular vacancy” (i.e. units smaller than 500 sq
m), or• by subtracting from the overall vacancy the most vacant assets, or • by subtracting from the overall vacancy the long term vacancy (i.e. units vacant for more than
two years).
sq m
sq m
11.1%10.8%
9.3%
6.9%
6%
7%
8%
9%
10%
11%
12%
200,000
300,000
400,000
500,000
600,000
700,000
Excl. Long-Term
Vacancy
Excl. Granular Vacancy
OverallExcl. Most
Vacant Assets
Source: JLL, Q2 2018
Source: JLL, Q2 2018

Warsaw City Report Q2 2018COPYRIGHT © JONES LANG LASALLE IP, INC. 2018
Key completions in H1 2018 Key Leasing Transactions in H1 2018
Qtr Property Submarket Size (sq m)
Q2 Proximo II City Centre West 20,000
Q2 Equator IVJerozolimskie Upper
19,200
Q2 Koneser Centrum Praskie H,O,P East 17,300
Q1 Graffit Mokotów 16,600
Q2 CEDET CBD 14,300
Q2 Centrum Marszałkowska CBD 13,100
Qtr Property OccupierContract
type Deal size
(sq m)
Q1 Piękna 2.0Polish Financial
Supervision Authority New deal 14,800
Q1 Varso IICambridge
Innovation CenterPre-let 13,500
Q2 PLL LOT HQ PLL LOT Renewal 11,800
Q1 Wolf Marszałkowska Ad Pilot New deal 10,300
Q1 Harmony Office Center II Bank Millennium Renewal 7,500
Q1 Spark CSkanska Property
PolandPre-let 7,400
Source: JLL, Q2 2018
Source: JLL, Q2 2018Source: JLL, Q2 2018
Prime headline rents (€ / sq m / month)A-class
B-class
City Centre€17-21
€13.5-18
CBD€20.5-23.0
€15-19
East€11-14
€9.5-13North€13.5-14.5
€12.5-14
West€13.5-15
€10-13.5
Jerozolimskie corridor
€12.5-14.5
€10-13
Żwirki i Wigury corridor
€12-14
€10-13
Puławska corridor
€11-13
€9.5-11.5
Ursynów, Wilanów
€13-14
€12-13
Mokotów€12-14.5
€10-12.5
1
2
3
4
56
7
Warsaw City Report Q2 2018COPYRIGHT © JONES LANG LASALLE IP, INC. 2018
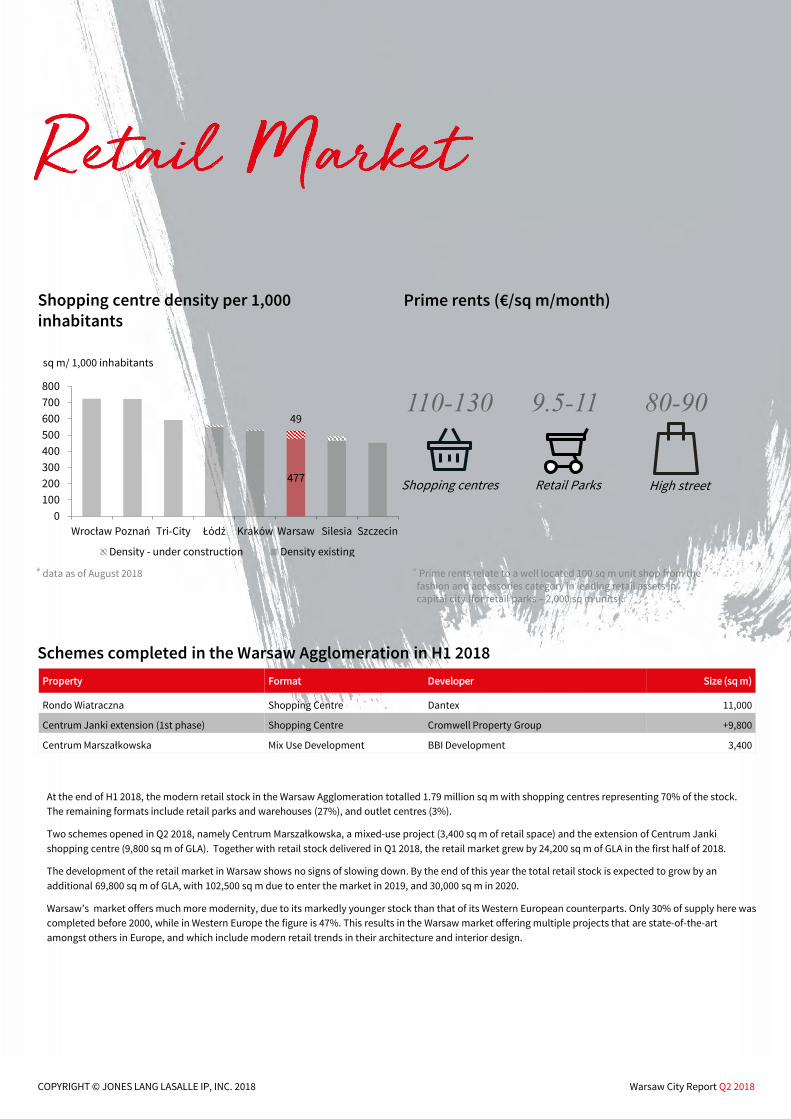
Shopping centre density per 1,000 inhabitants
Schemes completed in the Warsaw Agglomeration in H1 2018
Prime rents (€/sq m/month)
110-130
Shopping centres
9.5-11 80-90
Retail Parks High street
* Prime rents relate to a well located 100 sq m unit shop from the fashion and accessories category in leading retail assets in capital city (for retail parks – 2,000 sq m units).
At the end of H1 2018, the modern retail stock in the Warsaw Agglomeration totalled 1.79 million sq m with shopping centres representing 70% of the stock.
The remaining formats include retail parks and warehouses (27%), and outlet centres (3%).
Two schemes opened in Q2 2018, namely Centrum Marszałkowska, a mixed-use project (3,400 sq m of retail space) and the extension of Centrum Janki
shopping centre (9,800 sq m of GLA). Together with retail stock delivered in Q1 2018, the retail market grew by 24,200 sq m of GLA in the first half of 2018.
The development of the retail market in Warsaw shows no signs of slowing down. By the end of this year the total retail stock is expected to grow by an
additional 69,800 sq m of GLA, with 102,500 sq m due to enter the market in 2019, and 30,000 sq m in 2020.
Warsaw’s market offers much more modernity, due to its markedly younger stock than that of its Western European counterparts. Only 30% of supply here was
completed before 2000, while in Western Europe the figure is 47%. This results in the Warsaw market offering multiple projects that are state-of-the-art
amongst others in Europe, and which include modern retail trends in their architecture and interior design.
* data as of August 2018
Property Format Developer Size (sq m)
Rondo Wiatraczna Shopping Centre Dantex 11,000
Centrum Janki extension (1st phase) Shopping Centre Cromwell Property Group +9,800
Centrum Marszałkowska Mix Use Development BBI Development 3,400
477
49
0
100
200
300
400
500
600
700
800
Wrocław Poznań Tri-City Łódź Kraków Warsaw Silesia Szczecin
sq m/ 1,000 inhabitants
Density - under construction Density existing

Warsaw City Report Q2 2018COPYRIGHT © JONES LANG LASALLE IP, INC. 2018
Schemes under construction in the Warsaw Agglomeration*
Property Format Developer Size (sq m)
Galeria Młociny Shopping Centre Echo Investment/ Echo Polska Properties 76,000
Nowa Stacja in Pruszków Shopping Centre ECC 26,800
ArtN Mix Use Development Capital Park 24,000
Centrum Praskie Koneser Mix Use Development BBI Development/ Liebrecht & wooD 21,000
EC Powiśle Mix Use Development White Star Real Estate/ Tristan Capital Partners 15,500
Centrum Janki extension (2nd phase) Shopping Centre Cromwell Property Group +11,000
Atrium Targówek extension Shopping Centre Atrium Poland Real Estate Management +8,600
CEDET (retail part) Mix Use Development Immobel 7,000
Browary Warszawskie Mix Use Development Echo Investment 6,000
Atrium Reduta extension Shopping Centre Atrium Poland Real Estate Management +4,400
Atrium Promenada extension Shopping Centre Atrium Poland Real Estate Management +2,000
* Rows marked dark grey apply to projects located in Warsaw city
Quantum of space under construction with completion scheduled for the following years*
* Including all retail formats, status as of August 2018
2018 2019
69,800 sq m
2020
102,500 sq m 30,000 sq m
Warsaw City Report Q2 2018COPYRIGHT © JONES LANG LASALLE IP, INC. 2018
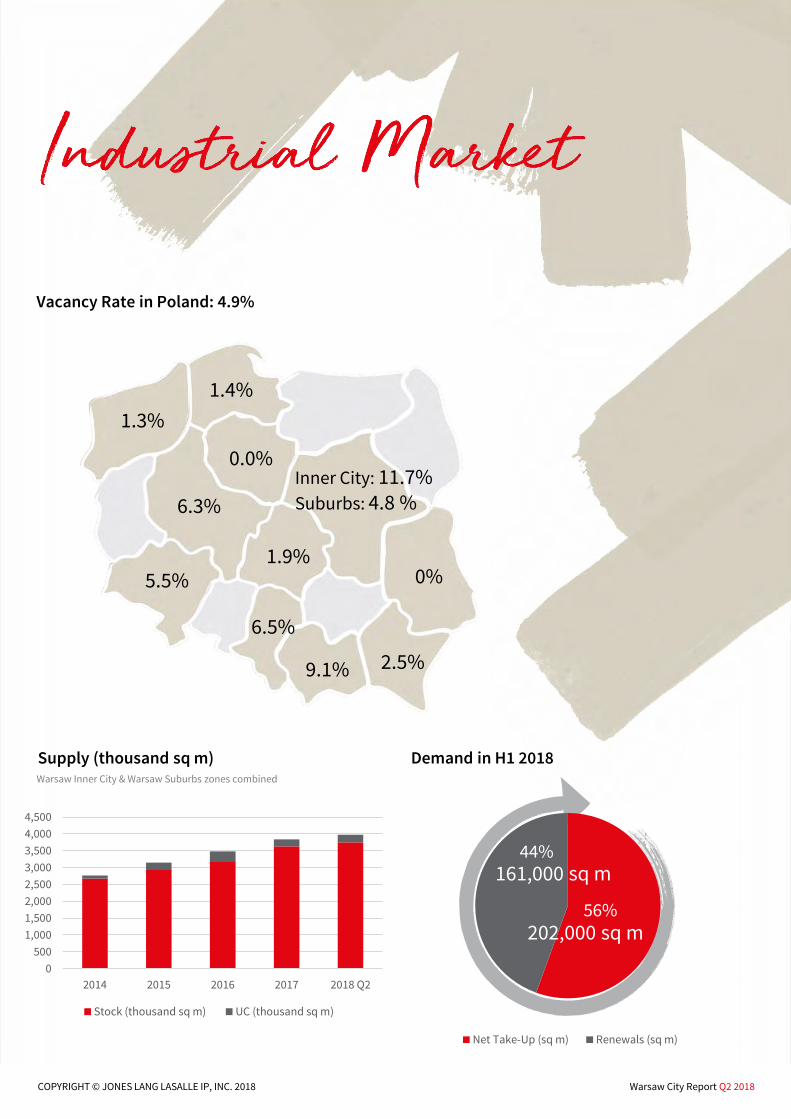
Vacancy Rate in Poland: 4.9%
Supply (thousand sq m) Demand in H1 2018
1.3%
1.4%
6.3%
0.0%Inner City: 11.7%Suburbs: 4.8 %
0%1.9%
5.5%
6.5%
9.1% 2.5%
Warsaw Inner City & Warsaw Suburbs zones combined
56%
44%
Net Take-Up (sq m) Renewals (sq m)
0
500
1,000
1,500
2,000
2,500
3,000
3,500
4,000
4,500
2014 2015 2016 2017 2018 Q2
Stock (thousand sq m) UC (thousand sq m)
202,000 sq m
161,000 sq m

Warsaw City Report Q2 2018COPYRIGHT © JONES LANG LASALLE IP, INC. 2018
Net take-up by Sector in H1 2018 (sq m)
Prime rents* (€ / sq m / month)Key Transactions in H1 2018
*as of end Q2 2018
Warsaw Inner City & Warsaw Suburbs zones combined
Tenant PropertySize
(sq m)Deal Type
Sector
L’OrealPrologis Park Błonie II
19,500 Renewal FMCG
Fiege P3 Mszczonów 17,200 RenewalLogistics operator
Cursor Hillwood Kalwaria 13,800 New dealLogisticsoperator
FriscoCity Logistics Warsaw I
12,000 New deal Food
DB SchenkerPrologis Park Nadarzyn
11,000 RenewalLogistics operator
Zone Headline Rents Effective Rent
Warsaw Inner City 4.30 – 5.10 3.50 – 4.60
Warsaw Suburbs 2.70 – 3.60 1.90– 2.80
57%
8%
8%
4%
3%
3%
3%
2%1%
11%
Logistics operator Food Light manufacturing Automotive Retailer
Pharmaceuticals Construction FMCG Electronics Other
Warsaw City Report Q2 2018COPYRIGHT © JONES LANG LASALLE IP, INC. 2018
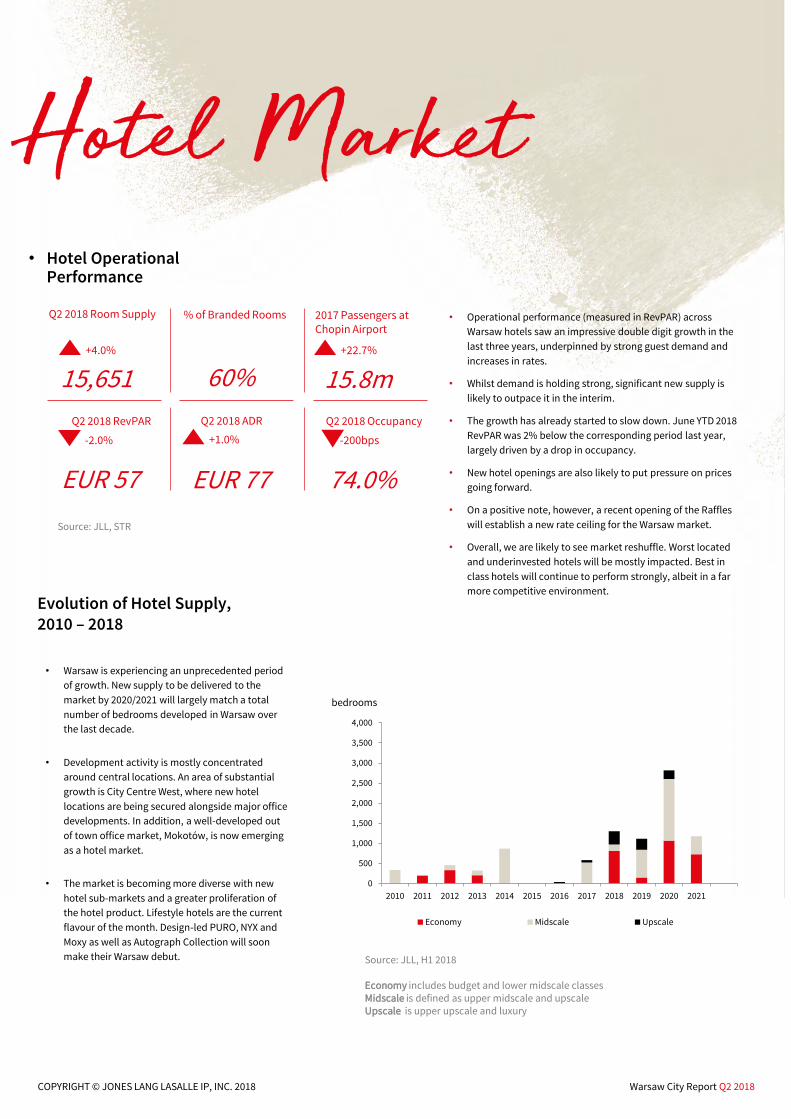
Evolution of Hotel Supply, 2010 – 2018
• Operational performance (measured in RevPAR) across
Warsaw hotels saw an impressive double digit growth in the
last three years, underpinned by strong guest demand and
increases in rates.
• Whilst demand is holding strong, significant new supply is
likely to outpace it in the interim.
• The growth has already started to slow down. June YTD 2018
RevPAR was 2% below the corresponding period last year,
largely driven by a drop in occupancy.
• New hotel openings are also likely to put pressure on prices
going forward.
• On a positive note, however, a recent opening of the Raffles
will establish a new rate ceiling for the Warsaw market.
• Overall, we are likely to see market reshuffle. Worst located
and underinvested hotels will be mostly impacted. Best in
class hotels will continue to perform strongly, albeit in a far
more competitive environment.
0
500
1,000
1,500
2,000
2,500
3,000
3,500
4,000
2010 2011 2012 2013 2014 2015 2016 2017 2018 2019 2020 2021
Economy Midscale Upscale
bedrooms
Source: JLL, STR
Source: JLL, H1 2018
Economy includes budget and lower midscale classesMidscale is defined as upper midscale and upscaleUpscale is upper upscale and luxury
Q2 2018 OccupancyQ2 2018 RevPAR Q2 2018 ADR
Q2 2018 Room Supply % of Branded Rooms 2017 Passengers at Chopin Airport
+4.0% +22.7%
15.8m60%15,651
74.0%EUR 77EUR 57
-2.0% +1.0% -200bps
• Warsaw is experiencing an unprecedented period
of growth. New supply to be delivered to the
market by 2020/2021 will largely match a total
number of bedrooms developed in Warsaw over
the last decade.
• Development activity is mostly concentrated
around central locations. An area of substantial
growth is City Centre West, where new hotel
locations are being secured alongside major office
developments. In addition, a well-developed out
of town office market, Mokotów, is now emerging
as a hotel market.
• The market is becoming more diverse with new
hotel sub-markets and a greater proliferation of
the hotel product. Lifestyle hotels are the current
flavour of the month. Design-led PURO, NYX and
Moxy as well as Autograph Collection will soon
make their Warsaw debut.
• Hotel Operational Performance

jll.pl
© 2018 Jones Lang LaSalle IP, Inc. All rights reserved. No part of this publication may be reproduced or transmitted in any form or by any means without prior written consent of Jones Lang LaSalle. It is based on material that we believe to be reliable. Whilst every effort has been made to ensure its accuracy, we cannot offer any warranty that it contains no factual errors. We would like to be told of any such errors in order to correct them.
Mateusz PolkowskiHead of Research & Consulting
+48 22 167 [email protected]
Anna MłyniecHead of Office Agency Poland
+48 22 167 [email protected]
Anna WysockaHead of Retail Agency Poland
+48 22 167 [email protected]
Tomasz OlszewskiHead of Industrial Agency, CEE
+48 22 167 [email protected]
Contacts