Embed Size (px)
Citation preview
City-wide Development Cost Levy (DCL) Update
(2017-2026)
June 7, 2017
1. Overview
2. Growth and Program Details
3. Proposed DCL Rates
4. Proposed Policy Changes
– Extend DCL Rate Relief & New DCL rate categories
– Unwind Downtown South DCL District
5. Next Steps
Agenda
What are DCLs?
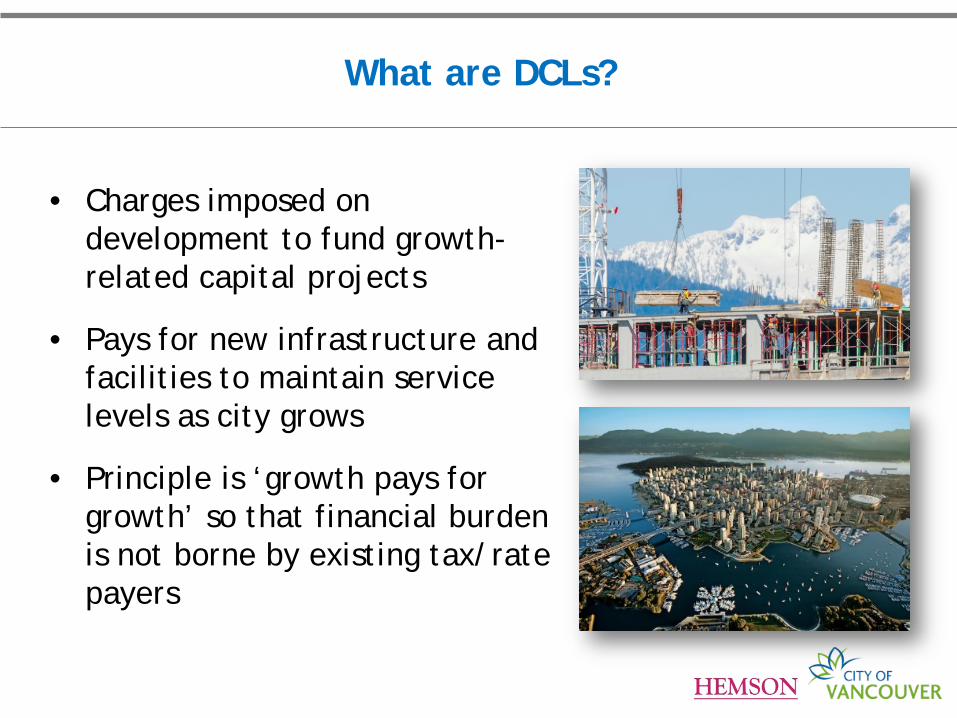
• Charges imposed on development to fund growth-related capital projects
• Pays for new infrastructure and facilities to maintain service levels as city grows
• Principle is ‘growth pays for growth’ so that financial burden is not borne by existing tax/rate payers
What are DCLs?
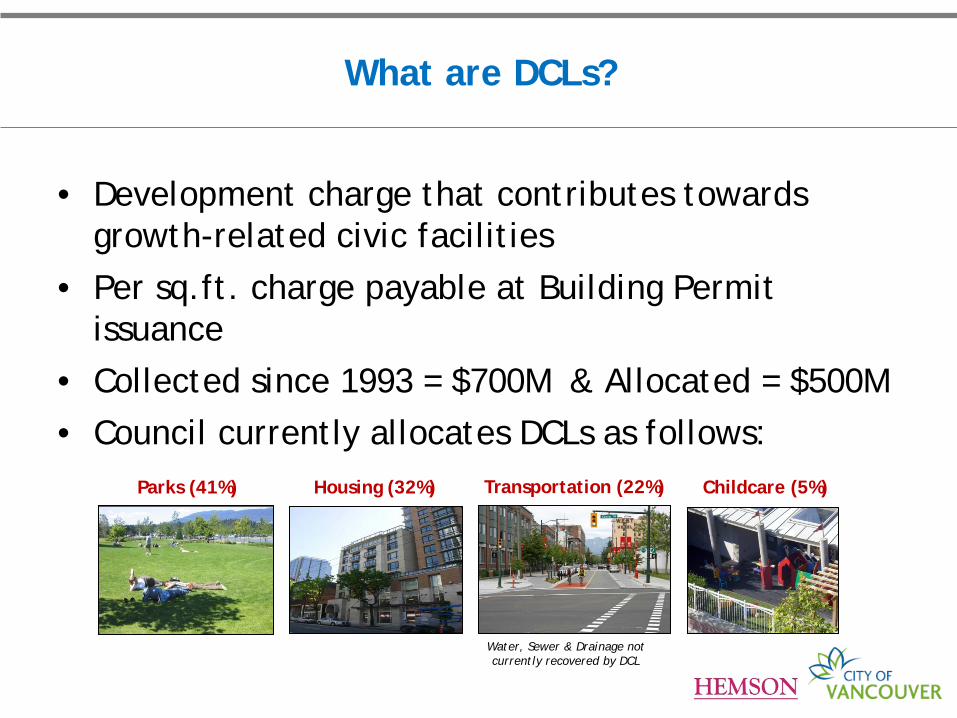
• Development charge that contributes towards growth-related civic facilities
• Per sq.ft. charge payable at Building Permit issuance
• Collected since 1993 = $700M & Allocated = $500M • Council currently allocates DCLs as follows:
Transportation (22%) Childcare (5%) Parks (41%) Housing (32%)
Water, Sewer & Drainage not currently recovered by DCL
What items do DCLs not pay for?
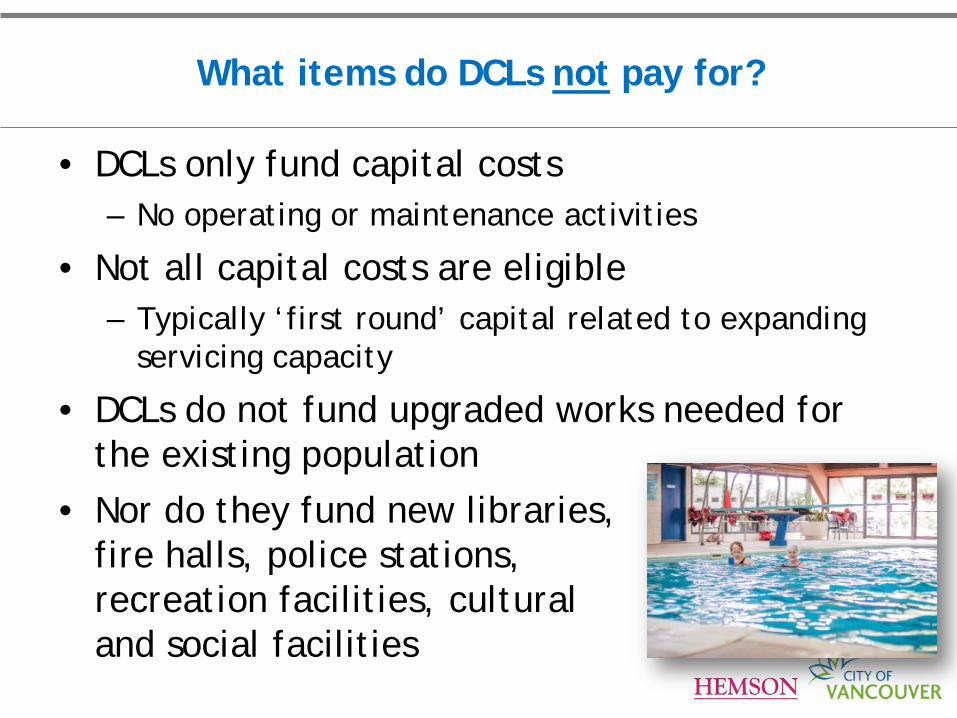
• DCLs only fund capital costs – No operating or maintenance activities
• Not all capital costs are eligible – Typically ‘first round’ capital related to expanding
servicing capacity
• DCLs do not fund upgraded works needed for the existing population
• Nor do they fund new libraries, fire halls, police stations, recreation facilities, cultural and social facilities
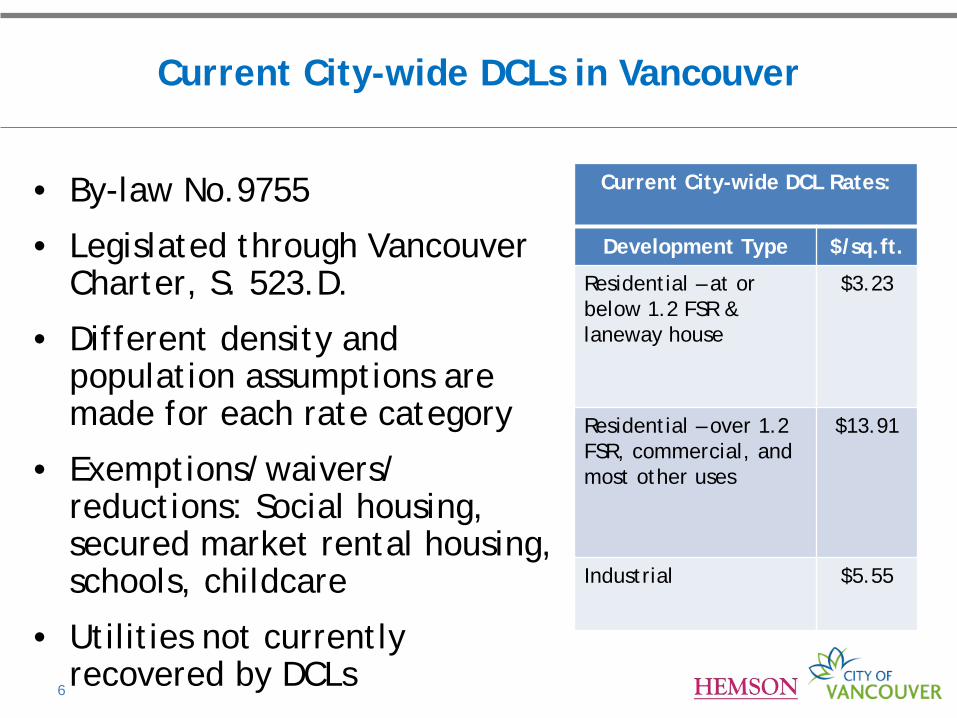
• By-law No.9755
• Legislated through Vancouver Charter, S. 523.D.
• Different density and population assumptions are made for each rate category
• Exemptions/waivers/ reductions: Social housing, secured market rental housing, schools, childcare
• Utilities not currently recovered by DCLs
6
Current City-wide DCLs in Vancouver
Current City-wide DCL Rates:
Development Type $/sq.ft.
Residential – at or below 1.2 FSR & laneway house
$3.23
Residential – over 1.2 FSR, commercial, and most other uses
$13.91
Industrial $5.55
7
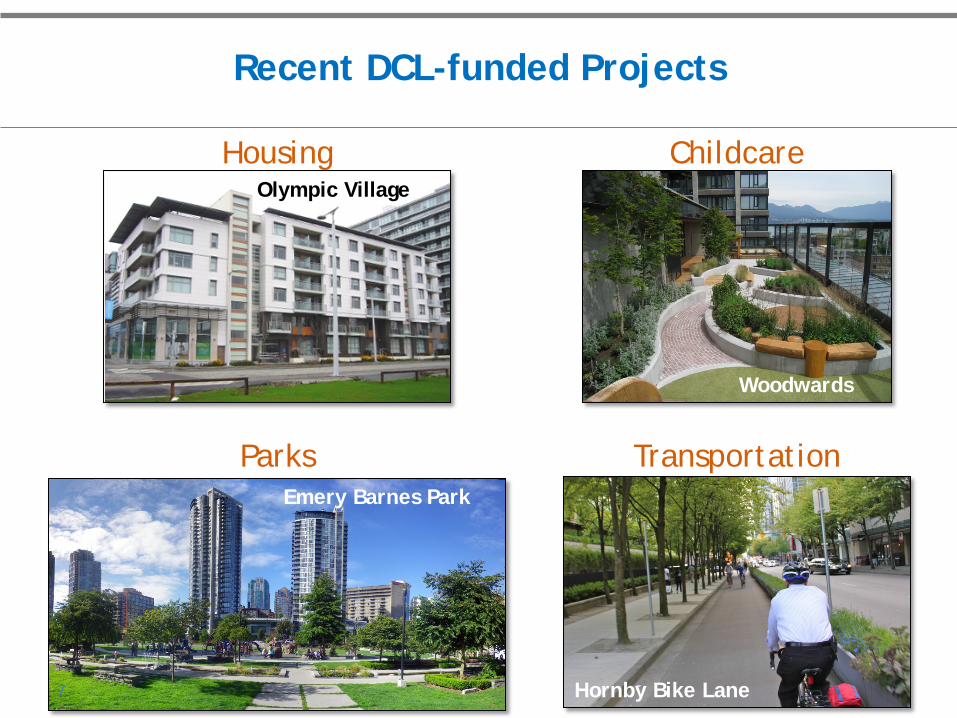
Olympic Village
Housing
Woodwards
Childcare
Hornby Bike Lane
Transportation Emery Barnes Park
Parks
Recent DCL-funded Projects
7
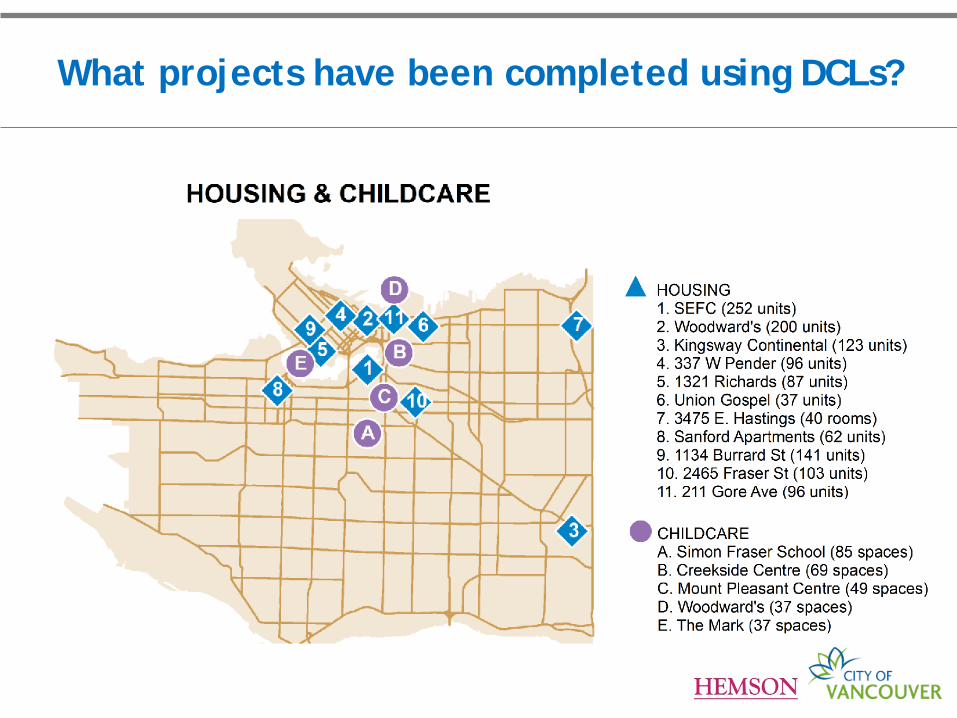
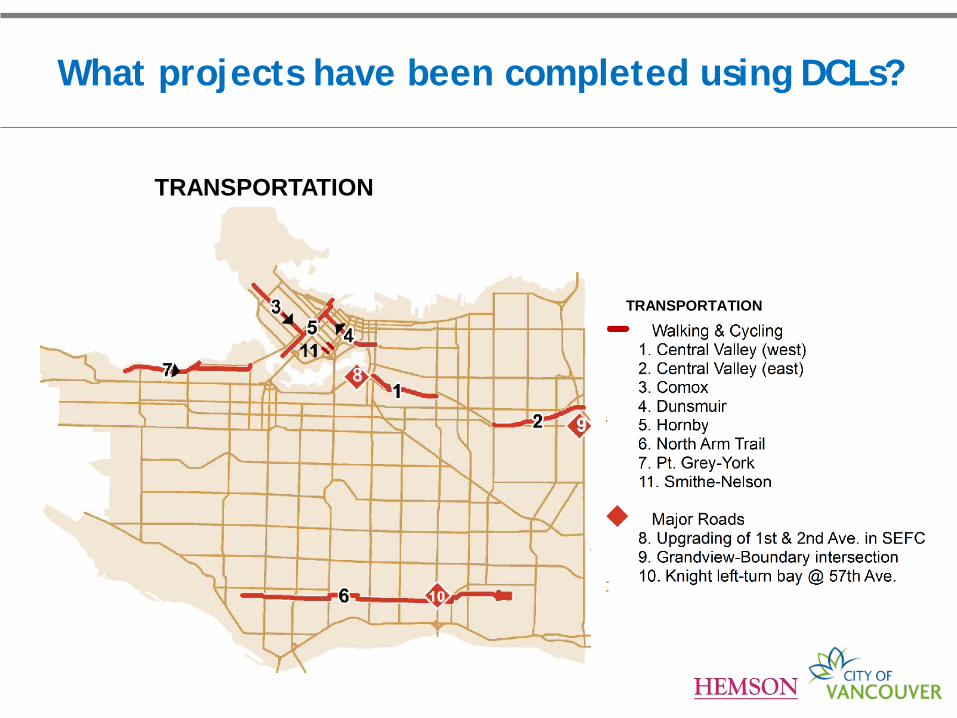
What projects have been completed using DCLs?
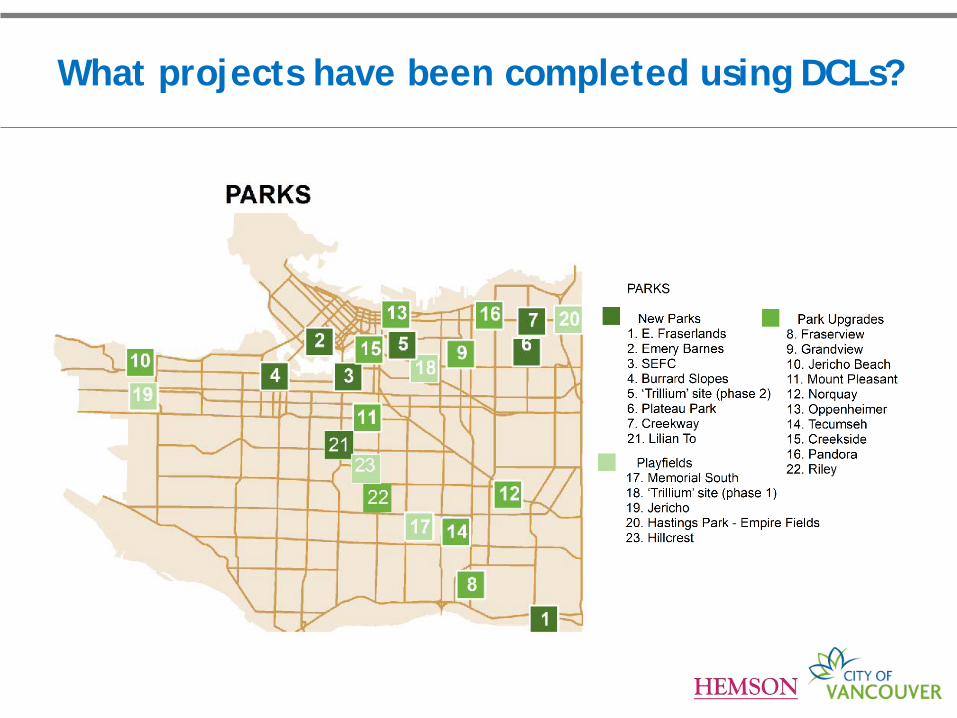
What projects have been completed using DCLs?
What projects have been completed using DCLs?
TRANSPORTATION
TRANSPORTATION
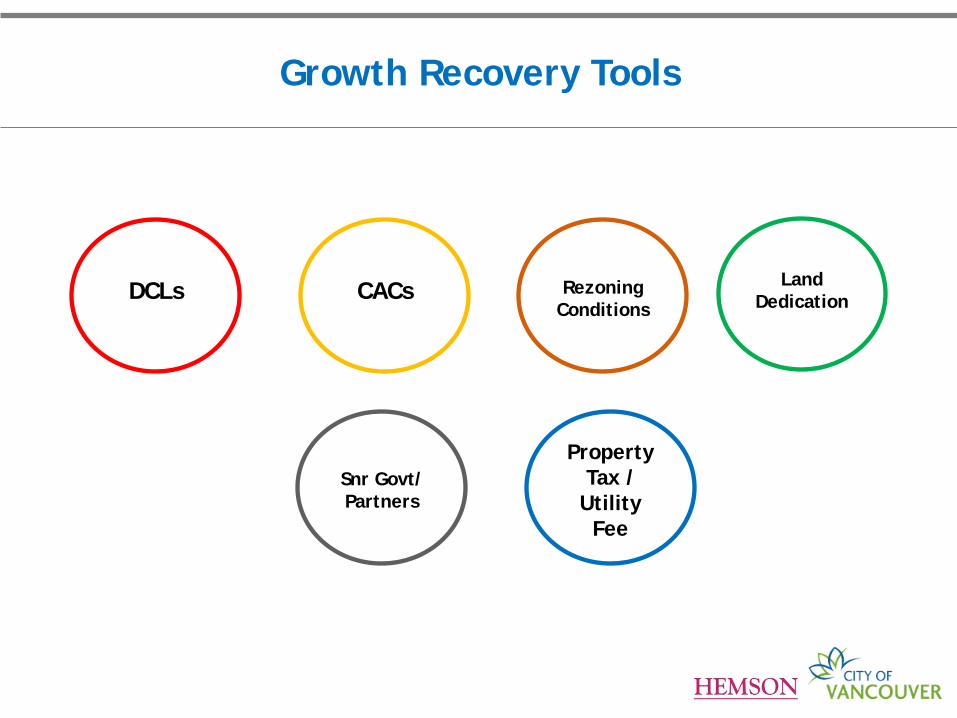
Growth Recovery Tools
DCLs
Rezoning
Conditions
CACs
Snr Govt/ Partners
Property Tax /
Utility Fee
Land
Dedication
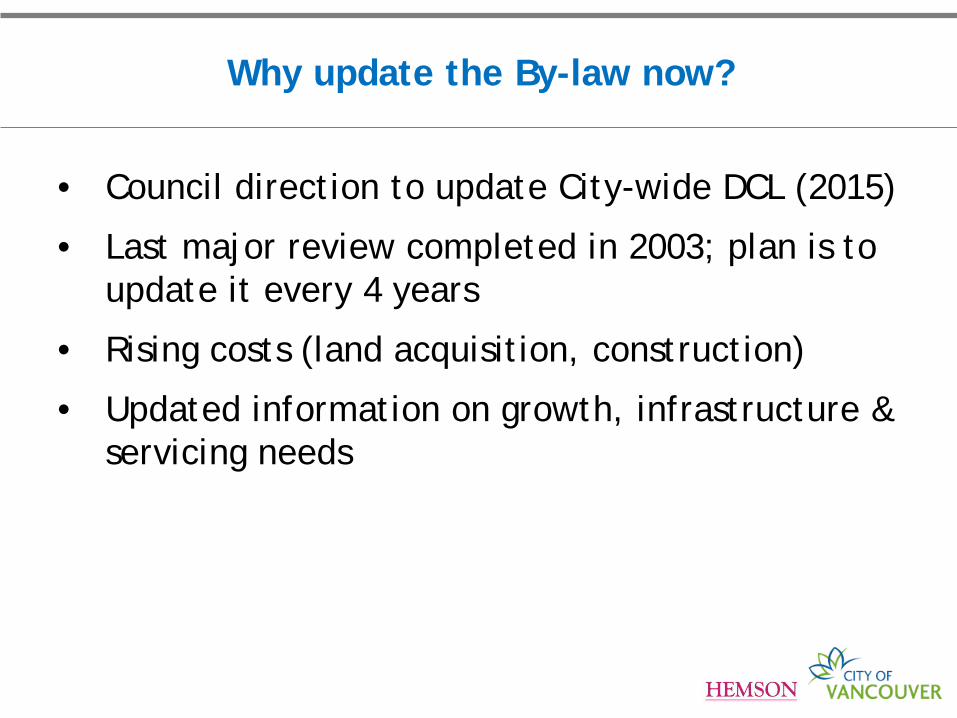
Why update the By-law now?
• Council direction to update City-wide DCL (2015)
• Last major review completed in 2003; plan is to update it every 4 years
• Rising costs (land acquisition, construction)
• Updated information on growth, infrastructure & servicing needs
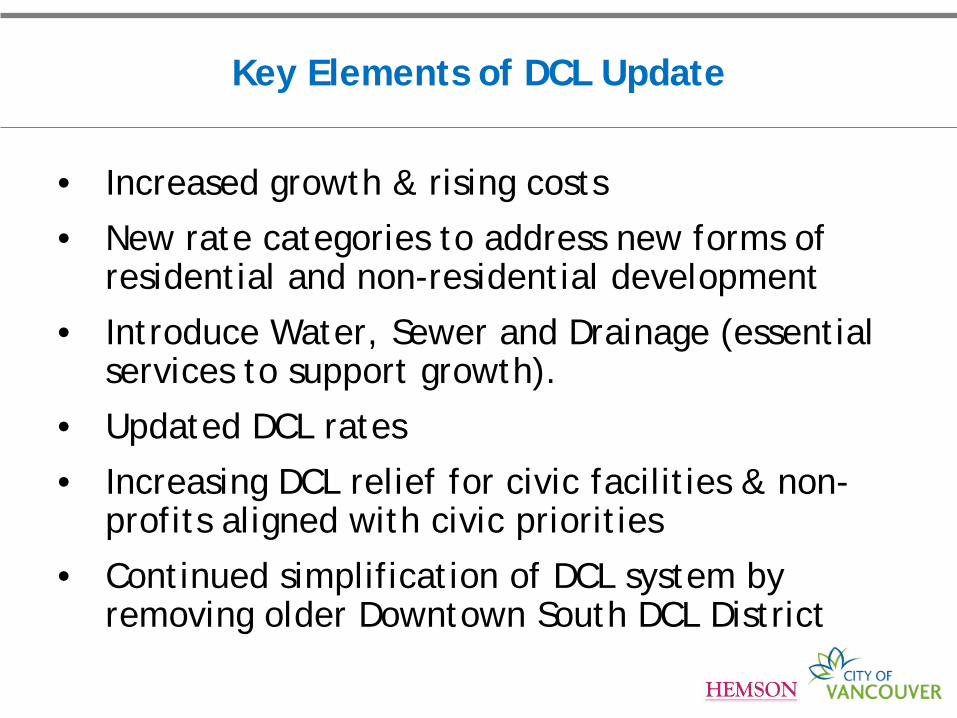
Key Elements of DCL Update
• Increased growth & rising costs
• New rate categories to address new forms of residential and non-residential development
• Introduce Water, Sewer and Drainage (essential services to support growth).
• Updated DCL rates
• Increasing DCL relief for civic facilities & non-profits aligned with civic priorities
• Continued simplification of DCL system by removing older Downtown South DCL District
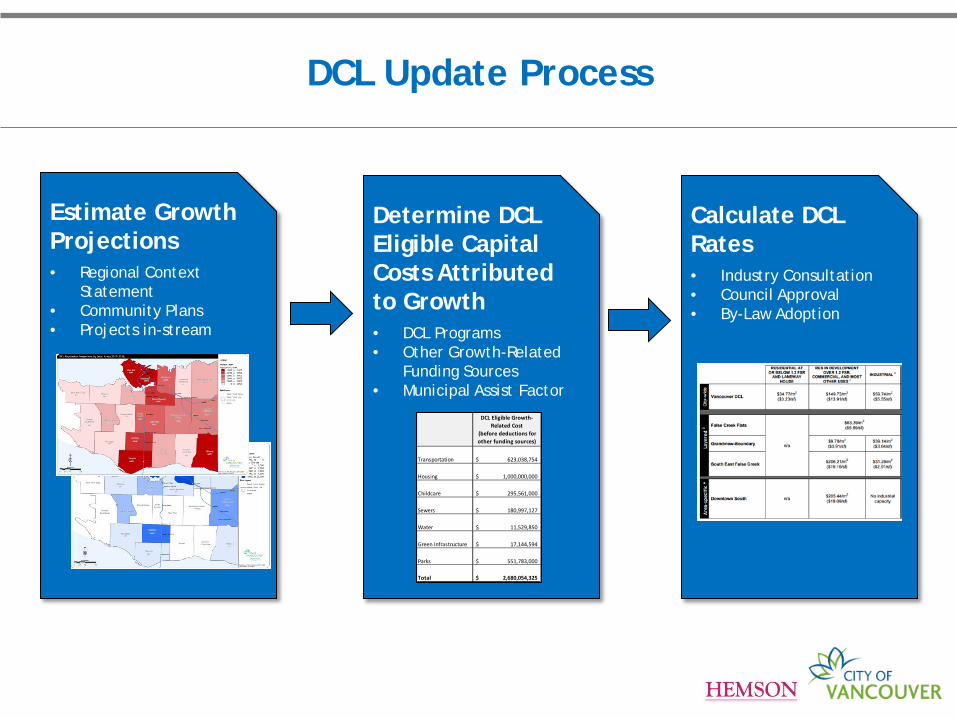
Estimate Growth Projections • Regional Context
Statement • Community Plans • Projects in-stream
DCL Update Process
Determine DCL Eligible Capital Costs Attributed to Growth • DCL Programs • Other Growth-Related
Funding Sources • Municipal Assist Factor
Calculate DCL Rates • Industry Consultation • Council Approval • By-Law Adoption
DCL Eligible Growth-Related Cost
(before deductions for other funding sources)
Transportation 623,038,754$
Housing 1,000,000,000$
Childcare 295,561,000$
Sewers 180,997,127$
Water 11,529,850$
Green Infrastructure 17,144,594$
Parks 551,783,000$
Total 2,680,054,325$
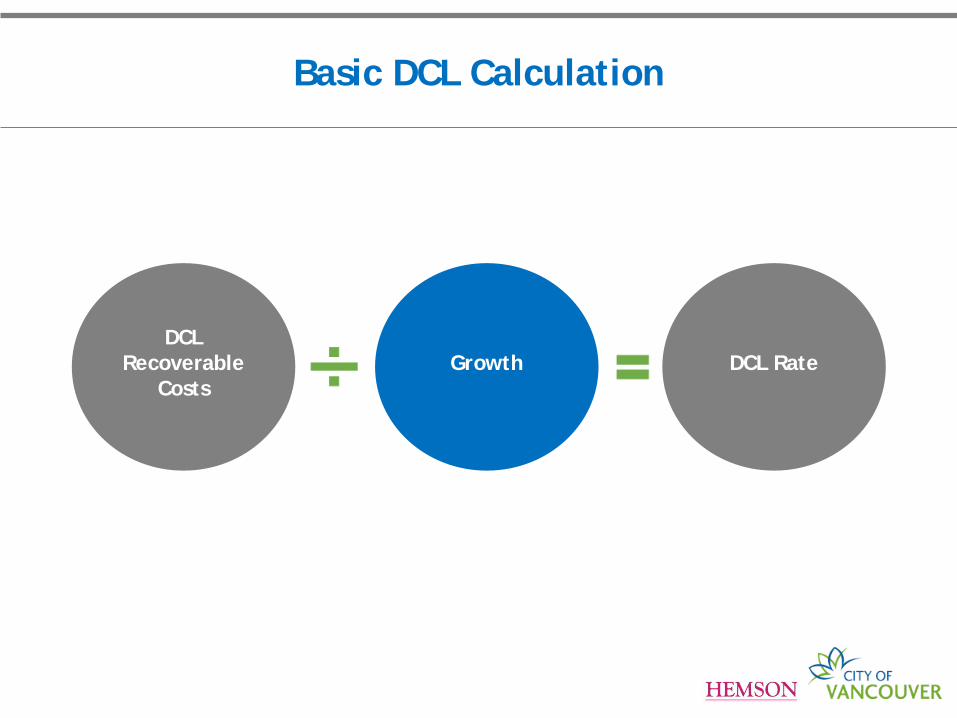
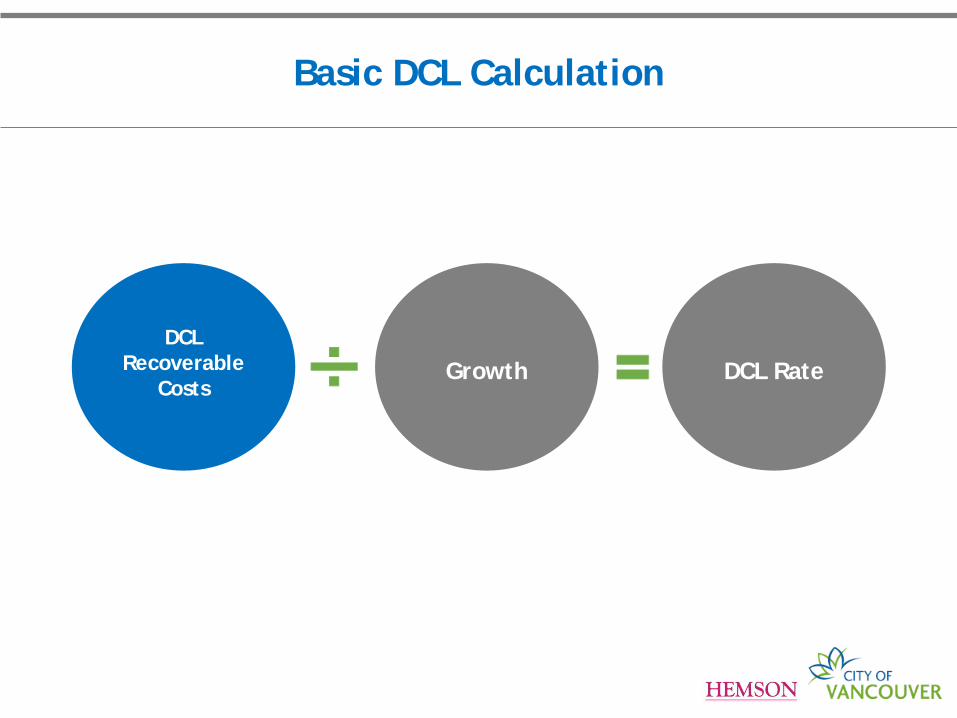
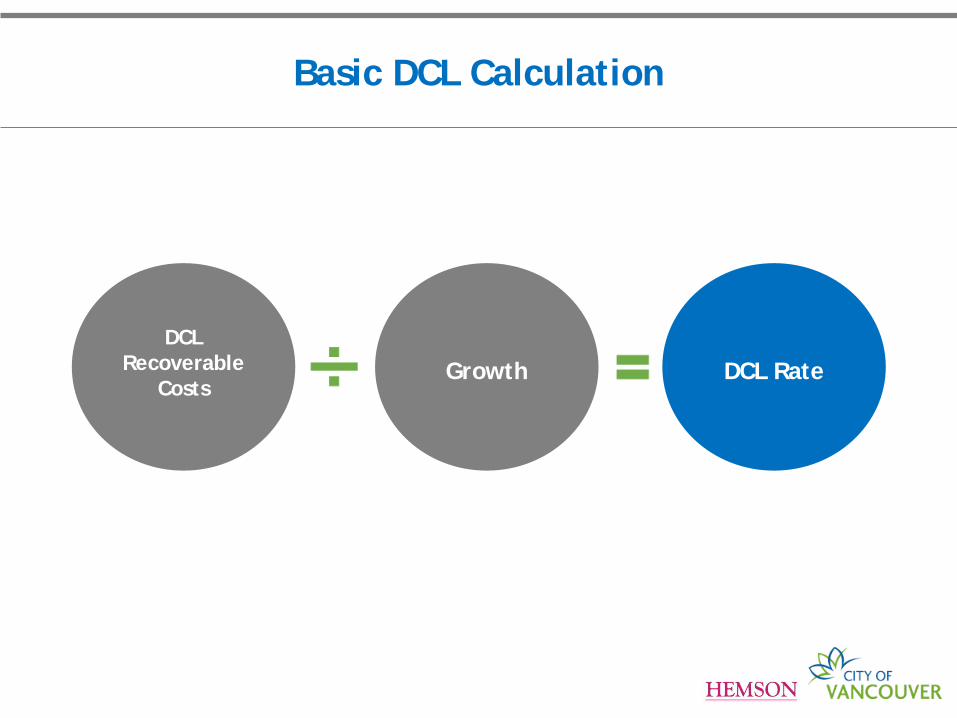
Basic DCL Calculation
DCL
Recoverable Costs
Growth
DCL Rate
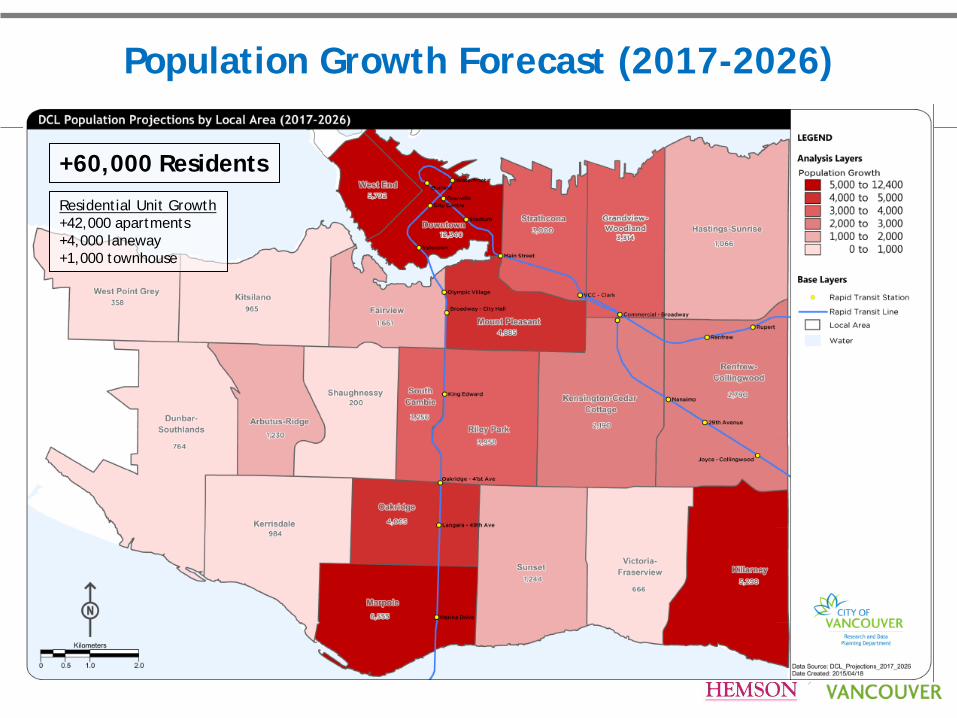
Population Growth Forecast (2017-2026)
+60,000 Residents
Residential Unit Growth +42,000 apartments +4,000 laneway +1,000 townhouse
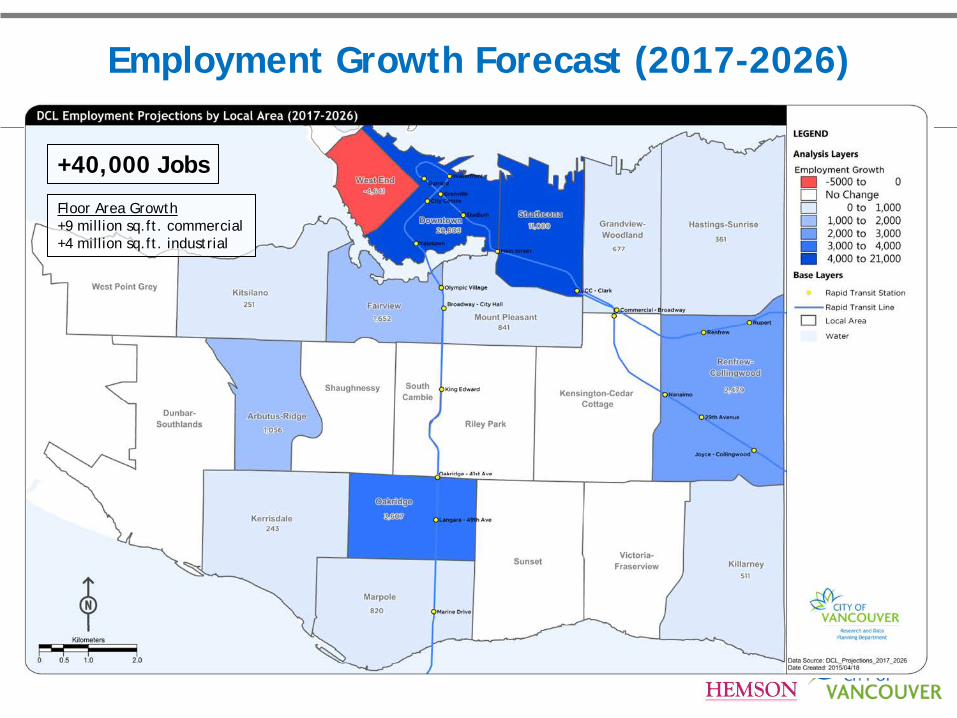
Employment Growth Forecast (2017-2026)
+40,000 Jobs
Floor Area Growth +9 million sq.ft. commercial +4 million sq.ft. industrial
Basic DCL Calculation
DCL
Recoverable Costs
Growth
DCL Rate
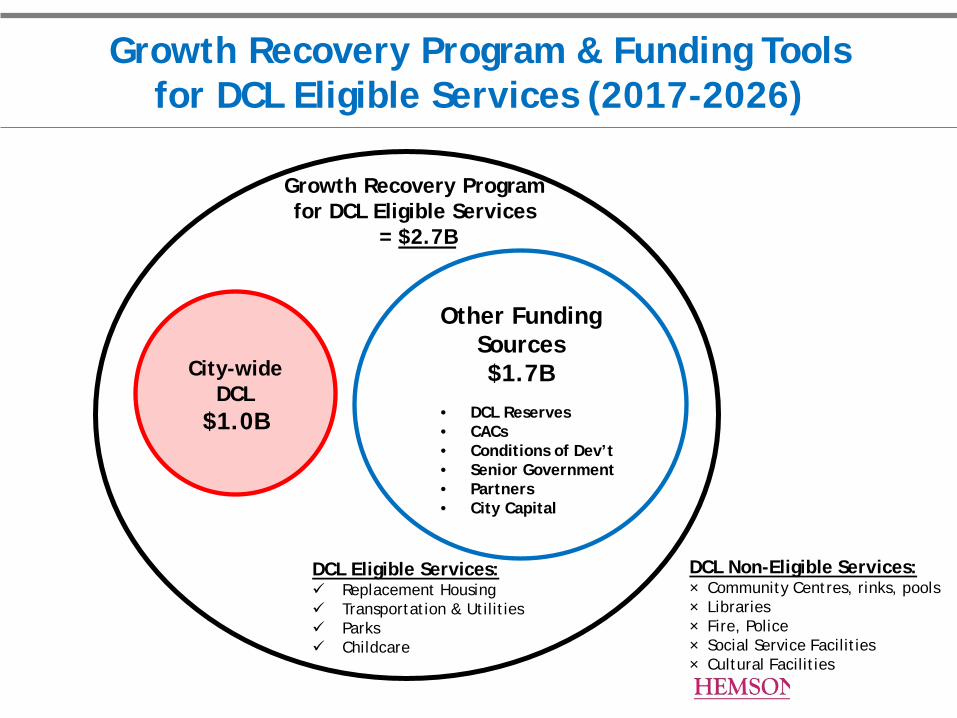
Growth Recovery Program & Funding Tools for DCL Eligible Services (2017-2026)
City-wide
DCL $1.0B
Growth Recovery Program for DCL Eligible Services
= $2.7B
DCL Eligible Services: Replacement Housing Transportation & Utilities Parks Childcare
DCL Non-Eligible Services: × Community Centres, rinks, pools × Libraries × Fire, Police × Social Service Facilities × Cultural Facilities
Other Funding Sources $1.7B
• DCL Reserves • CACs • Conditions of Dev’t • Senior Government • Partners • City Capital
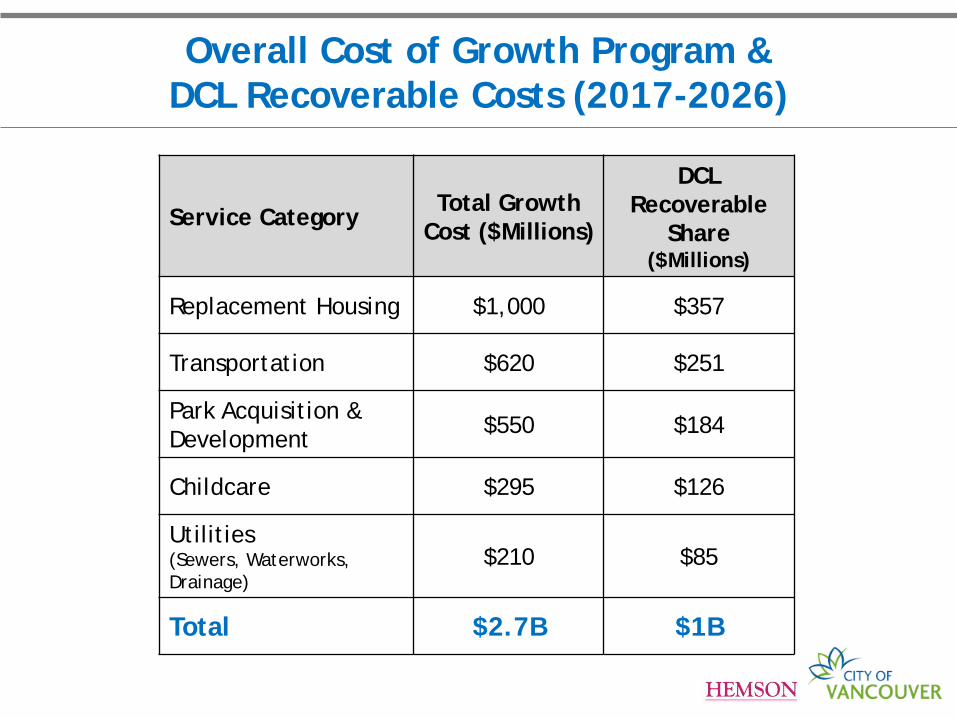
Overall Cost of Growth Program & DCL Recoverable Costs (2017-2026)
Service Category Total Growth Cost ($Millions)
DCL Recoverable
Share ($Millions)
Replacement Housing $1,000 $357
Transportation $620 $251
Park Acquisition & Development $550 $184
Childcare $295 $126
Utilities (Sewers, Waterworks, Drainage)
$210 $85
Total $2.7B $1B
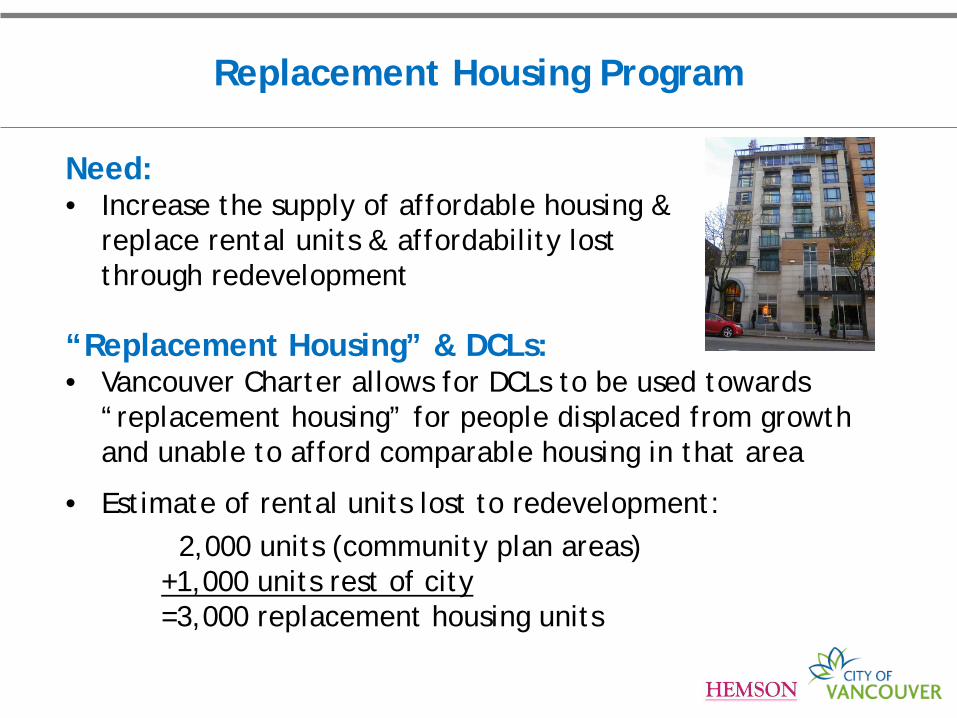
Replacement Housing Program
Need: • Increase the supply of affordable housing &
replace rental units & affordability lost through redevelopment
“Replacement Housing” & DCLs: • Vancouver Charter allows for DCLs to be used towards
“replacement housing” for people displaced from growth and unable to afford comparable housing in that area
• Estimate of rental units lost to redevelopment: 2,000 units (community plan areas) +1,000 units rest of city =3,000 replacement housing units
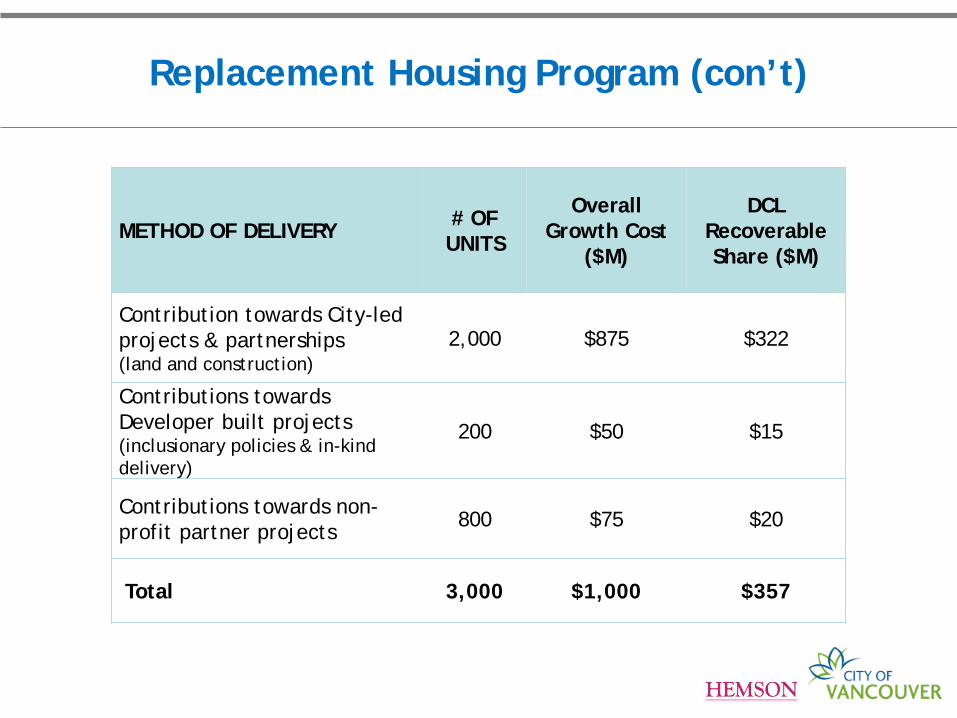
Replacement Housing Program (con’t)
METHOD OF DELIVERY # OF UNITS
Overall Growth Cost
($M)
DCL Recoverable Share ($M)
Contribution towards City-led projects & partnerships (land and construction)
2,000 $875 $322
Contributions towards Developer built projects (inclusionary policies & in-kind delivery)
200 $50 $15
Contributions towards non-profit partner projects 800 $75 $20
Total 3,000 $1,000 $357
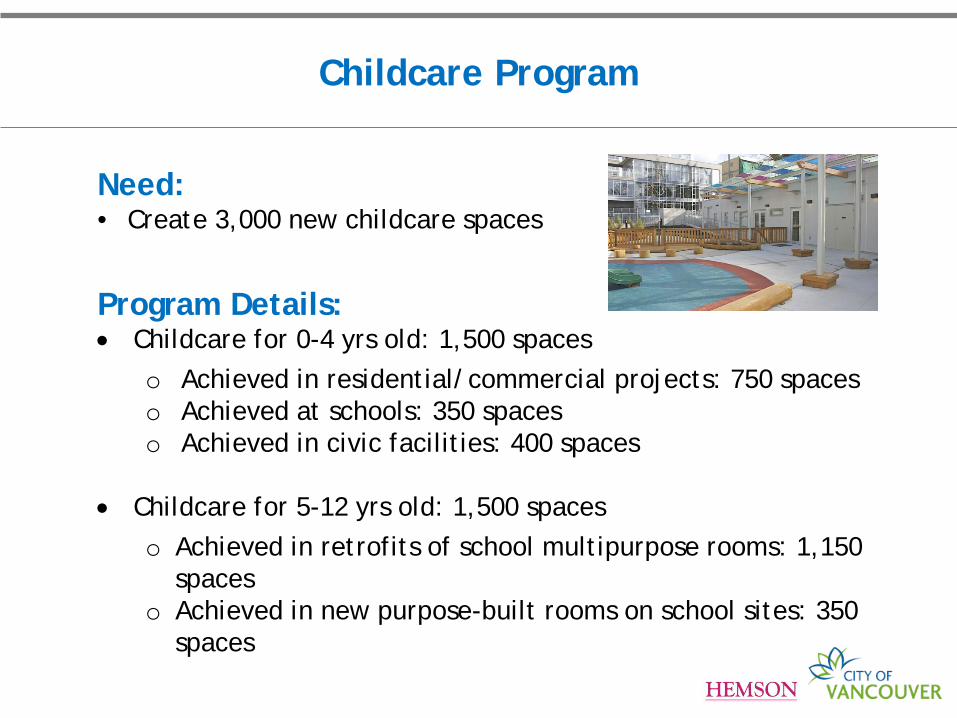
Childcare Program
Need: • Create 3,000 new childcare spaces
Program Details: • Childcare for 0-4 yrs old: 1,500 spaces
o Achieved in residential/commercial projects: 750 spaces o Achieved at schools: 350 spaces o Achieved in civic facilities: 400 spaces
• Childcare for 5-12 yrs old: 1,500 spaces
o Achieved in retrofits of school multipurpose rooms: 1,150 spaces
o Achieved in new purpose-built rooms on school sites: 350 spaces
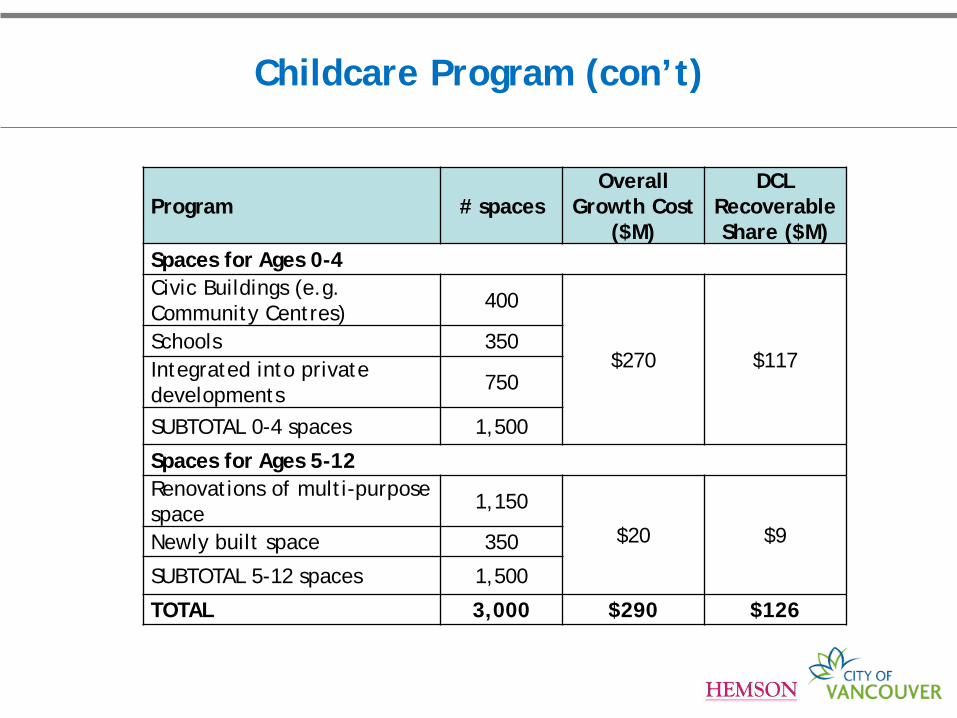
Childcare Program (con’t)
Program # spaces Overall
Growth Cost ($M)
DCL Recoverable Share ($M)
Spaces for Ages 0-4 Civic Buildings (e.g. Community Centres) 400
$270 $117 Schools 350 Integrated into private developments 750
SUBTOTAL 0-4 spaces 1,500
Spaces for Ages 5-12 Renovations of multi-purpose space 1,150
$20 $9 Newly built space 350
SUBTOTAL 5-12 spaces 1,500
TOTAL 3,000 $290 $126
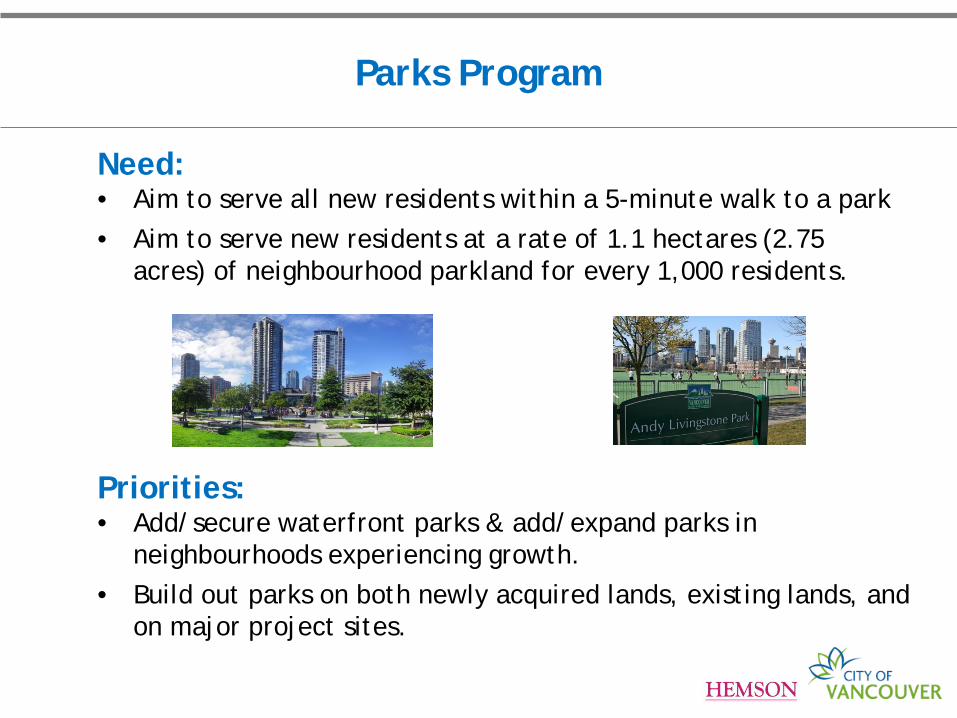
Parks Program
Need: • Aim to serve all new residents within a 5-minute walk to a park • Aim to serve new residents at a rate of 1.1 hectares (2.75
acres) of neighbourhood parkland for every 1,000 residents.
Priorities: • Add/secure waterfront parks & add/expand parks in
neighbourhoods experiencing growth. • Build out parks on both newly acquired lands, existing lands, and
on major project sites.
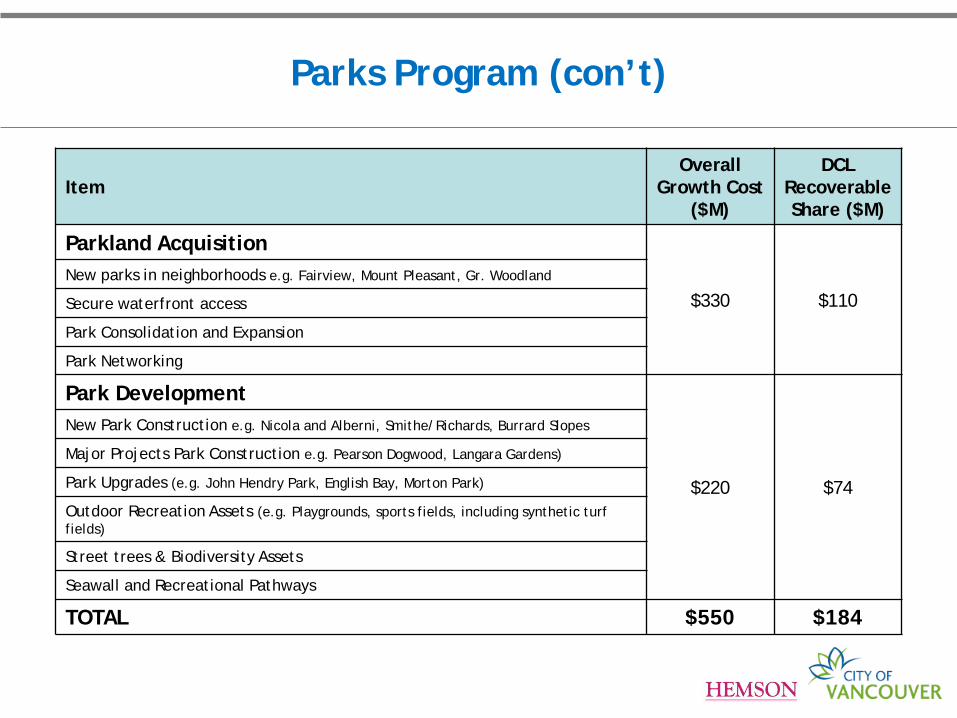
Parks Program (con’t)
Item Overall
Growth Cost ($M)
DCL Recoverable Share ($M)
Parkland Acquisition
$330 $110 New parks in neighborhoods e.g. Fairview, Mount Pleasant, Gr. Woodland
Secure waterfront access
Park Consolidation and Expansion
Park Networking
Park Development
$220 $74
New Park Construction e.g. Nicola and Alberni, Smithe/Richards, Burrard Slopes
Major Projects Park Construction e.g. Pearson Dogwood, Langara Gardens)
Park Upgrades (e.g. John Hendry Park, English Bay, Morton Park)
Outdoor Recreation Assets (e.g. Playgrounds, sports fields, including synthetic turf fields)
Street trees & Biodiversity Assets
Seawall and Recreational Pathways
TOTAL $550 $184
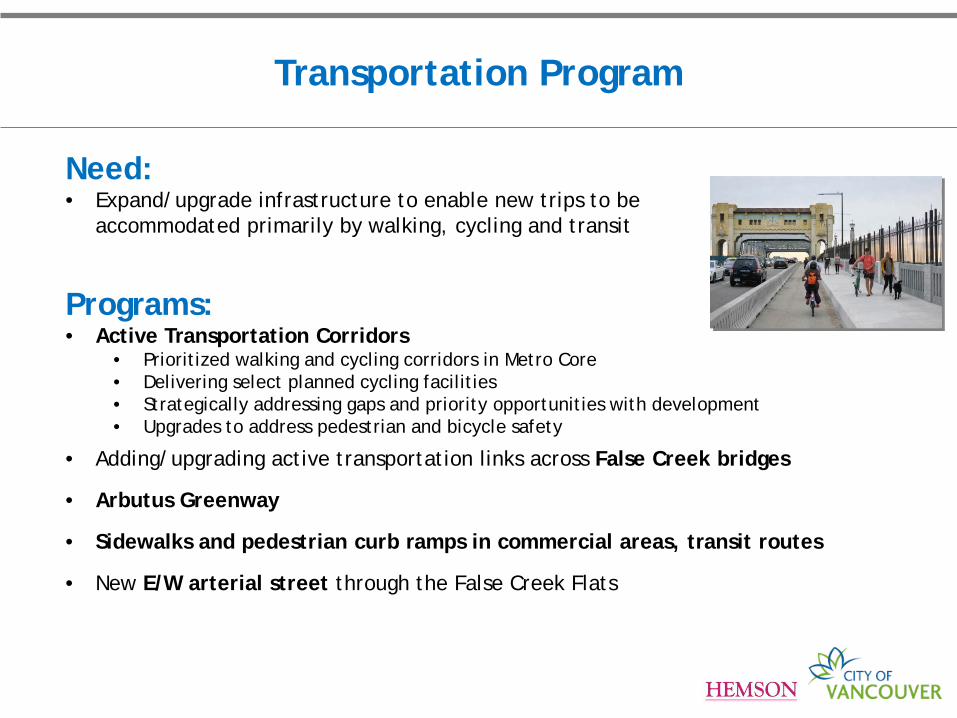
Transportation Program
Need: • Expand/upgrade infrastructure to enable new trips to be
accommodated primarily by walking, cycling and transit
Programs: • Active Transportation Corridors
• Prioritized walking and cycling corridors in Metro Core • Delivering select planned cycling facilities • Strategically addressing gaps and priority opportunities with development • Upgrades to address pedestrian and bicycle safety
• Adding/upgrading active transportation links across False Creek bridges
• Arbutus Greenway
• Sidewalks and pedestrian curb ramps in commercial areas, transit routes
• New E/W arterial street through the False Creek Flats
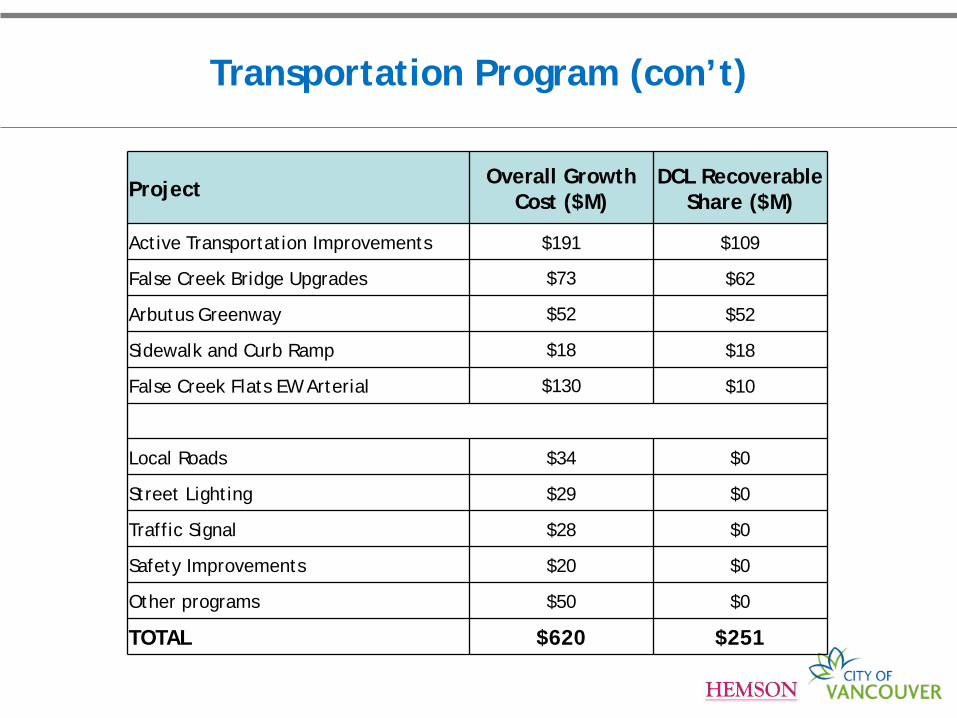
Transportation Program (con’t)
Project Overall Growth Cost ($M)
DCL Recoverable Share ($M)
Active Transportation Improvements $191 $109
False Creek Bridge Upgrades $73 $62
Arbutus Greenway $52 $52
Sidewalk and Curb Ramp $18 $18
False Creek Flats EW Arterial $130 $10
Local Roads $34 $0
Street Lighting $29 $0
Traffic Signal $28 $0
Safety Improvements $20 $0
Other programs $50 $0
TOTAL $620 $251
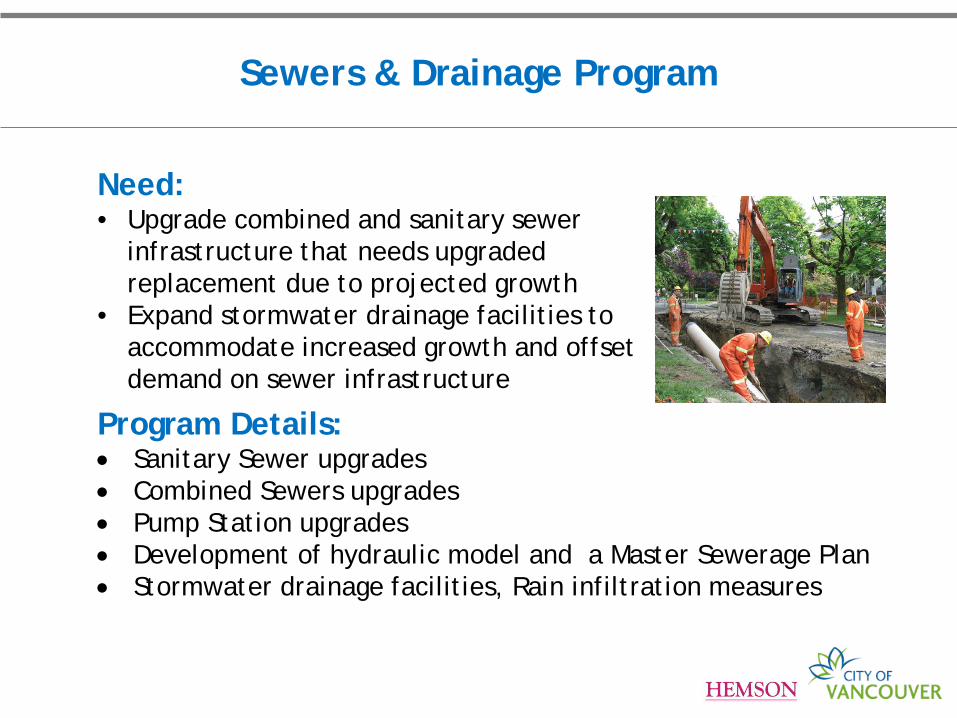
Sewers & Drainage Program
Need: • Upgrade combined and sanitary sewer
infrastructure that needs upgraded replacement due to projected growth
• Expand stormwater drainage facilities to accommodate increased growth and offset demand on sewer infrastructure
Program Details: • Sanitary Sewer upgrades • Combined Sewers upgrades • Pump Station upgrades • Development of hydraulic model and a Master Sewerage Plan • Stormwater drainage facilities, Rain infiltration measures
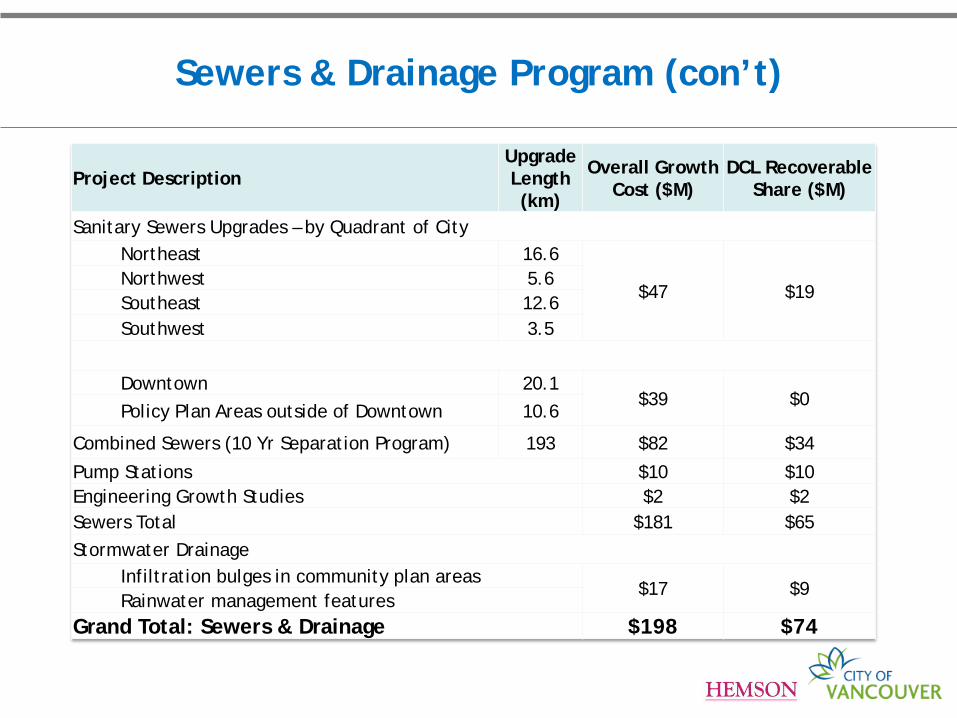
Sewers & Drainage Program (con’t)
Project Description Upgrade Length (km)
Overall Growth Cost ($M)
DCL Recoverable Share ($M)
Sanitary Sewers Upgrades – by Quadrant of City Northeast 16.6
$47 $19 Northwest 5.6 Southeast 12.6 Southwest 3.5
Downtown 20.1 $39 $0
Policy Plan Areas outside of Downtown 10.6
Combined Sewers (10 Yr Separation Program) 193 $82 $34 Pump Stations $10 $10 Engineering Growth Studies $2 $2 Sewers Total $181 $65 Stormwater Drainage
Infiltration bulges in community plan areas $17 $9
Rainwater management features Grand Total: Sewers & Drainage $198 $74
Waterworks Program
Need: • Water distribution system requires
upgrades in order to maintain adequate pressure in the City water system under increased domestic and fire flow demands due to growth
Program Details: • Water main upgrades required for fire flow demands • Alterations to pressure zone configuration to address growth
demands • Hydraulic model and analysis
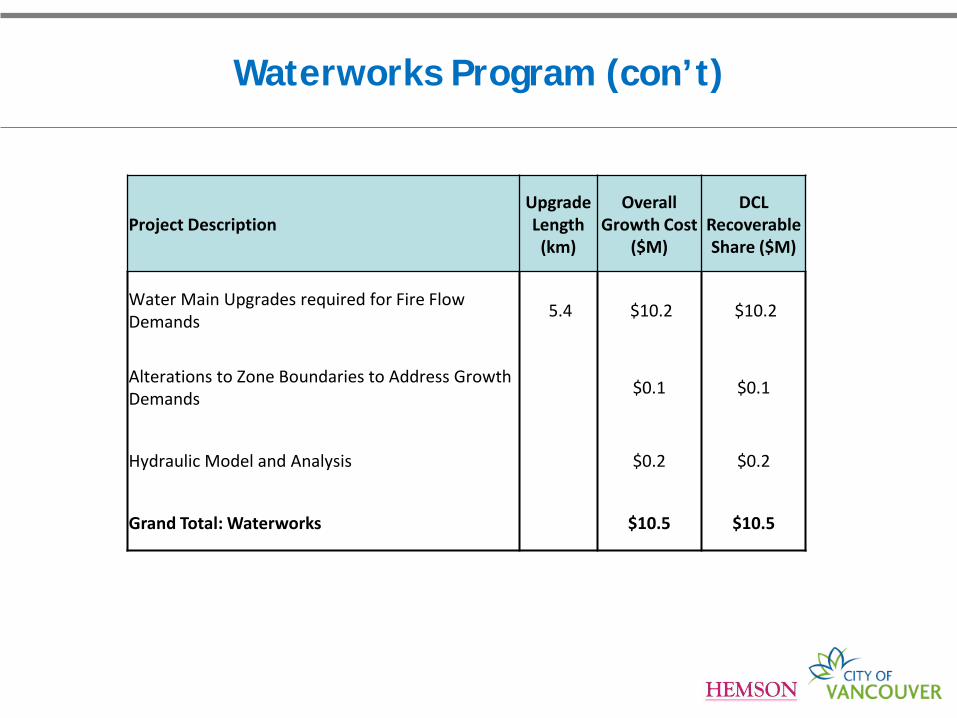
Waterworks Program (con’t)
Project Description Upgrade Length
(km)
Overall Growth Cost
($M)
DCL Recoverable Share ($M)
Water Main Upgrades required for Fire Flow Demands 5.4 $10.2 $10.2
Alterations to Zone Boundaries to Address Growth Demands $0.1 $0.1
Hydraulic Model and Analysis $0.2 $0.2
Grand Total: Waterworks $10.5 $10.5
An initial, high level document that will help inform how development-triggered infrastructure upgrades are funded.
• General Framework: Guidelines will provide overall intention, case-
specific decisions will still be made; • Clarity: The Guidelines will provide additional clarity in terms of what
works are DCL eligible, and which projects will be subject to rezoning conditions;
• Iterative: Guidelines will be updated to reflect program evolution &
implementation;
• Interim: long-term intention is to replace Guidelines with Development Standards Bylaw.
Development and Infrastructure Funding Guidelines
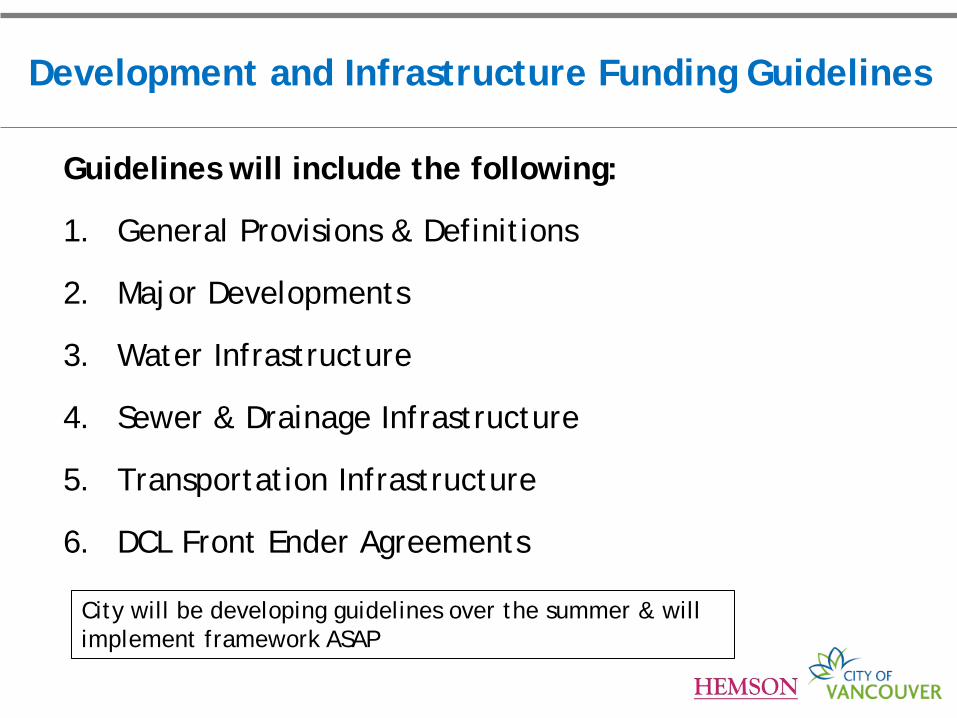
Guidelines will include the following:
1. General Provisions & Definitions
2. Major Developments
3. Water Infrastructure
4. Sewer & Drainage Infrastructure
5. Transportation Infrastructure
6. DCL Front Ender Agreements
Development and Infrastructure Funding Guidelines
City will be developing guidelines over the summer & will implement framework ASAP
Basic DCL Calculation
DCL
Recoverable Costs
Growth
DCL Rate
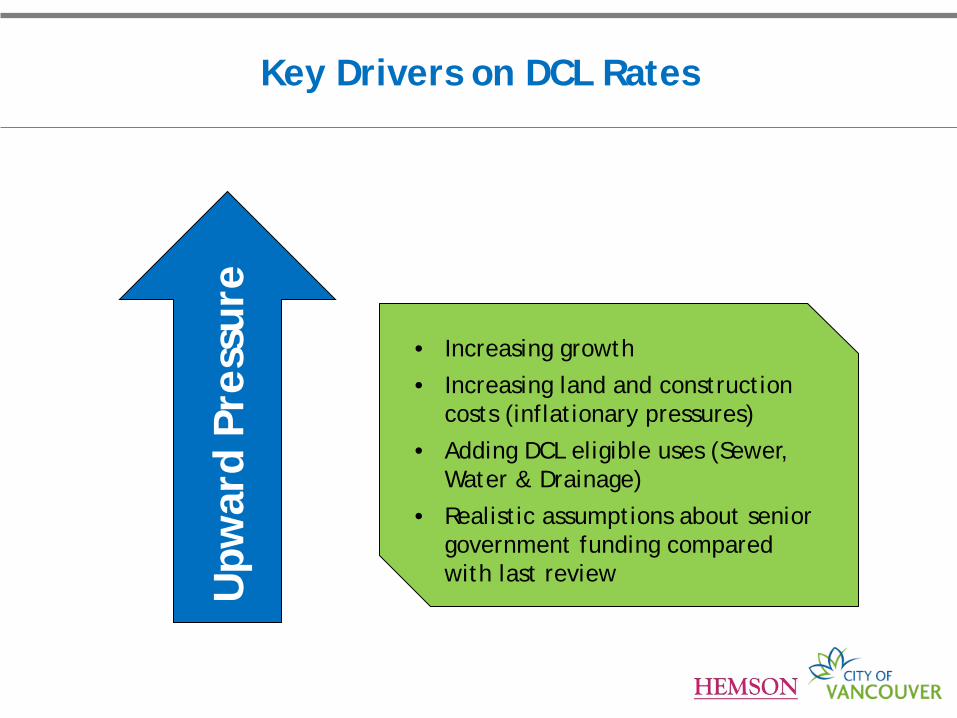
Key Drivers on DCL Rates
Upw
ard
Pres
sure
• Increasing growth
• Increasing land and construction costs (inflationary pressures)
• Adding DCL eligible uses (Sewer, Water & Drainage)
• Realistic assumptions about senior government funding compared with last review
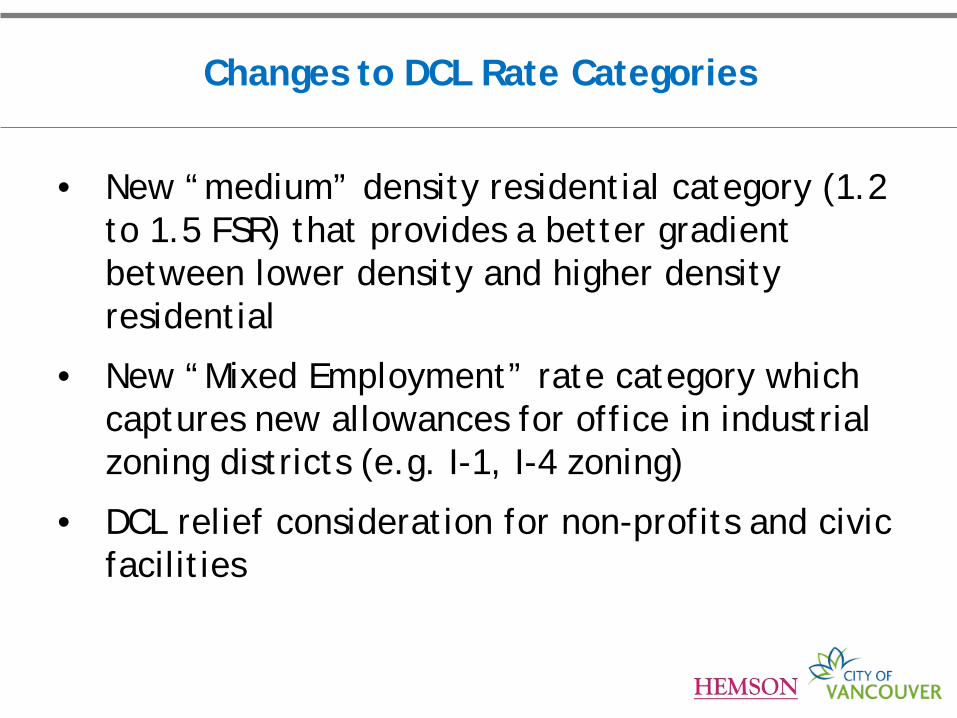
Changes to DCL Rate Categories
• New “medium” density residential category (1.2 to 1.5 FSR) that provides a better gradient between lower density and higher density residential
• New “Mixed Employment” rate category which captures new allowances for office in industrial zoning districts (e.g. I-1, I-4 zoning)
• DCL relief consideration for non-profits and civic facilities
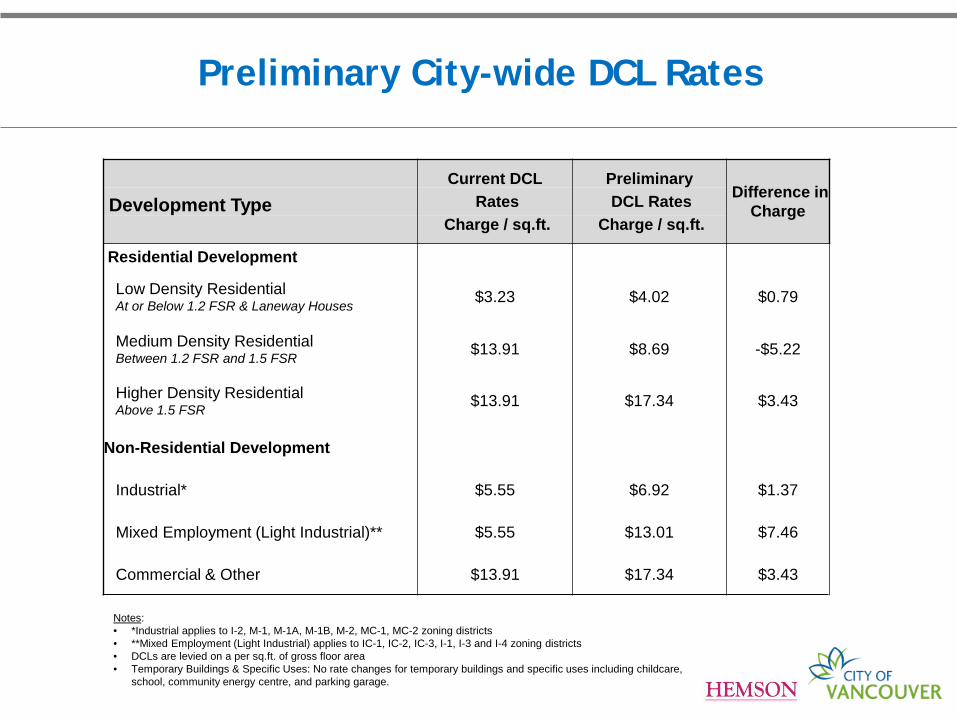
Preliminary City-wide DCL Rates
Notes: • *Industrial applies to I-2, M-1, M-1A, M-1B, M-2, MC-1, MC-2 zoning districts • **Mixed Employment (Light Industrial) applies to IC-1, IC-2, IC-3, I-1, I-3 and I-4 zoning districts • DCLs are levied on a per sq.ft. of gross floor area • Temporary Buildings & Specific Uses: No rate changes for temporary buildings and specific uses including childcare,
school, community energy centre, and parking garage.
Current DCL Preliminary Difference in
Charge Development Type Rates DCL Rates
Charge / sq.ft. Charge / sq.ft.
Residential Development
Low Density Residential At or Below 1.2 FSR & Laneway Houses $3.23 $4.02 $0.79
Medium Density Residential Between 1.2 FSR and 1.5 FSR $13.91 $8.69 -$5.22
Higher Density Residential Above 1.5 FSR $13.91 $17.34 $3.43
Non-Residential Development
Industrial* $5.55 $6.92 $1.37
Mixed Employment (Light Industrial)** $5.55 $13.01 $7.46
Commercial & Other $13.91 $17.34 $3.43
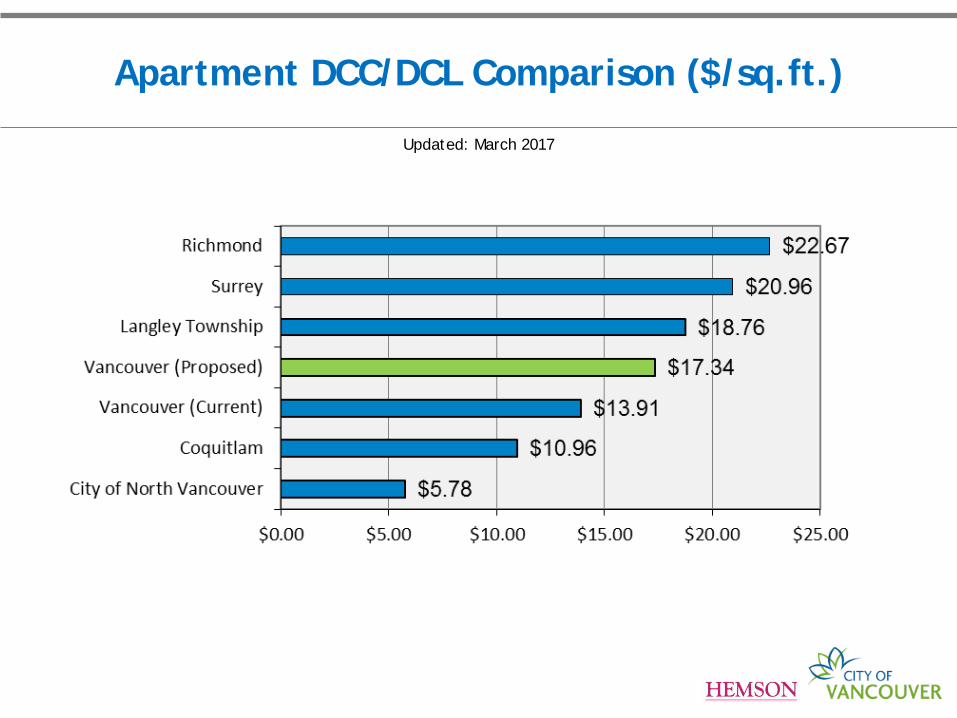
Apartment DCC/DCL Comparison ($/sq.ft.)
Updated: March 2017
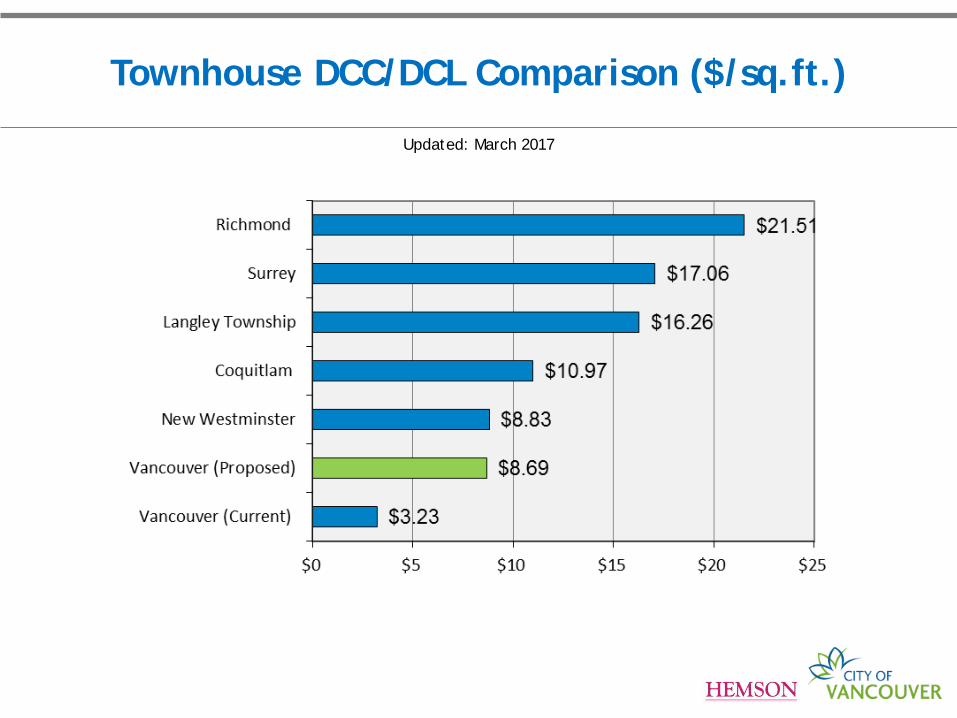
Townhouse DCC/DCL Comparison ($/sq.ft.)
Updated: March 2017
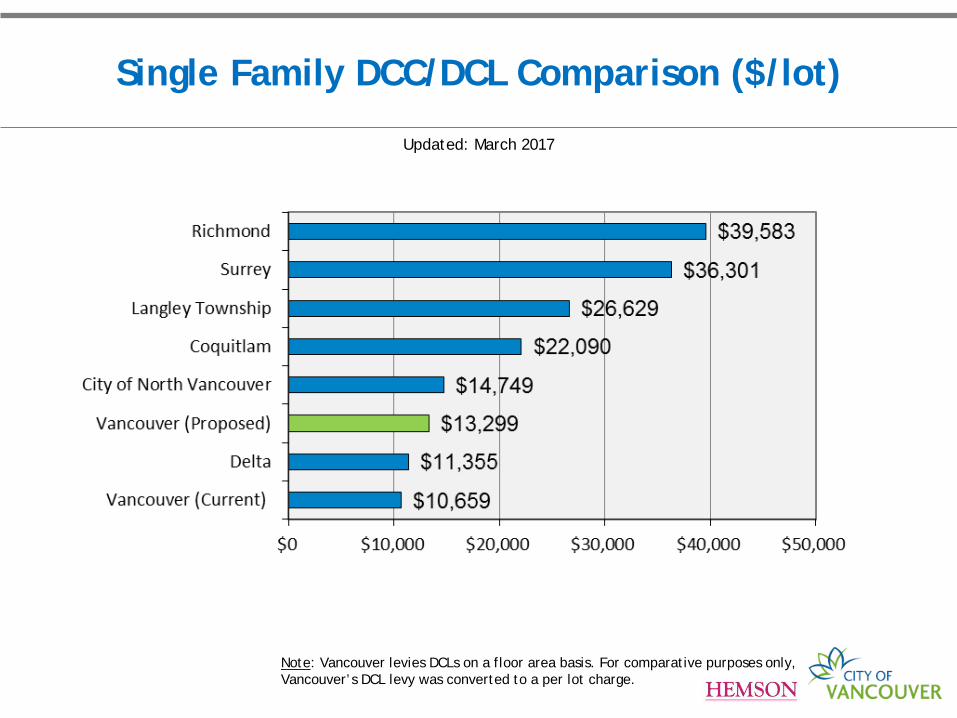
Single Family DCC/DCL Comparison ($/lot)
Updated: March 2017
Note: Vancouver levies DCLs on a floor area basis. For comparative purposes only, Vancouver’s DCL levy was converted to a per lot charge.
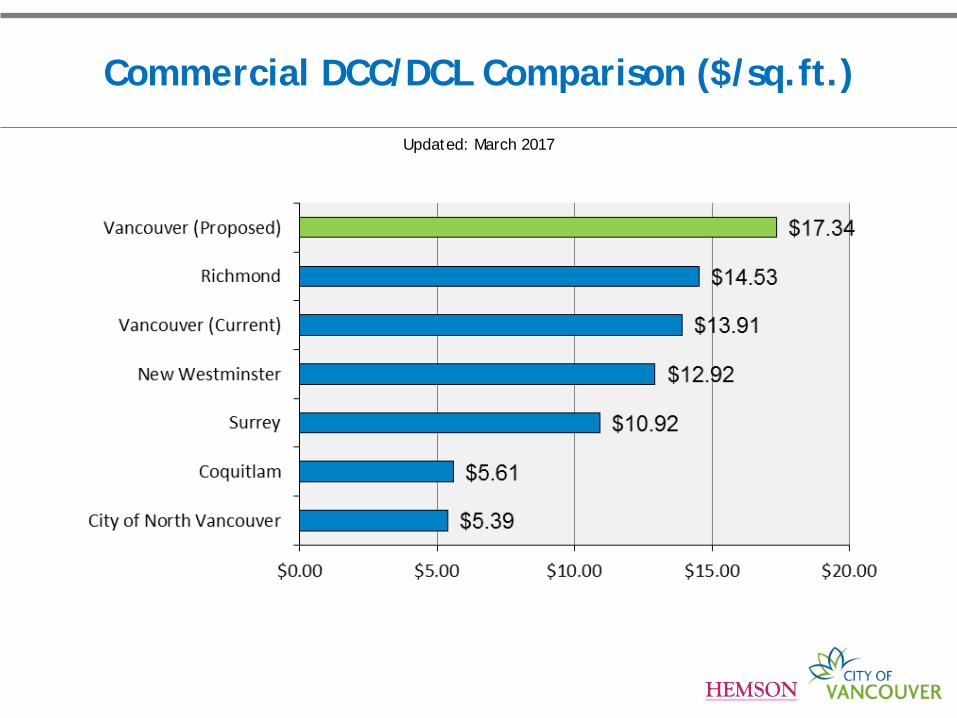
Commercial DCC/DCL Comparison ($/sq.ft.)
Updated: March 2017
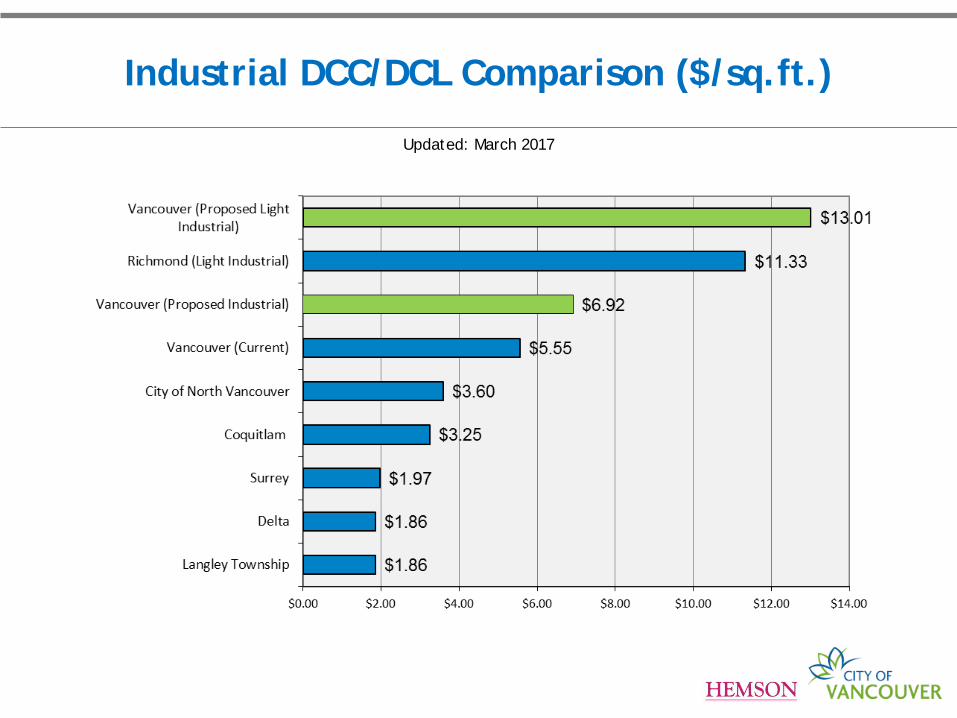
Industrial DCC/DCL Comparison ($/sq.ft.)
Updated: March 2017
DCL In-Stream Rate Protection
• New DCL rates will be effective at bylaw adoption
• However, legislation provides one year of rate protection to in-stream: • Building permit applications**
• Precursor applications** (rezoning & development permit)
• Rezoning and DP applications must result in building permit issuance within one year of bylaw adoption
**Applications must be complete and received prior to adoption of the new bylaw
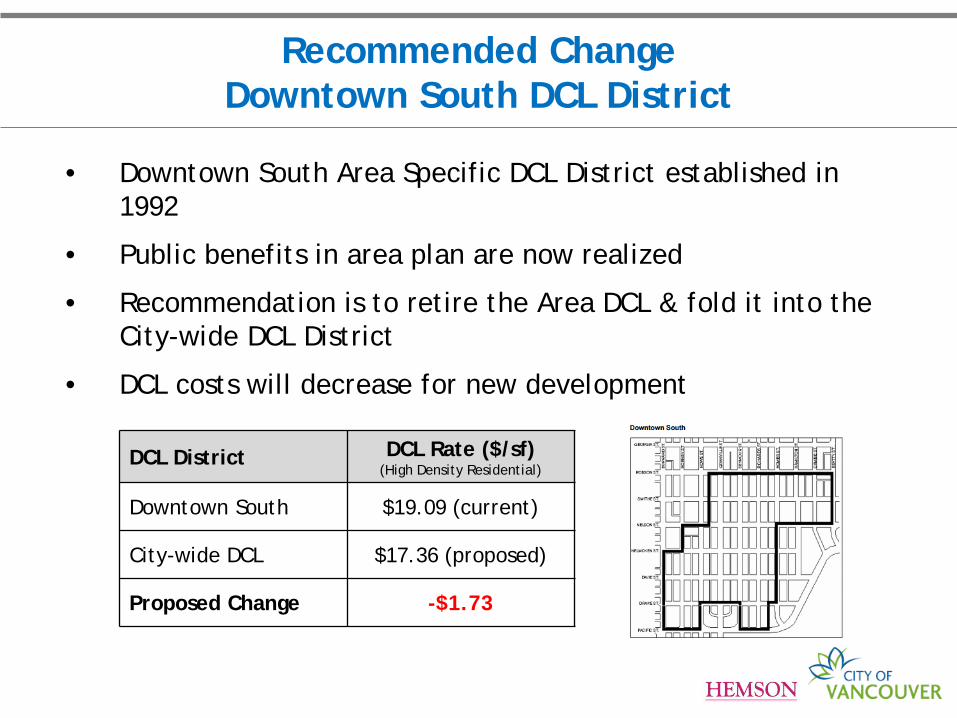
Recommended Change Downtown South DCL District
• Downtown South Area Specific DCL District established in 1992
• Public benefits in area plan are now realized
• Recommendation is to retire the Area DCL & fold it into the City-wide DCL District
• DCL costs will decrease for new development
DCL District DCL Rate ($/sf) (High Density Residential)
Downtown South $19.09 (current)
City-wide DCL $17.36 (proposed)
Proposed Change -$1.73
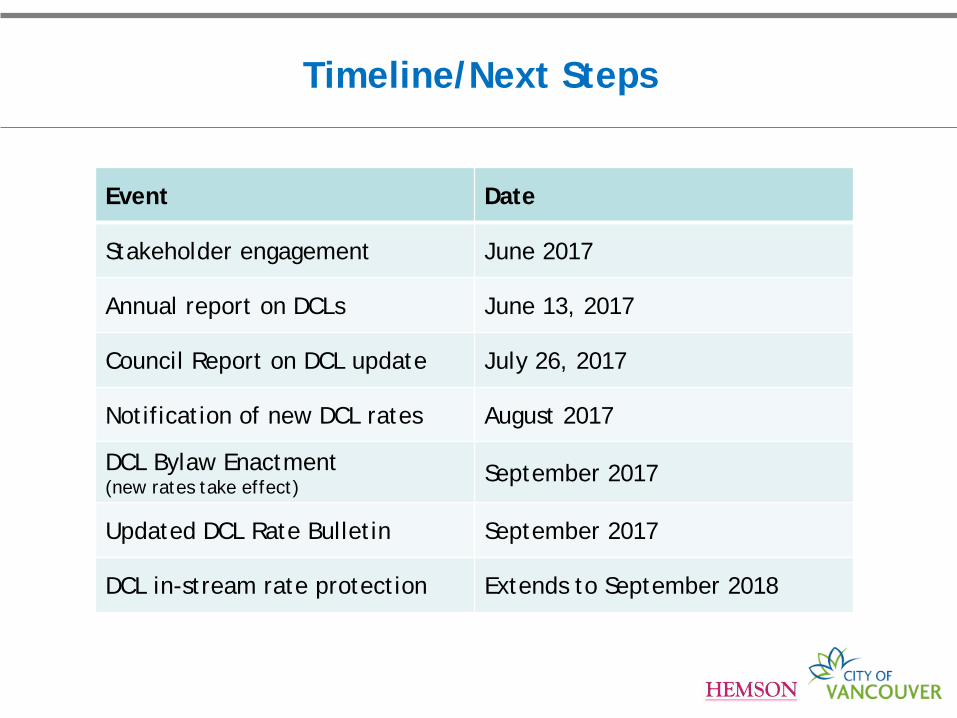
Timeline/Next Steps
Event Date
Stakeholder engagement June 2017
Annual report on DCLs June 13, 2017
Council Report on DCL update July 26, 2017
Notification of new DCL rates August 2017
DCL Bylaw Enactment (new rates take effect)
September 2017
Updated DCL Rate Bulletin September 2017
DCL in-stream rate protection Extends to September 2018