Embed Size (px)
Citation preview

City�of�San�José�
Police�and�Fire�Department�Retirement�Plan
Comprehensive�Annual�Financial�Report�for�the�Fiscal�Years�ended�June�30,�2020�and�June�30,�2019

Photo�credits
Cover�Images,�Left�to�Right:�@�Andrew�Poplavsky/123rf.com,�@�Katarzyna�Bialasiewicz/123rf.com
Title,�Left�to�Right:�#�/LJKW�HOGVWXGLRV����UI�FRP��#�:DUDZRRW�1DQWD����UI�FRP
Introductory,�Left�to�Right:�@�Tyler�Olson/123rf.com,�@�Fernando�Gregory�Milan/123rf.com
Financial,�Left�to�Right:�#�6FRWW�%HWWV����UI�FRP��#�3HHUDSRQJ�3HDWWD\DNXO����UI�FRP
Investment,�Left�to�Right:�@�Possohh/123rf.com,�@�Martin�Kollar/123rf.com
Actuarial,�Left�to�Right:�#�1H\GW����UI�FRP��#�3RWRZL]DUG����UI�FRP
Statistical,�Left�to�Right:�#�$QGUHZ�3RSODYVN\����UI�FRP��#�,ONLQ�4XOL\HY����UI�FRP

City�of�San�Jos��Police�and�Fire�Department
Retirement�Plan
Roberto�L.�Peña��&�LHI�([HFXWLYH�2IÀFHU
3HQVLRQ�7UXVW�DQG�3RVWHPSOR\PHQW�+HDOW�FDUH��7UXVW�)XQGV�RI�W�H�&LW\�RI�6DQ�-RVp��&DOLIRUQLD
�&RPSUH�HQVLYH�$QQXDO�)LQDQFLDO�5HSRUW�IRU�W�H��)LVFDO�<HDUV�HQGHG�-XQH� !��"!"!�DQG�-XQH� !��"!#$�
2I&FH�RI�5HWLUHPHQW�6HUYLFHV#' '�1RUW��)LUVW�6WUHHW��6XLWH�)!!�6DQ�-RVp��&DOLIRUQLD�$*##"�,*!*3�RQH��,!.�'$,�#!!!�)D/��,!.� $"�)' "�www.sjretirement.com

Board Chair Letter
November 5, 2020
The Honorable Mayor and City CouncilMembers of the Police and Fire Department Retirement PlanCity of San JoséSan José, California
Dear Mayor, Council Members, and Plan Members:
On behalf of the members of the Board of Administration, I am pleased to present the Police and FireDepartment Retirement Plan’s (the Plan) Comprehensive Annual Financial Report (CAFR) for the fiscalyear ended June 30, 2020.
The Pension Plan earned a time-weighted net of investment fees rate of return of 3.1% on investmentsfor the fiscal year, compared to a 2.9% return for its policy benchmark but exceeded the 1.3% return forthe Investment Metrics universe net median of public funds greater than $1 billion. The Planunderperformed the net rate of return of 6.75% assumed by the Board and Plan's actuary for the fiscalyear ended June 30, 2020. The Plan's earned a time-weighted net of investment fees rate of return of4.7% and 4.6% for the three-year and five-year periods ending June 30, 2020, respectively, while theInvestment Metrics universe net median earned a time-weighted rate of return of 5.0% and 5.4% for thesame periods.
The Healthcare Plans earned a time-weighted net of investment fees rate of return of 2.2% oninvestments for the fiscal year, compared to a 1.6% return for its policy benchmark. Additionally, theHealthcare Plans earned a time-weighted net of investment fees rate of return of 3.5% and 3.6% for thethree-year and five-year periods ending June 30, 2020, respectively.
The Plan's net position increased from $3,774,379,000 to $3,910,552,000 (see the Financial Sectionbeginning on page 14). The net increase in the Plan's net position for fiscal year 2019-2020 was$136,173,000.
The Investment Program continued to manage portfolio investments and move initiatives forward duringthe fiscal year through the leadership of our CEO and an CIO. During fiscal year 2019-20, the Boardimplemented a comprehensive investment-governance framework as well as a revised strategic assetallocation program. With the COVID-19 shock, March markets were gripped by fears that an economiccrisis would become a financial crisis. The impact on the financial markets was extreme. The spread ofthe virus has prompted additional volatility in the financial markets. As a result, on March 17, 2020, atthe special Board meeting during the height of COVID-19, the Board voted to shift its asset allocationpolicy to prepare for this unprecedented time.
1 Comprehensive Annual Financial Report 2019-2020 San José Police & Fire Retirement Plan

Board Chair Letter (continued)
The Board believes that the professional services rendered by the staff, investment consultant, actuary,and counsel have produced a sound fund capable of sustained growth over the long term. The Board ofAdministration and Retirement Services staff are available to provide additional information asrequested.
Sincerely,
Andrew Gardanier, ChairBoard of Administration
Comprehensive Annual Financial Report 2019-2020 San José Police & Fire Retirement Plan 2

Table Contents PAGE
I. INTRODUCTORY SECTION
Letter of Transmittal 5
Certificate of Achievement for Excellence in Financial Reporting 9
Certificate of Meeting Professional Standards in Public Pensions 10
Board of Administration, Administration and Outside Consultants 11
Office of Retirement Services Organizational Chart 13
II. FINANCIAL SECTION
Independent Auditor's Report 15
Management's Discussion and Analysis 18
Basic Financial StatementsStatements of Plan Net Position 29
Statements of Changes in Plan Net Position 31
Notes to the Basic Financial Statements 33
Required Supplementary Information Schedule of Changes in the Employer's Net Pension Liability and Related Ratios
- Defined Benefit Pension Plan 75
Schedule of Investment Returns - Defined Benefit Pension Plan 75
Schedule of Employer Contributions - Defined Benefit Pension Plan 76
Notes to Schedule - Defined Benefit Pension Plan 76
Schedule of Changes in the Employer's Net OPEB Liability and Related Ratios -Postemployment Healthcare Plans 78
Schedule of Investment Returns - Postemployment Healthcare Plans 78
Schedule of Employer Contributions - Postemployment Healthcare Plans 79
Notes to Schedule - Postemployment Healthcare Plans 79
Other Supplemental InformationCombining Schedule of Defined Benefit Pension Plan Net Position 80
Combining Schedule of Changes in Defined Benefit Pension Plan Net Position 81
Schedules of Administrative Expenses and Other 82
Schedules of Payments to Consultants 82
Schedules of Investment Expenses 83
III. INVESTMENT SECTION
Report of Investment Activity 85
Statement of Investment Policy 94
Investment Professionals 123
Schedule of Investment Results 124
Investment ReviewTarget Asset Allocation / Actual Asset Allocation - Defined Benefit Pension Plan 126
Historical Asset Allocation (Actual) / Fair Value Growth of Plan Assets- Defined Benefit Pension Plan 127
History of Gross and Net Performance - Defined Benefit Pension Plan 128
Target Asset Allocation / Actual Asset Allocation - Postemployment Healthcare Plans 129
3 Comprehensive Annual Financial Report 2019-2020 San José Police & Fire Retirement Plan

Table Contents (continued) PAGE
Historical Asset Allocation (Actual) / Fair Value Growth of Plan Assets- Postemployment Healthcare Plans 130
History of Gross and Net Performance - Postemployment Healthcare Plans 131
List of Largest Assets Held 132
Schedule of Investment Fees 133
Schedule of Commissions 134
Investment Summary 138
IV. ACTUARIAL SECTION
Defined Benefit Pension PlanActuary's Certification Letter 139
Actuarial Assumptions and Methods 142
Schedule of Active Member Data 145
Schedule of Retirees and Beneficiaries Added to and Removed from Rolls 145
Analysis of Financial Experience 146
Schedule of Funded Liabilities by Type 146
Schedule of Funding Progress 147
Summary of Pension Plan Provisions 148
Postemployment Healthcare Plans - Police and FireActuary's Certification Letter - Police / Fire 153 / 169
Actuarial Assumptions and Methods - Police / Fire 156 / 172
Schedule of Active Member Data - Police / Fire 162 / 178
Schedule of Retirees and Beneficiaries Added to and RemovedFrom Rolls - Police / Fire 163 / 179
Member Benefit Coverage information - Police / Fire 163 / 180
Analysis of Financial Experience - Police / Fire 164 / 180
Schedule of Funding Progress - Police / Fire 164 / 181
Summary of Key Substantive Plan Provisions - Police / Fire 165 / 182
V. STATISTICAL SECTION
Statistical ReviewChanges in Plan Net Position - Defined Benefit Pension Plan 187
Changes in Plan Net Position - Postemployment Healthcare Plans 188
Benefit and Refund Deductions from Plan Net Position by Type -Defined Benefit Pension Plan 189
Benefit and Refund Deductions from Plan Net Position by Type -
Postemployment Healthcare Plans 190
Employer and Employee Contribution Rates 191
Retired Members by Type of Benefit 192
Average Benefit Payment Amounts 194
Retirements During Fiscal YearRetirements 198
Deaths During Fiscal YearDeaths 199
Comprehensive Annual Financial Report 2019-2020 San José Police & Fire Retirement Plan 4

This page intentionally left blank

City�of�San�José�Police�and�Fire�Department�Retirement�Plan
Comprehensive�Annual�Financial�Report�for�the�Fiscal�Years�ended�June�30,�2020�and�June�30,�2019
Pension�Trust�and�Postemployment�Healthcare�Trust��
Funds�of�the�City�of�San�José,�California
Introductory�Section

Letter of Transmittal
November 5, 2020
Board of Administration San José Police and Fire Department Retirement Plan1737 North First Street, Suite 600San José, CA 95112
Dear Trustees:
I am pleased to present the Comprehensive Annual Financial Report (CAFR) of the San José Policeand Fire Department Retirement Plan (Plan) for the fiscal year ended June 30, 2020. Responsibility forboth the accuracy of the data and the completeness and fairness of the presentation, including alldisclosures, rests with the Plan’s management.
This CAFR was prepared to conform to the principles of governmental accounting and reporting setforth by the Governmental Accounting Standards Board (GASB) and the reporting requirementsprescribed by the Government Finance Officers' Association of the United States and Canada (GFOA).Transactions of the Plan are reported on an accrual basis of accounting. For an overview and analysisof the financial activities of the Plan for the fiscal years ended June 30, 2020 and 2019, please refer tothe Management’s Discussion and Analysis (MD&A) on page 18.
Grant Thornton LLP, the Plan’s independent auditor, has audited the accompanying financialstatements. Because the cost of a control should not exceed the benefits to be derived, managementbelieves internal control is adequate and the accompanying statements, schedules, and tables arefairly presented and free from material misstatement. Sufficient internal controls over financial reportingexist to provide reasonable assurance regarding the safekeeping of assets and fair presentation of thefinancial statements and supporting schedules.
The financial audit provides reasonable assurance that the Plan’s financial statements are presented inconformity with generally accepted accounting principles and are free of material misstatement. ThePlan recognizes that even sound and well-designed internal controls have their inherent limitations inthat errors may still occur as a result of factors such as carelessness, faulty judgment, communicationbreakdowns, and/or that internal controls can be circumvented by internal or external collusion. ThePlan continuously reviews internal controls to ensure that the Plan’s operating policies and proceduresare being adhered to and that the controls are adequate to ensure accurate and reliable financialreporting and to safeguard the Plan’s assets.
I am proud to report that the GFOA awarded its Certificate of Achievement for Excellence in FinancialReporting to the Plan for its CAFR for the fiscal year ended June 30, 2019. This was the 20thconsecutive year that the Plan has achieved this prestigious award. In order to be awarded aCertificate of Achievement, the Plan must publish an easily readable and efficiently organizedcomprehensive annual financial report. This report must satisfy both generally accepted accountingprinciples and applicable legal requirements.
A Certificate of Achievement is valid for a period of one year only. We believe that our current CAFRcontinues to meet the Certificate of Achievement Program's requirements and we are submitting it toGFOA to determine its eligibility for another certificate.
The Plan also received the Public Pension Standards Award in recognition of meeting professionalstandards for plan design and administration by the Public Pension Coordinating Council.
5 Comprehensive Annual Financial Report 2019-2020 San José Police & Fire Retirement Plan

Letter of Transmittal (continued)
I encourage you to review this report carefully. I trust that you and the members of the Plan will find thisCAFR helpful in understanding the Plan.
Funding
The Plan’s funding objective for both its defined benefit pension plan and its defined benefit other post-employment benefits (OPEB) healthcare plan is to meet long-term benefit obligations throughcontributions and investment income. As of the most recent actuarial valuation dated June 30, 2019, thefunding ratio of the defined benefit pension plan and the defined benefit Police and Fire OPEB planswere 74.3%, 28.7% and 23.6%, respectively, based on the actuarial value of assets.
For the valuation of pension and OPEB benefits, the actuarial assumption for the net rate of return to beearned by the Pension and OPEB Plans is currently 6.75% and 6.50%, respectively. The impact of thedifference between the actual net rate of return earned by the Plan and the assumption rate will result inan investment gain or loss that will be reflected in the pension and OPEB unfunded liabilities in nextyear’s CAFR, respectively. The net increase in Plan net position for fiscal year 2019-2020 was$136,173,000. Details of the components of this increase are included in the Statement of Changes inPlan Net Position on page 31. The defined benefit pension plan's funding progress is presented on page147 and the defined benefit OPEB plan’s funding progress is presented on pages 164 for Police and181 for Fire.
Investment Summary
The Board of Administration has exclusive control of all investments of the Plan and is responsible forthe establishment of investment objectives, strategies, and policies. Members of the Board serve in afiduciary capacity and must discharge their duties with respect to the Plan and the investment portfoliosolely in the interest of, and for the exclusive purposes of providing benefits to, members of the Plan anddefraying the reasonable cost of administration.
The pandemic had a profound negative effect on financial markets across the world in first quarter of2020, exacerbated by a swiftness in decline that took everyone by surprise. It took only twelve days toenter bear market territory (defined as a 20% decline in equity markets) which was the steepest declineever recorded. After reaching a high of 3,393 on February 19, 2020, the S&P500 reached a low of2,191 on March 23, 2020, registering a fall of 35%. During that time, both developed markets andemerging markets equity indices registered similar or greater declines, as did the Russell 2000, theindex of small capitalization US stocks.
The Police & Fire Plan investment committees met multiple times in March and also held a special boardmeeting on March 18, 2020 to consider the economic ramifications of the COVID-19 pandemic as wellas its effect on the portfolio. During those deliberations, trustees paid close attention to the effect of themeltdown on plan portfolio, potential impact on the sponsor, the effects of monetary and fiscal stimulus,as well as opportunities to position the portfolio for long-term success. Following these deliberations,with input from the boards’ investment consultants as well as the investment team, the Board decided toincrease the level of growth assets in the portfolio, balancing increased return expectations goingforward with the risk tolerance of the City and instructed the investment team to implement the revisedstrategic asset allocation as efficiently and expeditiously as possible.
The Board had followed a deliberate policy of designing defensive portfolios, taking into account both thematurity of the plans as well as the high valuations in growth-oriented assets. The portfolio constructionis built around the concept of resilient growth – maintaining an immunized cash flow portfolio to meetnear-term pension payments, investing in low beta strategies that offer diversification and downsideprotection, and a growth portfolio that produces sufficient risk-adjusted returns to meet the fundingneeds. This defensive stance greatly helped minimize losses during the first quarter of 2020. While thePolice & Fire Plan lost 10.5% for the quarter, the performance ranked in the 20th percentile of its peers. In comparison, the MSCI ACWI (All Country World Index), an index of global stocks, had lost 22.4% forthe quarter.
Comprehensive Annual Financial Report 2019-2020 San José Police & Fire Retirement Plan 6

Letter of Transmittal (continued)
While the Board decided to increase growth assets at the end of the first quarter of 2020 taking intoaccount the increased return expectations of growth assets over the long term, the coincident marketrally following unprecedented monetary and fiscal stimulus once again immensely benefitted theperformance of the Plan. The Police & Fire Plan returned 9.6% for the second quarter of 2020, boostingFY 2019-20 returns to 3.1% (17th percentile). For calendar year to date through June 30th, 2020, thePlan finished in the 12th percentile of their public pension plan peers. In July 2020, the Plan continuedthe strong run, returning +3.91%.
Over the past fiscal year, the Plan Pension Plan’s time-weighted net of investment fees rate of returnwas 3.1% for the fiscal year, compared to a 2.9% return for its policy benchmark and a 1.3% return forthe Investment Metrics universe net median of public funds greater than $1 billion. Additionally, the PlanPension Plan earned a time-weighted net of investment fees rate of return of 4.7% and 4.6% for thethree-year and five-year periods ending June 30, 2020, respectively, while the Investment Metricsuniverse net median earned a time-weighted rate of return of 5.0% and 5.4% for the same periods.
The Healthcare Plans' time-weighted net of investment fees rate of return was 2.2% on investments forthe fiscal year, compared to a 1.6% return for its policy benchmark. In addition, the Healthcare Plansearned a time-weighted net of investment fees rate of return of 3.5% and 3.6% for the three-year andfive-year periods ending June 30, 2020, respectively.
The net position of the Plan increased from $3,774,379,000 to $3,910,552,000 (see the FinancialSection beginning on page 14).
Major Initiatives
The Investment Program continued to manage portfolio investments and move initiatives forward duringthe fiscal year. The continuity of the Investment Program is a testament to the human capital andinfrastructure that are in place. The investment team filled open positions, worked on an investmentgovernance framework, and worked with our general consultant Meketa in implementing a revisedstrategic asset allocation.
In November 2016, a charter amendment to alter the pension system for public employees, known asMeasure F, was approved, and on March 31, 2017, the ordinance implementing the Framework andMeasure F became effective for employees in the Plan. The provisions of the Framework include, butare not limited to, revising Tier 2 benefit, allowing rehired Tier 1 employees to remain in Tier 1, creatinga Voluntary Employee Beneficiary Association (VEBA) for retiree healthcare and an irrevocable opt-outof the defined benefit retiree healthcare plan for eligible employees, defining the qualifications formembers of the independent medical panel, and creating a Guaranteed Purchasing Power (GPP)benefit for Tier 1 retirees. The VEBA is being administered by the City, not ORS, and therefore it is alsonot under the jurisdiction of the Retirement Board.
The Office of Retirement Services (ORS) implemented a new pension administration system that wentlive in February 2019; the implementation of the system started in March 2015. The implementationprocess spanned approximately 44 months and cost approximately $9 million, which was allocated toboth the Police and Fire Plan and Federated System. The project completion was extended to the fallof 2019 to allow for the implementation of Measure F-related calculations in the system. One ofRetirement Service's main goals has been to increase customer service through the new pensionadministration system. The Member Direct Portal from this upgrade was rolled out and was available toour members starting on July 27, 2020.
During fiscal year 2019-2020, the Board approved a Strategic Communications Plan that encompassessocial media and other communication needs of ORS. During this same period, the first and secondquarterly newsletters, The Retirement Connection, was mailed out to the membership.
7 Comprehensive Annual Financial Report 2019-2020 San José Police & Fire Retirement Plan

Letter of Transmittal (continued)
In October 2017, the City Auditor issued report 17-06, Audit of Retirement Services: GreaterTransparency Needed in the Budgeting Process, Interactions Among Stakeholders, Investment Policies,and Plan Administration. The report was published with five separate findings which are covered in 25different recommendations and five of the 25 recommendations are addressed to the City. ORS hasaddressed and completed all but 3 of the recommendations over which they have control, includingpreparing a comprehensive annual budget report through the Manager's Budget Addendum Process(MBA) for the City Council. The other 3 recommendations have been partly implemented with a goal ofcompletion by June 2021.
Effective January 1, 2020, seven new health plan offerings were implemented. Implementation planinvolved establishing contractual obligations, payment methods, customer service protocols, membercommunication, transfer of all prescriptions and provider referrals and generations of medical insurancecards for members. Two health insurance providers, BlueShield of California and Sutter Health Plus,were replaced with a single provider, Anthem Blue Cross. Retirees that were enrolled in the BlueShieldMedicare supplement plans were transferred to the Anthem Medicare PPO plan. In addition, the annualfull-time student verification audit was conducted.
As a response to the COVID-19 pandemic, similar to many businesses and operations, a remoteworkforce was moblized in March 2020. Retirement Services continued to meet its core duties andoperations while working remotely, ensuring that day-to-day operations; such as processing pensionpayments, accepting members' retirement applications, and providing quality customer servicecontinued. In addition, regular and special Board and Committee meetings continued to be held virtually.
Conclusion
I would like to take this opportunity to thank the members of the Plan for their confidence in the Planmanagement during the past year. I also want to express my gratitude to the Board of Administration forits dedicated effort in supporting the staff through this past year. Finally, I would like to thank the Citystaff for their support and the consultants and ORS staff for their dedication, commitment to the Planand for their diligent work to assure the Plan’s continued successful operation.
Respectfully Submitted,
Roberto L. PeñaChief Executive OfficerOffice of Retirement Services
Comprehensive Annual Financial Report 2019-2020 San José Police & Fire Retirement Plan 8

Certificate of Achievement for Excellence in Financial Reporting
G!vernment Finance Officers �ss!ciati!n
Certificate !f
�chievement
f!r Excellence
in Financial
Rep!rting
Presented t!
S!n Josp 3ROLFH�DQG�)LUH�'HSDUWPHQW�
5HWLUHPHQW�3ODQ��C!liforni!
F!r its C!mprehensive �nnual
Financial Rep!rt
F!r the Fiscal Year Ended
June 30, 2019
Executive Direct!r/CEO
9 Comprehensive Annual Financial Report 2019-2020 San José Police & Fire Retirement Plan

Certificate of Meeting Professional Standards in Public Pensions
Public Pension Coordinating Council
Public Pension Standards Award
For Funding and Administration
2019
Presented to
City of San José Police and Fire Department
Retirement Plan
In recognition of meeting professional standards for
plan funding and administration as
set forth in the Public Pension Standards.
Presented by the Public Pension Coordinating Council, a confederation of
National Association of State Retirement Administrators (NASRA)
National Conference on Public Employee Retirement Systems (NCPERS)
National Council on Teacher Retirement (NCTR)
Alan H. Winkle
Program Administrator
P CP C
Comprehensive Annual Financial Report 2019-2020 San José Police & Fire Retirement Plan 10

Board of Administration, Administration, and Outside Consultants
BOARD OF ADMINISTRATION
The Retirement System is administered by a nine-member Board of Administration composed of two City employees elected by members
of the Plan, two Retired Plan members elected by the Retiree Associations, four public members, who are not connected with the City and
have significant banking or investment experience, and another public member selected by the nine Board members and approved by the
City Council. The Board is appointed by the City Council and serves in accordance with Section 2.08, Part 12 of the San José Municipal
Code.
As of June 30, 2020, the members of the Board were as follows:
ANDREW GARDANIER,CHAIREmployee representative for the Fire Department appointed to the Board in December 2015. His term ends November 2023.
ANDREW LANZA,VICE CHAIRPublic member appointed to the Board in April 2011. His current term expires April 30, 2023.
VINCENT SUNZERI, TRUSTEEPublic member appointed to the Board in December 2010. His current term expires November 30, 2020.
NICK MUYO, TRUSTEERetired Plan member appointed to the Board in November 2012. His current term expires November 30,2020.
FRANCO VADO, TRUSTEEEmployee representative for the Police Department appointed to the Board in February 2016. His term expires November 30, 2021
RICHARD SANTOS, TRUSTEERetired Plan member appointed to the Board in March 2011. His current term expires November 30, 2022.
ESWAR MENON, TRUSTEEPublic member appointed to the Board in November 2018. His current term expires November 30, 2022.
HOWARD LEE, TRUSTEEPublic member appointed to the Board February 2020. His current term expires November 2022.
VACANT, TRUSTEE PAM FOLEY, CITY COUNCIL LIAISON TO THE BOARDNon-voting member appointed to the Board January 2019.
OFFICE OF RETIREMENT SERVICES ADMINISTRATION
ROBERTO L. PEÑA,DIRECTORCHIEF EXECUTIVE OFFICER
BARBARA HAYMAN,DEPUTY DIRECTOR CHIEF OPERATIONS OFFICER
PRABHU PALANI,CHIEF INVESTMENT OFFICER
STANDING PUBLIC MEETINGS
Board Meetings: First Thursday of the Month, 8:30 AM
$JHQGDV�IRU�DOO�SXEOLF�PHHWLQJV�DUH�SRVWHG�RQ�WKH�EXOOHWLQ�ERDUG�DW�&LW\�+DOO�DQG�RQ�WKH�GHSDUWPHQW¶V�ZHEVLWH�DW�
http://sjretirement.com/PF/meetings/agendas.asp or they can be obtained from the Retirement Office at 1737 North First Street, Suite 600,
San José, CA 95112. Meeting times and locations are subject to change; please call our office at (408) 794-1000 for current information.
11 Comprehensive Annual Financial Report 2019-2020 San José Police & Fire Retirement Plan

Board of Administration, Administration, and Outside Consultants (continued)
OUTSIDE CONSULTANTS
ACTUARY
Cheiron, Inc.
Encinitas, CA
AUDITOR
Grant Thornton LLP
San Francisco, CA
DOMESTIC RELATIONS ORDER AND DISABILITY COUNSEL
Saltzman & Johnson Law Corporation
Alameda, CA
GENERAL & FIDUCIARY COUNSEL
Reed Smith LLP
San Francisco, CA
INVESTMENT COUNSEL
Hanson Bridgett LLP Reed Smith LLP
San Francisco, CA San Francisco, CA
INVESTMENT CONSULTANTS
Albourne America LLC ± Absolute Return
San Francisco, CA
Meketa Investment Group, Inc ± General Consultant
Carlsbad, CA
Verus Advisory Inc. ± Risk Advisory
Seattle, WA
TAX COUNSEL
Ice Miller LLP
Indianapolis, IN
A list of investment professionals who provide services to the Pension and Postemployment Healthcare benefits can be found on page
123 of the Investment Section of this report. The Schedule of Investment Fees and Schedule of Commissions can be found on pages 133
and 134, respectively.
Comprehensive Annual Financial Report 2019-2020 San José Police & Fire Retirement Plan 12

2020 Office of Retirement Services Organizational Chart
Office of Retirement Services1737 North First Street Suite 600, San Josp, CA 95112�
(408)�794-1000 (800) 732-6477 (408) 392-6732 Fax
www.sjretirement.com
City Council
Board�of Administration for the 3ROLFH�DQG�)LUH�'HSDUWPHQW�
5HWLUHPHQW�3ODQ
Chief Executive Officer
Chief Investment Officer
Executive Assistant Senior Auditor
Chief Operating Officer
Staff Specialist Staff Specialist
Senior Retirement Investment
Retirement Investment
Officer
Retirement Investment
Officer
Retirement Investment
Officer
Investment Analyst
Investment Analyst
Ret Inv Operations Supervisor
Financial Analyst
Operations
Staff Specialist
Senior Health Analyst
Analyst -Health
Benefits
Staff Specialist
Benefits Analyst
Staff Specialist
Office Specialist
Receptionist
Senior Analyst Benefits
Supervisor
BenefitsAnalyst
BenefitsAnalyst
BenefitsAnalyst
BenefitsAnalyst
AccountingDivison
Manager
SeniorAccountant
SeniorAccountant
Accountant I
AccountingTechnician
Account Clerk
Staff Specialist (PT-75%)
Staff Specialist
Department Information
Technology Manager
Information Systems Analyst
NetworkTechnician III
13 Comprehensive Annual Financial Report 2019-2020 San José Police & Fire Retirement Plan

City�of�San�José�Police�and�Fire�Department�Retirement�Plan
Comprehensive�Annual�Financial�Report�for�the�Fiscal�Years�ended�June�30,�2020�and�June�30,�2019
Pension�Trust�and�Postemployment�Healthcare�Trust��
Funds�of�the�City�of�San�José,�California
Financial�Section

Independent Auditor's Report
GT.COM� Grant Thornton LLP is the U.S. member firm of Grant Thornton International Ltd (GTIL). GTIL and each of its member firms
are separate legal entities and are not a worldwide partnership.
Board of Administration of the City of San José
Police and Fire Department Retirement Plan
San José, California
Report on the financial statements
We have audited the accompanying financial statements of City of San José Police and
Fire Department Retirement Plan (the +Plan,), a pension trust fund and
postemployment healthcare trust fund of the City of San José, California, as of and for
the years ended June 30, 2020 and 2019, which comprise the statements of plan net
position, statements of changes in plan net position and the related notes to the basic
financial statements, which collectively comprise the Plan2s basic financial statements
as listed in the table of contents.
Management�s responsibility for the financial statements Management is responsible for the preparation and fair presentation of these financial
statements in accordance with accounting principles generally accepted in the United
States of America; this includes the design, implementation, and maintenance of
internal control relevant to the preparation and fair presentation of financial statements
that are free from material misstatement, whether due to fraud or error.
Auditor�s responsibility Our responsibility is to express opinion on these financial statements based on our
audits. We conducted our audits in accordance with auditing standards generally
accepted in the United States of America and the standards applicable to financial
audits contained in Government Auditing Standards issued by the Comptroller General
of the United States. Those standards require that we plan and perform the audits to
obtain reasonable assurance about whether the financial statements are free from
material misstatement.
An audit involves performing procedures to obtain audit evidence about the amounts
and disclosures in the financial statements. The procedures selected depend on the
auditor2s judgment, including the assessment of the risks of material misstatement of
the financial statements, whether due to fraud or error. In making those risk
assessments, the auditor considers internal control relevant to the Plan2s preparation
and fair presentation of the financial statements in order to design audit procedures that
are appropriate in the circumstances, but not for the purpose of expressing an opinion
on the effectiveness of the Plan2s internal control. Accordingly, we express no such
opinion. An audit also includes evaluating the appropriateness of accounting policies
used and the reasonableness of significant accounting estimates made by
management, as well as evaluating the overall presentation of the financial statements.
We believe that the audit evidence we have obtained is sufficient and appropriate to
provide a basis for our audit opinion.
REPORT OF INDEPENDENT CERTIFIED PUBLIC ACCOUNTANTS GRANT�THORNTON�LLP
101 California Street, Suite 2700
San Francisco, CA 94111
D +1 415 986 3900
F +1 415 986 3916
15 Comprehensive Annual Financial Report 2019-2020 San José Police & Fire Retirement Plan

Independent Auditor's Report (continued)
Opinion In our opinion, the financial statements referred to above present fairly, in all material
respects, the plan net position of the Plan as of June 30, 2020 and 2019, and the
changes in plan net position for the year then ended in accordance with accounting
principles generally accepted in the United States of America.
Other matters
Required supplementary information
Accounting principles generally accepted in the United States of America require that
the management%s discussion and analysis, the schedule of changes in the employer%s
net pension liability and related ratios & defined benefit pension plan, schedule of
investment returns & defined benefit pension plan, schedule of employer contributions
& defined benefit pension plan, notes to schedule & defined benefit pension plan,
schedule of changes in the employer%s net OPEB liability and related ratios &
postemployment healthcare plans, schedule of investment returns & postemployment
healthcare plans, schedule of employer contributions & postemployment healthcare
plans and notes to schedule & postemployment healthcare plans, be presented to
supplement the basic financial statements. Such information, although not a required
part of the basic financial statements, is required by the Governmental Accounting
Standards Board who considers it to be an essential part of financial reporting for
placing the basic financial statements in an appropriate operational, economic, or
historical context. This required supplementary information is the responsibility of
management. We have applied certain limited procedures to the required
supplementary information in accordance with auditing standards generally accepted
in the United States of America. These limited procedures consisted of inquiries of
management about the methods of preparing the information and comparing the
information for consistency with management%s responses to our inquiries, the basic
financial statements, and other knowledge we obtained during our audit of the basic
financial statements. We do not express an opinion or provide any assurance on the
information because the limited procedures do not provide us with sufficient evidence
to express an opinion or provide any assurance.
Other supplementary information
Our audit was conducted for the purpose of forming opinion on the financial statements
that collectively comprise the Plan%s basic financial statements. The combining
schedule of defined benefit pension plan net position as of June 30, 2020, combining
schedule of changes in defined benefit pension plan net position for the year ended
June 30, 2020, schedules of administrative expenses and other, schedules of payments
to consultants, and schedules of investment expenses for the years ended June 30,
2020 and 2019 are presented for purposes of additional analysis and are not a required
part of the basic financial statements. Such supplementary information is the
responsibility of management and was derived from and relates directly to the
underlying accounting and other records used to prepare the basic financial statements.
The information has been subjected to the auditing procedures applied in the audit of
the basic financial statements and certain additional procedures. These additional
procedures included comparing and reconciling the information directly to the
underlying accounting and other records used to prepare the basic financial statements
or to the basic financial statements themselves, and other additional procedures in
accordance with auditing standards generally accepted in the United States of America.
Comprehensive Annual Financial Report 2019-2020 San José Police & Fire Retirement Plan 16

Independent Auditor's Report (continued)
In our opinion, the supplementary information is fairly stated, in all material respects, in
relation to the basic financial statements as a whole.
Other information
The introductory, investment, actuarial, and statistical sections of the Comprehensive
Annual Financial Report are presented for purposes of additional analysis and are not
a required part of the basic financial statements. Such information has not been
subjected to the auditing procedures applied in the audits of the basic financial
statements, and accordingly, we do not express an opinion or provide any assurance
on it.
Other reporting required by Government Auditing Standards
In accordance with Government Auditing Standards, we have also issued our report,
dated November 5, 2020, on our consideration of the Plan(s internal control over
financial reporting and on our tests of its compliance with certain provisions of laws,
regulations, contracts, and grant agreements and other matters. The purpose of that
report is solely to describe the scope of our testing of internal control over financial
reporting and compliance and the results of that testing, and not to provide an opinion
on the effectiveness of the Plan(s internal control over financial reporting or on
compliance. That report is an integral part of an audit performed in accordance with
Government Auditing Standards in considering the Plan(s internal control over financial
reporting and compliance.
San Francisco, California
November 5, 2020
17 Comprehensive Annual Financial Report 2019-2020 San José Police & Fire Retirement Plan

Management's Discussion and Analysis (unaudited)
November 5, 2020
Board of AdministrationSan José Police and Fire Department Retirement Plan1737 North First Street, Suite 600San José, California 95112-4505
The Office of Retirement Services is pleased to provide this overview and analysis of the financialactivities of the Police and Fire Department Retirement Plan (the Plan) for the fiscal years ended June30, 2020 and 2019. The Plan, consisting of a single employer Defined Benefit Pension Plan and threePostemployment Healthcare Plans, was established to provide retirement benefits for sworn employeesof the Police and Fire Departments of the City of San José (City). We encourage readers to consider theinformation presented here in conjunction with additional information that we have furnished in our Letterof Transmittal, which begins on page 5 of this report, and in the financial section which follows thisdiscussion.
Financial Highlights for Fiscal Year 2020
• As of June 30, 2020, the Plan had $3,910,552,000 in plan net position restricted for pension
benefits and postemployment healthcare benefits. Plan net position of $3,702,020,000
restricted for pension benefits is available to meet the Plan’s ongoing obligations to plan
participants and their beneficiaries. The Postemployment Healthcare Plans’ net position of
$208,532,000 is available for the exclusive use of retiree medical benefits.
• The Plan’s total net position held in trust for pension benefits and postemployment healthcare
benefits increased during the fiscal year ended June 30, 2020 by approximately $136,173,000
or 3.6% from the prior fiscal year, primarily as a result of the appreciation in the fair value of
investments caused by favorable market conditions during the fiscal year, as well as the
increase in contributions during the fiscal year.
• Additions to plan net position during fiscal year ended June 30, 2020 were $397,939,000, which
includes employer and employee contributions of $215,831,000 and $40,780,000, respectively,
and net investment income of $141,328,000. This represents an increase of $32,365,000 or
8.9% of total additions from the prior fiscal year amount of $365,574,000.
• Deductions from plan net position for fiscal year ended June 30, 2020 increased from
$249,906,000 to $261,766,000 over the prior fiscal year, or approximately 4.7%, due to a
combination of an increase in retirement benefit payments and a slight decrease in healthcare
insurance premiums. The increase in retirement benefits payments was attributable to an
increased number of retired members and beneficiaries, while the decrease in healthcare
insurance premiums was due to lower implicit subsidy.
Comprehensive Annual Financial Report 2019-2020 San José Police & Fire Retirement Plan 18

Management's Discussion and Analysis (unaudited) (continued)
Overview of the Financial Statements
The Plan’s financial statements, notes to the financial statements, required supplementary and othersupplemental information for the year ended June 30, 2020, were prepared in conformity with theprinciples of governmental accounting and reporting set forth by the Governmental AccountingStandards Board (GASB) and the reporting requirements prescribed by the Government FinanceOfficers' Association of the United States and Canada (GFOA). The following discussion and analysisare intended to serve as an introduction to the Plan’s financial statements, which are comprised of thesecomponents:
1. Statements of Plan Net Position
2. Statements of Changes in Plan Net Position
3. Notes to Basic Financial Statements
Please note, however, that this report also contains required supplementary information and othersupplemental information in addition to the basic financial statements themselves.
The Statements of Plan Net Position are a snapshot of account balances at fiscal year-end. Itindicates the assets available for future payments to retirees and any current liabilities that are owed atthis time.
The Statements of Changes in Plan Net Position, on the other hand, provide a view of current yearadditions to and deductions from the Plan.
Both statements are in compliance with accounting principles generally accepted in the United States ofAmerica (GAAP) as set forth by the GASB. GAAP requires state and local government pension plansand other postemployment benefit plan reports to use the full accrual method of accounting and makecertain disclosures. The Plan complies with all significant requirements of these pronouncements.
The Statements of Plan Net Position and the Statements of Changes in Plan Net Position reportinformation about the Plan’s activities. These statements include all assets and liabilities, using the fullaccrual basis of accounting, which recognizes contributions as revenue when currently due pursuant tolegal requirements and benefits and refunds of contributions when due and payable under the provisionsof the Plan. All of the fiscal year’s additions and deductions are taken into account regardless of whencash is received or paid. All realized gains and losses are reported at the trade date, not the settlementdate. In addition, both realized and unrealized gains and losses on investments are reported.
These two statements report the Plan’s net position held in trust for pension benefits andpostemployment healthcare benefits (net position)—the difference between assets and liabilities. Overtime, increases and decreases in the Plan’s net position are one indicator of whether its financial healthis improving or deteriorating. Other factors, such as the net pension liability and the net OPEB liability,should also be considered in measuring the Plan’s overall health.
Notes to the Basic Financial Statements provide additional information that is essential to a fullunderstanding of the data provided in the financial statements (see Notes to Basic Financial Statementsbeginning on page 33 of this report).
Required Supplementary Information. In addition to the financial statements and accompanyingnotes, this report presents certain required supplementary information concerning employercontributions and the Plan’s progress in funding its obligations to provide pension and otherpostemployment healthcare benefits to members and beneficiaries (see Required SupplementaryInformation beginning on page 75 of this report). The Schedule of Changes in the Employer's NetPension Liability and Related Ratios of the Defined Benefit Pension Plan was prepared using the Plan'snet position.
19 Comprehensive Annual Financial Report 2019-2020 San José Police & Fire Retirement Plan

Management's Discussion and Analysis (unaudited) (continued)
Other Supplemental Information. The Combining Schedules of Defined Benefit Pension Plan NetPosition and Changes in Defined Benefit Pension Plan Net Position, Schedules of AdministrativeExpenses and Other, Payments to Consultants, and Investment Expenses are presented immediatelyfollowing the Required Supplementary Information.
Financial Analysis
As previously noted, plan net position may serve over time as a useful indication of the Plan’s financialposition (see Tables 1a and 1c on pages 20 - 21). At the close of fiscal years 2020 and 2019, the Plan’stotal assets exceeded the Plan’s total liabilities. The Plan’s financial statements do not include the totalpension liability or the total OPEB liability for the Defined Benefit Pension Plan and the PostemploymentHealthcare Plans, respectively.
The Pension Plan's net position as a percentage of the total pension liability and the PostemploymentHealthcare Plan's total OPEB liability should also be considered when evaluating the Plan’s financialhealth. Based on the June 30, 2019 actuarial valuation rolled forward to June 30, 2020, the net positionof the Defined Benefit Pension Plan was 71.5% of the total pension liability, and the net position of theOther Postemployment Employee Benefit Plan was 30.3% for Police and 26.1% for Fire. For moreinformation on the results and impact of the June 30, 2019 actuarial valuations. Please see Notes 4 and5 to the financial statements beginning on page 65.
NET POSITION FOR THE DEFINED BENEFIT PENSION PLAN (Table 1a)As of June 30, 2020 and 2019 (Dollars in Thousands)
2020 2019 Increase Amount Increase PercentReceivables $ 127,537 $ 46,864 $ 80,673 %172.1Investments at fair value 3,587,886 3,544,827 43,059 %1.2Capital assets, net 3,494 3,031 463 %15.3
Total Assets 3,718,917 3,594,722 124,195 %3.5Current liabilities 16,897 6,300 10,597 %168.2
Total Liabilities 16,897 6,300 10,597 %168.2Plan Net Position $ 3,702,020 $ 3,588,422 $ 113,598 %3.2
NET POSITION FOR THE DEFINED BENEFIT PENSION PLAN (Table 1b)As of June 30, 2019 and 2018 (Dollars in Thousands)
2019 2018Increase / (Decrease)
AmountIncrease / (Decrease)
PercentReceivables $ 46,864 $ 9,900 $ 36,964 %373.4Investments at fair value 3,544,827 3,491,602 53,225 %1.5Capital assets, net 3,031 1,726 1,305 %75.6
Total Assets 3,594,722 3,503,228 91,494 %2.6Current liabilities 6,300 7,037 (737) %(10.5)
Total Liabilities 6,300 7,037 (737) %(10.5)Plan Net Position $ 3,588,422 $ 3,496,191 $ 92,231 %2.6
Comprehensive Annual Financial Report 2019-2020 San José Police & Fire Retirement Plan 20

Management's Discussion and Analysis (unaudited) (continued)
NET POSITION FOR THE POSTEMPLOYMENT HEALTHCARE PLANS (Table 1c)As of June 30, 2020 and 2019 (Dollars in Thousands)
2020 2019 Increase Amount Increase PercentReceivables $ 9,450 $ 4,775 $ 4,675 %97.9Investments at fair value 201,764 182,307 19,457 %10.7Capital assets, net 51 46 5 %10.9
Total Assets 211,265 187,128 24,137 %12.9Current liabilities 2,733 1,171 1,562 %133.4
Total Liabilities 2,733 1,171 1,562 %133.4Plan Net Position $ 208,532 $ 185,957 $ 22,575 %12.1
NET POSITION FOR THE POSTEMPLOYMENT HEALTHCARE PLANS (Table 1d)As of June 30, 2019 and 2018 (Dollars in Thousands)
2019 2018Increase / (Decrease)
AmountIncrease / (Decrease)
PercentReceivables $ 4,775 $ 18,295 $ (13,520) %(73.9)Investments at fair value 182,307 152,091 30,216 %19.9Capital assets, net 46 29 17 %58.6
Total Assets 187,128 170,415 16,713 %9.8Current liabilities 1,171 7,895 (6,724) %(85.2)
Total Liabilities 1,171 7,895 (6,724) %(85.2)Plan Net Position $ 185,957 $ 162,520 $ 23,437 %14.4
DEFINED BENEFIT PENSION PLAN NET POSITION (Tables 1a and 1b)As of June 30, 2020 , 2019 and 2018
(Dollars in Millions)
21 Comprehensive Annual Financial Report 2019-2020 San José Police & Fire Retirement Plan

Management's Discussion and Analysis (unaudited) (continued)
POSTEMPLOYMENT HEALTHCARE PLANS NET POSITION (Tables 1c and 1d)As of June 30, 2020 , 2019 and 2018
(Dollars in Millions)
As of June 30, 2020, $3,702,020,000 and $208,532,000 in total net position was restricted for pensionbenefits and postemployment healthcare benefits, respectively (see Tables 1a and 1c on pages 20 - 21).Plan net position restricted for pension benefits of $3,702,020,000 is available to meet the Plan’songoing obligations to pension plan participants and their beneficiaries. Postemployment HealthcarePlan net position of $208,532,000 is available for the exclusive use of retiree medical benefits.
As of June 30, 2020, total net position restricted for pension benefits and for the postemploymenthealthcare benefits increased by 3.2% and 12.1% from the prior year, primarily due to the netappreciation in the fair value of investments of $122,193,000 and $4,674,000 for the Defined BenefitPension Plan and the Postemployment Healthcare Plan, respectively. The appreciation in the fair valueof investments was caused by favorable market conditions during the fiscal year. The Plan’s currentasset allocation is discussed in detail in Note 2(c) of the financial statements on page 50.
As of June 30, 2019, $3,588,422,000 and $185,957,000, in total net position was restricted for pensionbenefits and postemployment healthcare benefits, respectively (see Tables 1b and 1d on pages 20 - 21).Plan net position restricted for pension benefits of $3,588,422,000 was available to meet the Plan’songoing obligations to pension plan participants and their beneficiaries. Postemployment HealthcarePlan net position of $185,957,000 was available for the exclusive use of retiree medical benefits.
As of June 30, 2019, total net position restricted for pension benefits increased by 2.6% and increasedby 14.4% for the postemployment healthcare benefits plan from the prior year, primarily due to the netappreciation in the fair value of investments of $101,239,000 and $5,034,000 for the Defined BenefitPension Plan and the Postemployment Healthcare Plan, respectively. The appreciation in the fair valueof investments was caused by favorable market conditions during the fiscal year. The Plan’s currentasset allocation is discussed in detail in Note 2(c) of the financial statements on page 50.
Comprehensive Annual Financial Report 2019-2020 San José Police & Fire Retirement Plan 22

Management's Discussion and Analysis (unaudited) (continued)
As of June 30, 2020, receivables increased by $80,673,000 or 172.1% in the Defined Benefit PensionPlan and by $4,675,000 or 97.9% in the Postemployment Healthcare Plans. Receivables in the DefinedBenefit Pension Plan and the Postemployment Healthcare Plans increased mainly due to pendinginvestment trades at year end, causing an increase in receivables from brokers and other and accruedinvestment income receivables. In the previous year, receivables for the Defined Benefit Pension Planincreased by $36,964,000 or 373.4% due to an increase in receivables from brokers and others for year-end investment trades and decreased by $(13,520,000) or (73.9)% in the Postemployment HealthcarePlans due to a decrease in receivables from brokers and others for year-end investment trades.
As of June 30, 2020, total liabilities for the Defined Benefit Pension Plan and the PostemploymentHealthcare Plans increased by $10,597,000, or 168.2% and $1,562,000 or 133.4%, respectively,compared with June 30, 2019, mainly due to an increase in payables to brokers and others for year-endinvestment trades as a result of the timing of investment transactions. In the previous year, totalliabilities for the Defined Benefit Pension Plan and the Postemployment Healthcare Plans decreased by$(737,000), or (10.5)% and $(6,724,000) or (85.2)%, respectively, compared with June 30, 2018, due toa decrease in payables to brokers and others for year-end investment trades.
POLICE AND FIRE PLAN ACTIVITIES
In the fiscal year ended 2020, the Plan’s combined Defined Benefit Pension Plan and PostemploymentHealthcare Plans net position increased by $136,173,000, or 3.6%, primarily due to the favorable marketconditions during the fiscal year. Overall, net plan position increased, but the impact of COVID-19 led toa decrease in the net investment income. Key elements of the Plan’s financial activities are described inthe sections that follow.
Additions to Plan Net Position
The assets needed to fund retirement benefits are accumulated through the collection of employer andemployee contributions along with earnings on investments (net of investment expense). Additions to theDefined Benefit Pension Plan and Postemployment Healthcare Plans for the fiscal year ended June 30,2020, were $350,211,000 and $47,728,000, respectively (see Tables 2a and 2c on pages 25 - 26).
For the fiscal year ended June 30, 2020, total additions for the Defined Benefit Pension Plan increasedby $34,603,000 or 11.0% but decreased by $(2,238,000) or (4.5)%, for the Postemployment HealthcarePlans. The primary cause of the increase from prior year in the Defined Benefit Pension Plan was acombination of the increase in net investment income of $19,906,000 and the increase in contributionsof $14,697,000, due to the better market conditions throughout the first two quarters, the asset allocationchange, and the increase in employer contributions. The primary cause of the decrease from prior yearin the Postemployment Healthcare Plans is the decrease in employer contributions of $(1,394,000). Theimpact of COVID-19 on the financial markets was extreme. As result, the Retirement Plan's Board votedto shift its Asset Allocation Policy to prepare for the volatility in the financial markets. However, themarket conditions still had an impact on the Plan and did not result in the same amount of gains as prioryears, even causing a decrease in the Healthcare Plans.
The Plan’s time-weighted net rate of return, as determined by the Plan’s investment consultant on aninvestment (non-GAAP) basis, for the fiscal year ended June 30, 2020 for the Defined Benefit PensionPlan, was 3.1% compared to 7.3% for fiscal year 2019.
For the fiscal year ended June 30, 2019, total additions for the Defined Benefit Pension Plan andPostemployment Healthcare Plans decreased by $(99,420,000) and increased by $1,386,000, or(24.0)% and 2.9%, respectively. The primary cause of the decrease from the prior year wascombination of the decrease of $(119,296,000) and increase of $836,000 in net investment income andthe increase in City contributions of $18,906,000 and $3,362,000 in the Defined Benefit Pension Planand Postemployment Healthcare Plans, respectively.
23 Comprehensive Annual Financial Report 2019-2020 San José Police & Fire Retirement Plan

Management's Discussion and Analysis (unaudited) (continued)
The decrease in investment income was due to less than favorable market conditions during the fiscalyear as compared to prior year, and the increase in employer contributions is due to the increase in Citycontribution rates of around 15% for Tier 1 and 5% for Tier 2. While the City contributions increased,employee contributions decreased for the Postemployment Healthcare Plans as a result of theimplementation of the VEBA, which stopped contributions for those who opted in to the VEBA.
The Plan’s time-weighted gross rate of return, as determined by the Plan’s investment consultant on aninvestment (non-GAAP) basis, for the fiscal year ended June 30, 2019, for the Defined Benefit PensionPlan was 7.3% compared to 10.3% for fiscal year 2018. On a net of investment fee basis, the Plan’stime-weighted rate of return for the fiscal year ended June 30, 2019, was 6.9% compared to 9.7% forfiscal year 2018.
Deductions from Plan Net Position
The Plan was created to provide a monthly pension allowance, survivor benefits, permanent disabilitybenefits, and postemployment healthcare benefits to qualified members and their beneficiaries. The costof such programs includes recurring benefit payments and healthcare premium payments, as designatedby the San José Municipal Code, refunds of contributions to terminated employees, and the cost ofadministering the Plan.
Deductions for the fiscal year ended June 30, 2020, totaled $236,613,000 and $25,153,000 for theDefined Benefit Pension Plan and Postemployment Healthcare Plans, respectively. Deductions for theDefined Benefit Pension Plan increased by $13,236,000 or 5.9% from the previous year due to anincrease in benefit payments (see Table 2a on page 25). The increase in benefit payments is primarilydue to continued increases in the number of retirees and beneficiaries with higher final average salariesand added cost of living adjustments. Deductions for the Postemployment Healthcare Plans decreasedby $(1,376,000) or (5.2)% from the previous year mainly due to the decrease in implicit subsidy. (seeTable 2c on page 26).
Deductions for the fiscal year ended June 30, 2019, totaled $223,377,000 and $26,529,000 for theDefined Benefit Pension Plan and Postemployment Healthcare Plans, respectively. Deductions for theDefined Benefit Pension Plan increased 5.3% from the previous year due to an increase in benefitpayments. The increase in benefit payments is primarily due to continued increases in the number ofretirees and beneficiaries with higher final average salaries and added cost of living adjustments (seeTable 2b on page 25). Deductions for the Postemployment Healthcare Plans decreased by (25.8)% fromthe previous year due to the net result of a decrease in healthcare insurance premiums from theimplementation of a new lowest cost health plan for the year and the increase in the transfer of VEBAassets for the fiscal year. (see Table 2d on page 26).
Comprehensive Annual Financial Report 2019-2020 San José Police & Fire Retirement Plan 24

Management's Discussion and Analysis (unaudited) (continued)
CHANGES IN PLAN NET POSITION FOR THE DEFINED BENEFIT PENSION PLAN (Table 2a)For the Fiscal Years Ended June 30, 2020 and 2019 (Dollars in Thousands)
2020 2019 Increase Amount Increase PercentEmployee contributions $ 27,645 $ 24,811 $ 2,834 %11.4Employer contributions 188,481 176,618 11,863 %6.7Net investment income1 134,085 114,179 19,906 %17.4
Total Additions 350,211 315,608 34,603 %11.0
Retirement benefits 216,206 204,652 11,554 %5.6Death benefits 14,238 13,162 1,076 %8.2Refund of contributions 564 194 370 %190.7Administrative expenses 5,605 5,369 236 %4.4
Total Deductions 236,613 223,377 13,236 %5.9
Net Increase in Plan NetPosition 113,598 92,231 21,367 %23.2
Beginning Net Position 3,588,422 3,496,191 92,231 %2.6Ending Net Position $ 3,702,020 $ 3,588,422 $ 113,598 %3.2
1Net of investment expenses of $15,628 and $17,661 in 2020 and 2019 , respectively.
CHANGES IN NET POSITION FOR THE DEFINED BENEFIT PENSION PLAN (Table 2b)For the Fiscal Years Ended June 30, 2019 and 2018 (Dollars in Thousands)
2019 2018Increase / (Decrease)
AmountIncrease / (Decrease)
PercentEmployee contributions $ 24,811 $ 23,841 $ 970 %4.1Employer contributions 176,618 157,712 18,906 %12.0Net investment income1 114,179 233,475 (119,296) %(51.1)
Total Additions 315,608 415,028 (99,420) %(24.0)
Retirement benefits 204,652 194,139 10,513 %5.4Death benefits 13,162 12,102 1,060 %8.8Refund of contributions 194 389 (195) %(50.1)Administrative expenses 5,369 5,464 (95) %(1.7)
Total Deductions 223,377 212,094 11,283 %5.3
Net Increase in Plan NetPosition 92,231 202,934 (110,703) %(54.6)
Beginning Net Position 3,496,191 3,293,257 202,934 %6.2Ending Net Position $ 3,588,422 $ 3,496,191 $ 92,231 %2.6
1 Net of investment expenses of $17,661 and $18,845 in 2019 and 2018, respectively.
25 Comprehensive Annual Financial Report 2019-2020 San José Police & Fire Retirement Plan

Management's Discussion and Analysis (unaudited) (continued)
CHANGES IN NET POSITION FOR THE POSTEMPLOYMENT HEALTHCARE PLANS (Table 2c)For the Fiscal Years Ended June 30, 2020 and 2019 (Dollars in Thousands)
2020 2019Increase / (Decrease)
AmountIncrease / (Decrease)
PercentEmployee contributions $ 13,135 $ 13,315 $ (180) %(1.4)Employer contributions 27,350 28,744 (1,394) %(4.8)Net investment income 1 7,243 7,907 (664) %(8.4)
Total Additions 47,728 49,966 (2,238) %(4.5)
Healthcare insurance premiums 25,031 26,403 (1,372) %(5.2)Administrative expenses 122 126 (4) %(3.2)
Total Deductions 25,153 26,529 (1,376) %(5.2)
Net Increase in Plan NetPosition 22,575 23,437 (862) %(3.7)
Beginning Net Position 185,957 162,520 23,437 %14.4Ending Net Position $ 208,532 $ 185,957 $ 22,575 %12.1
1 Net of investment expenses of $336 and $347 in 2020 and 2019 , respectively.
CHANGES IN NET POSITION FOR THE POSTEMPLOYMENT HEALTHCARE PLANS (Table 2d)For the Fiscal Years Ended June 30, 2019 and 2018 (Dollars in Thousands)
2019 2018Increase / (Decrease)
AmountIncrease / (Decrease)
PercentEmployee contributions $ 13,315 $ 16,127 $ (2,812) %(17.4)Employee contributions 28,744 25,382 3,362 %13.2Net investment income1 7,907 7,071 836 %11.8
Total Additions 49,966 48,580 1,386 %2.9
Healthcare insurance premiums 26,403 27,686 (1,283) %(4.6)Administrative expenses 126 159 (33) %(20.8)VEBA transfer - 7,897 (7,897) %(100.0)
Total Deductions 26,529 35,742 (9,213) %(25.8)
Net Increase in Plan NetPosition 23,437 12,838 10,599 %82.6
Beginning Net Position 162,520 149,682 12,838 %8.6Ending Net Position $ 185,957 $ 162,520 $ 23,437 %14.4
1 Net of investment expenses of $347 and $405 in 2019 and 2018 , respectively.
Reserves
The Plan is required by the City of San José Municipal Code to establish various reserves in the Plan’snet position. The Plan’s net position is allocated between the Defined Benefit Pension Plan (whichincludes the Retirement Fund and the Cost-of-Living Fund) and the Postemployment Healthcare Plans(which include the Postemployment Healthcare 401(h) Plan, the Police Department Postemployment115 Healthcare Subtrust and the Fire Department Postemployment 115 Healthcare Subtrust). TheDefined Benefit Pension Plan Retirement Fund and the Defined Benefit Cost-of-Living Fund both have aGeneral Reserve and an Employee Contributions Reserve. The Postemployment Healthcare 401(h) and115 Subtrust Funds have a General Reserve only (see table on page 53 for a complete listing and year-end balances of the Plan’s reserves).
Comprehensive Annual Financial Report 2019-2020 San José Police & Fire Retirement Plan 26

Management's Discussion and Analysis (unaudited) (continued)
The Plan’s reserves are established from employer and employee contributions and the accumulation ofinvestment income, after satisfying investment and administrative expenses. Additionally, theappreciation or depreciation in the fair value of investments is held in the unrealized gain/loss account, acomponent of each Plan’s General Reserve.
With the implementation of Measure F, a medical in-lieu component of the General Reserves wascreated to account for those members who elected to be in the medical in-lieu credit program. Thesemembers are retirees who are eligible for medical insurance and/or dental insurance but who opt not totake it and instead elect to be in the in-lieu credit program. These members are given credits worth 25%of the lowest cost plan, which can be used in future years if the retiree opts to enroll in a City medical ordental plan.
The Plan's Fiduciary Responsibilities
The Plan’s Board of Administration is the fiduciary trustee of the Defined Benefit Pension Plan andPostemployment Healthcare Plans. Under the California Constitution and the San José Municipal Code,Plan assets may only be used for the exclusive benefit of providing benefits to plan participants and theirbeneficiaries and defraying reasonable costs of administration.
Economic Factors and Rates Affecting Next Year
The City and the bargaining units representing sworn Police and Fire members engaged in settlementdiscussions concerning litigation arising out of a voter-approved ballot measure, known as Measure B,which was approved in 2012. On July 15, 2015, the City and sworn Police and Fire bargaining unitsreached an Alternative Pension Reform Settlement Framework (Framework) which was approved by theCity Council and the bargaining units' memberships. A ballot measure (Measure F) was presented to thepublic for voting in the November 2016 election, which determined whether the terms of the Frameworkwill be implemented. Measure F passed, and on March 31, 2017, the ordinance implementing theFramework and Measure F became effective for employees in the Plan.
The provisions of the Framework included, but are not limited to, revising Tier 2 benefit, allowing rehiredTier 1 employees to remain in Tier 1, creating a Voluntary Employee Beneficiary Association (VEBA) forretiree healthcare and an irrevocable opt-out of the defined benefit retiree healthcare plan for eligibleemployees, defining the qualifications for members of the independent medical panel, and creating aGuaranteed Purchasing Power benefit for Tier 1 retirees. All Tier 1 employees were eligible to opt-in tothe VEBA and rehired employees with healthcare contributions will also have the option throughcalendar year 2022. The VEBA is being administered by the City, not ORS and therefore it is also notunder the jurisdiction of the Retirement Board.
The Plan’s actuarial valuations as of June 30, 2019, were used to determine the contribution rates anddollar amounts effective June 28, 2020, for fiscal year 2020-2021. The annual determined contributionrates and dollar amounts were adopted by the Board in June 2020. Because of the impact of COVID-19on the City's budget, the City decided that prefunding Tier 1 pension contributions for fiscal year 20-21would add significant budgetary savings. The June 30, 2019 actuarial valuations include Board adoptedactuarial assumption changes recommended by the Plan's actuary in the June 30, 2019 PreliminaryValuation Results and Economic Assumption Review presented in October and November 2019.
Defined Benefit Pension Plan
The Plan’s funding objective is to meet long-term benefit obligations through contributions andinvestment income. The Plan’s actuarial valuation for funding purposes uses a five-year smoothingmethod for investment gains and losses. This means that the current year’s gains or losses compared tothe actuarially assumed rate of return, as calculated at year-end, are recognized over five years. Theunfunded actuarial liability (UAL) of $1,282.1 million, as of June 30, 2019, does not include the impact ofapproximately $117.9 million of net deferred investment losses yet to be recognized, primarily resultingfrom unfavorable investment returns during fiscal years 2016 and 2019. It is anticipated that futureactuarial valuations will recognize these remaining deferred net investment losses as described aboveand the smoothing of any new gains or losses over a five-year period.
27 Comprehensive Annual Financial Report 2019-2020 San José Police & Fire Retirement Plan

Management's Discussion and Analysis (unaudited) (continued)
The Plan is exposed to general investment market risk. In a pension plan context, this is the risk that thelong-term rate of return earned on the pension plan assets could be below the actuarially assumed rateof return, which is 6.75%, net of investment expenses, in the actuarial valuation as of June 30, 2019.With all other actuarial variables being equal, underperforming the assumed rate of return wouldincrease the UAL and decrease the funded status of the Plan, thereby increasing required contributionsto the Plan. Conversely, with all other actuarial variables being equal, overperforming the assumed rateof return would decrease the UAL and increase the funded status of the Plan, thereby decreasingrequired contributions to the Plan.
The actuarial assumptions may be adjusted where it is determined that current assumptions will notprovide the most accurate expectation of what may happen in the future. The Board approved to makechanges to the June 30, 2019 actuarial valuation as a result of the demographic experience studypresented in October 2019. The next experience study is scheduled to be conducted in 2021. SeeActuarial section for the effects of these changes.
Contribution rates for fiscal year 2020-2021, as determined by the June 30, 2019 actuarial valuation,included the impact of the changes stated above and the recognition of smoothed deferred investmentgains and losses.
Postemployment Healthcare Plans
With the passage of Measure F, the Framework became effective as of March 31, 2017. A VEBA forretiree healthcare was created and Tier 1 members were eligible for an irrevocable opt-out of the definedbenefit retiree healthcare plan, while Tier 2 members were required to move out of the defined benefitretiree healthcare plan and into the VEBA. The VEBA opt-in election period was October 18, 2017through December 15, 2017, and the healthcare contributions of members who opted in to the VEBAwas transferred out of the Postemployment Healthcare Plan in March 2018.
Historically, members and City contributions to the Plan have been negotiated through collectivebargaining separately for Police and Fire and have not been actuarially determined. With theimplementation of Measure F, member contributions were fixed at 8.0% of pay; the City's contributiontoward the explicit subsidy (or premium subsidy) will be actuarially determined separately for Police andFire; and, the City will also pay the implicit subsidy (difference between the expected claims cost for aretiree or spouse and the total (retiree plus City premium) on pay-as-you-go basis as part of activehealth premiums. In addition, the City has an option to limit its contribution for the explicit subsidy to11% of Police and Fire payroll.
In March 2018, the Board approved the contribution policy that sets the City health care contributions asa flat dollar amount, beginning with fiscal year 2019.
Requests for Information
This financial report is designed to provide the Board of Administration, Mayor and City Council, ourmembership, taxpayers, and stakeholders, with a general overview of the Plan’s finances and to accountfor the money it receives. Questions concerning any of the information provided in this report or requestsfor additional financial information should be addressed to:
Police and Fire Department Retirement Plan1737 North First Street, Suite 600San José, California 95112-4505
Respectfully Submitted,
Roberto L. Peña
Chief Executive OfficerOffice of Retirement ServicesComprehensive Annual Financial Report 2019-2020 San José Police & Fire Retirement Plan 28

Basic Financial Statements
STATEMENTS OF PLAN NET POSITIONAs of June 30, 2020 and 2019 (In Thousands)
2020
DefinedBenefit
Pension Plan
Post-employment Healthcare
401(h)
PoliceDepartmentHealthcareSubtrust
FireDepartmentHealthcareSubtrust Total
ASSETS
ReceivablesEmployee contributions $ 1,281 $ 589 $ - $ - $ 1,870
Employer contributions 8,927 - 681 444 10,052
Brokers and others 16,249 2,874 514 736 20,373
Accrued investment income 101,080 987 1,626 999 104,692
Total Receivables 127,537 4,450 2,821 2,179 136,987
Investments, at fair valueSecurities and other:
Public equity 1,689,261 12,318 61,858 38,350 1,801,787
Private equity 354,363 2,583 - - 356,946
Investment grade bonds 322,934 2,355 - - 325,289
Private debt 195,225 1,423 - - 196,648
Immunized cash flows 162,426 1,184 - - 163,610
Core real estate 142,477 1,039 8,039 4,984 156,539
Growth real estate 127,301 928 - - 128,229
Market neutral strategies 118,727 866 - - 119,593
Emerging market bonds 116,209 847 - - 117,056Long-term government bonds 110,643 807 - - 111,450
Treasury inflation-protected securities 74,271 542 - - 74,813
High yield bonds 73,751 538 - - 74,289
Cash and cash equivalents 66,509 485 1,269 787 69,050
Short-term investment grade bonds - - 31,636 19,613 51,249
Private real assets 33,810 246 - - 34,056
Commodities - - 5,597 3,470 9,067
International currency contracts, net (21) - - - (21)
Total Investments 3,587,886 26,161 108,399 67,204 3,789,650
Capital Assets, net 3,494 51 - - 3,545
TOTAL ASSETS 3,718,917 30,662 111,220 69,383 3,930,182
LIABILITIES
Payable to brokers 15,250 1,196 665 829 17,940
Other liabilities 1,647 17 14 12 1,690
TOTAL LIABILITIES 16,897 1,213 679 841 19,630
PLAN NET POSITION - RESTRICTED FOR
Pension benefits 3,702,020 - - - 3,702,020
Postemployment healthcare benefits - 29,449 110,541 68,542 208,532
TOTAL PLAN NET POSITION $ 3,702,020 $ 29,449 $ 110,541 $ 68,542 $ 3,910,552
See accompanying notes to basic financial statements (continued)
29 Comprehensive Annual Financial Report 2019-2020 San José Police & Fire Retirement Plan

Basic Financial Statements (continued)
STATEMENTS OF PLAN NET POSITION (continued)As of June 30, 2020 and 2019 (In Thousands)
2019
DefinedBenefit
Pension Plan
Post-employment Healthcare
401(h)
PoliceDepartmentHealthcareSubtrust
FireDepartmentHealthcareSubtrust Total
ASSETS
ReceivablesEmployee contributions $ 1,058 $ 541 $ - $ - $ 1,599
Employer contributions 9,767 - 615 349 10,731
Brokers and others 29,443 3,052 - - 32,495
Accrued investment income 6,596 17 126 75 6,814
Total Receivables 46,864 3,610 741 424 51,639
Investments, at fair valueSecurities and other:
Public equity 1,092,126 10,509 51,431 31,714 1,185,780
Investment grade bonds 674,084 6,486 25,850 15,940 722,360
Private equity 456,024 4,388 - - 460,412
Market neutral strategies 260,702 2,509 - - 263,211
Private debt 187,398 1,803 - - 189,201
Immunized cash flows 177,270 1,706 - - 178,976
Core real estate 134,038 1,290 8,261 5,094 148,683
Emerging market bonds 115,169 1,108 - - 116,277
Sovereign bonds ex US 101,880 980 - - 102,860
Growth real estate 100,609 968 - - 101,577
Commodities 72,144 694 4,328 2,669 79,835
Treasury inflation-protected securities 73,493 707 - - 74,200
Cash and cash equivalents 47,968 464 1,799 1,109 51,340
Private real assets 34,348 331 - - 34,679
High yield bonds 17,510 168 - - 17,678
International currency contracts, net 64 1 - - 65
Total Investments 3,544,827 34,112 91,669 56,526 3,727,134
Capital Assets 3,031 46 - - 3,077
TOTAL ASSETS 3,594,722 37,768 92,410 56,950 3,781,850
LIABILITIES
Payable to brokers 4,613 888 124 76 5,701
Other liabilities 1,687 30 31 22 1,770
TOTAL LIABILITIES 6,300 918 155 98 7,471
PLAN NET POSITION - RESTRICTED FOR
Pension benefits 3,588,422 - - - 3,588,422
Postemployment healthcare benefits - 36,850 92,255 56,852 185,957
TOTAL PLAN NET POSITION $ 3,588,422 $ 36,850 $ 92,255 $ 56,852 $ 3,774,379
See accompanying notes to basic financial statements) (concluded)Comprehensive Annual Financial Report 2019-2020 San José Police & Fire Retirement Plan 30

Basic Financial Statements (continued)
STATEMENTS OF CHANGES IN PLAN NET POSITIONFor the Fiscal Years Ended June 30, 2020 and 2019 (In Thousands)
2020
DefinedBenefit
Pension Plan
Post-employment Healthcare
401(h)
PoliceDepartmentHealthcareSubtrust
FireDepartmentHealthcareSubtrust Total
ADDITIONS
ContributionsEmployee $ 27,645 $ 13,135 $ - $ - $ 40,780
Employer 188,481 3,347 14,595 9,408 215,831
Total Contributions 216,126 16,482 14,595 9,408 256,611
Investment income Net appreciation in fair value of
investments 122,193 1,096 2,209 1,369 126,867
Interest income 18,108 187 240 148 18,683
Dividend income 9,412 97 1,382 851 11,742
Less: investment expense (15,628) (160) (109) (67) (15,964)
Net Investment Income 134,085 1,220 3,722 2,301 141,328
TOTAL ADDITIONS 350,211 17,702 18,317 11,709 397,939
DEDUCTIONS
Retirement benefits 216,206 - - - 216,206
Healthcare insurance premiums - 25,031 - - 25,031
Death benefits 14,238 - - - 14,238
Refund of contributions 564 - - - 564
Administrative expenses and other 5,605 72 31 19 5,727
TOTAL DEDUCTIONS 236,613 25,103 31 19 261,766
NET INCREASE / (DECREASE) 113,598 (7,401) 18,286 11,690 136,173
PLAN NET POSITION - RESTRICTED FOR PENSION AND POSTEMPLOYMENT HEALTHCARE BENEFITS
BEGINNING OF YEAR 3,588,422 36,850 92,255 56,852 3,774,379END OF YEAR $ 3,702,020 $ 29,449 $ 110,541 $ 68,542 $ 3,910,552
See accompanying notes to basic financial statements (continued)
31 Comprehensive Annual Financial Report 2019-2020 San José Police & Fire Retirement Plan

Basic Financial Statements (continued)
STATEMENTS OF CHANGES IN PLAN NET POSITION (continued)For the Fiscal Years Ended June 30, 2020 and 2019 (In Thousands)
2019
DefinedBenefit
Pension Plan
Post-employment Healthcare
401(h)
PoliceDepartmentHealthcareSubtrust
FireDepartmentHealthcareSubtrust Total
ADDITIONS
ContributionsEmployee $ 24,811 $ 13,315 $ - $ - $ 38,126
Employer 176,618 5,716 14,086 8,942 205,362
Total Contributions 201,429 19,031 14,086 8,942 243,488
Investment incomeNet appreciation in fair value of
investments 101,239 1,120 2,408 1,506 106,273
Interest income 23,063 300 48 29 23,440
Dividend income 7,538 97 1,716 1,030 10,381
Less: investment expense (17,661) (229) (73) (45) (18,008)
Net Investment Income 114,179 1,288 4,099 2,520 122,086
TOTAL ADDITIONS 315,608 20,319 18,185 11,462 365,574
DEDUCTIONS
Retirement benefits 204,652 - - - 204,652
Healthcare insurance premiums - 26,403 - - 26,403
Death benefits 13,162 - - - 13,162
Refund of contributions 194 - - - 194
Administrative expenses and other 5,369 80 28 18 5,495
TOTAL DEDUCTIONS 223,377 26,483 28 18 249,906
NET INCREASE / (DECREASE) 92,231 (6,164) 18,157 11,444 115,668
PLAN NET POSITION - RESTRICTED FOR PENSION AND POSTEMPLOYMENT HEALTHCARE BENEFITS
BEGINNING OF YEAR 3,496,191 43,014 74,098 45,408 3,658,711END OF YEAR $ 3,588,422 $ 36,850 $ 92,255 $ 56,852 $ 3,774,379
See accompanying notes to basic financial statements) (concluded)Comprehensive Annual Financial Report 2019-2020 San José Police & Fire Retirement Plan 32

Notes to the Basic Financial Statements
NOTE 1 - DESCRIPTION OF THE PLAN
The following description of the City of San José Police and Fire Department Retirement Plan (the Plan)is provided for financial reporting purposes only. Readers should refer to the City of San José MunicipalCode for more complete information.
(a) General
The Plan was established in 1961 to provide retirement benefits for certain employees of the City of SanJosé (City). The current Plan consists of a single employer Defined Benefit Pension Plan and threePostemployment Healthcare Plans. On January 27, 2011, the Plan requested a compliance statementand favorable determination letter from the Internal Revenue Service (IRS) under the streamlineprocedures of the voluntary compliance program for the Defined Benefit Pension Plan and thePostemployment Healthcare Plans. The most recent favorable determination letter from the IRS is datedAugust 26, 2016.
The Postemployment Healthcare 401(h) Plan, which was established under Internal Revenue Code(IRC) Section 401(h), is an account within the pension plan which is used for the funding and payment ofthe retiree healthcare benefits. As a 401(h) plan, the healthcare benefits must be subordinate to thepension plan benefits. The medical benefits are considered subordinate if, when ignoring contributionsfor past service benefit, the contributions for medical benefits are no greater than 25% of the actualcontributions to both the pension and medical benefits. Periodic reviews and projections of the IRC 25%subordination test are performed by the Plan’s actuary.
A new IRC Section 115 Trust was established on May 22, 2012 by the San José City Council (Ordinancenumber 29065) to provide an alternative to the existing 401(h) account. The healthcare trust wasclarified by the San José City Council (Ordinance number 29260) on June 12, 2013, which declared thatthe Police Department Postemployment Healthcare Plan and the Fire Department PostemploymentHealthcare Plan may be structured as two wholly separate sub-trusts of one trust. Employercontributions to the new trust funds began in fiscal year 2013. On August 6, 2013, the City obtained aprivate letter ruling from the IRS assuring the pre-tax treatment of employee contributions to the newtrust funds. On July 9, 2014, the Plan received a private letter ruling from the IRS on the tax qualificationof the new Section 115 Trust. As of this date, it has not been determined if or when employeecontributions will begin to go into the Section 115 subtrusts.
The City and the bargaining units representing sworn Police and Fire members engaged in settlementdiscussions concerning litigation arising out of a voter-approved ballot measure, known as Measure B,which passed in 2012. On August 25, 2015, the City Council approved the terms of the AlternativePension Reform Settlement Framework (Public Safety Framework) for the two sworn bargaining units,the San José Police Officers' Association (SJPOA) and the San José Firefighters InternationalAssociation of Fire Fighters, Local 230 (IAFF). The Public Safety Framework included an agreementthat a ballot measure would be placed on the November 8, 2016 election for the voters to replaceMeasure B.
On November 8, 2016, the voters approved the Alternative Pension Reform Act known as Measure F.Measure F included, among other things, prohibiting any enhancements to defined retirement benefitswithout voter approval; codifying the Tier 2 pension benefit; closing the defined benefit retiree healthcareplan; and prohibiting retroactive defined retirement benefit enhancements. The City Council approvedOrdinance number 29879 on February 14, 2017, amending the San José Municipal Code to reflect theterms of Measure F and the Public Safety Framework, and the changes to the Municipal Code becameeffective thirty (30) days after February 14, 2017. Most terms of Measure F and the Public SafetyFramework were implemented on June 18, 2017. The provisions of the Public Safety Frameworkinclude, but are not limited to, revising Tier 2 benefits; allowing rehired Tier 1 employees to remain inTier 1; creating a defined contribution Voluntary Employee Beneficiary Association (VEBA) for retireehealthcare (medical and dental) and a one-time irrevocable election to opt in to the defined contributionVEBA from the defined benefit retiree healthcare plan for eligible employees; defining the qualifications
33 Comprehensive Annual Financial Report 2019-2020 San José Police & Fire Retirement Plan

Notes to the Basic Financial Statements (continued)
NOTE 1 - DESCRIPTION OF THE PLAN (continued)
(a) General (continued)
for members of the independent medical panel; and creating a Guaranteed Purchasing Power benefit forTier 1 retirees. All Tier 1 employees were eligible to opt-in to the VEBA, while all Tier 2 employees andTier 1 employees who enter the Plan after June 18, 2017, with “Classic” membership in California PublicEmployees' Retirement System (CalPERS) were required to move in to the defined contribution VEBA.
The VEBA opt-in election period was October 18, 2017 through December 15, 2017, and the InternalRevenue Service issued favorable private letter rulings to each of the Section 115 Trusts on February 7,2018. The IRS ruled that allowing the contributions to the VEBA to be made from the Sections 115Trusts is consistent with Code Section 115(1) and will not compromise the Section 115 Trusts' statusunder Code Section 115. The contributions for the members who opted in to the VEBA and opted out ofthe defined benefit healthcare plan were transferred in March 2018 for the initial opt-in period. The IRSapproved allowing eligible employees who are rehired into the City from calendars years 2018 through2022 to opt-in to the VEBA if they were not employed during the initial opt-in period. The VEBA is beingadministered by the City, not the Office of Retirement Services, and therefore it is also not under thejurisdiction of the Retirement Board.
The Plan is considered to be a part of the City’s financial reporting entity and is included in the City’sbasic financial statements as a pension and postemployment healthcare trust fund. The Plan isadministered by the Chief Executive Officer of the Office of Retirement Services, an employee of theCity, who serves at the pleasure of the Police and Fire Department Plan Board of Administration (Boardof Administration). The nine-member Board of Administration is composed of two City employeeselected by members of the Plan, two retired Plan members elected by the retiree associations, fourpublic members who are not connected with the City and have significant banking or investmentexperience, and another public member who is selected by the eight Board members and approved bythe City Council. The Board is appointed by the City Council and serves in accordance with Section 2.08,Part 12 of the San José Municipal Code. The contribution and benefit provisions and all otherrequirements are established by City ordinance. The Plan is responsible for all direct administrativecosts except for certain support services, which are provided and funded directly by the City. The Planis not subject to the provisions of the Employee Retirement Income Security Act of 1974.
All sworn officers of the City’s Police and Fire departments are required to be members of the Plan.Participants of the Postemployment Healthcare Plans are also participants of the Defined BenefitPension Plan.
With the passage of Measure F, rehires with prior Tier 1 City service who were in Tier 2, became part ofthe Tier 1 membership in the Defined Benefit Pension Plan effective June 18, 2017. In addition,employees in Tier 2 who have "Classic" membership with CalPERS may be moved to Tier 1 subject tothe identification of these employees and confirmation of "Classic" membership with CalPERS. The Planmembers are categorized into four membership types based on when they entered the Plan. Police Tier1 members are those members who entered the Plan prior to August 4, 2013, Tier 1 rehires who did nottake a return of contributions, or "Classic" CalPERS members. Fire Tier 1 members are those memberswho entered the Plan prior to January 2, 2015, Tier 1 rehires who did not take a return of contributions,or "Classic" CalPERS members. Police Tier 2 members are those employees who were newly hired onor after August 4, 2013. Fire Tier 2 members are those employees who were newly hired on or afterJanuary 2, 2015.
Comprehensive Annual Financial Report 2019-2020 San José Police & Fire Retirement Plan 34

Notes to the Basic Financial Statements (continued)
NOTE 1 - DESCRIPTION OF THE PLAN (continued)
(a) General (continued)
The following table summarizes the Plan members as of June 30, 2020 and 2019, respectively.
As of June 30, 2020 Retirees andBeneficiaries1
Terminated VestedMembers Entitledto Future Benefits Active Members
Defined Benefit Pension Plan Tier 1 Tier 2 Tier 1 Tier 2 Tier 1 Tier 2 TotalPolice Pension & Medical 2 1,374 - 10 - 580 - 1,964
Pension only 3 110 - 182 98 40 427 857
Police Total 1,484 - 192 98 620 427 2,821
Fire Pension & Medical 2 843 - 1 - 495 - 1,339
Pension only 3 53 - 37 7 29 138 264
Fire Total 896 - 38 7 524 138 1,603
Total 2,380 - 230 105 1,144 565 4,424Postemployment HealthcarePlans Tier 14 Tier 1 Tier 1 Total Police 1,374 10 580 1,964
Fire 843 1 495 1,339
Total 2,217 11 1,075 3,303
As of June 30, 2019 Retirees and
Beneficiaries 1
Terminated VestedMembers Entitled to Future Benefits Active Members
Defined Benefit Pension Plan Tier 1 Tier 2 Tier 1 Tier 2 Tier 1 Tier 2 TotalPolice Pension & Medical 2 1,322 - 14 - 630 - 1,966
Pension only 3 110 - 200 74 41 367 792
Police Total 1,432 - 214 74 671 367 2,758
Fire Pension & Medical 2 831 - 2 - 512 - 1,345
Pension only 3 55 - 38 5 29 121 248
Fire Total 886 - 40 5 541 121 1,593
Total 2,318 - 254 79 1,212 488 4,351Postemployment HealthcarePlans Tier 1 4 Tier 1 Tier 1 Total Police 1,322 14 630 1,966
Fire 831 2 512 1,345
Total 2,153 16 1,142 3,311
1 Retiree counts do not include combined domestic relations orders
2 Members are eligible for full retiree medical benefits
3 Includes members that are eligible for catastrophic disability medical benefits only (VEBA) from the Postemployment Healthcare Plan
4 Payees that have health and/or dental coverage
35 Comprehensive Annual Financial Report 2019-2020 San José Police & Fire Retirement Plan

Notes to the Basic Financial Statements (continued)
NOTE 1 - DESCRIPTION OF THE PLAN (continued)
(b) Pension, Disability and Healthcare Benefits
Effective September 30, 1994, the Plan entered into an agreement with CalPERS that extendsreciprocal retirement benefits to members. In certain situations, this agreement could result in improvedretirement benefits for members who move from one eligible retirement system to another.
The following table summarizes the pension, disability and healthcare benefits for Police members.Please consult the Municipal Code for complete information.
Police Tier 1 1 Police Tier 1 Classic 2 Police Tier 2 3
Contributions
Employee 18.70% of base salary (Pension:10.70%, Retiree Healthcare:8.00%) as of 6/30/2019
15.22% of base salary (Pension:11.22%, VEBA: 4.00%) as of 6/30/2019
18.06% of base salary (Pension:14.06%, VEBA: 4.00%)as of 6/30/2019
City 31.43% of base salary (Normalcost) + Flat dollar amount (UAL)as of 6/30/2019
31.43% of base salary (Normalcost) + Flat dollar amount (UAL) as of 6/30/2019
14.06% of base salary (Pension:14.06%) as of 6/30/2019
Service required toleave contributions inretirement plan
10 years of service(20 years must have elapsedfrom date of entry into retirementplan to collect pension)
10 years of service(20 years must have elapsedfrom date of entry into retirementplan to collect pension)
5 years service with the City inthe Police and Fire DepartmentPlan (Years of Service = 2080hours worked within applicable12-month period)
Service Retirement
Age / years of service 50 with 25 years of service55 with 20 years of service 30 years of service at any age(with reciprocity, must be 50years of age)
Mandatory retirement at 70years of age
50 with 25 years of service55 with 20 years of service 30 years of service at any age(with reciprocity, must be 50years of age)
Mandatory retirement at 70years of age
57 with 5 years of service withthe City in the Plan
50 with 5 years of service withthe City in the Plan(A reduction factor of 7.0% peryear for each year between age57 and Tier 2 member's age atretirement, prorated to theclosest month)
Early retirement 50-54 with 20 years of service(discounted pension) Allowance reduced pursuant toMunicipal Code Section3.36.810
50-54 with 20 years of service(discounted pension) Allowance reduced pursuant toMunicipal Code Section3.36.810
N/A
Deferred vestedretirement
55 with 10 years of service onlyif 20 years have elapsed fromdate of membership. (Qualifyingmembers can begin receivingbenefits at age 50 with at least25 years of service.)
55 with 10 years of service onlyif 20 years have elapsed fromdate of membership. (Qualifyingmembers can begin receivingbenefits at age 50 with at least25 years of service.)
At least 5 years of service withthe City in the Plan (This appliesto members who separate fromCity service before retirementand leave their contributions inthe retirement system.)
Can begin at age 50 withreduction factor of 7.0% per yearfor each year between age 57and the Tier 2 member's age atretirement, prorated to theclosest month
Comprehensive Annual Financial Report 2019-2020 San José Police & Fire Retirement Plan 36

Notes to the Basic Financial Statements (continued)
NOTE 1 - DESCRIPTION OF THE PLAN (continued)
(b) Pension, Disability and Healthcare Benefits (continued)
Police Tier 1 1 Police Tier 1 Classic 2 Police Tier 2 3
Allowance First 20 years of City service:50% of Final Compensation(2.5% per year)
Next 21-30 years of City service:4% per year of service x FinalCompensation (90% max)
First 20 years of City service:50% of Final Compensation(2.5% per year)
Next 21-30 years of City service:4% per year of service x FinalCompensation (90% max)
First 20 years of service: 2.4%per year of service x FinalCompensation
Beginning of 21st year ofservice: 3.0% per year ofservice x Final Compensation
Beginning of 26th year ofservice: 3.4% per year of servicex Final Compensation
Final Compensation is theaverage annual base pay plusany premium pays authorized byordinance for the highest 3consecutive years of service
Maximum benefit is 80% of FinalCompensation
Disability Retirement (Service Connected)
Minimum service None None None
Allowance <20 years of service: 50% ofFinal Compensation
Next 21-30 years of service: 4%per year of service x FinalCompensation (90% max)
<20 years of service: 50% ofFinal Compensation
Next 21-30 years of service: 4%per year of service x FinalCompensation (90% max)
An individual who is granted aservice-connected disabilityretirement is entitled to amonthly allowance equal to thegreater of:
i. 50% of Final Compensation
ii. A service retirementallowance, if he or she qualifiedfor such or
iii. An actuarially reduced factor,as determined by the plan'sactuary, for each quarter yearthat his or her service age isless than 50 years, multiplied bynumber of years of servicesubject to the applicableformula, if not qualified for aservice retirement
Disability Retirement (Non-Service Connected)
Minimum service 2 years of service 2 years of service 5 years of service
37 Comprehensive Annual Financial Report 2019-2020 San José Police & Fire Retirement Plan

Notes to the Basic Financial Statements (continued)
NOTE 1 - DESCRIPTION OF THE PLAN (continued)
(b) Pension, Disability and Healthcare Benefits (continued)
Police Tier 1 1 Police Tier 1 Classic 2 Police Tier 2 3
Allowance <20 years of service: 32% ofFinal Compensation plus 1% foreach full year in excess of 2years. (50% max)
>20 years of service: 2.5% xfirst 20 years of service x FinalCompensation
Next 21-30 years of service: 4%per year of service x FinalCompensation (90% max)
<20 years of service: 32% ofFinal Compensation plus 1% foreach full year in excess of 2years. (50% max)
>20 years of service: 2.5% xfirst 20 years of service x FinalCompensation
Next 21-30 years of service: 4%per year of service x FinalCompensation (90% max)
An individual who is granted anon service-connected disabilityretirement is entitled to amonthly allowance equal to thegreater of:
i. If less than age 50: 1.8% peryear of service or
ii. if older than age 50: Theamount of service pensionbenefit as calculated basedupon the service pensionformula
Medical Benefits 4
Eligibility Retired for disability or servicedirectly from active service witheither 15 years of San Joséservice or receive allowance thatis at least 37.5% of FinalCompensation. Also eligible ifmember separates from serviceafter 7/5/92 but prior toretirement with 20 years SanJosé service and leavescontributions in the retirementplan and former memberreceives allowance (i.e., applies& qualifies for retirement)
All Police Tier 1 Classicmembers are mandated tocontribute 4.00% of base salaryto the VEBA. The funds in theVEBA may be used to reimbursepost-retirement out-of-pockethealth care costs on a pre-taxbasis. There is no "vestingperiod" for the VEBA
All Police Tier 2 members aremandated to contribute 4.00% ofbase salary to the VEBA. Thefunds in the VEBA may be usedto reimburse post-retirementout-of-pocket health care costs on a pre-tax basis. There is no"vesting period" for the VEBA
Premiums Retirement Plan pays 100% oflowest cost plan that is availableto active City employees. Ifmember does not choose thelowest cost plan, member paysthe difference between thatpremium and the premium of thelowest cost plan
N/A N/A
Medicare Eligibility At age 65, members will berequired to enroll in Medicareparts A & B. If a member doesnot meet this requirement within6 months of the date memberturns 65, health care benefitswill cease until such requirementare met
N/A N/A
Comprehensive Annual Financial Report 2019-2020 San José Police & Fire Retirement Plan 38

Notes to the Basic Financial Statements (continued)
NOTE 1 - DESCRIPTION OF THE PLAN (continued)
(b) Pension, Disability and Healthcare Benefits (continued)
Police Tier 1 1 Police Tier 1 Classic 2 Police Tier 2 3
Dental Benefits 4
Eligibility Retired for disability or servicefrom active service with either 15years of service or receiveallowance that is at least 37.5%of Final Compensation. Alsoeligible if member leaves Cityservice after 7/5/92 but prior toretirement with 20 years SanJosé service and leavescontributions in retirement planand former member receivesallowance. (i.e., applies forretirement)
All Police Tier 1 Classicemployees are mandated tocontribute 4.00% of base salaryto the VEBA. The funds in theVEBA may be used to reimbursepost-retirement out-of-pockethealth care costs on a pre-taxbasis. There is no "vestingperiod" for the VEBA
All Police Tier 2 employees aremandated to contribute 4.00% ofbase salary to the VEBA. Thefunds in the VEBA may be usedto reimburse post-retirementout-of-pocket health care costs on a pre-tax basis. There is no"vesting period" for the VEBA
Premiums Fully paid by retirement fund N/A N/A
Reciprocity
Reciprocity As of September 30, 1994, theCity of San José adopted areciprocal agreement withCALPERS. This may result inimproved benefits for memberswho transfer between CALPERSand this retirement plan. Finaleligibility for reciprocity isdetermined at the time ofretirement
As of September 30, 1994, theCity of San José adopted areciprocal agreement withCALPERS. This may result inimproved benefits for memberswho transfer between CALPERSand this retirement plan. Finaleligibility for reciprocity isdetermined at the time ofretirement
As of September 30, 1994, theCity of San José adopted areciprocal agreement withCALPERS. This may result inimproved benefits for memberswho transfer between CALPERSand this retirement plan. Finaleligibility for reciprocity isdetermined at the time ofretirement
Cost-of-Living Adjustments (COLA)
COLA Retirees are eligible for a 3%annual cost-of-living adjustment(COLA). Regular COLAs arecompounded and paid eachFebruary. There is no prorationof COLA
Retirees are eligible for a 3%annual cost-of-living adjustment(COLA). Regular COLAs arecompounded and paid eachFebruary. There is no prorationof COLA
Retirees are eligible for anannual cost-of-living adjustment(COLA) limited to the increase inthe Consumer Price Index (SanJosé-San Francisco-Oakland,U.S. Bureau of Labor Statisticsindex, CPI-U, December toDecember), capped at 2.0% per year. The first COLA will beprorated based on the numberof months retired
1 Police Tier 1 employees are those hired before August 4, 2013.
2 Employees with "Classic" membership from a CalPERS or reciprocal agency. A CalPERS "Classic" member is
a member who previously worked for a CalPERS or other reciprocal agency and meets the following criteria:
1. First established CalPERS membership or membership in a CalPERS reciprocal agency prior to January 1,
2013. 2. AND is hired by the City of San José after a break in service of less than six months. 3 AND did not
have concurrent (overlapping) service with the other agency. City of San José Reciprocity election form must
be submitted within thirty days of the first day of employment with the City. Employees in Tier 1 Classic are
not eligible for the defined benefit retiree healthcare plan.
3 Police Tier 2 employees are those hired after August 4, 2013.
4 Employees who opted-in to the VEBA are not eligible for the Defined Benefit Retiree Healthcare Plan (Medical
or Dental Benefits.)
39 Comprehensive Annual Financial Report 2019-2020 San José Police & Fire Retirement Plan

Notes to the Basic Financial Statements (continued)
NOTE 1 - DESCRIPTION OF THE PLAN (continued)
(b) Pension, Disability and Healthcare Benefits (continued)
The following table summarizes the pension, disability and healthcare benefits for Fire members.Please consult the Municipal Code for complete information.
Fire Tier 1 1 Fire Tier 1 Classic 2 Fire Tier 2 3
Contributions
Employee 19.46% of base salary(Pension: 11.46%, RetireeHealthcare: 8.00%) as of6/30/2019
15.98% of base salary(Pension: 11.98% VEBA: 4.00%) as of 6/30/2019
19.39% of base salary(Pension: 15.39%, VEBA: 4.00%)as of 6/30/2019
City 32.25% of base salary(Normal cost) + Flat dollaramount (UAL) as of 6/30/2019
32.25% of base salary(Normal cost) + Flat dollaramount (UAL) as of 6/30/2019
15.39% of base salary(Pension: 15.39%) as of6/30/2019
Service required toleave contributionsin retirement plan
10 years (20 years must haveelapsed from date of entry intoPlan to collect pension)
10 years (20 years must haveelapsed from date of entry intoPlan to collect pension)
5 years of service with the City inthe Plan (Year of Service = 2080hours worked in the applicable 12-month period)
Service Retirement
Age/ years ofservice
50 with 25 years of service55 with 20 years of service 30 years of service at any age(with reciprocity, must be 50years of age)
Mandatory retirement at 70years of age
50 with 25 years of service55 with 20 years of service 30 years of service at any age(with reciprocity, must be 50years of age)
Mandatory retirement at 70 yearsof age
57 with 5 years of service with theCity in the Plan50 with 5 years of service with theCity in the Plan. A reduction factorof 7% per year for each yearbetween age 57 and the Tier 2member's age at retirement,prorated to the closest month
Early retirement 50-54 with 20 years of service(discounted pension)
Allowance reduced pursuant toMunicipal Code Section3.36.810
50-54 with 20 years of service(discounted pension)
Allowance reduced pursuant toMunicipal Code Section 3.36.810
N/A
Deferred vestedretirement
55 with 10 years of service onlyif 20 years have elapsed fromdate of membership. (Qualifyingmember can begin receivingbenefits at age 50 with at least25 years of service)
55 with 10 years of service only if20 years have elapsed from dateof membership. (Qualifyingmember can begin receivingbenefits at age 50 with at least25 years of service)
At least 5 years of service with theCity in the Plan. (This applies tomembers who separate from Cityservice before retirement andleave their contributions in theretirement system.) Can begin atage 50 with reduction factor of 7%per year for each year betweenage 57 and the Tier 2 member'sage at retirement, prorated to theclosest month
Comprehensive Annual Financial Report 2019-2020 San José Police & Fire Retirement Plan 40

Notes to the Basic Financial Statements (continued)
NOTE 1 - DESCRIPTION OF THE PLAN (continued)
(b) Pension, Disability and Healthcare Benefits (continued)
Fire Tier 1 1 Fire Tier 1 Classic 2 Fire Tier 2 3
Allowance First 20 years of service: 50%of Final Compensation (2.5%per year)
Beginning of 21st year ofservice: 3% per year of service xFinal Compensation (90% max)– All years convert to 3% after20 years of service
First 20 years of City service:50% of Final Compensation(2.5% per year)
Beginning of 21st year ofservice: 3% per year of service xFinal Compensation (90% max)– All years convert to 3% after20 years of service
First 20 years of service:2.4% per year of service x FinalCompensation
Beginning of 21st year of service:3.0% per year of service x FinalCompensation
Beginning of 26th year ofservice: 3.4% per year of service xFinal Compensation
Final Compensation is theaverage annual base pay plus anypremium pays authorized byordinance for the highest 3consecutive years of service
Maximum benefit is 80% of FinalCompensation
Disability Retirement (Service Connected)
Minimum service None None None
Allowance < 20 yrs of service: 50% of FinalCompensation
Beginning of 21st year ofservice: 3% per year of service xFinal Compensation (90% max)
>20 years of service: 3% foreach full year x FinalCompensation (90% max)
< 20 yrs of service: 50% of FinalCompensation
Beginning of 21st year ofservice: 3% per year of service xFinal Compensation (90% max)
An individual who is granted aservice connected disabilityretirement is entitled to a monthlyallowance equal to the greater of:
i. 50% of Final Compensation
ii. A service retirement allowance,if he or she qualified for such or
iii. An actuarially reduced factor,as determined by the Plan'sactuary, for each quarter year thathis or her service age is less than50 years, multiplied by the numberof years of service subject to theapplicable formula, if not qualifiedfor a service retirement
Disability Retirement (Non-Service Connected)
Minimum service 2 years of service 2 years of service 5 years of service
Allowance <20 years service: 32% of FinalCompensation plus 1% for eachfull year in excess of 2 years.(50% max)
Beginning of 21st year ofservice: 3% per year of service xFinal Compensation (90% max)
<20 years service: 32% of FinalCompensation plus 1% for eachfull year in excess of 2 years.(50% max)
Beginning of 21st year ofservice: 3% per year of service xFinal Compensation (90% max)
An individual who is granted a nonservice-connected disabilityretirement is entitled to a monthlyallowance equal to the greater of:
i. If less than age 50: 1.8% peryear of service or
ii. If older than age 50: theamount of service pension benefitas calculated based upon theservice pension formula
41 Comprehensive Annual Financial Report 2019-2020 San José Police & Fire Retirement Plan

Notes to the Basic Financial Statements (continued)
NOTE 1 - DESCRIPTION OF THE PLAN (continued)
(b) Pension, Disability and Healthcare Benefits (continued)
Fire Tier 1 1 Fire Tier 1 Classic 2 Fire Tier 2 3
Medical Benefits 4
Eligibility Retired for disability or servicedirectly from active service witheither 15 years of San Joséservice or receive allowance thatis at least 37.5% of FinalCompensation. Also eligible ifmember separates from serviceafter 7/5/92 but prior toretirement with 20 years of SanJosé service and leavescontributions and formermember receives allowance(i.e., applies & qualifies forretirement)
All Fire Tier 1 Classic employeesare mandated to contribute4.00% of base salary to theVEBA. The funds in the VEBAmay be used to reimburse post-retirement out-of-pocket healthcare costs on a pre-tax basis.There is no "vesting period" forthe VEBA
All Fire Tier 2 employees aremandated to contribute 4.00% ofbase salary to the VEBA. Thefunds in the VEBA may be used toreimburse post-retirement out-of-pocket health care costs on a pre-tax basis. There is no "vestingperiod" for the VEBA
Premiums Retirement plan pays 100% oflowest cost plan that is availableto active City employees. Ifmember does not choose thelowest cost plan, member paysthe difference between thatpremium and the premium of thelowest cost plan
N/A N/A
Medicare Eligibility At age 65, members will berequired to enroll in MedicarePart A & B. If a member doesnot meet this requirement within6 months of the date memberturns 65, health care benefitswill cease until suchrequirements are met
N/A N/A
Dental Benefits4
Eligibility Retired for disability or servicedirectly from active service witheither 15 years of service orreceive allowance that is at least37.5% of Final Compensation. Also eligible if member leavesCity service after 7/5/92 but priorto retirement with 20 years ofSan José service and leavescontributions in retirement planand former member receivesallowance (i.e., applies forretirement)
All Fire Tier 1 Classic employeesare mandated to contribute4.00% of base salary to theVEBA. The funds in the VEBAmay be used to reimburse post-retirement out-of-pocket healthcare costs on a pre-tax basis.There is no "vesting period" forthe VEBA
All Fire Tier 2 employees aremandated to contribute 4.00% ofbase salary to the VEBA. Thefunds in the VEBA may be used toreimburse post-retirement out-of-pocket health care costs on apre-tax basis. There is no "vestingperiod" for the VEBA
Premiums Fully paid by retirement fund N/A N/A
Comprehensive Annual Financial Report 2019-2020 San José Police & Fire Retirement Plan 42

Notes to the Basic Financial Statements (continued)
NOTE 1 - DESCRIPTION OF THE PLAN (continued)
(b) Pension, Disability and Healthcare Benefits (continued)
Fire Tier 1 1 Fire Tier 1 Classic 2 Fire Tier 2 3
Reciprocity
Reciprocity As of September 30, 1994, theCity of San José adopted areciprocal agreement withCALPERS. This may result inimproved benefits for memberswho transfer between CALPERSand this retirement plan. Final eligibility for reciprocity isdetermined at the time ofretirement
As of September 30, 1994, theCity of San José adopted areciprocal agreement withCALPERS. This may result inimproved benefits for memberswho transfer between CALPERSand this retirement plan. Final eligibility for reciprocity isdetermined at the time ofretirement
As of September 30, 1994, theCity of San José adopted areciprocal agreement withCALPERS. This may result inimproved benefits for memberswho transfer between CALPERSand this retirement plan. Final eligibility for reciprocity isdetermined at the time ofretirement
Cost-of-Living Adjustment (COLA)
COLA Retirees are eligible for a 3%annual cost-of-living adjustment(COLA). Regular COLAs arecompounded and paid eachFebruary. There is no prorationof COLA
Retirees are eligible for a 3%annual cost-of-living adjustment(COLA). Regular COLAs arecompounded and paid eachFebruary. There is no prorationof COLA
Retirees are eligible for an annualcost-of-living adjustment (COLA)limited to the increase in theConsumer Price Index (San José-San Francisco-Oakland, U.S.Bureau of Labor Statistics index,CPI-U, December to December),capped at 2.0% per year. The firstCOLA will be prorated based onthe number of months retired
1 Fire Tier 1 are those hired before January 2, 2015.
2 Employees with "Classic" membership from a CalPERS or reciprocal agency. A CalPERS "Classic" member is
a member who previously worked for a CalPERS or other reciprocal agency and meets the following criteria:
1. First established CalPERS membership or membership in a CalPERS reciprocal agency prior to January 1,
2013, 2. AND is hired by the City of San José after a break in service of less than six months, 3. AND did not
have concurrent (overlapping) service with the other agency. City of San José Reciprocity Election Form
must be submitted within thirty days of the first day of employment with the City. Employees in Tier 1 Classic
are not eligible for the defined benefit retiree healthcare plan.
3 Fire Tier 2 Employees are those hired after January 2, 2015.
4 Employees who opted-in to the VEBA are not eligible for the Defined Benefit Retiree Healthcare Plan (Medical
or Dental Benefits).
43 Comprehensive Annual Financial Report 2019-2020 San José Police & Fire Retirement Plan

Notes to the Basic Financial Statements (continued)
NOTE 1 - DESCRIPTION OF THE PLAN (continued)
(c) Death Benefits
The following table summarizes the survivorship pension and health benefits for Police Tier 1. Pleaseconsult the Municipal Code for complete information.
Police Tier 1 / Tier 1 ClassicDeath Before Retirement
Non-service connected death with lessthan 2 years of service
Return of contributions, plus interest, to surviving spouse/domestic partner,surviving children, or estate or $1,000, whichever is greater
Non-service connected death withmore than 2 years of service, but noteligible for a service retirement
To surviving spouse/domestic partner:24% + 0.75% for each year in excess of 2 years x Final Compensation (37.5% maximum)
And to surviving children:1 Child: Final Compensation x 25.0% 2 Children: Final Compensation x 37.5% 3 or more children: Final Compensation x 50.0%
If no surviving spouse/domestic partner nor surviving children: Return of contributions, plus interest, to estate or $1,000 whichever is greater
Non-service connected death beforeretirement, but while eligible forservice retirement
To surviving spouse/domestic partner: 37.5% to 42.5% of member’s FinalCompensation depending on the years of service
For example:Member’s benefit = 76.0% Survivorship benefit = 38.0% of Final CompensationMember’s benefit = 80.0% Survivorship benefit = 40.0% of Final CompensationMember’s benefit = 82.0% Survivorship benefit = 41.0% of Final CompensationMember’s benefit = 85.0% Survivorship benefit = 42.5% of Final Compensation
And to surviving children:1 Child: Final Compensation x 25.0% 2 Children: Final Compensation x 37.5% 3 or more children: Final Compensation x 50.0%
If no surviving spouse/domestic partner nor surviving children: Return of contributions, plus interest, to estate or $1,000, whichever is greater
Service connecteddeath regardless of years of service
To surviving spouse/domestic partner: 37.5% to 42.5% of member’s FinalCompensation depending on years of service
And to surviving children:1 Child: Final Compensation x 25.0% 2 Children: Final Compensation x 50.0% 3 or more children: Final Compensation x 75.0%
If no surviving spouse/domestic partner nor surviving children: Return of contributions, plus interest, to estate or $1,000, whichever is greater
Death After Retirement
Service retirement and serviceconnected disability retirees
To surviving spouse/domestic partner: 37.5% to 42.5% of member’s FinalCompensation depending on years of service
And to surviving children:1 Child: Final Compensation x 25.0% 2 Children: Final Compensation x 37.5% 3 or more children: Final Compensation x 50.0%
If no surviving spouse/domestic partner nor surviving children: $1,000 death benefit to estate
Comprehensive Annual Financial Report 2019-2020 San José Police & Fire Retirement Plan 44

Notes to the Basic Financial Statements (continued)
NOTE 1 - DESCRIPTION OF THE PLAN (continued)
(c) Death Benefits (continued)
Police Tier 1 / Tier 1 ClassicNon-service connected disabilityretirees
To surviving spouse/domestic partner:
Police Tier 1: 37.5% to 42.5% of member's Final Compensation depending on theyears of service and date of retirement
Police Tier 1 Classic: Final Compensation x 24.0% + 0.75% for each year inexcess of 2 years (37.5% maximum)
And to surviving children:1 Child: Final Compensation x 25.0% 2 Children: Final Compensation x 37.5% 3 or more children: Final Compensation x 50.0%
If no surviving spouse/domestic partner nor surviving children: $1,000 deathbenefit to estate
Optional Settlements
Optional settlements Retiree may choose an optional settlement at retirement that reduces their allow-ance to provide a higher survivorship allowance to their spouse/domestic partner
Post-Retirement Marriage
Post-retirement marriage If a retiree marries after retirement, the retiree can elect to take a reduction on theirpension benefit in order to allow for a survivorship benefit to the survivingspouse/domestic partner. This election must be made within 30 days of marriageor establishment of domestic partnership
Note: The maximum total combined benefit payable to a surviving spouse/domestic partner and surviving children is
75% of final compensation. If necessary, the children's survivorship allowance will be reduced so that the total
benefit does not exceed 75% of final compensation.
The following table summarizes the survivorship pension and health benefits for Police Tier 2. Pleaseconsult the Municipal Code for complete information.
Police Tier 2Death Before Retirement
Non-service connected deathwith less than 2 years of services
Greater of:
(1) Return of contributions, plus interest, to surviving spouse/domestic partner;where there is no surviving spouse/domestic partner to member's survivingchildren, or where there are no surviving children either, to the member's estate or
(2) $1,000, whichever is greater
Non-service connected death withmore than 2 years of service, but noteligible for a service retirement
To surviving spouse/domestic partner:24% of Final Compensation + 0.75% of Final Compensation for each year inexcess of 2 years of service (37.5% maximum)
And to surviving children:1 Child: Final Compensation x 25.0%2 Children : Final Compensation x 37.5%3 or more children: Final Compensation x 50.0%
There is an 80% cap on Final Compensation that can be paid to survivors.
If no surviving spouse/domestic partner nor surviving children, to the estate:Return of contributions, plus interest, or $1,000 whichever is greater
45 Comprehensive Annual Financial Report 2019-2020 San José Police & Fire Retirement Plan

Notes to the Basic Financial Statements (continued)
NOTE 1 - DESCRIPTION OF THE PLAN (continued)
(c) Death Benefits (continued)
Police Tier 2Non-service connected death beforeretirement, but while eligible forservice retirement
To surviving spouse/domestic partner:37.5% to 42.5% of member's Final Compensation depending on the years ofservice
For example: Member's benefit = 76.0% Survivorship benefit = 38.0% of Final CompensationMember's benefit = 80.0% Survivorship benefit = 40.0% of Final CompensationMember's benefit = 82.0% Survivorship benefit = 41.0% of Final CompensationMember's benefit = 85.0% Survivorship benefit = 42.5% of Final Compensation
And to surviving children:1 Child: Final Compensation x 25.0%2 Children: Final Compensation x 37.5%3 or more children: Final Compensation x 50.0%
If no surviving spouse/domestic partner nor surviving children, to the estate: Returnof contributions, plus interest, or $1,000, whichever is greater
Service Connected Death
Service connected death regardless ofyears of service
To surviving spouse/domestic partner:37.5% to 42.5% of member's Final Compensation depending on years of service
And to surviving children:1 Child: Final Compensation x 25.0%2 Children: Final Compensation x 50.0%3 or more children: Final Compensation x 75.0%
There is an 80.0% cap on Final Compensation that can be paid to survivors
If no surviving spouse/domestic partner nor surviving children, to the estate: Returncontributions, plus interest, or $1,000 whichever is greater
Death After Retirement
Service retirees To surviving spouse/domestic partner:Survivorship allowance equal to 50.0% joint and survivor annuity as determined bythe plan's actuaries
Optional Settlements
Optional settlements Retiree may choose an optional settlement at retirement that reduces theirallowance to provide a higher survivorship allowance to their spouse/domesticpartner
Post-Retirement Marriage
Post-retirement marriage If a retiree marries after retirement, the retiree can elect to take a reduction on theirpension benefit in order to allow for a survivorship benefit to the survivingspouse/domestic partner
Note: The maximum total combined benefit payable to a surviving spouse/domestic partner and surviving children is
80% of final compensation. If necessary, children's survivorship allowance will be reduced so that the total benefit
does not exceed 80% of final compensation.
Comprehensive Annual Financial Report 2019-2020 San José Police & Fire Retirement Plan 46

Notes to the Basic Financial Statements (continued)
NOTE 1 - DESCRIPTION OF THE PLAN (continued)
(c) Death Benefits (continued)
The following table summarizes the survivorship pension and health benefits for Fire Tier 1. Pleaseconsult the Municipal Code for complete information.
Fire Tier 1 / Tier 1 ClassicDeath Before Retirement
Non-service connected death with lessthan 2 years of service
Return of contributions, plus interest, to surviving spouse/domestic partner,surviving children, or estate or $1,000, whichever is greater
Non-service connected death withmore than 2 years of service, but noteligible for a service retirement
To surviving spouse/domestic partner:24% to 75% for each year in excess of 2 x Final Compensation (45% maximum)
And to surviving children :1 Child: Final Compensation x 25.0% 2 Children: Final Compensation x 37.5% 3 or more children: Final Compensation x 50.0%
If no surviving spouse/domestic partner nor surviving children: Return of contributions, plus interest, to estate or $1,000, whichever is greater
Non-service connected death beforeretirement, but while eligible forservice retirement
To surviving spouse/domestic partner:37.5% to 45.0% of member’s Final Compensation depending on years of service
For example:Member’s benefit = 81.0% Survivorship benefit = 40.5% of Final CompensationMember’s benefit = 84.0% Survivorship benefit = 42.0% of Final CompensationMember’s benefit = 87.0% Survivorship benefit = 43.5% of Final CompensationMember’s benefit = 90.0% Survivorship benefit = 45.0% of Final Compensation
And to surviving children:1 Child: Final Compensation x 25.0% 2 Children: Final Compensation x 37.5% 3 or more children: Final Compensation x 50.0%
If no surviving spouse/domestic partner nor surviving children: Return of contributions, plus interest, to estate or $1,000, whichever is greater
Service connected death regardless ofyears of service
To surviving spouse/domestic partner :37.5% to 45% for member's Final Compensation depending on the years ofservice
And to surviving children:1 Child: Final Compensation x 25.0% 2 Children: Final Compensation x 37.5% 3 or more children: Final Compensation x 50.0%
If no surviving spouse/domestic partner nor surviving children: Return of contributions, plus interest, to estate or $1,000, whichever is greater
Death After Retirement
Service retirees and service connecteddisability retirees
To surviving spouse/domestic partner:37.5% to 45.0% of member’s Final Compensation depending on years of service
And to surviving children:1 Child: Final Compensation x 25.0% 2 Children: Final Compensation x 37.5% 3 or more children: Final Compensation x 50.0%
If no surviving spouse/domestic partner nor surviving children: $1,000 death benefit to estate
47 Comprehensive Annual Financial Report 2019-2020 San José Police & Fire Retirement Plan

Notes to the Basic Financial Statements (continued)
NOTE 1 - DESCRIPTION OF THE PLAN (continued)
(c) Death Benefits (continued)
Fire Tier 1 / Tier 1 ClassicNon-service connected disabilityretirees
To surviving spouse/domestic partner:
Fire Tier 1: 37.5% to 45% of member's Final Compensation depending on theyears of service and date of retirement
Fire Tier 1 Classic: Final Compensation x 24.0% + 0.75% for each year in excessof 2 years (37.5% maximum)
And to surviving children:1 Child: Final Compensation x 25.0% 2 Children: Final Compensation x 37.5% 3 or more children: Final Compensation x 50.0%
If no surviving spouse/domestic partner nor surviving children: $1,000 deathbenefit to estate
Optional Settlements
Optional settlements Retiree may choose an optional settlement at retirement that reduces theirallowance to provide a higher survivorship allowance to their spouse/domesticpartner
Post-Retirement Marriage
Post-retirement marriage If a retiree marries after retirement, the retiree can elect to take a reduction of theirpension benefit in order to allow for a survivorship benefit to the survivingspouse/domestic partner
Note: The maximum total combined benefit payable to a surviving spouse/domestic partner and surviving children is
75% of final compensation. If necessary, the children's survivorship allowance will be reduced so that the total
benefit does not exceed 75% of final compensation.
The following table summarizes the survivorship pension and health benefits for Fire Tier 2. Pleaseconsult the Municipal Code for complete information.
Fire Tier 2Death Before Retirement
Service connected death regardless ofyears of service
To surviving spouse/domestic partner:37.5% to 45.0% of member's Final Compensation depending on the years ofservice
And to surviving children:1 Child: Final Compensation x 25.0%2 Children: Final Compensation x 50.0%3 or more children: Final Compensation x 75.0%
There is an 80.0% cap on Final Compensation that can be paid to survivors
If no surviving spouse/domestic partner nor surviving children, to the estate: Return of contributions, plus interest, or $1,000, whichever is greater
Non-service connected death with lessthan 2 years of service
Greater of:
(1) Return of contributions, plus interest, to surviving spouse/domestic partner;where there is no surviving spouse/domestic partner to member's survivingchildren, or where there are no surviving children either, to the member's estate, or
(2) $1,000, whichever is greater
Comprehensive Annual Financial Report 2019-2020 San José Police & Fire Retirement Plan 48

Notes to the Basic Financial Statements (continued)
NOTE 1 - DESCRIPTION OF THE PLAN (continued)
(c) Death Benefits (continued)
Fire Tier 2Non-service connected death withmore than 2 years of service, but noteligible for a service retirement
To surviving spouse/domestic partner:24.0% + 0.75% for each year in excess of 2 years x Final Compensation (45% maximum)
And to surviving children:1 Child: Final Compensation x 25.0%2 Children: Final Compensation x 37.5%3 or more children: Final Compensation x 50.0%
There is an 80.0% cap on Final Compensation that can be paid to survivors
If no surviving spouse/domestic partner nor surviving children to the estate:Return of contributions, plus interest, or $1,000 whichever is greater
Non-service connected death beforeretirement, but while eligible forservice retirement
To surviving spouse/domestic partner:37.5% to 45.0% of member's Final Compensation depending on the years ofservice
For example:Member's benefit = 81.0% Survivorship benefit = 40.5% of Final CompensationMember's benefit = 84.0% Survivorship benefit = 42.0% of Final CompensationMember's benefit = 87.0% Survivorship benefit = 43.5% of Final CompensationMember's benefit = 90.0% Survivorship benefit = 45.0% of Final Compensation
And to surviving children:1 Child: Final Compensation x 25.0%2 Children: Final Compensation x 37.5%3 or more children: Final Compensation x 50%
If no surviving spouse/domestic partner nor surviving children, to the estate:Return of contributions, plus interest, or $1,000, whichever is greater
Death After Retirement
Service retirees To surviving spouse/domestic partner:Survivorship allowance equal to 50.0% joint and survivor annuity as determined bythe Plan's actuaries
Non-service connected disabilityretirees
To surviving spouse/domestic partner:Survivorship allowance equal to 50.0% joint and survivor annuity as determined bythe Plan's actuaries
Optional Settlements
Optional settlements Retiree may choose an optional settlement at retirement that reduces theirallowance to provide a higher survivorship allowance to their spouse/domesticpartner
Post-Retirement Marriage
Post-retirement marriage If a retiree marries after retirement, the retiree can elect to take a reduction on theirpension benefit in order to allow for a survivorship benefit to the survivingspouse/domestic partner
Note: The maximum total combined benefit payable to a surviving spouse/domestic partner and surviving children is
80% of final compensation. If necessary, the children's survivorship allowance will be reduced so that the total
benefit does not exceed 80% of final compensation.
49 Comprehensive Annual Financial Report 2019-2020 San José Police & Fire Retirement Plan

Notes to the Basic Financial Statements (continued)
NOTE 2 - SUMMARY OF SIGNIFICANT ACCOUNTING POLICIES
(a) Basis of Presentation
The accompanying financial statements present only the financial activities of the Plan in conformity withaccounting principles generally accepted in the United States of America (U.S. GAAP). The financialstatements of the Plan are intended to present only the plan net position and changes in plan netposition of the Plan. They do not purport to, and do not, present fairly the financial position of the City ofSan José, California, as of June 30, 2020 and 2019, and the changes in its financial position for theyears then ended in conformity with U.S. GAAP. The Plan is reported in a pension and postemploymenthealthcare trust fund in the City of San José’s basic financial statements.
(b) Basis of Accounting
The financial statements of the Plan are prepared on the accrual basis of accounting. Contributions arerecognized as revenue when due pursuant to legal requirements. Benefits and refunds of contributionsare recognized when currently due and payable under the provisions of the Plan. Activities of theDefined Benefit Pension Plan and the Postemployment Healthcare Plans are accounted for separately.It is required by the Municipal Code that transactions of the Defined Benefit Pension Plan be accountedfor in two funds: a Retirement Fund and a Cost-of-Living Fund.
The preparation of the financial statements in conformity with GAAP requires management to makecertain estimates and assumptions that affect certain reported amounts and disclosures. Actual resultscould differ from those estimates.
(c) Investments
The City of San José Municipal Code Charter Section 3.36.530 delegates authority to the Board ofAdministration to invest the monies of the Plan as provided in Section 3.36.540. The Board has adopteddetailed investment guidelines consistent with conditions and limitations set forth in Section 3.36.540.
For the year ended June 30, 2020 and 2019, the Defined Benefit Pension Plan investment policy wasupdated, as shown in the following table, which the Board reviewed and approved on May 7, 2020 andon April 4, 2019, respectively. The new asset allocation was prepared to align with the long-termexpected returns of the underlying asset classes and the Plan’s adopted actuarial assumed rate ofreturn as utilized in the June 30, 2019 valuations.
The Plan’s investment allocation for year ended June 30, 2020 and 2019 are as follows:
PENSION As of June 30,
Asset Class
2020Target Asset
Allocation
2019Target Asset
Allocation Asset Class
2020Target Asset
Allocation
2019Target Asset
AllocationPublic equity 46% 31% Long-term government bonds 3% 0%
Investment grade bonds 12% 20% Market neutral strategies 3% 7%
Private equity 6% 8% Private debt 3% 4%
Core real estate 5% 5% Private real assets 3% 3%
Immunized cash flows 5% 5% High yield bonds 2% 0%
Venture / growth capital 4% 4%Treasury inflation-protectedsecurities
2% 2%
Emerging market bonds 3% 3% Commodities 0% 2%
Growth real estate 3% 3% Sovereign bonds ex US 0% 3%
Comprehensive Annual Financial Report 2019-2020 San José Police & Fire Retirement Plan 50

Notes to the Basic Financial Statements (continued)
NOTE 2 - SUMMARY OF SIGNIFICANT ACCOUNTING POLICIES (continued)
(c) Investments (continued)
On April 4, 2018, the Board adopted the following asset allocation for the 115 healthcare trusts. ThePostemployment Healthcare plan investment policy was originally approved August 7, 2014. While theinvestment policy has not been updated, the presentation of investments throughout the financialstatements for 2020 and 2019 have been reclassified to reflect the pension's asset allocation for easierpresentation and comparison. The asset classes in the healthcare policy are broad classifications whichwere further broken down to more specific allocation to align with the pension asset classification.
HEALTHCARE
As of June 30, 2020 As of June 30, 2019
Asset ClassMinimumAllocation
TargetAsset
AllocationMaximumAllocation
MinimumAllocation
TargetAsset
AllocationMaximumAllocation
Global equity 25% 43% 50% 25% 43% 50%
Real assets 12% 22% 25% 12% 22% 25%
Global tactical asset allocation 0% 20% 25% 0% 20% 25%
Global fixed income 5% 15% 25% 5% 15% 25%
Cash and cash equivalents 0% 0% 5% 0% 0% 5%
The real assets category includes allocations to commodities, real estate, and other infrastructure assets. The global tactical
asset category is currently comprised of two global tactical asset allocation managers who run unconstrained global portfolios.
Investments are reported at fair value. Securities traded on a national or international exchange arevalued at the last reported sales price on the last business day of the fiscal year at current exchangerates, if applicable. Investments that do not have an established market, such as private equity,commingled real estate funds and certain pooled fund investments, are reported at estimated fair valuebased on the most recently available investor reports or audited financial statements issued by themanager of those funds. The fund manager provides an estimated unrealized gain/loss of the fundbased on the most recently available audited financial statements and other fund information. See Note3 starting on page 55 for more detailed information on the fair value of investments.
The fair value of derivative investments that are not exchange traded, such as swaps and rights isdetermined by the Plan's custodian bank based on the base fair value of similar instruments. Futurescontracts are marked-to-market at the end of each trading day, and the settlement of gains or lossesoccur on the following business day through variation margins. The fair value of international currencyforwards represents the unrealized gain or loss on the related contracts, which is calculated based onthe difference between the specified contract exchange rate and the exchange rate at the end of thereporting period.
Purchases and sales of securities are reflected on the trade date. Investment income is recognized asearned. Rental income is recognized as earned, net of expenses.
Investment expenses presented within the accompanying financial statements consist of managementand performance fees and other investment-related fees. Other investment-related fees includeexpenses for shared investment-related administration, consultants, custody, and legal services. Thesefees are disclosed within the Investment Expenses in the Statement of Changes in Plan Net Position anddetailed in the Investment Expenses Schedule in the Other Supplemental Information section.
51 Comprehensive Annual Financial Report 2019-2020 San José Police & Fire Retirement Plan

Notes to the Basic Financial Statements (continued)
NOTE 2 - SUMMARY OF SIGNIFICANT ACCOUNTING POLICIES (continued)
(c) Investments (continued)
The investment expenses do not include the commissions and fees paid to transact public securities.Partnership management fees paid for the private equity program are drawn from the committed capitaland reported as an increase in the cost basis. These fees and costs are included within the net assetvalue (NAV) or public securities cost and are also reported in the net appreciation/(depreciation) in fairvalue of investments line items on the financial statements.
For the years ended June 30, 2020 and 2019, the annual money-weighted rate of return on pension planinvestments, net of pension plan investment expense, was 2.98% and 4.00%, respectively. For the yearended June 30, 2020 and 2019, the annual money-weighted rate of return on healthcare planinvestments, net of healthcare plan investment expenses, was 1.95% and 4.86%. The money-weightedrate of return expresses investment performance, net of investment expense, adjusted for the changingamounts actually invested.
(d) Capital Assets
Capital assets are recorded at cost and comprise of all costs related to the development of a newpension administration system. Total costs are allocated to both the Federated System and the Plan.The capital asset went into production on February 1, 2019 and is being amortized using the straight linemethod of amortization over a 10 year period ending 2029. For fiscal year ended 2020 and 2019, theamortization expense was $408,727 and $133,809, respectively . It is being amortized per GASBStatement No. 51, Accounting and Financial Reporting for Intangible Assets.
Capital asset and accumulated amortizationAs of June
30, 2019 Additions DeletionsAs of June
30, 2020
Capital assets, amortizable:
Pension administration system $ 3,211 $ 876 $ - $ 4,087
Total capital asset, cost 3,211 876 - 4,087
Less accumulated amortization for:
Pension administration system (134) (408) - (542)
Total accumulated amortization (134) (408) - (542)
Capital assets, net of accumulated amortization $ 3,077 $ 468 $ - $ 3,545
Capital asset and accumulated amortizationAs of June
30, 2018 Additions DeletionsAs of June
30, 2019
Captial assets, amortizable:
Pension administration system $ 1,755 $ 1,456 $ - $ 3,211
Total capital asset, cost 1,755 1,456 - 3,211
Less accumulated amortization for:
Pension administration systems - (134) - (134)
Total accumulated amortization - (134) - (134)
Captial assets, net of accumulated amortization $ 1,755 $ 1,322 $ - $ 3,077
(e) Plan Net Position Restricted for Pension and Postemployment Healthcare Benefits
The Plan is required by the City of San José Municipal Code to establish various reserves in the plan netposition. The plan net position is allocated between the Defined Benefit Pension Plan (which includesthe Retirement Fund and the Cost-of-Living Fund) and the Postemployment Healthcare Plans (whichinclude the 401(h) and the two 115 Subtrusts).
Comprehensive Annual Financial Report 2019-2020 San José Police & Fire Retirement Plan 52

Notes to the Basic Financial Statements (continued)
NOTE 2 - SUMMARY OF SIGNIFICANT ACCOUNTING POLICIES (continued)
(e) Plan Net Position Restricted for Pension and Postemployment Healthcare Benefits(continued)
As of June 30, 2020 and 2019, plan net position totaling $3,910,552,000 and $3,774,379,000,respectively, is allocated as follows (in thousands):
RetirementFund
Cost-of-LivingFund
TotalDefinedBenefitPension
Plan
Post-employ-
mentHealth -
care401(h)
PoliceDepart-ment
Health -care
Subtrust
FireDepart-ment
Health -care
SubtrustTotalOPEB
GrandTotal
June 30, 2020Employeecontributions reserve$ 357,559 $ 87,243 $ 444,802 $ - $ - $ - $ - $ 444,802
General reserve 1,825,941 1,431,277 3,257,218 28,747 110,541 68,542 207,830 3,465,048
Retiree healthcarein-lieu premiumcredit - - - 702 - - 702 702
Total $2,183,500 $1,518,520 $3,702,020 $ 29,449 $ 110,541 $ 68,542 $ 208,532 $3,910,552
June 30, 2019Employeecontributions reserve$ 344,518 $ 84,510 $ 429,028 $ - $ - $ - $ - $ 429,028
General reserve 1,801,715 1,357,679 3,159,394 36,508 92,255 56,852 185,615 3,345,009
Retiree healthcarein-lieu premiumcredit - - - 342 - - 342 342
Total $2,146,233 $1,442,189 $3,588,422 $ 36,850 $ 92,255 $ 56,852 $ 185,957 $3,774,379
Employee Contributions Reserve represents the total accumulated employee contributions of currentactive and deferred members plus credited interest. The reserve is accounted for separately due to thepossibility of a return of accumulated employee contributions, plus credited interest, to the member uponseparation from City employment. Terminated members’ returns of contributions are paid from theDefined Benefit Pension Plan only. No employee contributions are paid out of the healthcare plans'reserves.
General Reserve is a reserve that represents net earnings resulting from interest earnings, employercontributions, and realized and unrealized investment gains and losses. It also represents anaccumulation of funds necessary to pay all accumulated vested retirement obligations.
(f) Allocation of Investment Income
Earnings on investments, excluding unrealized gains and losses, are recorded first in the generalreserve category of plan net position. An allocation is made semi-annually from the general reservecategory to the employee contributions category of plan net position based on the balance in thataccount at an annual rate of 2%, as specified by the City of San José Municipal Code.
(g) Implementation of Governmental Accounting Standards Board (GASB) Statements
GASB Statement No. 92, Omnibus 2020 was issued by January 2020. The objectives of this Statementare to enhance comparability in accounting and financial reporting and to improve the consistency ofauthoritative literature by addressing practice issues that have been identified during implementation andapplication of certain GASB Statements. This Statement addresses a variety of topics and includesspecific provisions about the following: 1) The effective date of Statement No. 87, Leases, andImplementation Guide No. 2019-3, Leases, for interim financial reports, 2) Reporting of intra-entity
53 Comprehensive Annual Financial Report 2019-2020 San José Police & Fire Retirement Plan

Notes to the Basic Financial Statements (continued)
NOTE 2 - SUMMARY OF SIGNIFICANT ACCOUNTING POLICIES (continued)
(g) Implementation of Governmental Accounting Standards Board (GASB) Statements(continued)
transfers of assets between a primary government employer and a component unit defined benefitpension plan or defined benefit other postemployment benefit (OPEB) plan, 3) The applicability ofStatements No. 73, Accounting and Financial Reporting for Pensions and Related Assets That Are Notwithin the Scope of GASB Statement 68, and Amendments to Certain Provisions of GASB Statements67 and 68, as amended, and No. 74, Financial Reporting for Postemployment Benefit Plans Other ThanPension Plans, as amended, to reporting assets accumulated for postemployment benefits, 4) Theapplicability of certain requirements of Statement No. 84, Fiduciary Activities, to postemployment benefitarrangements, 5) Measurement of liabilities (and assets, if any) related to asset retirement obligations(AROs) in a government acquisition, 6) Reporting by public entity risk pools for amounts that arerecoverable from reinsurers or excess insurers, 7) Reference to nonrecurring fair value measurementsof assets or liabilities in authoritative literature and 8) Terminology used to refer to derivativeinstruments. The requirements of this Statement are effective for reporting periods beginning after June15, 2020, except Statement No. 87 which is effective upon issuance. Based on the GASB StatementNo. 95, the Plan will adopt the provisions of Statement No. 92 for the fiscal year beginning with July 1,2021.
GASB Statement No. 93, Replacement of Interbank Offered Rates, was issued in March 2020. Theobjective of this Statement is to address those and other accounting and financial reporting implicationsthat result from replacement of an IBOR. Some governments have entered into agreements in whichvariable payments made or received depend on an interbank offered rate (IBOR)—most notably, theLondon Interbank Offered Rate (LIBOR). As a result of global reference rate reform, LIBOR is expectedto cease to exist in its current form at the end of 2021, prompting governments to amend or replacefinancial instruments for the purpose of replacing LIBOR with other reference rates, by either changingthe reference rate or adding or changing fallback provisions related to the reference rate. The removal ofLIBOR as an appropriate benchmark interest rate is effective for reporting periods ending afterDecember 31, 2021. All other requirements of this Statement are effective for reporting periodsbeginning after June 15, 2020. Based on the GASB Statement No. 95, the Plan will adopt the provisionsof Statement No. 93 for the fiscal year beginning with July 1, 2021.
GASB Statement No. 95, Postponement of the Effective Dates of Certain Authoritative Guidance, wasissued in May 2020. The primary objective of this Statement is to provide temporary relief togovernments and other stakeholders in light of the COVID-19 pandemic. That objective is accomplishedby postponing the effective dates of certain provisions in Statements and Implementation Guides thatfirst became effective or are scheduled to become effective for periods beginning after June 15, 2018,and later. The effective dates of certain provisions contained in the following pronouncements arepostponed by one year: 1) Statement No. 83, Certain Asset Retirement Obligations, 2) Statement No.84, Fiduciary Activities, 3) Statement No. 88, Certain Disclosures Related to Debt, including DirectBorrowings and Direct Placements, 4) Statement No. 89, Accounting for Interest Cost Incurred beforethe End of a Construction Period, 5) Statement No. 90, Majority Equity Interests, 6) Statement No. 91,Conduit Debt Obligations, 7) Statement No. 92, Omnibus 2020, and 8) Statement No. 93, Replacementof Interbank Offered Rates. The effective date of GASB Statement No. 87, Leases, are postponed by18 months. Each affected GASB Statement reflects the postponement effective date within the aboveStatement.
Comprehensive Annual Financial Report 2019-2020 San José Police & Fire Retirement Plan 54

Notes to the Basic Financial Statements (continued)
NOTE 2 - SUMMARY OF SIGNIFICANT ACCOUNTING POLICIES (continued)
(g) Implementation of Governmental Accounting Standards Board (GASB) Statements(continued)
GASB Statement No. 96, Subscription-Based Information Technology Arrangements, was issued inMary 2020. This Statement provides guidance on the accounting and financial reporting for subscription-based information technology arrangements (SBITAs) for government end users (governments). ThisStatement (1) defines a SBITA; (2) establishes that a SBITA results in a right-to-use subscriptionasset—an intangible asset—and a corresponding subscription liability; (3) provides the capitalizationcriteria for outlays other than subscription payments, including implementation costs of a SBITA; and (4)requires note disclosures regarding a SBITA. To the extent relevant, the standards for SBITAs arebased on the standards established in Statement No. 87, Leases, as amended. The requirements of thisStatement are effective for fiscal years beginning after June 15, 2022, and all reporting periodsthereafter. The Plan will adopt the provisions of Statement No. 95 for the fiscal year beginning with July1, 2021.
NOTE 3 - INVESTMENTS
Investments are subject to certain types of risks, including interest rate risk, custodial credit risk, creditquality risk, foreign currency risk, and concentration of credit risk. The following describes those risks:
Interest Rate Risk – The fair value of fixed income investments fluctuates in response to changes inmarket interest rates. Increases in prevailing interest rates generally translate into decreases in fairvalue of those instruments. The fair value of interest-sensitive instruments may also be affected by thecreditworthiness of the issuer, prepayment options, and other general interest rate conditions. Certainfixed income investments have call provisions that could result in shorter maturity periods. The Plandoes not have a policy regarding interest rate risk. However, the Plan does settle on a transaction plusone day basis (T+1), therefore limiting the Plan's exposure to counterparty risk.
Market Risk - General market risk factors exist that could cause depreciation or appreciation of thePlan's investment portfolio. These risks include general, economic, political and regulatory risks. ThePlan's investments may be impacted by changes caused by global and domestic market conditions andindustry-specific economic and regulatory conditions. With the recent volatility of the global financialmarkets amidst the COVID-19 pandemic, such market risks of growing unemployment, changes inconsumer behavior, volatility in various other financial market rates and general economic slowdown ofall sectors may have a significant impact to the underling investments within the Plan's investmentportfolio.
55 Comprehensive Annual Financial Report 2019-2020 San José Police & Fire Retirement Plan

Notes to the Basic Financial Statements (continued)
NOTE 3 - INVESTMENTS (continued)
The following tables provide the segmented time distribution for fixed income investments based onexpected maturity (in months and years) as of June 30, 2020 and 2019.
INVESTMENT MATURITIES AT FAIR VALUEAs of June 30, 2020 (In Thousands)
0 - 3Months
3 - 6Months
6 Months- 1 Year
1 - 5Years
5 - 10Years
More than10 Years
Total FairValue Cost
Investment gradebonds $ 3,268 $ 1,037 $ 2,232 $ 24,275 $ 276,967 $ 17,510 $ 325,289 $ 320,793
Immunized cash flows 9,925 12,826 23,486 117,373 - - 163,610 157,873
Emerging marketbonds - - - - 117,056 - 117,056 82,252
Long-termgovernment bonds - - - - - 111,450 111,450 113,000
Treasury inflation-protected securities 3,448 - 8,926 62,439 - - 74,813 71,729
High yield bonds 72 - - 74,217 - - 74,289 75,000
Cash and cashequivalents 69,050 - - - - - 69,050 69,050
Short-term investmentgrade bonds 51,249 - - - - - 51,249 51,248
TOTAL FIXEDINCOME $ 137,012 $ 13,863 $ 34,644 $ 278,304 $ 394,023 $ 128,960 $ 986,806 $ 940,945
INVESTMENT MATURITIES AT FAIR VALUEAs of June 30, 2019 (In Thousands)
0 - 3Months
3 - 6Months
6 Months- 1 Year
1 - 5Years
5 - 10Years
More than10 Years
Total FairValue Cost
Immunized cash flows $ 5,802 $ 9,320 $ 15,209 $ 148,645 $ - $ - $ 178,976 $ 178,363
Emerging marketbonds - - - - 116,277 - 116,277 91,077
Treasury inflation-protected securities 2,171 - 9,312 62,717 - - 74,200 73,190
High yield bonds 90 - - 17,588 - - 17,678 2,555
Cash and cashequivalents 51,340 - - - - - 51,340 51,340
Short-term investmentgrade bonds 722,360 - - - - - 722,360 722,342
Sovereign bonds exUS - - - 35,724 27,602 39,534 102,860 103,681
TOTAL FIXEDINCOME $ 781,763 $ 9,320 $ 24,521 $ 264,674 $ 143,879 $ 39,534 $1,263,691 $1,222,548
Custodial Credit Risk – Custodial credit risk is the risk that the Plan will not be able to recover thevalue of its investments or collateral securities that are in the possession of an outside party, if thatoutside party fails. The Plan does not have a policy regarding custodial credit risk. As of June 30, 2020and 2019, all of the Plan’s investments are held in the Plan’s name and/or are not exposed to custodialcredit risk.
Comprehensive Annual Financial Report 2019-2020 San José Police & Fire Retirement Plan 56

Notes to the Basic Financial Statements (continued)
NOTE 3 - INVESTMENTS (continued)
Credit Quality Risk – The Plan’s investment policy allows for investments in a wide variety of domesticand international debt securities that may carry a high rating, low rating, or be unrated. Investmentmanagers may, as part of their investment strategy, invest in securities where the issuer’s ability orwillingness to pay is limited. At times, these debt securities may be converted into other debt, equity, orhybrid securities that have different risk and return characteristics than the securities initially purchased.The Plan may hedge against the possible adverse effects of currency fluctuations on the Plan’s portfolioof international fixed income obligations when it is considered appropriate. This is typically achievedusing forward currency contracts. Short-term investments may consist of commercial paper rated atleast A1 or P1, repurchase agreements, short-term U.S. securities, and other money marketinvestments. Nationally recognized statistical rating organizations provide ratings of debt securities’quality based on a variety of factors, such as the financial condition of the issuers, which provideinvestors with some idea of the issuer’s ability to meet its obligations.
The following tables provide information for the portfolio as of June 30, 2020 and 2019 concerning creditrisk. These tables reflect only securities held in the Plan's name.
RATINGS OF FIXED INCOME INVESTMENTSAs of June 30, 2020 and 2019 (Dollars in Thousands)
2020 2019
S&P Quality Rating Fair ValueFair Value as a % ofTotal Fixed Income Fair Value
Fair Value as a % ofTotal Fixed Income
AAA $ 141,146 %14.30 $ 16,917 %1.34
AA+ 90,497 9.17 297,773 23.56
AA 4,921 0.50 703,117 55.64
AA- 2,777 0.28 - -
A+ 511 0.05 1,008 0.08
A 3,711 0.38 34,080 2.70
A- 1,222 0.12 841 0.07
BBB+ 2,738 0.28 - -
BBB 1,496 0.15 10,171 0.80
BBB- 1,168 0.12 - -
BB+ - - 716 0.06
BB - - 34 -
BB- 3,682 0.37 - -
B+ 2,547 0.26 - -
Not Rated 730,390 74.02 199,034 15.75
TOTAL $ 986,806 %100.00 $ 1,263,691 %100.00
Foreign Currency Risk – This is the risk that changes in the exchange rates will adversely affect thefair value of underlying investments. To mitigate this risk, the Plan’s investment policy permits individualinvestment managers to mitigate the impact of currency fluctuation on the underlying asset value. ThePlan’s investment managers enter into international forward currency contracts, which are commitmentsto purchase or sell stated amounts of international currency. The Plan utilizes these contracts to controlexposure and facilitate the settlement of international security purchase and sale transactions. At June30, 2020 and 2019, the Plan’s net position in these contracts is recorded at fair value as internationalcurrency contract investments. The fair values of international currency contracts are determined byquoted currency prices from national exchanges. The Plan’s commitments relating to internationalcurrency contracts are settled on a net basis.
57 Comprehensive Annual Financial Report 2019-2020 San José Police & Fire Retirement Plan

Notes to the Basic Financial Statements (continued)
NOTE 3 - INVESTMENTS (continued)
The following tables provide information as of June 30, 2020 and 2019, concerning the fair value ofinvestments that are subject to foreign currency risk:
FOREIGN CURRENCY RISK ANALYSISAs of June 30, 2020 (In Thousands)
Currency Name Cash PublicEquity
Global FixedIncome
InternationalCurrency
Contracts, NetGrowth
Real EstateTotal
ExposureAustralian dollar $ - $ 6,212 $ - $ - $ - $ 6,212
Canadian dollar - 7,109 - - - 7,109
Danish krone - 1,055 - - - 1,055
Euro member countries 426 25,716 - - 24,260 50,402
Hong Kong dollar 4 7,837 19 - - 7,860
Japanese yen - 23,058 - - - 23,058
Korean (South) won - 12,003 - - - 12,003
Norwegian krone - 387 - - - 387
Switzerland Franc - 31,491 - - - 31,491
Swedish krona - 8,472 - - - 8,472
United Kingdom pound - 32,675 - - - 32,675
China yuan renminbi - - - (21) - (21)
TOTAL $ 430 $ 156,015 $ 19 $ (21)$ 24,260 $ 180,703
FOREIGN CURRENCY RISK ANALYSISAs of June 30, 2019 (In Thousands)
Currency name CashPublicEquity
Global FixedIncome
InternationalCurrency
Contracts,Net
GrowthReal Estate
TotalExposure
Australian dollar $ 8 $ 7,183 $ 2,827 $ - $ - $ 10,018
Canadian dollar 40 8,446 2,743 - - 11,229
Chinese yuan renminbi - - - 65 - 65
Danish krone 2 722 757 - - 1,481
Euro member countries 81 22,005 54,538 - 23,096 99,720
Hong Kong dollar - 2,176 - - - 2,176
Japanese yen 46 8,368 32,877 - - 41,291
Korea (South) won - 13,461 - - - 13,461
Mexican peso 42 - 1,059 - - 1,101
Norwegian krone 14 911 350 - - 1,275
Poland zolty 22 - 878 - - 900
Singapore dollar 2 - 1,216 - - 1,218
South African rand 9 - 785 - - 794
Swedish krona 7 3,035 506 - - 3,548
Swiss franc - 25,031 - - - 25,031
United Kingdom pound 32 27,714 9,017 - - 36,763
TOTAL $ 305 $ 119,052 $ 107,553 $ 65 $ 23,096 $ 250,071
Comprehensive Annual Financial Report 2019-2020 San José Police & Fire Retirement Plan 58

Notes to the Basic Financial Statements (continued)
NOTE 3 - INVESTMENTS (continued)
Investment Concentration Risk – The Plan’s investment policy specifies that investments shall bediversified with the intent to minimize the risk of large investment losses. The total portfolio shall beconstructed in a way to provide prudent diversification with regard to the concentration of holdings inindividual asset classes, issues, issuers, geographies or industries. In addition, assets will be assignedto a variety of investment managers that employ a range of investment management strategies. Nosingle investment management firm shall be authorized to manage more than 15% of the Plan’s assetswithout Board approval, with the exception of passive management where the Plan's assets are not heldin the Plan's name at the Plan's custody bank. In such cases, there is no concentration limit. As ageneral rule, Plan assets placed with an investment manager should not represent more than 10% of thetotal assets managed by that firm, without prior Board approval. As of June, 30, 2020 and 2019, the Plandid not hold investments in any one issuer, excluding U.S. government guaranteed investments, thatrepresented five percent or more of the total plan net position or total investments.
Derivatives – The Plan’s investment policy allows for investments in derivative instruments that complywith the Plan’s objectives of providing a cost effective means of managing portions of a portfolio and tomanage risk through hedging activities. The Plan is currently authorized to use derivative strategies toequitize cash during portfolio transitions until physical securities are in place and to reproduce orreplicate a physical holding that corresponds to a Board approved policy benchmark. In addition to thePlan’s internal derivative policies, it is understood that the mandates of certain investment managersretained by the Plan may use derivatives.
Derivative investments are reported at fair value. Derivative instruments traded on a national orinternational exchange are valued at the last reported sales price on the last business day of the fiscalyear at current exchange rates, if applicable. Futures contracts are marked-to-market at the end of eachtrading day, and the settlement of gains or losses occur on the following business day through variationmargins. As a result, futures have no fair value as of June 30, 2020 or 2019.
The fair value of international currency forwards represents the unrealized gain or loss on the relatedcontracts, which is calculated based on the difference between the specified contract exchange rate andthe exchange rate at the end of the reporting period.
The fair values and notional amounts for derivative instruments outstanding as of June 30, 2020 and2019, classified by type, and the changes in fair value of such derivative instruments for the years thenended as reported in the 2020 and 2019 financial statements are as follows (amounts in thousands):
Net Appreciation / (Depreciation)in Fair Value of Investments
through June 30, 2020 Fair Value at June 30, 2020
InvestmentDerivative Instruments Classification Amount Classification Amount
NotionalAmount /Shares
Fixed income futures
long Investment income $ (374) Futures - 126,800
Fixed income futures
short Investment income (164) Futures - (9,800)
FX forwards Investment income 63
Long term
instruments $ (21)$ 6,665
Index futures long Investment income 4,617 Futures - 29 Index futures short Investment income (4,505) Futures - (11)
Total DerivativeInstruments $ (363) $ (21)
59 Comprehensive Annual Financial Report 2019-2020 San José Police & Fire Retirement Plan

Notes to the Basic Financial Statements (continued)
NOTE 3 - INVESTMENTS (continued)
Net Appreciation / (Depreciation)in Fair Value of Investments
through June 30, 2019 Fair value at June 30, 2019
InvestmentDerivative Instruments Classification Amount Classification Amount
NotionalAmount /Shares
Fixed income futures
long Investment income $ (51) Futures - -
Fixed income futures
short Investment income 28 Futures - -
FX forwards Investment income (4,770)
Long term
instruments $ 65 $ 6,244
Index futures long Investment income 2,892 Futures - 10 Index futures short Investment income (1,112) Furtures - - Rights Investment income 3 Common stock - -
Total DerivativeInstruments $ (3,010) $ 65
Derivative investments are also subject to counterparty credit risk (non-exchange traded). The followingdescribes the risks applicable to the investment derivative instruments that are reported as of June 30,2020 and 2019.
Counterparty Credit Risk - The Plan is exposed to credit risk on derivative instruments that are in assetpositions and non-exchange traded. The Plan's investments in forward currency contracts bearcounterparty credit risk in that parties to the contracts may fail to perform according to the terms of thecontract. As of June 30, 2020, total commitments in forward currency contracts to purchase and sellinternational currencies were $6,665,000, with fair values of $6,673,000 and $6,694,000, respectively,held by counterparties with S&P rating of at least AA-. As of June 30, 2019, total commitments inforward currency contracts to purchase and sell international currencies were $6,244,000 with fair valuesof $6,262,000 and $6,197,000, respectively, held by counterparties with S&P rating of at least AA-.
Fair Value Measurements - The Plan categorizes its fair value measurements within the fair valuehierarchy established by generally accepted accounting principles. The fair value hierarchy, which hasthree levels, is based on the valuation inputs used to measure an asset's fair value and gives the highestpriority to unadjusted quoted prices in active markets for identical assets or liabilities (level 1measurements) and the lowest priority to unobservable inputs (level 3 measurements). The three levelsof the fair value hierarchy are as follows:
Level 1 inputs are quoted prices (unadjusted) for identical assets or liabilities in active markets.
Level 2 inputs are inputs other than quoted prices included in Level 1 that are observable for an asset orliability, either directly or indirectly. Inputs to the valuation include: 1) quoted prices for similar assets orliabilities in active markets; 2) quoted prices for identical or similar assets or liabilities in markets that arenot active; 3) inputs other than quoted prices that are observable for the asset or liability; and 4) market-corroborated inputs.
Level 3 inputs are unobservable inputs for an asset or liability where there are little market activities.The inputs into the determination of fair value are based upon the best information in the circumstancesand may require management judgment or estimation.
Comprehensive Annual Financial Report 2019-2020 San José Police & Fire Retirement Plan 60

Notes to the Basic Financial Statements (continued)
NOTE 3 - INVESTMENTS (continued)
The Plan has the following recurring fair value measurements as of June 30, 2020 and June 30, 2019:
Investments Measured At Fair ValueAs of June 30, 2020 Fair Value Measurement Using
(In Thousands) Total Level 1 Level 2 Level 3Net AssetsValue (NAV)
Investments by Fair Value LevelPublic equity $ 1,801,787 $ 376,896 $ - $ - $ 1,424,891
Private equity 356,946 - - 10,507 346,439
Investment grade bonds 325,289 6,679 68,232 - 250,378
Private debt 196,648 - - 6,149 190,499
Immunized cash flows 163,610 81,228 82,382 - -
Core real estate 156,539 - - - 156,539
Growth real estate 128,229 - - - 128,229
Market neutral strategies 119,593 - - - 119,593
Emerging market bonds 117,056 - - - 117,056
Long-term government bonds 111,450 - - - 111,450
Treasury inflation-protected securities 74,813 74,813 - - -
High yield bonds 74,289 71 - - 74,218
Cash and cash equivalents 69,050 69,050 - - -
Short-term investment grade bonds 51,249 51,249 - - -
Private real assets 34,056 - - - 34,056
Commodities 9,067 - - - 9,067
International currency contracts, net (21) (21) - - -
Total investments measured at fair value $ 3,789,650 $ 659,965 $ 150,614 $ 16,656 $ 2,962,415
Investments Measured at Fair ValueAs of June 30, 2019 Fair Value Measurement Using
(In Thousands) Total Level 1 Level 2 Level 3Net Asset
Value (NAV)Investments by Fair Value LevelPublic equity $ 1,185,780 $ 341,883 $ - $ - $ 843,897
Short-term investment grade bonds 722,360 722,360 - - -
Private equity 460,412 - - 2,580 457,832
Market neutral strategies 263,211 - - - 263,211
Private debt 189,201 - 10,332 8,493 170,376
Immunized cash flows 178,976 96,983 81,993 - -
Core real estate 148,683 6,304 - - 142,379
Emerging market bonds 116,277 - - - 116,277
Soveregin bonds ex US 102,860 - 102,860 - -
Growth real estate 101,577 - - - 101,577
Commodities 79,835 - - - 79,835
Treasury inflation-protected securities 74,200 74,200 - - -
Cash and cash equivalents 51,340 51,340 - - -
Private real estate 34,679 - - - 34,679
High yield debt 17,678 89 - - 17,589
International currency contracts, net 65 65 - - -
Total investments measured at fair value $ 3,727,134 $ 1,293,224 $ 195,185 $ 11,073 $ 2,227,652
61 Comprehensive Annual Financial Report 2019-2020 San José Police & Fire Retirement Plan

Notes to the Basic Financial Statements (continued)
NOTE 3 - INVESTMENTS (continued)
Equity and Fixed Income Securities
Equity securities classified in Level 1 of the fair value hierarchy are valued using prices quoted in activemarkets issued by pricing vendors for these securities. Debt and equity securities classified in Level 2 ofthe fair value hierarchy are valued using prices determined by the use of matrix pricing techniquesmaintained by the various pricing vendors for these securities. Matrix pricing is used to value securitiesbased on the securities' relationship to benchmark quoted prices for similar securities that areobservable in the market place. Debt and equity securities classified in Level 3 are securities whoseinputs to valuation techniques are unobservable by the market place. Many of these securities arepriced by the issuers or industry groups for these securities. Fair value is defined as the quoted marketvalue on the last trading date of the period. These prices are obtained from various pricing sources bythe custodian bank.
Alternative Investments
Alternative investments include public equity, private equity, core real estate, growth real estate, highyield debt, market neutral strategies, emerging market bonds, commodities, private debt, and privatereal assets. These are investments for which exchange quotations are not readily available and arevalued at estimated fair value, as determined in good faith by the General Partner (GP) of eachinvestment firm retained by the Plan. These investments are initially valued at cost with subsequentadjustments that reflect third party transactions, financial operating results and other factors deemedrelevant by the GP. The assets in the alternative investment program are classified as Level 3 assets orat the NAV. A more detailed explanation of the Level 3 and NAV valuation methodologies follows.
Investments in non-public equity securities are valued by the GP using one or more valuationmethodologies outlined in GASB Statement No. 72, Fair Value Measurement and Application, dependingupon the availability of data required by each methodology. In some cases, the GP may use multipleapproaches to estimate a valuation range. For the immediate time period following a transaction, thedetermination of the fair value for equity securities, in which no liquid trading market exists, can generallybe approximated based on the transaction price (absent any significant developments). Thereafter, or inthe interim, if significant developments relating to such portfolio company or industry occur which maysuggest a material change in value, the GP should value each investment by applying generallyaccepted valuation methods including: (1) the market approach (such as market transaction andcomparable public company multiples, which are based on a measurement of the company's historicaland projected financial performance with typical metrics including enterprise value / latest 12 monthsEBITDA or projected fiscal year EBITDA) or (2) the income or discounted cash flow approach.
The determination of fair value using these methodologies should take into consideration a range offactors, including but not limited to, the price at which the investment was acquired, the nature of theinvestment, local market conditions, trading value on public exchanges for comparable securities,current and projected operating performance and financing transactions subsequent to the acquisition ofthe investment. Because of the subjective nature of estimated fair value of the private investments,such value may differ significantly from the values that would have been used had a ready marketexisted for these investments. These financial instruments have benn classified as Level 3 in the fairvalue hierarchy. NAV is calculated and used as a practical expedient to estimate fair value inaccordance with GAAP requirements. These investments are not categorized within the fair valuehierarchy.
Comprehensive Annual Financial Report 2019-2020 San José Police & Fire Retirement Plan 62

Notes to the Basic Financial Statements (continued)
NOTE 3 - INVESTMENTS (continued)
The following tables present the category, fair value, unfunded commitments, redemption frequency andredemption notice period for investments for which fair value is presented using the NAV as of June 30,2020 and 2019:
Investments Measured at the NAVAs of June 30, 2020(In Thousands) Fair Value
UnfundedCommitments
Redemption Frequency(if Currently Eligible)
RedemptionNotice Period
Public equity $ 1,424,891 $ - Daily, Weekly, Monthly 1 - 30 Days
Private equity 346,439 38,600 Daily, N/A 1 Day, N/A
Investment grade bonds 250,378 - Daily 3 Days
Private debt 190,499 99,100 N/A N/A
Core real estate 156,539 43,880 Quarterly 90 Days
Growth real estate 128,229 98,300 N/A N/A
Market neutral strategies 119,593 - Monthly, Bi-Annual 45 - 65 Days
Emerging market bonds 117,056 - Daily, Quarterly 1 - 45 days
Long-term government bonds 111,450 - Daily 3 Days
High yield bonds 74,218 - Daily 3 Days
Private real assets 34,056 20,000 N/A N/A
Commodities 9,067 - Daily 3 Days
Total investments measured atNAV $ 2,962,415 $ 299,880
Investments Measured at the NAVAs of June 30, 2019(In Thousands) Fair Value
UnfundedCommitments
Redemption Frequency(if Currently Eligible)
RedemptionNotice Period
Public equity $ 843,897 $ - Daily, Monthly, Quarterly 1 - 90 Days
Private equity 457,832 - Daily, N/A 30 Day, N/A
Market neutral strategies 263,211 - Weekly, Monthly, Quarterly 14 - 75 Days
Private debt 170,376 88,855 N/A N/A
Core real estate 142,379 14,880 Quarterly, N/A 14 - 60 Days, N/A
Emerging market bonds 116,277 - Daily, Quarterly 45 - 60 Days
Growth real estate 101,577 77,123 N/A N/A
Commodities 79,835 - Daily 3 Days
Private real assets 34,679 15,188 N/A N/A
High yield bonds 17,589 - Quarterly 14 - 60 Days, N/A
Total investments measured atNAV $ 2,227,652 $ 196,046
Public equity - This type includes investments in eleven commingled investment funds. Public equitiesare shares of ownership of a firm listed on an exchange; the Plan holds global public equities in order tobenefit from their total return (capital appreciation plus current yield) over a long-term horizon. Thecommingled funds liquidity ranges from daily to monthly and the notice periods are between one day andthirty days.
Private equity - This type includes investments in one commingled investment fund and eighteenprivate equity limited partnership funds, which generally invest in privately held companies. Theseinvestments cannot be redeemed early from the funds. Instead, the nature of the investments in thistype is that distributions are received through the liquidation of the underlying assets of the fund. Theonly way to exit these funds is through a sale in a secondary market. The commingled investment offersdaily liquidity with a one day notice.
63 Comprehensive Annual Financial Report 2019-2020 San José Police & Fire Retirement Plan

Notes to the Basic Financial Statements (continued)
NOTE 3 - INVESTMENTS (continued)
Investment grade bonds - This type includes investments in two separate accounts and onecommingled fund. The purpose of Investment grade bonds is to produce returns and income for thePlan by providing exposure to rates and credit risk. The commingled fund offers daily liquidity with anotice period of three days.
Private debt - This type includes investments in eleven private debt limited partnership funds. Theseinvestments cannot be redeemed early from the funds. Instead, the nature of the investments in thistype is that distributions are received through the liquidation of the underlying assets of the fund. Theonly way to exit these funds is through a sale in a secondary market.
Core real estate - This type includes investments in two open ended real estate commingled funds.Core real estate funds typically invest in physical properties. The goal of core real estate is to producethe Plan price appreciation and income while maintaining a low correlation to stocks and bonds held bythe Plan. The open-end real estate funds offer quarterly redemptions with notice periods of ninety days.
Growth real estate - This type includes fifteen limited partnership real estate funds which generallyinvests in physical properties. The goal of growth real estate is to produce the Plan price appreciationand income while maintaining a low correlation to stocks and bonds. The only way to exit these funds isthrough a sale in a secondary market.
Market neutral strategies - This type includes investments in four limited partnership hedge funds thatinvest both long and short in a wide array of securities, including listed and OTC derivatives, andtypically use leverage and hedging to capture directional market movements or relative marketmispricing. The redemption frequencies range from monthly to bi-annual with notice periods of forty fivedays to sixty five days. Two funds have 25% investor-level redemption gates, while the remaining twofunds have no gates.
Emerging market bonds - This type includes investments in two limited partnership funds. Emergingmarket bonds funds typically invest in contractual cash flows of governments and other sovereignentities, corporations, securitizations, and derivatives thereof in emerging market countries with asovereign rating less than BBB-. One partnership has quarterly redemption period with a notice periodof forty five days; the other has a daily redemption period with a one day notice period.
Long-term government bonds - This type includes investments in a commingled fund. The purpose ofthe long-term government bonds is to provide a positive return in highly stressed market environments,with a low correlation to equity risk. The commingled fund offers daily liquidity with a notice period ofthree days.
High yield bonds - This type includes an investment in one commingled fund. The primary purpose ofhigh yield bonds is to provide the Plan with exposure to high yielding corporate debt. The commingledfund offers daily liquidity with a notice period of three days.
Private real assets - This type includes five limited partnership real asset funds. Private real assets arephysical or tangible assets that have value due to their substance and properties. The goal of real assetsis to help the portfolio maintain purchasing power through periods of inflation. The only way to exit thesefunds is through a sale in a secondary market.
Commodities - This type includes investments in one limited partnership commodities fund.Commodities are physical or tangible assets that have value due to their substance and properties. Thegoal of commodities is to help the portfolio maintain purchasing power through periods of inflation. Thecommodities fund offers daily liquidity with three business days’ notice.
Comprehensive Annual Financial Report 2019-2020 San José Police & Fire Retirement Plan 64

Notes to the Basic Financial Statements (continued)
NOTE 4 - DEFINED BENEFIT PENSION PLAN: NET PENSION LIABILITY AND CONTRIBUTIONS
Net Pension Liability. The components of the net pension liability (i.e., the total pension liabilitydetermined in accordance with GASB Statement No. 67, Financial Reporting for Pension Plans - AnAmendment of GASB Statement No. 25, less the plan net position) as of June 30, 2020 and 2019, wereas follows (dollars in thousands):
2020 2019Total pension liability $ 5,177,016 $ 4,872,791
Plan fiduciary net position 3,702,020 3,588,422
Net pension liability $ 1,474,996 $ 1,284,369
Plan fiduciary net position as a percentage of the total pension liability %71.5 %73.6
Actuarial Assumptions. Actuarial valuations of an ongoing plan involve estimates of the value ofreported amounts and assumptions about the probability of occurrence of events far into the future.Examples include assumptions about future employment, mortality and investment return. Experiencestudies are performed by the Board’s actuary to determine appropriate revision to the actuarialassumptions, as actual results are compared with past expectations and new estimates are made aboutthe future. The last experience study was performed in October 2019.
The total pension liability as of June 30, 2020 and 2019 is based on results of an actuarial valuation dateof June 30, 2019 and 2018, respectively, and rolled-forward to June 30, 2020 and 2019 using standardroll forward procedures. A summary of the actuarial assumptions used to determine the total pensionliability is shown below.
Actuarial AssumptionsValuation date June 30, 2019 June 30, 2018
Measurement date June 30, 2020 June 30, 2019
Inflation rate 2.50% 2.75%
Discount rate 6.75% per annum (net of investmentexpenses) The long-term expectedreturn on assets based on Meketa'scapital market assumptions for a 10-year time horizon is 7.2%. The Boardapplied a margin for adverse deviationto improve the probability of achievingthe discount rate.
6.75% per annum (net of investmentexpenses) The long-term expectedreturn on assets based on Meketa'scapital market assumptions for a 20-year time horizon is 7.0%. The Boardapplied a margin for adverse deviationto improve the probabity of achievingthe discount rate.
Post-retirement mortality
(a) Healthy retirees 1.002 times the 2010 Public SafetyAbove Median Income Mortality Table(Pub(s)-2010(A)) for healthy male andfemale retirees projected using MP-2019 on a generational basis from thebase year of 2010
CALPERS 2009 Healthy AnnuitantMortality Table multiplied by 0.948 formales and 1.048 for females andprojected using SOA MP-2017 on agenerational basis from the base yearof 2009
(b) Disability retirees 0.915 times the Public Safety MortalityTable (PubS-2010) for disabled maleand female retirees projected usingMP-2019 on a generational basis fromthe base year of 2010
CALPERS 2009 Industrial DisabilityMortality Table for males and femalesmultiplied by 0.903 and projected usingSOA MP-2017 on a generational basisfrom the base year of 2009
(c) Benficiaries 0.948 times the CalPERS 2009 HealthyAnnuitant Mortality Table for males and1.048 times the CalPERS 2009 HealthyAnnuitant Mortiality Table for females
65 Comprehensive Annual Financial Report 2019-2020 San José Police & Fire Retirement Plan

Notes to the Basic Financial Statements (continued)
NOTE 4 - DEFINED BENEFIT PENSION PLAN: NET PENSION LIABILITY AND CONTRIBUTIONS(continued)
Actuarial AssumptionsRate of service retirement,withdrawal, death, disabilityretirements
Based upon the June 30, 2019,actuarial experience analysis
Based upon the June 30, 2017,actuarial experience analysis
Salary increase
Wage inflation 3.25% per annum (0.75% real wagegrowth)
3.25% per annum (0.50% real wagegrowth)
Merit increase Merit component added based on anindividual year's of service ranging from6.50% to 0.50%
Merit component added based on anindividual year's of service ranging from6.00% to 0.50%
Cost-of-living adjustment Tier 1 - 3% per yearTier 2 - 2% per year
Tier 1 - 3% per yearTier 2 - 2% per year
The assumption for the long-term expected rate of return on pension plan investments of 6.75% for thevaluation years ended June 30, 2019 and 2018, respectively, was selected by estimating the mediannominal rate of return based on long-term capital market assumptions adopted by the Board, includingnominal expected rates of return for each asset class, and reducing the estimated median by a marginso that there is estimated to be a greater than 50 percent probability of achieving the return.
Best estimates of geometric real rates of return for each major asset class included in the Plan’s targetasset allocation as of June 30, 2020 and 2019, (see the discussion of the Plan’s investment policy) aresummarized in the following table:
2020
Asset Class
TargetAsset
Allocation
Long-TermExpected RealRate of Return Asset Class
TargetAsset
Allocation
Long-TermExpected RealRate of Return
Public equity 46% 5.4% Growth real estate 3% 6.1%
Investment grade bonds 12% (0.1)%Long-term government
bonds 3% 0.2%
Private equity 6% 6.8% Market neutral strategies 3% 2.1%
Core real estate 5% 3.5% Private debt 3% 4.4%
Immunized cash flows 5% (0.9)% Private real assets 3% 5.0%
Venture / growth capital 4% 6.6% High yield bonds 2% 2.6%
Emerging market bonds 3% 2.0%Treasury inflation-
protected securities 2% (0.1)%
2019
Asset Class
TargetAsset
Allocation
Long-TermExpected RealRate of Return Asset Class
TargetAsset
Allocation
Long-TermExpected RealRate of Return
Public equity 31% 6.2% Venture / growth capital 4% 7.2%
Short-term investmentgrade bonds 20% 0.8% Emerging market bonds 3% 2.6%
Private equity 8% 7.3% Growth real estate 3% 5.3%
Market neutral strategies 7% 2.7% Private real assets 3% 6.7%
Core real estate 5% 3.1% Sovereign bonds ex US 3% (0.3)%
Immunized cash flows 5% 0.8% Commodities 2% 2.3%
Private debt 4% 4.6%Treasury inflation-protected securities 2% 1.0%
Comprehensive Annual Financial Report 2019-2020 San José Police & Fire Retirement Plan 66

Notes to the Basic Financial Statements (continued)
NOTE 4 - DEFINED BENEFIT PENSION PLAN: NET PENSION LIABILITY AND CONTRIBUTIONS(continued)
Discount Rate. The discount rate used to measure the total pension liability was 6.75% for themeasurement years ended June 30, 2020 and 2019, respectively. It is assumed that Plan membercontributions and City contributions will be made based on the actuarially determined rates based on theBoard’s funding policy. Based on those assumptions, the Plan’s net position is expected to be availableto make all projected future benefit payments of current plan members. Therefore, the long-termexpected rate of return on pension plan investments was applied to all periods of projected benefitpayments to determine the total pension liability.
Sensitivity of the Net Pension Liability to Changes in Discount Rate. In accordance with GASBStatement No. 67 regarding the disclosure of the sensitivity of the net pension liability to changes in thediscount rate, the following presents the net pension liability of the City, as of June 30, 2020 and 2019,calculated using the discount rate of 6.75%, as well as what the City’s net pension liability would be if itwere calculated using a discount rate that is 1.0% lower (5.750%) or 1.0% higher (7.750%) than thecurrent rate (in thousands):
2020 20191%
Decrease(5.75%)
DiscountRate
(6.75%)
1%Increase(7.75%)
1%Decrease(5.75%)
DiscountRate
(6.75%)
1%Increase(7.75%)
Total pension liability $ 5,933,919 $ 5,177,016 $ 4,565,907 $ 5,582,819 $ 4,872,791 $ 4,298,441
Plan fiduciary net position 3,702,020 3,702,020 3,702,020 3,588,422 3,588,422 3,588,422
Net pension liability $ 2,231,899 $ 1,474,996 $ 863,887 $ 1,994,397 $ 1,284,369 $ 710,019
Plan fiduciary net position as apercentage of the total pensionliability %62.4 %71.5 %81.1 %64.3 %73.6 %83.5
On June 24, 2008, the City Council adopted Ordinance No. 28332 amending Chapter 3.36 of Title 3 ofthe San José Municipal Code to provide the City with the option to make lump sum payments of Cityrequired contributions to the Plan (referred to as prefunding).
In January 2011, the Board adopted a funding policy (referred to as the floor methodology) setting theCity's funding policy contribution amount to be the greater of the dollar amount reported in the actuarialvaluation or the dollar amount determined by applying the percentage of payroll reported in the valuationto the actual payroll, if actual payroll exceeds the actuarial payroll, for the fiscal year.
In October 2014, the Board approved implementing an incremental reduction approach to determining"actuarial equivalence" for the prefunding when the economic expansion has exceeded 58 months induration and/or the S&P 500 has returns in excess of 130%. This approach will ensure that as businessexpansions and/or market valuation mature and exceed historic norms, the Plan reduces the incentivefor the City to prefund its contributions. The incremental reduction to the discount rate that is used tocalculate the prefunding is 15% per year, up to a maximum of 45%, which was the reduction for fiscalyear June 30, 2020.
In February 2016, the Board approved the City's request that the floor methodology for Tier 1 be usedonly for the annual employer Normal Cost contribution (which includes administrative expenses) and thatthe annual employer Unfunded Actuarial Liability (UAL) contribution be set at the dollar amountrecommended by the actuary and adopted by the Board in the annual actuarial valuation reportbeginning fiscal year 2017.
San José City Council Ordinance No. 29266 and Ordinance No. 29511 implemented the terms of astipulated arbitration award for Police Tier 2 and Fire Tier 2 pension benefits, respectively. Police Tier 2members are any new Plan members hired on or after August 4, 2013; Fire Tier 2 members are any newPlan members hired on or after January 2, 2015. The new tiers include significant benefit changes from
67 Comprehensive Annual Financial Report 2019-2020 San José Police & Fire Retirement Plan

Notes to the Basic Financial Statements (continued)
NOTE 4 - DEFINED BENEFIT PENSION PLAN: NET PENSION LIABILITY AND CONTRIBUTIONS(continued)
the existing Police Tier 1 and Fire Tier 1 plans as described in Note 1. In addition, the contribution ratesfor Police Tier 2 and Fire Tier 2 members include a change in the cost sharing between the City andactive Police Tier 2 and Fire Tier 2 members which is a 50/50 split of all costs, including UAL. Currently,Police Tier 1 and Fire Tier 1 members split normal cost with 8/11 paid by the City and 3/11 paid byPolice Tier 1 and Fire Tier 1 members. The responsibility for funding the UAL is generally not sharedwith the Police Tier 1 and Fire Tier 1 employees.
Beginning September 2014, the Board approved the City's request to exclude Tier 2 from the floormethodology to ensure that the City does not pay more than the actuarially determined contribution(ADC). Therefore, the contribution rate determined by the actuary multiplied by the actual payroll will beused to determine the contribution.
On April 4, 2019, the Board approved the City decision to not prefund Tier 1 contributions for the fiscalyear ending June 30, 2020. The City decided that the amount required to prefund, at the discount rate,would not result in beneficial savings to the City for this fiscal year.
The City's contributions for the Defined Benefit Pension Plan during the fiscal years ended June 30,2020 and 2019 were as follows.
Fiscal Year 2020
Actuarial Valuation Year 2018(In Thousands) Police Tier 1 Fire Tier 1 Police Tier 2 Fire Tier 2 TotalActual payroll $96,582 $75,571 $44,315 $13,933 $230,401City normal cost rate for pension andCOLA
31.43% 32.25% 14.06%1 15.39%1
Regular contributions paid throughout theyear
30,356 24,372 6,231 2,144 63,103
Unfunded Actuarial contribution paidthroughout the year
70,024 55,031 - - 125,055
Adjustments and accruals 122 124 64 13 323
Total contributions for the fiscal year $100,502 $79,527 $6,295 $2,157 $188,4811 Police Tier 2 and Fire Tier 2 CIty contribution rates include UAL percentages of 0.04% and 0.05%, respectively
Fiscal Year 2019
Actuarial Valuation Year 2017(In Thousands) Police Tier 1 Fire Tier 1 Police Tier 2 Fire Tier 2 TotalActual payroll $100,809 $74,542 $32,807 $10,461 $218,619Actuarial payroll 92,624 74,845 N/A N/A N/A
Actual payroll in excess of actuarial payroll 8,185 - N/A N/A N/ACity normal cost rate for pension andCOLA
30.28% - N/A N/A N/A
Additional contributions due to the floormethodology
2,478 - N/A N/A 2,478
Prefunded contributions amount (BOY)1 88,684 72,363 N/A N/A 161,047Regular contributions paid throughout theyear
- - 4,449 1,570 6,019
Adjustments and accruals 4,047 2,944 69 14 7,074
Total contributions for the fiscal year $95,209 $75,307 $4,518 $1,584 $176,618
1 Beginning of year
Comprehensive Annual Financial Report 2019-2020 San José Police & Fire Retirement Plan 68

Notes to the Basic Financial Statements (continued)
NOTE 4 - DEFINED BENEFIT PENSION PLAN: NET PENSION LIABILITY AND CONTRIBUTIONS(continued)
Contributions to the Defined Benefit Pension Plan are actuarially determined to provide adequate assetto pay benefits when due. The City's Tier 1 UAL contribution is actuarially determined as a minimumdollar amount. All other contributions are an actuarially determined percentage of each member'scovered payroll. The contribution rates and amounts for fiscal years ended June 30, 2020 and 2019were based on the actuarial valuations performed as of June 30, 2018 and 2017, respectively.
The City and the participating member’s contribution rates in effect for the Defined Benefit Pension Planduring the fiscal years ended June 30, 2020 and 2019 were as follows:
City-Board Adopted Member2
PeriodPoliceTier 1
MinimumDollar
Amount3PoliceTier 2
FireTier 1
MinimumDollar
Amount3Fire
Tier 2PoliceTier 1
PoliceTier 2
FireTier 1
FireTier 2
06/28/2020-06/30/2020 31.80% 14.18% 33.18% 15.53% 10.72% 14.18% 11.72% 15.53%
07/01/2019-06/27/2020 31.43% $ 70,024,000 14.06% 32.25% $ 55,031,000 15.39% 10.70% 14.06% 11.46% 15.39%
07/01/2018-06/30/20191 30.28% $ 62,305,500 13.71% 31.20% $ 50,725,182 15.13% 10.28% 13.71% 11.09% 15.13%
1 The actual contribution rates paid by the City for fiscal year ended June 30, 2019 differed from what is above for Tier 1
due to the City funding the actuarially determined contribution amount based on the greater of the dollar amount reported
in the actuarial valuation or the dollar amount determined by applying the percentage of payroll reported in the valuation
to the actual payroll, if actual payroll exceeds the actuarial payroll, for the fiscal year.
2 Under Measure F, certain Tier 2 members who had previous Tier 1 service or prior service with a reciprocal employer
were reclassified to Tier 1. Ordinance No. 30145, which became effective October 12, 2018, amended the Municipal
Code to reflect these changes. Effective 3/24/2019, reclassified Tier 1 members paid an additional 1.96% in contributions,
members with prior Federated Service reclassified to Tier 1 paid an additional 0.87% in contributions, and Classic Tier 1
members paid an additional 0.47% in contributions.
3 Contributions are structured as a normal cost, plus a payment on the Unfunded Actuarial Liability (UAL). City contributions
are administered as a contribution rate plus a minimum dollar amount based on actuarial payroll.
NOTE 5 - POSTEMPLOYMENT HEALTHCARE PLAN: NET OPEB LIABILITY AND CONTRIBUTIONS
Net OPEB Liability. The components of the net Other Postemployment Benefit (OPEB) liability of thePlan, including all of the healthcare sub-trusts, (i.e., the Plan’s liability determined in accordance withGASB Statement No. 74, Financial Reporting for Postemployment Benefit Plans Other than PensionPlans, less the plan fiduciary net position) as of June 30, 2020 and 2019, were as follows (dollars inthousands):
Police Fire2020 2019 2020 2019
Total OPEB liability $ 454,500 $ 493,128 $ 271,288 $ 290,954
Plan fiduciary net position 137,789 124,990 70,743 60,967
Net OPEB liability $ 316,711 $ 368,138 $ 200,545 $ 229,987
Plan fiduciary net position as a percentage of thetotal OPEB liability %30.3 %25.4 %26.1 %21.0
Actuarial Assumptions. Actuarial valuations of an ongoing plan involve estimates of the value ofreported amounts and assumptions about the probability of occurrence of events far into the future.
69 Comprehensive Annual Financial Report 2019-2020 San José Police & Fire Retirement Plan

Notes to the Basic Financial Statements (continued)
NOTE 5 - POSTEMPLOYMENT HEALTHCARE PLAN: NET OPEB LIABILITY AND CONTRIBUTIONS(continued)
Examples include assumptions about future employment, mortality and investment return. Experiencestudies are performed by the Board’s actuary to determine appropriate revisions to the actuarialassumptions, as actual results are compared with past expectations and new estimates are made aboutthe future. The last experience study was performed in October 2019.
The total OPEB liability as of June 30, 2020 and 2019 is based on results of an actuarial valuation dateof June 30, 2019 and 2018, and rolled-forward to June 30, 2020 and 2019 using generally acceptedactuarial procedures.
A summary of the actuarial assumptions used to determine the total OPEB liability is shown below.
Actuarial AssumptionsValuation date June 30, 2019 June 30, 2018
Measurement date June 30, 2020 June 30, 2019
Actuarial cost method Entry age normal, level of percentageof pay
Entry age normal, level of percentageof pay
Discount rate 6.50% 6.50%
Inflation rate 2.50% 2.75%
Projected payroll increases
Wage inflation rate 3.25% for FY 2020 and for all years. 3.25% for FY 2019 and for all years.
Merit increase Merit component added based on anindividual's years of service rangingfrom 6.50% to 0.50%.
Merit component added based on anindividual's years of service rangingfrom 6.00% to 0.50%.
Rates of Mortality Mortality is projected from 2010 on agenerational basis using the SOA MP-2019
Mortality is projected from 2009 ongenerational basis using the SOA MP-2017 scale
Healthy retirees 1.002 times the 2010 Public SafetyAbove Median Income Mortality Table(Pub(s)-2010 (A)) for healthy male andfemale retirees
0.948 times the CALPERS 2009Healthy Annuitant Mortality Table formales and 1.048 times the CalPERS2009 Healthy Annuitant Mortality Tablefor females
Disabled retirees 0.915 times the Public Safety MortalityTable (PubS-2010) for disabled maleand female retirees
0.903 times the CalPERS 2009Industrial Disability Mortality Table formales and females
Beneficiaries 0.948 times the CalPERS 2009 HealthyAnnuitant Mortality Table for males and1.048 times the CalPERS 2009 HealthyAnnuitant Mortality Table for females.
Healthy non-annuitant 0.979 times the 2010 Public SafetyAbove Median Income Mortality Table(Pub(s)-2010(A)) for healthy males andfemales
0.948 times the CalPERS 2009Employee Mortality Table for malesand 1.048 times the CalPERS 2009Employee Mortality Table for females
Healthcare Cost Trend RatesMedical The valuation assumes that future
medical inflation will be at a rate of7.66% to 3.94% per annum gradeddown over a 55 year period for medicalpre-age 65 and 4.11% to 3.94% perannum for medical post-age 65.
The valuation assumes that futuremedical inflation will be at a rate of8.00% to 4.25% per annum gradeddown over a 15 year period for medicalpre-age 65 and 6.00% to 4.25% perannum graded down over a 15 yearperiod for medical post-age 65.
Dental Dental inflation is assumed to be 3.50% Dental inflation is assumed to be 3.50%
Comprehensive Annual Financial Report 2019-2020 San José Police & Fire Retirement Plan 70

Notes to the Basic Financial Statements (continued)
NOTE 5 - POSTEMPLOYMENT HEALTHCARE PLAN: NET OPEB LIABILITY AND CONTRIBUTIONS(continued)
The assumption for the long-term expected rate of return on OPEB plan investments of 6.50% for thevaluation years ended June 30, 2019 and 2018, respectively, was selected by estimating the mediannominal rate of return based on long-term capital market assumptions adopted by the Board, includingnominal expected rates of return for each asset class, and reducing the estimated median by a marginso that there is estimated to be a greater than 50 percent probability of achieving the return.
Best estimates of geometric real rates of return for each major asset class included in the Plan’s targetasset allocation as of June 30, 2020 and 2019, are summarized in the following table. The assets areinvested in both a 401(h) within the pension plan and in 115 subtrusts. The table refers only to the 115subtrusts. The allocation for the 401(h) is described above in Note 4 (see the discussion of the Plan’sinvestment policy).
2020 2019
Asset ClassTarget Asset
AllocationLong-Term Expected
Real Rate ReturnTarget Asset
AllocationLong-Term ExpectedReal Rate of Return
Public equity 56.0% 5.4% 56.0% 6.1%
Short-term investmentgrade bonds 29.0% (0.5)% 29.0% 0.8%
Core real estate 10.0% 4.7% 10.0% 4.3%
Commodities 5.0% 1.7% 5.0% 2.3%
Cash and cashequivalents 0.0% (0.9)% 0.0% 0.3%
Discount Rate. The discount rate used to measure the total OPEB liability was 6.5% for themeasurement years ended June 30, 2020 and 2019, respectively, and is based on the long-termexpected rate of return on investments. It is assumed that Plan member contributions are 8.0% of payfor employees eligible to participate in the postemployment healthcare plan and the City contributes theactuarially determined contribution toward the explicit subsidy up to maximum of 11.0% of the totalPolice and Fire payroll and also contributes the implicit subsidy on a pay-as-you-go basis. Based onthose assumptions, the Plan’s fiduciary net position is expected to be available to make all projectedfuture benefit payments of current plan members. Therefore, the long-term expected rate of return onOPEB plan investments was applied to all periods of projected benefit payments to determine the totalOPEB liability.
Sensitivity of the Net OPEB Liability to Changes in Discount Rate. In accordance with GASBStatement No. 74 regarding the disclosure of the sensitivity of the net OPEB liability to changes in thediscount rate, the following presents the net OPEB liability of the City, as of June 30, 2020 and 2019,calculated using the discount rate of 6.50%, as well as what the City’s net OPEB liability would be if itwere calculated using a discount rate that is 1.00% lower or 1.00% higher than the current rate:
Police
2020 20191%
Decrease(5.50%)
DiscountRate
(6.50%)
1%Increase(7.50%)
1%Decrease(5.50%)
DiscountRate
(6.50%)
1%Increase(7.50%)
Total OPEB liability $ 525,742 $ 454,500 $ 397,475 $ 567,205 $ 493,128 $ 433,426
Plan fiduciary net position 137,789 137,789 137,789 124,990 124,990 124,990
Net OPEB liability $ 387,953 $ 316,711 $ 259,686 $ 442,215 $ 368,138 $ 308,436
Plan fiduciary net position as apercentage of the total OPEBliability %26.2 %30.3 %34.7 %22.0 %25.3 %28.8
71 Comprehensive Annual Financial Report 2019-2020 San José Police & Fire Retirement Plan

Notes to the Basic Financial Statements (continued)
NOTE 5 - POSTEMPLOYMENT HEALTHCARE PLAN: NET OPEB LIABILITY AND CONTRIBUTIONS(continued)
Fire 2020 2019
1%Decrease
(5.50%)
DiscountRate
(6.50%)
1%Increase (7.50%)
1%Decrease(5.50%)
DiscountRate
(6.50%)
1%Increase(7.50%)
Total OPEB liability $ 312,599 $ 271,288 $ 238,081 $ 333,050 $ 290,954 $ 256,838
Plan fiduciary net position 70,743 70,743 70,743 60,967 60,967 60,967
Net OPEB liability $ 241,856 $ 200,545 $ 167,338 $ 272,083 $ 229,987 $ 195,871
Plan fiduciary net position as apercentage of the total OPEBliability %22.6 %26.1 %29.7 %18.3 %21.0 %23.7
Sensitivity of the Net OPEB Liability to Changes in the Healthcare Cost Trend Rates. Thefollowing presents the net OPEB liability, as well as what the net OPEB liability would be if it werecalculated using healthcare cost trend rates that were 1.0% lower (6.66% decreasing to 2.50%) or 1.0%higher (8.66% decreasing to 4.50%) than the current healthcare cost trend rates (dollar amounts inthousands):
Police
2020 2019
1%Decrease
HealthcareCost Trend
Rates 1%
Increase 1%
Decrease
HealthcareCost Trend
Rates 1%
Increase Total OPEB liability $ 391,661 $ 454,500 $ 533,054 $ 427,512 $ 493,128 $ 574,712
Plan fiduciary net position 137,789 137,789 137,789 124,990 124,990 124,990
Net OPEB liability $ 253,872 $ 316,711 $ 395,265 $ 302,522 $ 368,138 $ 449,722
Percentage of the totalOPEB liability %35.2 %30.3 %25.8 %29.2 %25.3 %21.7
Fire 2020 2019
1%Decrease
HealthcareCost Trend
Rates 1%
Increase 1%
Decrease
HealthcareCost Trend
Rates 1%
Increase Total OPEB liability $ 233,967 $ 271,288 $ 318,077 $ 252,507 $ 290,954 $ 338,863
Plan fiduciary net position 70,743 70,743 70,743 60,967 60,967 60,967
Net OPEB liability $ 163,224 $ 200,545 $ 247,334 $ 191,540 $ 229,987 $ 277,896
Percentage of the totalOPEB liability %30.2 %26.1 %22.2 24.1 % 21.0 % 18.0 %
For the fiscal year ended June 30, 2020, Police Department and Fire Department employer contributionswere made to the Police Department Postemployment 115 Healthcare Plan and the Fire DepartmentPostemployment 115 Healthcare Plan, respectively. Employee postemployment healthcare contributionswere made to the Postemployment Healthcare 401(h) Plan. It is unknown at this time when employeecontributions to the Police Department Postemployment 115 Healthcare Plan and the Fire DepartmentPostemployment 115 Healthcare Plan will begin, even though the Plan received an IRS private letterruling on the tax qualification of the Section 115 Trust on July 9, 2014. The Postemployment HealthcarePlan is comprised of the 401(h) Plan and the two 115 Subtrusts.
Comprehensive Annual Financial Report 2019-2020 San José Police & Fire Retirement Plan 72

Notes to the Basic Financial Statements (continued)
NOTE 5 - POSTEMPLOYMENT HEALTHCARE PLAN: NET OPEB LIABILITY AND CONTRIBUTIONS(continued)
On June 24, 2008, the City Council adopted Ordinance No. 28332 amending Chapter 3.36 of Title 3 ofthe San José Municipal Code to provide the City with the option to make lump sum payments of Cityrequired contributions to the Plan (referred to as prefunding).
In January 2011, the Board adopted a funding policy (referred to as the floor methodology) setting theCity's funding policy contribution amount to be the greater of the dollar amount reported in the actuarialvaluation or the dollar amount determined by applying the percentage of payroll reported in the valuationto the actual payroll, if actual payroll exceeds the actuarial payroll, for the fiscal year.
In September 2014, the Board approved the City's request to exclude all forms of Tier 2 from the floormethodology to ensure that the City does not pay more than the actuarially determined contribution(ADC) and the contributions are based on the ADC percentages developed by the actuary. Instead, thecontribution rate determined by the actuary multiplied by the actual payroll is what will be used.
In October 2014, the Board approved implementing an incremental reduction approach to determining"actuarial equivalence" for the prefunding when the economic expansion has exceeded 58 months induration and/or the S&P 500 has returns in excess of 130%. This approach will ensure that as businessexpansions and/or market valuation mature and exceed historic norms, the Plans reduce the incentivefor the City to prefund its contributions. The incremental reduction to the discount rate that is used tocalculate the prefunding is 15% per year, up to a maximum of 45%, which was the reduction for fiscalyear June 30, 2019.
Historically, member and City contributions to the Plan have been negotiated through collectivebargaining separately for Police and Fire and have not been actuarially determined. No amount wasdetermined on an actuarial basis for the Trusts prior to fiscal year 2019.
With the passage of Measure F, the Alternative Pension Reform Settlement Framework becameeffective as of June 16, 2017. A Voluntary Employee Beneficiary Association (VEBA) for retireehealthcare was created and Tier 1 members were eligible for a irrevocable opt-out of the defined benefitretiree healthcare plan. The VEBA opt-in election period was October 18, 2017 through December 15,2017, and the healthcare contributions of members who opted in to the VEBA was transferred out of thePostemployment Healthcare Plan in March 2018, after the IRS issued a private letter ruling to the Trustsallowing this. The VEBA is being implemented by the City, not ORS, and therefore it is also not underthe jurisdiction of the Retirement Board.
With the implementation of Measure F, Tier 1 member contributions became fixed at 8.0% of payeffective March 25, 2018, when the VEBA was implemented. Beginning with fiscal year 2018-2019, theCity's contribution toward the explicit subsidy became actuarially determined separately for Police andFire, and the City also paid the implicit subsidy on a pay-as-you-go basis as a part of the active healthpremiums. In addition, the City has an option to limit its contribution for the explicit subsidy to 11.0% ofPolice and Fire payroll. The explicit subsidy (or premium subsidy) is paid by the Plan and is the premiumfor health coverage selected by the retiree, up to 100% of the premium for the lowest cost plan offeredto active employees. The implicit subsidy is the difference between the expected claims cost for aretiree or spouse and the total (retiree plus City) premium.
With the implementation of Measure F and VEBA, Tier 2 members were automatically placed into theVEBA. The City and the bargaining units agreed that the City Manager should, pursuant to MunicipalCode section 3.36.576(c), terminate the existing Tier 2 retiree medical benefits plan effective July 30,2017, such that Tier 2 members shall not be provided benefits or make contributions to the HealthcarePlan. The City will, however, continue to make the same retiree healthcare contributions that it wasalready making in order to ensure that payment towards the unfunded liability would continue and toensure that the healthcare plan receives its full annual required contribution each year.
73 Comprehensive Annual Financial Report 2019-2020 San José Police & Fire Retirement Plan
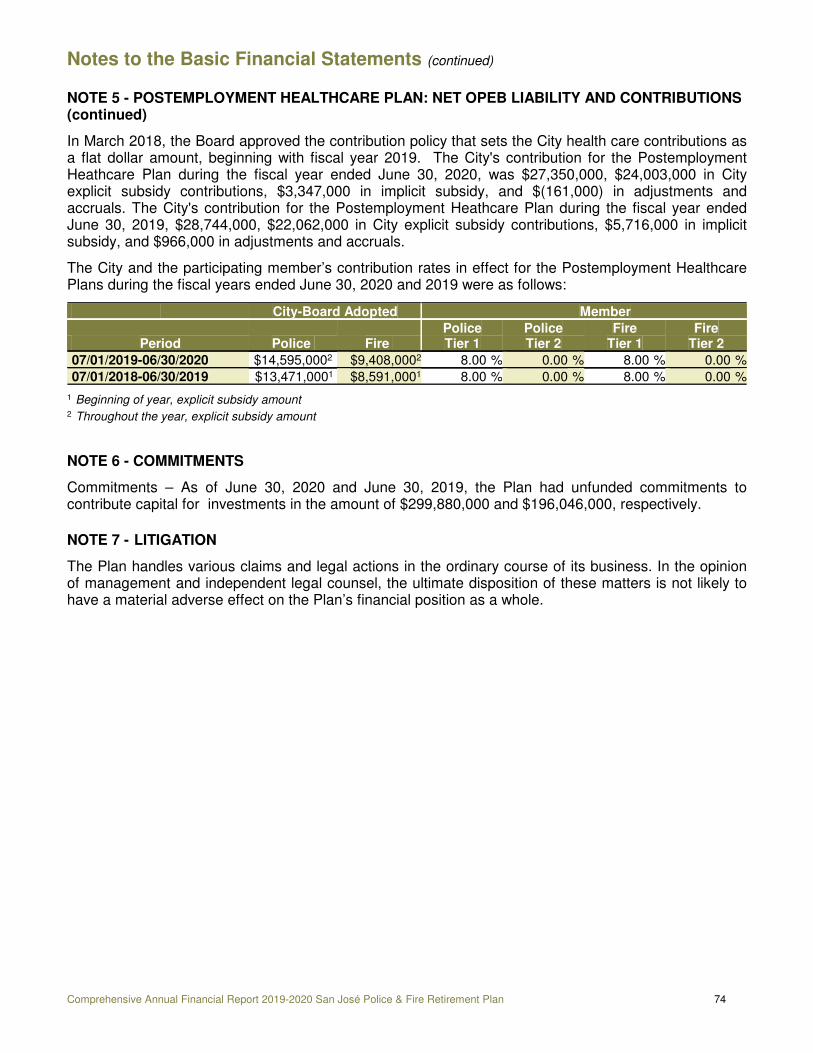
Notes to the Basic Financial Statements (continued)
NOTE 5 - POSTEMPLOYMENT HEALTHCARE PLAN: NET OPEB LIABILITY AND CONTRIBUTIONS(continued)
In March 2018, the Board approved the contribution policy that sets the City health care contributions asa flat dollar amount, beginning with fiscal year 2019. The City's contribution for the PostemploymentHeathcare Plan during the fiscal year ended June 30, 2020, was $27,350,000, $24,003,000 in Cityexplicit subsidy contributions, $3,347,000 in implicit subsidy, and $(161,000) in adjustments andaccruals. The City's contribution for the Postemployment Heathcare Plan during the fiscal year endedJune 30, 2019, $28,744,000, $22,062,000 in City explicit subsidy contributions, $5,716,000 in implicitsubsidy, and $966,000 in adjustments and accruals.
The City and the participating member’s contribution rates in effect for the Postemployment HealthcarePlans during the fiscal years ended June 30, 2020 and 2019 were as follows:
City-Board Adopted Member
Period Police Fire PoliceTier 1
PoliceTier 2
FireTier 1
FireTier 2
07/01/2019-06/30/2020 $14,595,0002 $9,408,0002 %8.00 %0.00 %8.00 %0.00
07/01/2018-06/30/2019 $13,471,0001 $8,591,0001 %8.00 %0.00 %8.00 %0.00
1 Beginning of year, explicit subsidy amount2 Throughout the year, explicit subsidy amount
NOTE 6 - COMMITMENTS
Commitments – As of June 30, 2020 and June 30, 2019, the Plan had unfunded commitments tocontribute capital for investments in the amount of $299,880,000 and $196,046,000, respectively.
NOTE 7 - LITIGATION
The Plan handles various claims and legal actions in the ordinary course of its business. In the opinionof management and independent legal counsel, the ultimate disposition of these matters is not likely tohave a material adverse effect on the Plan’s financial position as a whole.
Comprehensive Annual Financial Report 2019-2020 San José Police & Fire Retirement Plan 74

Required Supplementary Information
SCHEDULE OF CHANGES IN THE EMPLOYER'S NET PENSION LIABILITY AND RELATED RATIOS - DEFINED BENEFIT PENSION PLAN (unaudited)(Dollars in Thousands)
Total Pension Liability 2020 2019 2018 2017 2016 2015 2014Service cost (middle of year) $ 87,641 $ 81,883 $ 75,481 $ 72,760 $ 74,531 $ 74,895 $ 75,030
Interest (includes interest on servicecost) 329,612 313,565 300,378 290,961 274,487 262,738 251,701
Changes of benefit terms - - 178 5,752 - - -
Differences between expected and actualexperience 37,127 (17,011) 33,082 67,557 (8,673) 21,457 -
Change of assumptions 80,852 76,425 (100,328) 72,680 90,179 56,311 -
Benefit payments, including refunds ofmember contributions (231,007) (218,008) (206,630) (196,032) (186,939) (176,253) (167,397)
Net Change in Total Pension Liability 304,225 236,854 102,161 313,678 243,585 239,148 159,334
Total Pension Liability - Beginning 4,872,791 4,635,937 4,533,776 4,220,098 3,976,513 3,737,365 3,578,031Total Pension Liability - Ending $5,177,016 $4,872,791 $4,635,937 $4,533,776 $4,220,098 $3,976,513 $3,737,365Plan Fiduciary Net Position
Contributions - employer $ 188,481 $ 176,618 $ 157,712 $ 136,957 $ 132,480 $ 129,279 $ 123,583
Contributions - employee 27,645 24,811 23,841 20,580 21,508 20,747 21,115
Net investment income 134,085 114,179 233,475 292,734 (29,206) (27,690) 404,977
Benefit payments, including refunds ofmember contributions (231,008) (218,008) (206,630) (196,032) (186,939) (176,253) (167,397)
Administrative expense (5,605) (5,369) (5,464) (4,635) (4,254) (4,191) (3,631)
Net Change in Plan Fiduciary NetPosition $ 113,598 $ 92,231 $ 202,934 $ 249,604 $ (66,411)$ (58,108)$ 378,647
Plan Fiduciary Net Position - Beginning 3,588,422 3,496,191 3,293,257 3,043,653 3,110,064 3,168,172 2,789,525
Plan Fiduciary Net Position - Ending $3,702,020 $3,588,422 $3,496,191 $3,293,257 $3,043,653 $3,110,064 $3,168,172
Net Pension Liability - Ending $1,474,996 $1,284,369 $1,139,746 $1,240,519 $1,176,445 $ 866,449 $ 569,193
Plan Fiduciary Net Position as aPercentage of the Total PensionLiability %71.51 %73.64 %75.41 %72.64 %72.12 %78.21 %84.77
Covered Payroll $ 230,401 $ 218,619 $ 203,164 $ 188,177 $ 186,874 $ 180,226 $ 180,083Net Pension Liability as a Percentage of
Covered Payroll %640.19 %587.49 %561.00 %659.23 %629.54 %480.76 %316.07
Schedule is intended to show information for 10 years. Additional years will be displayed as they become available.
SCHEDULE OF INVESTMENT RETURNS - DEFINED BENEFIT PENSION PLAN (unaudited)
2020 2019 2018 2017 2016 2015 2014Annual money-weighted rate ofreturn, net of investment expense 2.98% 4.00% 6.89% 9.68% (0.85)% 0.85% 13.0%
The rate shown above is based on the Defined Benefit and 401(h) only and does not include the 115 subtrusts. Schedule isintended to show information for 10 years. Additional years will be displayed as they become available.
75 Comprehensive Annual Financial Report 2019-2020 San José Police & Fire Retirement Plan

Required Supplementary Information (continued)SCHEDULE OF EMPLOYER CONTRIBUTIONS - DEFINED BENEFIT PENSION PLAN (unaudited)(Dollars in thousands)
2020 2019 2018 2017 2016 2015 2014 2013 2012 2011Actuariallydeterminedcontribution $ 188,481 $ 176,618 $ 157,712 $ 136,957 $ 132,480 $ 129,279 $ 123,583 $ 105,234 $ 121,008 $ 77,918
Contributions inrelation toactuariallydeterminedcontribution 188,481 176,618 157,712 136,957 132,480 129,279 123,583 105,234 121,008 77,918
Contributiondeficiency(excess) $ - $ - $ - $ - $ - $ - $ - $ - $ - $ -
Covered payroll $ 230,401 $ 218,619 $ 203,164 $ 188,177 $ 186,874 $ 180,226 $ 180,083 $ 180,333 $ 184,750 $ 222,464
Contributions asa percentage ofcovered payroll 81.81% 80.79% 77.63% 72.78% 70.89% 71.73% 68.63% 58.36% 65.50% 35.02%
Actuarial valuations have been performed biennially through June 30, 2007. Effective with the June 30, 2009 valuation, whichdetermined contributions rates for fiscal year 2011, the plan transitioned to annual actuarial valuations.
NOTES TO SCHEDULE
Actuarially determined contribution rates are calculated as of June 30, two years prior to the end of thefiscal year in which contributions are reported.
FiscalYear 2020 2019 2018 2017 2016 2015 2014 2013 2012 2011
ValuationDate 2018 2017 2016 2015 2014 2013 2012 2011 2010 2009
Actuarialcost method
Entry age Entry Age Entry age Entry age Entry age Entry age Entry age Entry age Entry age Entry age
Assetvaluationmethod
5-yearsmoothedmarket
5-yearsmoothedmarket
5-yearsmoothedmarket
5-yearsmoothedmarket
5-yearsmoothedmarket
5-yearsmoothedmarket
5-yearsmoothedmarket
5-yearsmoothedmarket
5-yearsmoothedmarket
5-yearsmoothedmarket
Amorti-zationmethod
Actuarialgains andlosses andplan changesareamortizedover a 15-year periods. Methods andassumptionsareamortizedover closed20-yearperiods. Allamortiza-tions are alevel percentof payroll.
Actuarialgains andlosses andplanchanges areamortizedover closed15-yearperiods.Method andassumptionchanges areamortizedover closed20-yearperiods. Allamortiza-tions are alevel percentof payroll
Actuarialgains andlosses andplanchanges areamortizedover closed16-yearperiods.Method andassumptionchanges areamortizedover closed20-yearperiods. Allamortiza-tions are alevel percentof payroll
Actuarialgains andlosses andplanchanges areamortizedover closed16-yearperiods.Method andassumptionchanges areamortizedover closed20-yearperiods. Allamortiza-tions are alevel percentof payroll
Actuarialgains andlosses andplanchanges areamortizedover closed16-yearperiods.Method andassumptionchanges areamortizedover closed20-yearperiods. Allamortiza-tions are alevel percentof payroll
Actuarialgains andlosses andplanchanges areamortizedover closed16-yearperiods.Method andassumptionchanges areamortizedover closed20-yearperiods. Allamortiza-tions are alevel percentof payroll
Actuarialgains andlosses andplanchanges areamortizedover closed16-yearperiods.Method andassumptionchanges areamortizedover closed20-yearperiods. Allamortiza-tions are alevel percentof payroll
Actuarialgains andlosses andplanchanges areamortizedover closed16-yearperiods.Method andassumptionchanges areamortizedover closed20-yearperiods. Allamortiza-tions are alevel percentof payroll
Actuarialgains andlosses andplanchanges areamortizedover closed16-yearperiods.Method andassumptionchanges areamortizedover closed20-yearperiods. Allamortiza-tions are alevel percentof payroll
Actuarialgains andlosses andplanchanges areamortizedover closed16-yearperiods.Method andassumptionchanges areamortizedover closed20-yearperiods. Allamortiza-tions are alevelpercent ofpayroll
Discountrate
6.75% 6.875% 6.875% 7.0% 7.0% 7.125% 7.25% 7.5% 7.75% 8.0%
Comprehensive Annual Financial Report 2019-2020 San José Police & Fire Retirement Plan 76

Required Supplementary Information (continued)
NOTES TO SCHEDULE (continued)
FiscalYear 2020 2019 2018 2017 2016 2015 2014 2013 2012 2011
ValuationDate 2018 2017 2016 2015 2014 2013 2012 2011 2010 2009
Salaryincreases
3.25% perannum (.75%real wagegrowth) plusmeritcomponentbased onlength ofserviceranging from6.00% fornew hires to0.50% formemberswith 10 ormore yearsof service
3.25% plusmeritcomponentbased onlength ofserviceranging from6.75% fornew hires to1.00% formemberswith 10 ormore yearsof service
3.25% plusmeritcomponentbased onlength ofserviceranging from6.00% fornew hires to.50% formemberswith 10 ormore yearsof service
3.25% plusmeritcomponentbased onlength ofserviceranging from6.75% fornew hires to1.00% formemberswith 10 ormore yearsof service
3.25% plusmeritcomponentbased onlength ofserviceranging from9.25% fornew hires to2.00% formemberswith 10 ormore yearsof service
2.00% forFY 2015,and 3.50%thereafterplus meritcomponentbased onlength ofserviceranging from9.25% fornew hires to2.00% formemberswith 10 ormore yearsof service
0.00% forFY 2014,and 3.50%thereafterplus meritcomponentbased onlength ofserviceranging from8.00% fornew hires to2.25% formemberswith 10 ormore yearsof service
0.00% forFY 2013 and2014, and3.50%thereafterplus meritcomponentbased onlength ofserviceranging from8.00% fornew hires to2.25% formemberswith 10 ormore yearsof service
4.25% plusmeritcomponentbased onlength ofserviceranging from5.50% fornew hires to1.75% formemberswith 8 ormore yearsof service
4.25% plusmeritcomponentbased onlength ofserviceranging from5.50% fromnew hires to1.75% formemberswith 8 ormore yearsof service
Amortiza-tion growthrate
3.25% 3.25% 3.25% 3.25% 3.25% 3.5% 3.5% 4.25% 4.25% 4.25%
Mortality Healthyannuitants:CalPERS2009 HealthyAnnuityMortalityTablesmultiplied by0.948 formales and1.048 forfemales, withmortalityimprove-mentsprojectedfrom 2009using SOAMP-2017 ona genera-tional basisDisabledannuitants:CalPERS2009IndustrialMortalityTables forMalesmultiplied by0.903, withmortalityimprove-mentsprojectedfrom 2009using SOAMP-2017 ona genera-tional basis
Healthyannuitants:CalPERS2009HealthyAnnuityMortalityTablesmultiplied by0.948 formales and1.048 forfemales,withmortalityimprove-mentsprojectedfrom 2009using SOAMP-2017 ona genera-tional basisDisabledannuitants:CalPERS2009IndustrialMortalityTables forMalesmultiplied by0.903, withmortalityimprove-mentsprojectedfrom 2009using SOAMP-2017 ona genera-tional basis
Healthyannuitants:CalPERS2009HealthyAnnuityMortalityTablesmultiplied by0.948 formales and1.048 forfemales,withmortalityimprove-mentsprojectedfrom 2009using SOAMP-2015 ona genera-tional basisDisabledannuitants:CalPERS2009IndustrialMortalityTables forMalesmultiplied by0.903, withmortalityimprove-mentsprojectedfrom 2009using SOAMP-2015 ona genera-tional basis
Healthyannuitants:CalPERS2009HealthyAnnuityMortalityTablesmultiplied by0.948 formales and1.048 forfemales,withmortalityimprove-mentsprojectedfrom 2009using ScaleMP-2015 ona genera-tional basisDisabledannuitants:CalPERS2009IndustrialMortalityTables forMalesmultiplied by0.903, withmortalityimprove-mentsprojectedfrom 2009using ScaleMP-2015 ona genera-tional basis
RP-2000combinedhealthymortalitytable with nocollaradjustmentprojected to2010 usingscale AA. Male ratesare set backthree years
RP-2000combinedhealthymortalitytable with nocollaradjustmentprojected to2010 usingscale AA. Male ratesare set backthree years
RP-2000combinedhealthymortalitytable with nocollaradjustmentprojected to2010 usingscale AA. Male ratesare set backthree years
RP-2000combinedhealthymortalitytable with nocollaradjustmentprojected to2010 usingscale AA. Male ratesare set backthree years
RP-2000combinedhealthymortalitytable with nocollaradjustmentprojected to2010 usingscale AA. Male ratesare set backfour years
RP-2000combinedhealthymortalitytable with nocollaradjustmentprojected to2010 usingscale AA.Male ratesare set backfour years,are setforward oneyear
1Actuarial valuations were performed biennially through June 30, 2007. Effective June 30, 2009, the Plan transitioned to annually.
77 Comprehensive Annual Financial Report 2019-2020 San José Police & Fire Retirement Plan

Required Supplementary Information (continued)
SCHEDULE OF CHANGES IN THE EMPLOYER'S NET OPEB LIABILITY AND RELATED RATIOS -POSTEMPLOYMENT HEALTHCARE PLANS (unaudited)(Dollars in thousands)
Total OPEB Liability 2020 2019 2018 2017Police Fire Police Fire Police Fire Police Fire
Service cost (middle of year) $ 6,848 $ 5,965 $ 8,168 $ 6,835 $ 6,970 $ 6,031 $ 9,218 $ 6,894
Interest (includes interest onservice cost) 28,017 16,659 30,378 17,830 28,805 16,509 29,674 17,100
Changes of benefit terms - - - - (43,208) (26,226) - -
Differences between expectedand actual experience (64,507) (34,812) (3,712) 311 7,881 6,996 - -
Change of assumptions 6,817 1,750 25,022 13,821 13,450 7,793 - -
Benefit payments, includingrefunds of membercontributions (15,803) (9,228) (17,235) (9,168) (17,113) (10,573) (14,931) (9,868)
Net Change in Total OPEBLiability $ (38,628)$ (19,666)$ 42,621 $ 29,629 $ (3,215)$ 530 $ 23,961 $ 14,126
Total OPEB Liability -Beginning 493,128 290,954 450,507 261,325 453,722 260,795 429,761 246,669Total OPEB Liability - Ending $ 454,500 $ 271,288 $ 493,128 $ 290,954 $ 450,507 $ 261,325 $ 453,722 $ 260,795
Plan Fiduciary Net Position
Contributions - employer 16,522 10,828 17,785 10,959 14,964 10,418 11,701 8,966
Contributions - employee 7,331 5,804 7,635 5,680 9,294 6,833 10,344 7,772
Net investment income 4,826 2,417 5,232 2,675 5,148 1,923 8,844 3,610
Benefit payments, includingrefunds of membercontributions (15,803) (9,228) (17,235) (9,168) (17,113) (10,573) (14,931) (9,868)
Administrative expense (77) (45) (86) (40) (115) (44) (123) (58)
VEBA Transfer - - - - (5,276) (2,621) - -
Net Change in Plan FiduciaryNet Position $ 12,799 $ 9,776 $ 13,331 $ 10,106 $ 6,902 $ 5,936 $ 15,835 $ 10,422Plan Fiduciary Net Position -Beginning $ 124,990 $ 60,967 $ 111,659 $ 50,861 $ 104,757 $ 44,925 $ 88,922 $ 34,503Plan Fiduciary Net Position -Ending $ 137,789 $ 70,743 $ 124,990 $ 60,967 $ 111,659 $ 50,861 $ 104,757 $ 44,925
Net OPEB Liability - Ending $ 316,711 $ 200,545 $ 368,138 $ 229,987 $ 338,848 $ 210,464 $ 348,965 $ 215,870
Plan Fiduciary Net Position as aPercentage of the Total OPEBLiability %30.32 %26.08 %25.35 %20.95 %24.79 %19.46 %23.09 %17.23Covered Payroll $ 140,897 $ 89,504 $ 133,617 $ 85,002 $ 121,585 $ 81,579 $ 108,424 $ 79,752Net OPEB Liability as aPercentage of Covered Payroll %224.78 %224.06 %275.52 %270.57 %278.69 %257.99 %321.85 %270.68Schedule is intended to show information for 10 years. Additional years will be displayed as they become available.
SCHEDULE OF INVESTMENT RETURNS - POSTEMPLOYMENT HEALTHCARE PLAN (unaudited)
2020 2019 2018 2017Annual money-weighted rate ofreturn, net of investment expense 1.95% 4.86% 3.56% 7.17%
The rate shown above is based on the 115 subtrusts only and does not include the 401(h). Schedule is intended to show
information for 10 years. Additional years will be displayed as they become available.
Comprehensive Annual Financial Report 2019-2020 San José Police & Fire Retirement Plan 78

Required Supplementary Information (continued)
SCHEDULE OF EMPLOYER CONTRIBUTIONS - POSTEMPLOYMENT HEALTHCARE PLANS (unaudited)
Beginning in FYE 2010 for Police and FYE 2012 for Fire members, actual contributions were intended tophase in to the full Annual Required Contribution (ARC) as defined in the bargaining agreements andconsistent with the parameters of GASB Statement No. 45, but the contribution rates were cappedbefore the full ARC was reached. With the contribution rates capped, the ARC has been determined asthe minimum amount that was consistent with the parameters of GASB Statement No. 45. No amounthas been determined on an actuarial basis to fund the plan, and consequently, the schedule of employercontributions was not provided in prior years.
With the implementation of Measure F, fiscal year ending June 30, 2019 is the first year for which anActuarially Determined Contribution was determined.
2020 2019
Police Fire Police FireActuarially determined contributions (ADC) $ 16,522 $ 10,828 $ 17,785 $ 10,959
Contributions in relation to ADC 16,522 10,828 17,785 10,959
Contribution deficiency (excess) $ - $ - $ - $ -
Covered employee payroll $ 140,897 $ 89,504 $ 133,617 $ 85,002
Contributions as a percentage of covered
employee payroll 11.73% 12.10% 13.31% 12.89%
(Dollars in thousands)
NOTES TO SCHEDULE
Fiscal Year 2020 2019Valuation Date 2018 2017 Timing Actuarially determined contributions
are calculated based on the actuarialvaluation one year prior to thebeginning of the fiscal year
Actuarially determined contributionsare calculated based on the actuarialvaluation one year prior to thebeginning of the fiscal year
Key Methods and Assumptions used to Determine Contribution Rates: Actuarial cost method Individual entry age Individual entry age
Asset valuation method Fair value of assets Fair value of assets
Amortization method 25-year layered amortizations with3-year phase-in and phase-out
25-year layered amortization with3-year phase-in and phase-out
Discount rate 6.50% 6.875%
Amortization growth rate 3.25% 3.25%
Ultimate rate of medical inflation 4.25% 4.25%
Salary increases 3.25% plus merit component basedon years of service
3.25% plus merit component basedon years of service
Rates of mortality Adjusted 2009 CalPERS mortalitytables projected on a generationalbasis with the SOA MP-2017projection scale
Adjusted 2009 CALPERS mortalitytables projected on a generationalbasis with the SOA MP-17 projectionscale
A complete description of the methods and assumptions used to determine contributions for the year ending June 30, 2020 and
June 30, 2019 can be found in the June 30, 2018 and June 30, 2017 actuarial valuation report, respectively.
79 Comprehensive Annual Financial Report 2019-2020 San José Police & Fire Retirement Plan

Other Supplemental Information
COMBINING SCHEDULE OF DEFINED BENEFIT PENSION PLAN NET POSITIONAs of June 30, 2020 (In Thousands)
Retirement Fund Cost-of-Living Fund TotalASSETS
ReceivablesEmployee contributions $ 923 $ 358 $ 1,281
Employer contributions 4,696 4,231 8,927
Brokers and others 8,765 7,484 16,249
Accrued investment income 60,940 40,140 101,080
Total Receivables 75,324 52,213 127,537
Investments, at fair valueSecurities and other:
Public equity 996,626 692,635 1,689,261
Private equity 209,066 145,297 354,363
Investment grade bonds 190,524 132,410 322,934
Private debt 115,178 80,047 195,225
Immunized cash flows 95,828 66,598 162,426
Core real estate 84,058 58,419 142,477
Growth real estate 75,105 52,196 127,301
Market neutral strategies 70,046 48,681 118,727
Emerging market bonds 68,561 47,648 116,209
Long-term government bonds 65,277 45,366 110,643
Treasury inflation-protected securities 43,818 30,453 74,271
High yield bonds 43,512 30,239 73,751
Cash and cash equivalents 39,239 27,270 66,509
Private real assets 19,947 13,863 33,810
International currency contracts, net (12) (9) (21)
Total Investments 2,116,773 1,471,113 3,587,886
Capital Assets, net 2,170 1,324 3,494
TOTAL ASSETS 2,194,267 1,524,650 3,718,917LIABILITIES
Payable to brokers 9,783 5,467 15,250
Other liabilities 984 663 1,647TOTAL LIABILITIES 10,767 6,130 16,897PLAN NET POSITION - RESTRICTED FORPension benefits 2,183,500 1,518,520 3,702,020
TOTAL PLAN NET POSITION $ 2,183,500 $ 1,518,520 $ 3,702,020
Comprehensive Annual Financial Report 2019-2020 San José Police & Fire Retirement Plan 80

Other Supplemental Information (continued)
COMBINING SCHEDULE OF CHANGES IN DEFINED BENEFIT PENSION PLAN NET POSITIONFor Fiscal Year Ended June 30, 2020 (In Thousands)
Retirement Fund Cost-of-Living Fund TotalADDITIONS
ContributionsEmployee $ 19,868 $ 7,777 $ 27,645
Employer 98,954 89,527 188,481
Total Contributions 118,822 97,304 216,126
Investment income Net appreciation in fair value of
investments 72,519 49,674 122,193
Interest income 10,831 7,277 18,108
Dividend income 5,629 3,783 9,412
Less: investment expense (9,346) (6,282) (15,628)
Net Investment Income 79,633 54,452 134,085
TOTAL ADDITIONS 198,455 151,756 350,211
DEDUCTIONSRetirement benefits 149,943 66,263 216,206
Death benefits 7,420 6,818 14,238
Refund of contributions 460 104 564
Administrative expenses and other 3,364 2,241 5,605
TOTAL DEDUCTIONS 161,187 75,426 236,613
NET INCREASE 37,268 76,330 113,598
PLAN NET POSITION - RESTRICTED FOR PENSION BENEFITS
BEGINNING OF YEAR 2,146,232 1,442,190 3,588,422END OF YEAR $ 2,183,500 $ 1,518,520 $ 3,702,020
81 Comprehensive Annual Financial Report 2019-2020 San José Police & Fire Retirement Plan

Other Supplemental Information (continued)
SCHEDULES OF ADMINISTRATIVE EXPENSES AND OTHERFor the Fiscal Years Ended June 30, 2020 and 2019
2020 2019OriginalBudget Actual
UnderBudget Actual
Personnel services $ 3,898,000 $ 3,553,452 $ 344,548 $ 3,334,302
Non-personnel/equipment1 1,408,000 1,063,503 344,497 1,026,381
Professional services 1,063,000 700,695 362,305 1,000,776
Amortization expense 2 - 408,727 - 133,809
TOTAL ADMINISTRATIVE EXPENSES & OTHER $ 6,369,000 $ 5,726,377 $ 1,051,350 $ 5,495,2681 $279,000 and $416,715 of investment-related expenses including data processing were included in the budget approved by the Board for FY 19-20 and FY18-19, respectively. The actual amounts spent for those items are included in the Schedule of Investment Expenses - Other Investment Fees.
2 Amortization expense is excluded from the budget totals since it is a non-cash item.
SCHEDULES OF PAYMENTS TO CONSULTANTSFor the Fiscal Years Ended June 30, 2020 and 2019
Firm Nature of Service 2020 2019Cheiron, Inc. Actuarial consultant $ 227,386 $ 247,484
Cortex Governance consultant 45,270 35,869
Grant Thornton LLP External auditors 55,427 101,343
Ice Miller, LLC Tax counsel 18,693 4,356
Levi, Ray, & Shoup Web development and maintenance 4,624 16,832
Levi, Ray, & ShoupProgramming changes and businesscontinuance services 4,520 8,739
Medical Director/Other Medical Medical consultants 97,410 180,789
Pension Benefit Information Reports on deceased benefit recipients 2,319 2,100
Reed Smith, LLP Legal counsel 144,070 121,776
Saltzman & Johnson Legal counsel 50,336 95,501
Trendtec, Inc Temporary staff 50,452 185,687
Other Consultants Miscellaneous professional services 188 300
TOTAL $ 700,695 $ 1,000,776
Comprehensive Annual Financial Report 2019-2020 San José Police & Fire Retirement Plan 82

Other Supplemental Information (continued)
SCHEDULES OF INVESTMENT EXPENSESFor the Fiscal Years Ended June 30, 2020 and 2019
Investment Managers' Fees 2020 2019Public equity $ 3,251,035 $ 3,165,499
Private equity 1,942,699 2,188,269
Investment grade bonds 112,562 -
Growth real estate 2,763,498 -
Private debt 2,104,933 1,292,738
Immunized cash flows 87,559 -
Core real estate 1,161,454 5,166,700
Market neutral strategies 2,108,335 1,896,557
Global fixed income - 527,819
Treasury inflation-protected securities 36,556 -
High yield bonds / emerging market bonds 68,876 1,263,210
Short-term investment grade bonds 53,801 -
Private real assets 948,208 1,058,508
Sovereign bonds ex US 39,584 -
Commodities 243,411 428,715
Total investment managers' fees 14,922,511 16,988,015
Other Investment Fees
Investment consultants 580,000 592,500
Custodian bank 307,702 316,824
Investment legal fees 136,954 93,828
Other investments fees 16,630 17,328
Total other investment fees 1,041,286 1,020,480TOTAL INVESTMENT EXPENSES $ 15,963,797 $ 18,008,495
83 Comprehensive Annual Financial Report 2019-2020 San José Police & Fire Retirement Plan

City�of�San�José�Police�and�Fire�Department�Retirement�Plan
Comprehensive�Annual�Financial�Report�for�the�Fiscal�Years�ended�June�30,�2020�and�June�30,�2019
Pension�Trust�and�Postemployment�Healthcare�Trust��
Funds�of�the�City�of�San�José,�California
Investment�Section

Report of Investment Activity
BOSTON��CHICAGO��LONDON��MIAMI ��NEW�YORK� �PORTLAND��SAN�DIEGO�
5796�Armada�Drive�
Suite�110�
Carlsbad,�CA�92008�
760.795.3450�
Meketa.com�
August�27,�2020�
Mr.�Roberto�L.�Peña�Director�The�City�of�San�Jose�Police�and�Fire�Department�Retirement�Plan�1737�North�First�Street,�Suite�600�San�Jose,�CA�95112-4505�
Dear�Mr.�Peña:�
Please�find�below�a�summary�of�the�market�environment�and�Plan�performance�through�June�30,�2020.�
The�past�year�has�seen�remarkable�shifts�in�economic�and�financial�market�performance.��We�entered�fiscal�year�2020�facing�considerable�uncertainty�regarding�the�path�of�fiscal�and�monetary�policies,�elevated�valuations,�declining�growth�in�China,�a�general�slowdown�in�global�growth,�the�potential�for�additional�trade�issues,�and�political�uncertainty�in�Europe�(Italy,�Greece,�Brexit).��All�of�these�concerns�[IMKLIH�LIEZMP]�SR�QSWX�MRZIWXSVW�QMRHW���*EWX�JSV[EVH�XS�[LIVI�[I�WMX�XSHE]�EX�XLI�GPSWI�SJ�XLI���20�fiscal�year,�and�much�has�changed�in�the�world.�
The�start�of�the�fiscal�year�was�characterized�by�widespread�concerns�regarding�slowing�global�growth.��This� backdrop� of� uncertainty� prompted� major� central� banks� to� continue� their� pivot� toward� more�accommodative�policies.�Here�in�the�US,�ongoing�concerns�regarding�a�decline�in�growth�and�the�trade�WXERHSJJ�FIX[IIR�XLI�97�ERH�'LMRE�TPE]IH�E�OI]�VSPI� MR� XLI�*IHIVEP�6IWIVZIØW�HIGMWMSR�XS�GYX�VEXIW�several�times,�and�eventually�settle�at�a�range�of�1.50-1.75%�by�December�2019.��Considering�that�the�Fed�had�previously�embarked�on�what�was�characterized�as�a�fairly�aggressive�rate-hiking�cycle�until�late� 2018� given� improvements� in� the� economy,� this� represented� a� stark� reversal� of� course.� Fed�Chairman� Jerome� 4S[IPP� MRHMGEXIH� XLEX� XLIWI� WS� GEPPIH� ÚMRWYVERGI� GYXWÛ� [IVI� XS� GSQFEX� VIGIRX�weakness�in�the�economy�and�were�not�necessarily�a�part�of�a�longer�cycle�of�interest�rate�cuts.�
3YXWMHI�SJ�XLI�97��QENSV�GIRXVEP�FEROW��RSXEFP]�XLI�)YVSTIER�'IRXVEP�&ERO��Ú)'&Û �and�the�Bank�of�Japan,�affirmed�similar�accommodative�policy�stances.��ECB�President�Mario�Draghi,�in�one�of�his�last�formal�acts�as�President,�re-MRMXMEXIH�XLI�)'&ØW�UYERXMXEXMZI�IEWMRK�TVSKVEQ��TVMSV�XS�FIMRK�WYGGIIHIH�by� Christine� Lagarde� in� November� 2019.� � Continued� monetary� accommodation,� and� increasing�whispers�of�more� formal� fiscal�support,� set� the�stage�for�strong�performance� in�global�equities�and�other�risk�assets�at�the�end�of�2019.���
In�the�third�calendar�quarter�of�2019,�markets�experienced�mixed�results�with�US�stocks�and�bonds�posting� gains,� while� international� assets,� smaller� company� stocks,� and� commodities� declined.� The�calendar�year�finished�strong�though�as�a�result�of�broadly�accommodative�policy�stances,�coupled�with�
85 Comprehensive Annual Financial Report 2019-2020 San José Police & Fire Retirement Plan

Report of Investment Activity (continued)
�
August�27,�2020
� Page�2�of�9�
optimism�about�the�pass-through�of�easier�monetary�policy�to�better�economic�prospects.��US�equities�led�the�way�in�the�second�half�of�calendar�2020,�with�the�Russell�3000�posting�a�return�of�10.4%,�followed�by�emerging�market�equities�(MSCI�Emerging�Markets�Index)�producing�a�return�of�7.1%,�and�developed�international�markets�(MSCI�EAFE)�generating�a�return�of�7.0%.��With�interest�rates�declining�toward�multi-decade� lows,� spread�sectors�within�bond�markets�enjoyed�strong�performance�as�well.� �Local�currency�emerging�markets�debt,�US�investment�grade�corporate�debt,�and�US�high�yield�debt�led�the�way;�the�JP�Morgan�GBI-EM�Global�Diversified,�Bloomberg�Barclays�US�Corporate�Investment�Grade,�and�Bloomberg�Barclays�US�Corporate�High�Yield� indices�generated�total�returns�of�4.4%,�4.3%,�and�4.0%,�respectively�in�the�second�half�of�2019.��The�VIX�Index�(a�measure�of�volatility�expectations),�which�saw�a�jump�in�Q4�2019�above�30.0�before�ending�the�year�at�25.4,�fell�markedly�as�the�year�came�to�a�close,�ending�2019�at�an�extremely�benign�level�of�13.8.��Gold�ended�the�year�with�a�reasonably�strong�gain,�trading�at�$1,519.50�at�the�end�of�2019,�up�from�$1,278.30�at�the�end�of�2018.��WTI�Crude�ended�2019�at�$61.10,�an�increase�from�its�year-end�2018�level�of�$45.15.�
By�most�accounts,�global�financial�markets�entered�calendar�year�2020�on�relatively�strong�footing.��Equity�markets�continued�their�march�higher�early�in�the�year,�despite�elevated�valuations,�as�investors�increasingly� began� to� price� in� a� reflationary� growth� impulse,� as� suggested� by� leading� economic�indicators� in� global� developed� and� emerging� markets.� � However,� a� relatively� optimistic� backdrop�underwent�a�remarkably�rapid�shift�over�the�course�of�just�a�few�weeks.���
In�January,�the�first�COVID-19�case�was�acknowledged�by�Chinese�authorities,�reportedly�originating�in�Wuhan,�China.� �The�actual� timeline�of� the�spread�of� the�virus�and� its�origination�continue� to�be� the�WYFNIGX�SJ�QYGL�WTIGYPEXMSR���;MXL�PMQMXIH�LMWXSVMGEP�TVIGIHIRX��QEVOIX�TEVXMGMTERXW�PIERIH�SR�'LMREØW�relative�success�in�containing�SARS�as�indicative�of�the�path�of�COVID-19.��By�March,�the�virus�began�to�
spread�globally,�particularly�in�Europe,�with�Italy�and�Spain�reporting�massive�spikes�in�infections�and,�sadly,� mortality� rates,� so� markets� changed� course.� � Clearly,� where� SARS� was� quickly� contained,�COVID-��ØW�MRJIGXMSR�VEXI�LEH�I\TPSHIH�KPSFEPP]���&]�ZMVXYI�SJ�KVIEXIV�JVIIHSQ�SJ�XVEZIP�ERH���WX�GIRXYV]�globalization,� the�virus�spread� far�more�quickly� than�was� initially�expected�based�on�previous�viral�outbreaks.� � In�March,� in�an�effort� to�contain� the�spread,�countries� responded�by�enacting�stringent�PSGOHS[RW��SV�ÚWXE]�EX�LSQI�SVHIVWÛ�PIEHMRK�XS�ER�EFVYTX�LEPX�MR�TVSHYGXMSR�ERH�GSRWYQTXMSR��0E]SJJW�expanded�dramatically�and�swiftly,�as�businesses�were�forced�to�close�down� in�an�effort� to�stop�the�disease�from�spreading.�
The� impact�on� financial�markets�was�extreme.� �Global�equity�markets� rapidly�entered�bear�market�territory,�and�continued�their�path�downward�throughout�the�month�of�March,�as�market�participants�attempted�to�price�in�the�impact�of�the�cessation�of�a�large�portion�of�global�economic�activity.��With�limited�data�on�COVID-����XLI�TIRHYPYQ�GPIEVP]�W[YRK�XS[EVH�TIWWMQMWQ�VIKEVHMRK�XLI�ZMVYW�MQTEGX�
and�the�likely�path�of�activity�going�forward.��After�ending��2019�below�14,�the�VIX�spiked�above�its�prior�peak�during�the�Global�Financial�Crisis,�briefly�breaching�80�in�early�March.��In�the�US,�circuit�breakers�were�triggered�at�the�New�York�Stock�Exchange,�with�markets�opening�limit�down,�on�March�9th�and�March�16th.��At�the�depth�of�the�drawdown�from�January�1,�2020�to�March�23,�2020,�the�Russell�3000�was�down�-31.6%,� the�MSCI�EAFE� Index�(developed�market�equities)�was�down� -33.2%,�and� the�MSCI�
Comprehensive Annual Financial Report 2019-2020 San José Police & Fire Retirement Plan 86

Report of Investment Activity (continued)
�
August�27,�2020�
� Page�3�of�9�
Emerging�Markets�Index�(emerging�market�equities)�was�down�-31.8%.��The�perception�of�acute�stress�in� credit�markets,� both� in� the� US� and� abroad,� led� to� solvency� fears;� the� Barclays�High�Yield� index�fell�-19.8%.��Investors�universally�fled�risk�assets,�in�all�forms,�during�the�selloff�in�favor�of�perceived�safer�assets�like�US�Treasuries.�
Over�this�same�time�period,�the�spread�between�large�cap�stocks,�which�went�into�the�shock�with�stronger�financial�positions�and�have�tended�to�experience�less�volatility�in�drawdowns,�and�small�cap�stocks,�which�are�more�pro-cyclical�and�volatile,�widened�during�the�selloff.��Whereas�the�Russell�1000�fell�by�-31.1%,�the�Russell�2000�fell�by�-39.7%,�a�spread�of�nearly�10%.��Going�further,�the�ever-widening�performance�gap�between� growth� and� value,� which�we� have� highlighted� in� past� CAFR� reviews,� persisted.� � The� spread�between�large�cap�growth�and�small�cap�value�expanded�during�the�selloff,�with�the�Russell�1000�Growth�declining�25.1%�and�the�Russell�2000�Value�falling�44.3%,�for�a�spread�of�nearly�20%.�
The�rapid�unwind�of�risk�in�early�2020,�which�was�one�of�the�fastest�market�selloffs�in�modern�financial�history,�reinforced�the�importance�of�diversification.��While�equity�and�credit�markets�fell�precipitously,�bonds�provided�an�offset�for�investors.��The�Bloomberg�Barclays�US�Aggregate�generated�a�return�of�1.0%� over� the� course� of� the� drawdown� noted� above,� and� long-term� treasuries,� measured� by� the�Bloomberg�Barclays�Long�US�Government�index,�generated�a�return�of�20.2%.���
The�volatility�of� the�pandemic�was�exacerbated�by�volatility� in�oil�prices,�which�experienced�a�rapid�collapse� early� in� 2020.� � The� COVID-19� related� restrictions� weighed� heavily� on� demand,� with�Saudi�%VEFMEØW�YRXMQIP]�HIGMWMSR� XS� JPSSH� XLI�QEVOIX�[MXL�SMP� XS� KEMR�QEVOIX� WLEVI�GVIEXMRK� JYVXLIV�stress�on�prices.��Oil�futures�briefly�traded�at�negative�price�levels�during�the�depths�of�the�crisis,�as�demand�collapsed�and�storage�capacity�dwindled.��The�May�WTI�futures�contract�briefly�changed�hands�at�nearly� -$40�per�barrel.� �Commodity�and�natural� resource�asset� classes�both�participated� in� the�broader�market�selloff;�the�Bloomberg�Commodity�Index�and�the�S&P�Global�Natural�Resources�Index�were�down�-23.4%�and�-44.6%�at�the�trough,�respectively.��While�the�futures�curve�has�since�normalized,�the�oil�supply/demand�dynamic�remains�in�flux.��OPEC+�(inclusive�of�additional�key�producers�such�as�Russia)�reached�a�supply�cut�agreement�in�April�that�supported�prices�and�stabilized�the�market.���
To�combat�the�expected,�significant�decline�in�economic�activity,�global�fiscal�and�monetary�authorities�responded�with�immediate�and�historic�stimulus�measures.��The�Federal�Reserve,�in�the�midst�of�the�March�drawdown,� immediately�cut� the�Fed�Funds�Target�Rate�effectively� to�zero,�and�subsequently�introduced�aggressive�stimulus�measures,�including�backstop�liquidity,�funding�programs,�and�trillions�of� dollars� in� promised� asset� purchases.� � Meanwhile,� fiscal� authorities� released� over� $2.4� trillion� in�targeted�stimulus,�with�the�promise�of�additional�measures�in�the�future.��Importantly,�both�the�speed�and�breadth�of�the�response,�made�the�joint�monetary/fiscal�stimulus�unprecedented.��In�Japan�and�Europe,�similarly�aggressive�monetary�and�fiscal�measures�were�implemented,�although�it�should�be�noted�that�they�entered�the�crisis�with�no�room�to�cut�policy�rates,�so�their�focus�was�on�quantitative�easing�and�fiscal�measures.�
Robust�stimulus�across�global�developed�and�emerging�economies,�coupled�with�incremental�positive�news�regarding�the�spread�of�COVID-19�and�economies�slowly�reopening,�set�the�stage�for�a�relatively�
87 Comprehensive Annual Financial Report 2019-2020 San José Police & Fire Retirement Plan

Report of Investment Activity (continued)
�
August�27,�2020
� Page�4�of�9�
rapid�rebound� in�risk�assets� in�the�second�quarter.� �While�the�pace�of� the�deceleration� in�economic�activity�was�rapid,�and�data�for�the�second�calendar�quarter�of�2020�has�been�relatively�dire�in�absolute�terms,�market�participants�are�largely�taking�a�longer-term�view�with�expectations�for�a�recovery�in�economic�activity� later�this�year�and�into�2021.� � In�the�second�calendar�quarter�of�2020,� the�Russell�3000� (US� equities),� the�MSCI� EAFE,� (developed�market� equities),� and� the�MSCI� Emerging�Markets�(emerging� market� equities)� generated� total� returns� of� 22.0%,� 14.9%,� and� 18.1%,� respectively.� � Given�support�from�the�Federal�Reserve�and�increased�risk�appetite,�credit�recovered�rapidly�as�well,�with�the�Bloomberg� Barclays� US�High� Yield� index� generating� a� return� of� 10.2%.� � The� broader� fixed� income�market,�as�measured�by�the�Bloomberg�Barclays�US�Aggregate,�benefitted�from�monetary�stimulus,�producing�a�2.9%�total�return.��While�the�VIX�remained�elevated�relative�to�its�pre-crisis�levels�at�30.4�as�of�June�2020,�it�had�fallen�significantly�since�the�peak�of�the�crisis�in�the�first�calendar�quarter.��Equally,�bond�market�volatility�as�measured�by�the�MOVE�Index�fell�to�nearly�a�record�low.�
An�investor�who�had�not�been�following�current�events�over�the�past�year�and�only�chose�to�look�at�US�equity� market� performance� could� be� forgiven� for� thinking� that� little� had� changed� regarding� the�prevailing�market�regime.��Despite�a�massive�risk-off�event�in�the�first�quarter�of�2020�associated�with�a�global�pandemic,�risk�assets�have,�in�some�cases,�posted�moderately�positive�returns�over�the�past�fiscal� year.� � US� equities,� as� represented� by� the� Russell� 3000� Index,� finished� the� fiscal� year�with� a�6.5%�return.��Emerging�markets�(MSCI�Emerging�Markets)�delivered�-3.4%�for�the�year.�The�MSCI�EAFE�Index�was�the�worst�performer�among�the�headline�global�regions,�posting�a�total�return�of�-5.1%.��
Several� important� trends� underneath� the� headline� results�merit� emphasis.� � In� the� US,� the� spread�between�large�cap�stocks�and�small�cap�stocks�remains�extremely�wide.��The�Russell�1000�produced�a�total�return�of�7.5%�over�the�fiscal�year,�whereas�the�Russell�2000�generated�a�total�return�of�-6.6%.��The�
spread�between�growth�and�value�also�remains�stubbornly�wide;�the�Russell�1����+VS[XLØW�VIXYVR�SJ������HYVMRK� XLI� JMWGEP�]IEV� JEV� SYXTEGIH� XLI�6YWWIPP� �����:EPYIØW� XSXEP� VIXYVR�SJ� -8.8%.� � Key� to� the�persistent�spread�between�value�and�growth�has�been�the�sector�composition�of�the�Value�and�Growth�indices.��The�Russell�1000�ValueØW�PEVKI�JMRERGMEPW�ERH�YXMPMXMIW�SZIV[IMKLXW��EW�[IPP�EW�PEVKI�MRJSVQEXMSR�technology�and�consumer�discretionary�underweights,�relative�to�the�Russell�1000�Growth,�were�key�GSRXVMFYXSVW��8LI�X[S�FIRGLQEVOWØ�VIPEXMZI�EPPSGEXMSRW�XS�JMRERGMEPW�ERH�MRJSVQEXMon�technology�alone�generated�a�performance�spread�of�14.1%�in�favor�of�the�growth�index.��An�even�starker�contrast�can�be�observed�between�large�cap�growth�(Russell�1000�Growth�at�23.3%)�and�small�cap�value�(Russell�2000�Value�at�-17.5%)�where�the�total�return�spread�was�a�massive�40.8%!���
Within�international�developed�markets,�the�MSCI�EAFE�opportunity�set,�of�which�Japan,�the�UK,�and�the�Eurozone�are�featured�most�heavily,�underperformed�relative�to�the�US�and�emerging�markets.��This�can�largely�be�attributed�to�the�weak�footing�on�which�they�entered�the�crisis�to�begin�with,�the�robust�spread�
of�COVID-19,�and�the�stringency�of�lockdowns�in�many�of�these�economies.��Within�emerging�markets,�an�extremely�wide�spread�between�countries� that�were�able� to�manEKI� XLI�ZMVYW� WTVIEH�ERH�HITPS]IH�aggressive�countermeasures�(e.g.,�China:�9.9%�return)�relative�to�countries�facing�already-dire�economic�circumstances�(e.g.,�Brazil:�-33.4%,�Mexico:�-25.2%,�and�South�Africa:�-24.9%)�was�relatively�extreme.��The�same�style�regime�observed�in�the�US,�with�growth�outperforming�value,�persisted�in�both�developed�and�
Comprehensive Annual Financial Report 2019-2020 San José Police & Fire Retirement Plan 88
Report of Investment Activity (continued)
�
August�27,�2020�
� Page�5�of�9�
emerging� international� markets.� � Again,� the� relative� performance� of� financials� and� information�technology�and�consumer�stocks�were�key�drivers�of�the�spread�between�value�and�growth�indices.�
Fixed� income�markets� generated� relatively� strong� results,� due� to� a� collapse� in� global� yield� curves�coupled�with�a�robust�liquidity�backstop�from�central�banks.��The�Bloomberg�Barclays�US�Aggregate�produced�a�total�return�of�8.7%�over�the�past�year.��High�yield�bonds�retraced�their�earlier�losses,�with�the�Bloomberg�Barclays�US�High�Yield�index�finishing�flat�over�the�fiscal�year.��However,�the�standout�performer�within�fixed�income�has�been�long�maturity�Treasuries,�with�the�Bloomberg�Barclays�Long�US�Government�index�gaining�an�impressive�25.1%�over�the�past�year.���
While�equities,�and�especially� large�cap�growth�equities,�as�well�as�fixed�income,�produced�relatively�strong�results�despite�the�COVID-19�shock,�we�have�seen�mixed�results�from�other�asset�classes.��While�energy�prices�recovered�to�some�extent,�with�WTI�Crude�Oil�trading�at�$39.28�at�the�end�of�the�fiscal�year,�the�current�level�still�represents�a�significant�drawdown�relative�to�even�a�year�ago,�when�it�traded�at�$58.20.��Natural�resource�stocks�and�commodities,�on�account�of�uncertainty�regarding�supply�gluts,�especially� in�the�oil�market,�and�the�uncertainty�regarding�the�recovery�of�demand,�produced�weak�total�returns.��The�S&P�Global�Natural�Resources�Index�returned�-16.8%�while�the�Bloomberg�Commodity�Index�returned�-17.4%.��One�of�the�hardest�hit�asset�classes�in�markets�in�2020�has�been�real�estate,�where�fears�regarding�utilization�rates�in�commercial�real�estate�have�prevented�the�asset�class�from�participating� in� the� recovery� to� the� same�extent� as�other� asset� classes.� � The�MSCI�U.S.�REIT� Index�returned�-12.9%.��
Elsewhere,� an� increasingly� robust� acceleration� in�money� supply� growth,� widening� fiscal� deficits� on�account�of�unprecedented�stimulus�measures,�and�an�environment�of�stagnating�growth�expectations�manifesting�in�a�collapse�in�real�yields,�resulted�in�a�significant�increase�in�demand�for�physical�gold.��Over�the�course�of�the�fiscal�year,�the�price�of�gold�increased�from�$1,409.40�per�ounce�to�$1,793.00,�an�increase� of� 27.2%.� � With� investors� increasingly� fearing� the� potential� ramifications� of� fiat� currency�devaluation�as�a� result�of�monetary�de-basement�by� the�Federal�Reserve�and�other�global� central�banks,�they�have�turned�to�gold�as�a�potential�hedge.����
Looking�ahead,�we�acknowledge� the�wide�breadth�of�new� issues�being�presented�by� the�pandemic,�including:�1)�economies�opening�up�too�soon�from�virus-related�restrictions,�and�ultimately�having�to�VIXVEGX�ERH�ÚGPSWI�HS[RÛ�EKEMR��� �GSRWYQIVW�TIVQERIRXP]��SV�for�an�extended�time,�changing�economic�behaviors;�3)�persistently�high�unemployment�due�to�a�significant�number�of�companies�not�surviving�the�economic�downturn;�4)�virus-related�fears�negatively�impacting�the�future�of�globalization,�5)�an�increase�in�sovereign�debt�risk�due�to�the�record�issuance�by�governments;�and�6)�knock-on�effects�of�unprecedented� central� bank� intervention,� including� over-extended� equity� markets� and� the� risk� of�unexpected�inflation.��
Globally,�countries�continue�to�tentatively�ease�their�lockdown�measures,�as�politicians�face�increasing�pressure�to�get�economic�growth�and�employment�back�on�track�after�a�rapid�and�severe�disruption.��
89 Comprehensive Annual Financial Report 2019-2020 San José Police & Fire Retirement Plan

Report of Investment Activity (continued)
�
August�27,�2020
� Page�6�of�9�
As�a� result,� local� outbreaks�of� the� virus� have� arisen� in� the�US� and�abroad,� forcing� local� restrictive�measures�in�harder-hit�areas.��The�continued�need�for�careful�management�of�the�spread�of�the�virus�is�likely�to�prompt�additional�volatility�in�financial�markets.��This�will�only�accelerate�as�we�approach�the�end�of�the�warm�summer�months�in�parts�of�thI�[SVPH�ERH�IRXIV�XLI�XVEHMXMSREP�ÚJPY�WIEWSRÛ�SJ�JEPP�ERH�winter.� � This� brings� many� potential� risks,� including� a� spike� in� infections� and� hospitalizations,� the�mutation�of�the�virus�in�an�unfavorable�manner,�or�even�a�concurrent�outbreak�and�a�severe�flu�season�alongside�COVID-19.��Since�market�participants�remain�focused�on�developments�regarding�COVID-19,�its�trajectory�will�be�a�key�driver�of�market�volatility�in�the�near-term.���
We�have�already�observed�a�rapid�change�in�consumption�preferences�in�the�US�in�the�wake�of�the�initial�COVID-19�shock.� �The�US�savings�rate�spiked�to�an�unprecedented� level,�and�remains�elevated�when�compared� to�historical� trends.� �This� represents�a�potential�opportunity,�as� it�could� represent�pent-up�demand�and,�eventually�increased�spending�and�consumption.��However,�consumer�confidence�has�not�fully�recovered,�and�without�certainty�regarding� the�path�of� the�virus,�survey�data�suggest� that�most�people�in�the�US�have�chosen�to�build�cash�as�a�defense�against�further�issues�with�COVID-19,�rather�than�spend�aggressively.��Importantly,�survey�data�also�suggest�that�stimulus�checks�were�not�used�for�durable�goods�purchases,�and�instead�were�either�saved�or�spent�on�necessary�staples.��Until�consumers�build�more�confidence� in�the�path�of�COVID-19,� the�testing�regime� improves,�and�the�outlook�for�a�vaccine�becomes�less�opaque,�it�is�likely�that�consumer�confidence,�and�thus�consumption�itself,�will�remain�muted�relative�to�pre-crisis�levels,�placing�a�damper�on�the�prospective�economic�recovery.���
Unemployment,� despite� a� gradual� re-opening� of� the� US� economy� over� the� past� quarter,� remains�stubbornly�high�after�spiking�to�a�post-World�War�II�record.��Unemployment�as�of�the�end�of�the�fiscal�year�remained�at�11.1%.��The�Bureau�of�Labor�Statistics�has�also�cautioned�that�considerable�uncertainty�exists� around�data� quality;� the� actual� numbers� could� be� far� better� than� reported,� or� far�worse.� � A�continued�decline� in�unemployment� from� its� current� level�will� follow�an�easing�of�COVID-19� related�
restrictions,�especially�in�the�hard-hit�service�sector,�as�well�as�additional�fiscal�support.��Conversely,�companies� continue� to� right-size� their� workforces� to� cope� with� a� collapse� in� their� top-lines� and�increasing� solvency� risk.� � The� longer� that� uncertainty� regarding� the� virus� persists� and� leads� to�measures�that�are�likely�to�stifle�economic�activity,�the�weaker�business�confidence�will�continue�to�be.��This� increases� the� risk� that� many� layoffs,� which� might� have� been� perceived� as� temporary,� could�become�permanent,�resulting�in�a�higher�equilibrium�rate�of�unemployment.�
COVID-19�has�had�a�meaningful�impact�on�the�already-tapering�long-term�trend�toward�globalization�in�the�21st�century.��In�some�cases,�local�trade�conflicts�have�arisen�and�have�been�resolved,�but�the�trend�toward�the�re-localization�of�supply�chains�is�likely�to�accelerate�in�the�wake�of�the�crisis.��The�most�obvious�example�of� this� trend� is� the�continued,�protracted�conflict�between�the�US�and�China.��While�the�conflict�was�set�aside�in�the�early�stages�of�COVID-19,�it�has�been�rekindled�in�recent�months.��8LI�GYVVIRX�97�TVIWMHIRXMEP�EHQMRMWXVEXMSRØW�JSVIMKR�TSPMG]�ETTVSEGL�LEW�MRGVIEWMRKP]�WLMJXIH�XS[EVH�E�more� aggressive� anti-China� stance.� � COVID-19� also� exposed� the� reliance� of� some� countries� on�choke-points�in�global�supply�chains�that�they�will�undoubtedly�seek�to�address�going�forward.��Global�policymakers,�such�as�ECB�President�Christine�Lagarde,�have�acknowledged�that�de-globalization� is�
Comprehensive Annual Financial Report 2019-2020 San José Police & Fire Retirement Plan 90

Report of Investment Activity (continued)
�
August�27,�2020�
� Page�7�of�9�
likely� to� persist� in� the�wake�of� the�virus,�beyond� the�US/China�conflict.� �The� risk� is�most� severe� for�countries� that� have� become� reliant� on� foreign� investment� and� export-driven� growth.� � If� global�economies� increasingly� focus�on�domestic�products,� export-oriented�economies� are� likely� to� suffer�inordinately�in�this�type�of�environment.�
Historically,�crisis�periods�have�often�witnessed�concurrent�periods�of�either�voluntary�or�involuntary�deleveraging,� at� the� sovereign,� corporate,� and� consumer� levels.� � In� 2008,� for� example,� the� US�experienced� a� rapid� de-leveraging� in� the�mortgage�market� that� quickly� spread� to� corporates� and�consumers.��In�2020,�while�consumers�entered�the�crisis�in�a�reasonable�financial�position,�corporates�and� sovereigns� did� not.� � In� the� US,� for� example,� corporate� solvency� was� a� meaningful� source� of�uncertainty�even�prior�to�the�crisis,�as�debt�built�up�in�the�US�corporate�debt�market.��With�the�COVID-19�shock,�March�markets�were�gripped�by�fears�that�an�economic�crisis�would�become�a�financial�crisis,�where� in� the� GFC� the� opposite� had� been� the� case.� � The� Federal� Reserve,� seeking� to� prevent� this�outcome,� chose� to� intervene� by� essentially� backstopping� corporate� credit.� � As� a� result,� corporate�leverage�has�rapidly� increased,�where�the�opposite�was�true�in�previous�cycles.��Alongside�this�trend,�the�US�government�has�massively� increased� the� size� of� the� fiscal� deficit� in� order� to� support� those�people�facing�temporary�income�loss�due�to�unemployment.��Suddenly,�the�US�faces�the�need�to�finance�a�widening�budget�deficit;�a�large�slate�of�debt�issuanGI�[MPP�XIWX�KPSFEP�MRZIWXSVW�[MPPMRKRIWW�XS�JMRERGI�a�weakening�US�fiscal�position,�which�could�have�considerable�knock-on�effects�for�interest�rates�and�thus�global�risk�assets.��The�US,�within�both�the�corporate�and�sovereign�sector,�continues�to�push�the�FSYRHEV]�SJ�MRZIWXSVW�ETTIXMXI�JSV�HIFX��
The�evolution�of�economic�growth�and� inflation�bear�close�monitoring�going� forward.� � In�addition� to�widening�deficits,�unprecedented�asset�purchases�by�central�banks�run�the�risk�of�creating�longer-term�distortMSRW�MR�QEVOIXW���8LIVI�GER�FI�PMXXPI�HSYFX�XLEX�XLI�*IHIVEP�6IWIVZIØW�EGXMSRW�LEZI�FSSWXIH�QEVOIX�confidence,�and�thus�asset�prices,�in�recent�months.��While�they�execute�these�policies�in�the�hope�of�creating�a�virtuous�feedback�loop�in�order�to�stimulate�growth,�the�pass�through�is�indirect,�at�best.��The�Fed� is� increasingly� facing� a� tightrope� walk,� backstopping� market� risk� while� trying� not� to� lose� the�QEVOIXØW� GSRJMHIRGI� MR� MXW�EFMPMX]� XS�HS�WS�[MXL�ER� MRGVIEWMRKP]�REVVS[�WIX�SJ�TSPMG]� XSSPW��+MZIR�XLEX�interest� rates�are�probably�near�a� lower�bound,�at� least� for�now,� that� leaves� them�with�quantitative�easing,�which�might�increasingly�become�permanent�rather�than�temporary.��As�evidenced�by�the�path�of�nominal� interest� rates�across� the�yield�curve,�growth�expectations�remain� incredibly�weak,�while�inflation�expectations�have�begun�to�tick�higher,�resulting�in�a�collapse�in�real�interest�rates.��In�addition,�the�Fed�has�increasingly�signaled�that�it�is�likely�to�revise�its�inflation�target,�in�the�interest�of�allowing�MRJPEXMSR�XS�ÚVYR�LSXÛ�MR�SVHIV�XS�JSGYW�SR�EGLMIZMRK�KVS[XL�ERH�JYPP�IQTPS]QIRX��[MXL�XLI�EHHIH�FIRIJMX�of�reducing�the�US�sovereign�debt�burden.��The�potential�for�unexpected�inflation�within�this�regime�means� that� asset� allocation� care� is� warranted;� assets� with� low� yields,� like� US� Treasuries,� could�experience�diminished�long-term�return�prospects,�requiring�shifts�in�allocation�decisions.����
We�will�continue�to�monitor�these�issues�and�others,�as�they�arise.�
91 Comprehensive Annual Financial Report 2019-2020 San José Police & Fire Retirement Plan

Report of Investment Activity (continued)
�
August�27,�2020
� Page�8�of�9�
Sincetheendofthefiscalyear,globalmarketshaveevolvedsignificantly. TheimpactofCOVID-19andthe
extraordinarypolicyresponsehaveengenderedprofoundsignificantchangesinfinancialmarketsthathave
continuedtoplayoutsincetheendofthefiscalyear.TheevolutionofCOVID-19,withrespecttoitsspreadand
theprospectforaneventualdefinitivehealthcaresolution,willcontinuetoimpactmarketsgoingforward.
1�2
The�City�of�San�Jose�Police�and�Fire�Department�Retirement�Plan�had�$3.71�billion�in�assets�at�the�end�of�the�fiscal�year.��For�the�fiscal�year,�the�Retirement�Plan�returned�+3.1%�net�of�fees,�outperforming�the�4SPMG]�&IRGLQEVO������ ��ERH�XLI�-RZIWXEFPI�&IRGLQEVO������ ��8LI�6IXMVIQIRX�4PERØW�VIXYVR�JIPP�WLSVX�of� the�6.75%�assumed�actuarial�rate�of�return,� though� it�has�exceeded�that�rate� in�three�of� the�past�WIZIR� JMWGEP� ]IEVW�� 8LI�6IXMVIQIRX� 4PERØW� WXERHEVH� HIZMEXMSR� SJ� VIXYVRW�[EW� ������ I\LMFMXMRK� PS[IV�volatility�than�the�peer�median�(12.1%).��
/I]�JEGXSVW�JSV�XLI�6IXMVIQIRX�4PERØW�TIVJSVQERce�for�the�fiscal�year�include:�
x AssetAllocation:�On�April�2,�2020,�at�a�Board�Meeting�during�the�height�of�the�COVID-19�market�selloff,�the�Retirement�Plan�Board�voted�to�shift�its�asset�allocation�policy.�This�shift�resulted�in�an�increase�of�the�Growth�aggregate�target�to�70%�of�Plan�assets,�from�64%,�with�a�7%�increase�in�policy�toward�Public� Equity.� In� the� second� quarter� of� 2020� following� this� shift,� Public� Equity� returned� +21.6%,�outperforming�the�Public�Equity�Benchmark�return�of�+20.0%.�
x Growth:The�6IXMVIQIRX�4PERØW�+VS[XL�EPPSGEXMSR�VITVIWIRXIH������SJ�XLI�TSVXJSPMS�EW�SJ�XLI�IRH�of� the� fiscal� year.� Growth� returned�+2.6%� for� the� fiscal� year,� versus� the� Growth�Benchmark�return�of�+1.7%�over�the�same�period.�Within�the�Growth�aggregate,�Public�Equity�represented�46.5%�of� the�Plan,�Private�Markets� 19.1%,� Emerging�Markets�Debt�3.2%,�and�High�Yield�Bonds�representing�the�remaining�2.0%.�High�Yield�Bonds�were�a�new�allocation�added�during�the�fiscal�year.�
x LowBeta:�8LI�6IXMVIQIRX�4PERØW�0S[�Beta�aggregate�represented�10.6%�of�the�Plan�as�of�the�end�of�the�fiscal�year.�Low�Beta�returned�+3.6%�for�the�fiscal�year,�versus�the�Low�Beta�Benchmark�return�of�+2.5%�over�the�same�period.�Within�the�Low�Beta�aggregate,�Market�Neutral�Strategies�represented�3.2%�of�the�Plan,�Immunized�Cash�Flows�4.4%,�and�Cash�3.0%.��
x Other:�8LI�6IXMVIQIRX�4PERØW�3XLIV�aggregate�represented�17.9%�of�the�Plan�as�of�the�end�of�the�fiscal�year.�Other�returned�-1.8%�for�the�fiscal�year,�in-line�with�the�Other�Benchmark.�Within�the�
Other�aggregate,�Core�Real�Estate�represented�3.9%,�TIPS�2.0%,�Investment�Grade�Bonds,�9.1%,�and�Long-Term�Government�Bonds�3.0%.�Investment�Grade�Bonds�and�Long-Term�Government�Bonds�were�new�allocations�added�during�the�fiscal�year.�
��Performance�figures�calculated�by�custodian�bank�are�the�basis�of�presentation�for�the�data�in�the�investment�section.�2��Time-weighted�rate�of�return�based�on�the�market�rate�of�return�is�used�as�the�basis�for�the�calculation.�
Comprehensive Annual Financial Report 2019-2020 San José Police & Fire Retirement Plan 92

Report of Investment Activity (continued)
�
August�27,�2020�
� Page�9�of�9�
3�4
The�City�of�San�Jose�Police�and�Fire�Department�Retirement�Plan�Health�Care�Trust�had�$178.0�million�in�assets�at�the�end�of�the�fiscal�year.��For�the�fiscal�year,�the�Health�Care�Trust�returned�+2.2%�net�of�fees,�outperforming�the�Policy�Benchmark�(+1.6%).�As�a�percentage�of�the�Health�Care�Trust,�Growth�represented�56.3%,�Low�Beta�31.3%,�and�Other�12.4%.�Growth,�comprising�of�three�passively�managed�funds,�returned�+1.1%�versus�the�Growth�Benchmark�return�of�+1.2%.�Low�Beta�returned�+1.7%�versus�the�ICE�BofA�91�Days�T-Bills�TR�return�of�+1.6%,�with�slight�outperformance�from�the�passive� investment�manager�within�Short-Term�Investment�Grade�Bonds,�which�represents�29.0%�of�the�Health�Care�Trust.�Other� returned� -1.0%,� outperforming� the�Other�benchmark�by�360�basis� points�over� the� fiscal� year�period.�Within�Other,�Core�Real�Estate�represented�7.3%�of�the�Health�Care�Trust�and�outperformed�its�benchmark�by�40�basis�points,�while�Commodities�represented�5.1%�and�outperformed�its�benchmark�by�980�basis�points.�
5
Performance�for�the�City�of�San�Jose�Police�and�Fire�Department�Retirement�Plan�over�the�fiscal�year�exceeded�both�its�Policy�and�Investible�Benchmarks.�Compared�to�the�Public�Peer�Group�over�$1�Billion�Net�Return,�performance�over�the�fiscal�year�was�very�strong�and�ranked�in�the�17th�percentile,�while�also�taking�on�less�risk�than�peers.�We�believe�that�the�Retirement�Plan�has�recently�been�enhanced�and�has�a�high�probability�of�achieving� the�actuarial� rate�over�the� long-term,�while�exhibiting� lower�volatility� than� peers.� � We� are� looking� forward� to� continuing� our� work� with� Staff� and� the� Board� of�Administration�to�assist�the�Retirement�Plan�in�meeting�its�obligations�to�participants.�
Sincerely,�
� ������� � �
Laura�Wirick,�CFA,�CAIA� Chris�Theordor,�CAIA�Principal� � Consultant� �
������������������ �Hannah�Schriner� Jared�Pratt,�CFA�Consultant� � Investment�Analyst�
LBW/CJT/HS/JP/jls�
3�Performance�figures�calculated�by�custodian�bank�are�the�basis�of�presentation�for�the�data�in�the�investment�section.�4��Time-weighted�rate�of�return�based�on�the�market�rate�of�return�is�used�as�the�basis�for�the�calculation.�5��Time-weighted�rate�of�return�based�on�the�market�rate�of�return�is�used�as�the�basis�for�the�calculation.�
93 Comprehensive Annual Financial Report 2019-2020 San José Police & Fire Retirement Plan

Statement of Investment Policy
PENSION - INCLUDES THE 401 (H) INVESTMENTS
EXECUTIVE SUMMARY
The purpose of this document is to set forth the goals and objectives of the San José Police and FireDepartment Retirement Plan, and to establish guidelines for the implementation of investment strategy.
This document will be reviewed at least annually by the Board of Administration of the San José Policeand Fire Department Retirement Plan (“Board”). Any revisions to this document may be made only withthe approval of the Board.
The Board of Administration recognizes that a stable, well-articulated investment policy is crucial to thelong-term success of the Plan. As such, the Board members have developed this Investment PolicyStatement with the following goals in mind.
• To clearly and explicitly establish the objectives and constraints that govern the investment of the
Plan's assets,
• To establish a long-term asset allocation with a high likelihood of meeting the Plan's objectives
given the explicit constraints, and
• To protect the financial health of the Plan through the implementation of this stable long-term
investment policy.
This document includes detail on the Plan’s adopted asset allocation policy (summarized in Appendix A)and process, including the selected Functional asset class structure and the Plan benchmarks approvedby the Board. It also includes the Plan’s policy on manager selection, retention, evaluation, andtermination, as well as the Plan’s adopted risk policy, with specific risk parameters summarized inAppendix B.
Throughout this document, expected returns and volatilities were based on capital market assumptionsfrom the general consultant.
I. SAN JOSÉ POLICE AND FIRE DEPARTMENT RETIREMENT PLAN GOALS
The San José Police and Fire Department Retirement Plan was established to provide retirementincome for San José Police and Fire Department Retirement Plan employees and their families. ThePlan’s assets are structured to provide growth from capital gains and income, while maintainingsufficient liquidity to meet beneficiary payments.
II. INVESTMENT OBJECTIVES
The investment strategy of the San José Police and Fire Department Retirement Plan is designed toensure the prudent investment of Plan assets in such a manner as to provide real growth of assets overtime while protecting the value of the assets from undue volatility or risk of loss.
A. Risk Objectives
1. To accept the optimal level of risk required to achieve the Plan's return objective asstated immediately below.
2. To target total portfolio investment risk consistent with the investment beliefs andstrategic goals set forth by the San José Police and Fire Department RetirementBoard.
3. To consider the financial health of the Sponsor when assuming investment risks.
4. To use diversification to minimize exposure to company and industry-specific risks inthe aggregate investment portfolio.
Comprehensive Annual Financial Report 2019-2020 San José Police & Fire Retirement Plan 94

Statement of Investment Policy (continued)
PENSION - INCLUDES THE 401 (H) INVESTMENTS (continued)
B. Return Objective
1. In a manner consistent with the goals stated in Section I above, to manage the Plan'sassets as to achieve the highest, reasonably prudent return possible.
III. INVESTMENT CONSTRAINTS
A. Legal and Regulatory
The San José Police and Fire Department Retirement Plan is a defined benefit retirementprogram for certain employees of the Police and Fire departments of the City of San Joséin the State of California. The terms of the Plan are described in the San José MunicipalCode.
B. Time Horizon
The Plan will be managed on a going-concern basis. The assets of the Plan will beinvested with a long-term time horizon (ten to twenty years or more), consistent with theparticipant demographics and the purpose of the Plan.
C. Liquidity
The Board members intend to maintain sufficient liquidity to meet at least five years ofanticipated beneficiary payments, net of plan sponsor and member contributions.
D. Tax Considerations
The Plan is a tax-exempt entity. Therefore, investments and strategies will be evaluatedonly on the basis of expected risks and potential returns.
IV. RISK AND RETURN CONSIDERATIONS
The Board members accept the risks associated with investing in the capital markets (market risks), butwill minimize wherever possible those risks for which the Plan is unlikely to be compensated (non-marketor diversifiable risks).
V. DIVERSIFICATION
The Board members of the San José Police and Fire Department Retirement Plan recognize that animportant element of risk control is diversification. Therefore, investments will be allocated acrossmultiple classes of assets, chosen in part for their low correlation of expected returns. Within each assettype, investments will be distributed across many individual holdings, with the intention of furtherreducing volatility.
The specific degrees of diversification within asset classes will be addressed in each separate accountmanager’s investment guidelines, or in each commingled manager’s fund documents.
The purpose of the functional classifications and major asset classes are defined in the language andtable below.
A. Functional Sub-portfolios
The investment strategy for the Investment Program employs three functional sub-portfolios to construct the comprehensive asset allocation. The allocation to the sub-portfolios is assessed at least annually and is based on projected capital marketassumptions. The Chief Investment Officer (“CIO”) shall review the relative size andcomposition of these sub-portfolios and advise the Investment Committee (“IC”) of anynecessary revisions to the allocation among the sub-portfolios.
95 Comprehensive Annual Financial Report 2019-2020 San José Police & Fire Retirement Plan

Statement of Investment Policy (continued)
PENSION - INCLUDES THE 401 (H) INVESTMENTS (continued)
1. Growth Sub-portfolio: The purpose of the Growth Sub-portfolio is to grow investedassets over the long term in order to pay future benefits. This portfolio ischaracterized by a long investment horizon and can, therefore, accept a higher levelof volatility. Assets in this portfolio may be volatile, have reduced liquidity, and derivethe bulk of their return from capital appreciation. These assets include public andprivate equity, corporate and other debt with credit risk premiums, private real estateand other private assets. The success of this portfolio will be measured primarily bycompounded annual growth rates in conjunction with the annualized standarddeviation of returns as the primary measure of risk. Performance evaluation will,therefore, focus on the long-term total risk-adjusted return of the portfolio.
2. Low Beta Sub-Portfolio: The purpose of the Low Beta Sub-portfolio is to ensurethat the overall (total portfolio) a) is relatively immune from market fluctuations whileproviding a source of alpha, b) is a source of capital for purchasing undervaluedassets in the Growth sub-portfolio, and c) has adequate assets available to paybenefits over an extended timeframe (the immunized cash portfolio). It will contain an“absolute return” program that invests in risk assets in isolation but whose combinedlong and short betas are relatively neutral to market movements, an immunized cashportfolio, as well as cash and cash-like assets such as short-term bonds, derivatives,and other investments that provide fixed, contractual cash flows with a minimum levelof credit risk. For the immunized cash portfolio, the Board has established a targetallocation amount of up to 60 months’ worth of projected benefit payments in the LowBeta Sub-portfolio, which will be drawn down and replenished annually. The LowBeta portfolio is expected to provide a stable offset to the rest of the portfolio duringperiods of severe market stress and to effectively dampen the market volatility acrossthe entire portfolio. The success of the Low Beta Sub-portfolio will be measured by itsability to offset declines in value in the Growth Sub-portfolio, as well as its ability toprovide liquidity during times of market stress.
3. Other Sub-Portfolio: The purpose of the Other Sub-portfolio is to ensure that theoverall portfolio is specifically protected against inflation risks while also providing forfurther diversification. The success of the Other sub-portfolio will be measured by itsability to protect the portfolio from inflation risk while also providing an additionalsource of return and diversification.
B. Interaction between the Functional Sub-Portfolios
The allocations to the Growth, Low Beta, and Other sub-portfolios will vary over time.When Growth assets are undervalued, the Low Beta Sub-portfolio will act as a source offunds and when Growth assets are overvalued the Low Beta sub-portfolio will act as ause for harvested growth portfolio returns. The Growth and Other sub-portfolios will besubject to the volatility of the markets in which each functional sub-portfolio invests. Inorder to reallocate between the functional sub-portfolios, the CIO and the GeneralConsultant will conduct an annual capital review to assess the relative value and risksassociated with each asset class and deliver a review of the capital markets to the Board.The Consultant will provide the Board current forward-looking risk and return assumptionsfor all major asset classes. In conjunction with this review, the CIO will provide arecommendation of how best to allocate assets within each functional sub-portfolio. Ifnecessary, the CIO will recommend changes in target allocations to the underlying assetclasses in order to deploy the Investment Program’s assets effectively in the upcomingyear. While considering changes to the allocation to each functional sub-portfolio, the CIOwill view the totality of all functional portfolios, and consider the impact of changes to theoverall risk and return profile of the total portfolio.
Comprehensive Annual Financial Report 2019-2020 San José Police & Fire Retirement Plan 96

Statement of Investment Policy (continued)
PENSION - INCLUDES THE 401 (H) INVESTMENTS (continued)
Public Equity - Growth
The purpose of Public Equity is to provide the Plan exposure to the total return due to equitycapital owners, including exposure to capital appreciation from economic growth, while managingvolatility relative to the equity market.
Private Markets - Growth
The purpose of Private Markets is to provide the Plan exposure to asset growth and income whilediversifying the portfolio and capturing an illiquidity premium.
Emerging Market Bonds - Growth
The primary purpose of Emerging Market Bonds is to provide the Plan exposure to rates and creditrisk within emerging markets.
High Yield Bonds - Growth
The primary purpose of High Yield Bonds is the provide the System with exposure to high yieldingcorporate debt.
Market Neutral Strategies - Low Beta
The purpose of Market Neutral Strategies is to produce alpha based returns while reducing overallPlan volatility and increasing Sharpe ratio.
Immunized Cash Flows - Low Beta
The purpose of Bonds (Immunized Cash Flows) is to provide liquid funds for expected outflowsand allow for other assets to be invested in an illiquid fashion.
Treasury Inflation - Protected Securities (TIPS) - Other The purpose of TIPS is to provide exposure to inflation in addition to interest rates.
Core Real Estate - Other
The purpose of Core Real Estate is to produce the Plan income and price appreciation whilemaintaining a low correlation to both stocks and bonds.
Long-Term Government Bonds - Other
The purpose of Long-Term Government Bonds is to provide a positive return in highly stressedmarket environments, with a low correlation to equity risk.
Core Bonds - Other
The purpose of Core Bonds is to produce returns and income for the Plan by providing exposureto rates and credit risk.
VI. ASSET ALLOCATION POLICY
Asset Allocation and Portfolio Construction
A. The Board recognizes that establishing an appropriate strategic asset allocation (SAA)portfolio is critical to the long-term success of the investment program, as asset allocationis the single biggest determinant of the expected risk and return of the Plan.
B. In arriving at the SAA, the Board shall follow a building block approach whereby itapproves a series of benchmark portfolios, each offering expected risk and returncharacteristics that are preferable to the one before it. This building block approach isfurther explained below:
97 Comprehensive Annual Financial Report 2019-2020 San José Police & Fire Retirement Plan

Statement of Investment Policy (continued)
PENSION - INCLUDES THE 401 (H) INVESTMENTS (continued)
1. Liability Benchmark Portfolio (LBP). As the first step in the portfolio constructionprocess, the Board shall approve a LBP. The LBP is the portfolio that offers thelowest possible expected funding risk, where funding risk is defined as the risk thatassets will grow at a slower rate than the system’s liabilities. The LBP is expected toconsist solely of bonds that match the duration of the liabilities.
2. Low-Cost Passive Portfolio (LCPP). If the Board believes a portfolio can beconstructed that offers expected return/risk characteristics that are preferable tothose of the LBP, but does not wish to invest significant resources in staff andconsultants, the Board would then approve a LCPP. The LCPP would be simple toconstruct and implement and would consist only of public market asset classesmanaged on a passive basis. It would exclude private market asset classes andhedge funds, which are complex and costlier to implement.
3. Strategic Asset Allocation Portfolio (SAAP). If the Board believes an even morediversified portfolio would enhance the risk-adjusted return characteristics of the Planand justify a meaningful investment in staff and consulting resources, the Boardwould then develop and approve an SAAP. The SAAP would be more complex thanthe LCPP because it would likely include private market asset classes and/or hedgefunds. The staff and consulting resources required to manage such a portfolio wouldsignificantly increase the cost and administrative complexity of the Plan.
4. Investable Benchmark Portfolio (IBP). The Benchmark Portfolio would include thesame underlying benchmarks as the SAAP, but would use an actual invested weightfor each asset class. This will account for weighting differences to the SAAP in assetclasses that take more than one year to invest (private markets asset classes).
C. The Board believes the above building-block approach represents a thoughtful way ofapproaching its asset allocation decisions, as it makes each step in the portfolioconstruction process clear and explicit. It also requires the Board to consider and confirmthe rationale for accepting the potential incremental risk, complexity and cost introducedby moving from one portfolio model to the next. Their relative merits would includeevaluation on a net-of-expenses basis.
D. The benchmarks approved by the Board as of the date of this document, and theexpected return of each, are described below:
1. A LBP consisting of a market benchmark with a duration profile similar to the Plan’sliabilities. The expected return for the LBP is 3.1% (20 years/geometric mean) as ofthe date of this document.
2. A LCPP consisting of the following asset classes and targets, and the broad,commonly-used market indices that could be used for each asset class, are shown inAppendix A. The expected return for the LCPP is 6.3% (20 years/geometric mean) asof the date of this document.
3. A SAAP consisting of the following asset classes and targets shown in Appendix A.The expected return of the SAAP is 7.1% (20 years/geometric mean) as of the dateof this document.
Comprehensive Annual Financial Report 2019-2020 San José Police & Fire Retirement Plan 98

Statement of Investment Policy (continued)
PENSION - INCLUDES THE 401 (H) INVESTMENTS (continued)
Asset Allocation Tools & Methods
A. The LBP will be re-evaluated annually following the results of the annual actuarial study.LCPP and SAPP shall be established and modified based on the results of formal assetallocation studies performed approximately every three years or when a significant marketcorrection occurs. The capital market assumptions (CMA) used in such studies shall bereviewed and updated annually or when the S&P 500 experiences a decrease of morethan 20% from peak. The Board shall consult with the general investment consultant inconnection with such asset allocation studies and CMA reviews.
B. Asset allocation studies shall be designed to ensure rigorous and objective analysis, andminimize decision-making bias by:
1. Requiring the use of a portfolio construction engine ("Engine"); and
2. Requiring that the Board and IC always focus first on establishing the mostreasonable and defensible inputs to the Engine. That is, if the Board is uncomfortablewith the results of the Engine, it shall respond by reviewing the reasonableness of theinputs to the Engine, rather than simply modifying the results.
C. When arriving at the LCPP and the SAAP, asset allocation studies shall include the fourbasic steps outlined below:
1. Step 1: Inputs
a. For each study, the Board shall approve the inputs to the Engine including:
• Permitted asset classes (Permitted asset classes for the LCPP shall
include only public markets and permitted asset classes for the SAA
Portfolio shall include both public and private markets);
• CMAs; and
• Material constraints (e.g. maximum allocations to certain asset classes),
along with supporting rationale.
b. The CIO shall propose the inputs to the IC, with prior input from the Board’sgeneral investment consultant, and work with the investment consultantthroughout the process to make subsequent revisions to inputs, based onfeedback from the IC.
c. The Board, IC, CIO and investment consultant are expected to reach aconsensus regarding the above inputs and the Board shall formally approvethem. Staff shall document the process by which it arrives at itsrecommended inputs.
2. Step 2: Modeling and Analysis
a. The investment consultant will incorporate the approved inputs into theEngine to be used to identify and analyze potential asset allocation choicesfor each study and present the results to the CIO.
b. The Board expects that the Engine will rely on mean-variance optimization(“MVO”).
c. The Board shall also consider the results of the MVO analysis underadditional constraints to ensure adherence with approved risk limitsincluding:
• Stress testing, including historical scenario analysis and factor-specific
testing;
99 Comprehensive Annual Financial Report 2019-2020 San José Police & Fire Retirement Plan

Statement of Investment Policy (continued)
PENSION - INCLUDES THE 401 (H) INVESTMENTS (continued)
• Liquidity analysis under normal and stressed conditions; and
• Cash flow management requirements for the immunization of certain
projected benefits and expenses.
3. Step 3: Recommendations
a. The CIO will present the current asset allocation and a number ofreasonable alternatives along the so-called "efficient frontier" for the Boardto consider.
b. In presenting the alternatives, the CIO initially will present only the return/riskcharacteristics of each alternative and will not reveal the underlying assetclass allocations (i.e. “blind” format). This will allow the Board/IC to focusinitially on the return/risk implications of each alternative, rather than theunderlying asset allocations.
c. After the Board has engaged in a preliminary discussion and analysis of thealternatives, the underlying asset allocations of each alternative will berevealed for further consideration.
d. The Board/IC may provide feedback to the CIO and investment consultant,which may required further analysis and a request for revisedrecommendations for the Board/IC to consider.
4. Step 4: Approvals
a. The Board/IC will review the final analyses and recommendation from theCIO and general consultant and approve:
• Low Cost Portfolio Benchmark weights; and
• Strategic Asset Allocation Portfolio weights, target and ranges (maximum-
minimum).
Rebalancing
A. The CIO shall adhere to the SAAP asset and sub-asset class “targets” approved by theBoard and shall rebalance to within the approved range at least quarterly if the actualweights at the sub-asset class levels are not within 10% of the approved target,considering the cost of more frequent rebalancing. For example, if the target allocation foran asset class is 20%, re-balancing will be triggered quarterly when the actual allocationfor the asset class deviates by +/- 2% (i.e. 10% x 20%, reaching 18% or 22%).The CIOmay use discretion to rebalance to within the approved range at more frequent intervalsthan quarterly, and when actual weights are within 10% of the approved target, subject toan assessment of market risk, active risk, and transactions costs. When a change to theSAAP is made by the Board, the CIO and the investment team will rebalance to the newtarget weights as expeditiously as possible, or in tranches if directed by the Board. TheCIO shall also use his discretion in rebalancing to the new SAAP in the event that instantliquidation of managers within an asset class may work against the interests of theSystem. Changes to the weights of illiquid asset classes may take several quarters toimplement, and the CIO shall keep the IC apprised of the progress toward the new SAAP.Synthetic rebalancing through an overlay provider may also be used when appropriate.The Immunized Cash Flows portfolio is exempt from this rebalancing provision, as it isamortizing by design.
B. Total plan active risk (i.e. tracking error) is to be maintained below 3%. While asset classexposures may fall within acceptable capital allocation ranges as noted above, total plantracking error is not to exceed this 3% threshold.
Comprehensive Annual Financial Report 2019-2020 San José Police & Fire Retirement Plan 100

Statement of Investment Policy (continued)
PENSION - INCLUDES THE 401 (H) INVESTMENTS (continued)
Evaluating Asset Allocation Decisions
A. The Board shall periodically evaluate the effectiveness of its asset allocation decisionsusing the above portfolio benchmarks (i.e. Liability Portfolio Benchmark, Low-CostPassive Portfolio, and Strategic Asset Allocation Portfolio).
B. The following table uses hypothetical returns to illustrate how the above benchmarks shallbe used to evaluate the Board's asset allocation decisions.
Portfolio BenchmarkNet Return
(%)Value
Added (%) ConclusionsA. Liability Benchmark Portfolio
3.1% n/a
B. Low Cost Passive Portfolio
6.3% 3.2%(B-A)
By deviating from a portfolio with modest fundingrisk to a low-cost, passive portfolio that does notrequire significant staff or consulting resources,the Board shall have added net value of 3.2%
C. SAA Portfolio 7.1% 0.8%(C-B)
By enhancing the passive portfolio withinvestments in private markets and hedge funds,the Board added net value of 0.8%
C. The Board will evaluate two additional benchmarks in order to assess the value added bythe CIO, investment staff, and the investment consultants:
1. Actual Portfolio: This is the actual portfolio implemented by the CIO and investmentstaff with support from investment consultants. The Actual Portfolio includes privatemarkets and hedge funds and reflects any active management exercised by the CIOand the underlying investment managers, subject to Board-approved policies andCIO-approved procedures.
2. Investable Benchmark Portfolio: The Investable Benchmark Portfolio is identical tothe SAAP but is adjusted for the fact that the SAAP is not constantly “investable” withrespect to private market asset classes. For private markets, the InvestableBenchmark Portfolio would apply the best available private market benchmarks and,for weighting purposes, would reflect the pacing plans for private markets (assumingthe pacing plans are reasonable). For example, if the private equity pacing plancalled for 12% to be invested in private equity by the end of the performancemeasurement period, then the Investable Benchmark Portfolio would reflect a 12%allocation to private equity, even though the SAA Portfolio calls for 22% to beinvested in private equity.
The following table illustrates how the performance of the CIO would be evaluated. Again,the returns are hypothetical and for illustration purposes only.
Portfolio Benchmark Net Return (%)
ValueAdded (%)
Conclusions
A. Actual Portfolio 7.5 0.5%(A-B)
CIO outperformed the BenchmarkPortfolio from these sources: i)manager selection (including securityselection effects) and ii) other effects
B. Benchmark Portfolio 7.0 n/a
101 Comprehensive Annual Financial Report 2019-2020 San José Police & Fire Retirement Plan

Statement of Investment Policy (continued)
PENSION - INCLUDES THE 401 (H) INVESTMENTS (continued)
D. For the benefit of stakeholders, the Board shall also measure and report for comparisonpurposes, on a quarterly basis, the actual portfolio return relative to the return of theLCPP and relative to commonly cited benchmarks, including:
1. A 60% equity and 40% fixed income portfolio (“60/40 Portfolio”) comprised of 60%MSCI ACWI IMI (net, unhedged) and 40% Bloomberg Barclays Global AggregateBond Index; and
2. A peer group benchmark consisting of other U.S. public pension plans similar in sizeto the system, as reported in the InvestorForce Public DB > $1B Net.
VII. MANAGER SELECTION, RETENTION, EVALUATION & TERMINATION POLICY
Background
A. The Board has delegated to the CIO the authority to select and terminate all investmentmanagers of the Plan subject to constraints and parameters contained herein. Such authorityshall be further subject to Manager Selection, Retention, Evaluation & TerminationProcedures (“Procedures”), approved by the CIO, that provide more detailed constraints andparameters.
B. It is the Board’s intention that the CIO shall have the necessary authority and resources toeffectively select, retain, evaluate, and terminate investment managers with the exceptions ofventure capital and co-investments (due to the nascent nature of the venture capital programand investment concentration risk of co-investments). The Venture Capital program shall beapproved by the Investment Committee and the Board prior to its implementation. Theseexceptions do not pertain to funds where an external manager has discretion.
C. Accordingly, the CIO shall have the authority to:
1. Manage the Investment Personnel of the Plan, including:
a. Recommending to the CEO the appointment and duties of all professional,technical, and clerical employees of the Investment Division;
b. Directing and supervising all Investment Personnel on a day-to-day basis;and
c. Evaluating all Investment Personnel and managing their professionaldevelopment.
2. Select and terminate investment consultants to assist in the selection, retention,evaluation, and termination of investment managers.
a. The CIO may use the services of the general investment consultantappointed by the Board. Alternatively, if the services of the generalconsultant can be unbundled to separate manager research services, theCIO may select a consultant(s) of his or her choice to carry out managerresearch services that would otherwise have been included in the generalinvestment consultant scope of services.
b. The CIO shall ensure that the total fees and expenses associated with theconsultants he or she selects are reasonable and shall provide a report ofsuch fees and expenses to the Investment Committee and the Board on atleast a quarterly basis.
c. While the CIO shall have the authority to select and terminate investmentconsultants to assist staff in selecting, retaining, evaluating and terminatinginvestment managers, the Board shall approve all contracts with investmentconsultants selected by the CIO to ensure such contracts reflect fair andreasonable value for the Plan.
Comprehensive Annual Financial Report 2019-2020 San José Police & Fire Retirement Plan 102

Statement of Investment Policy (continued)
PENSION - INCLUDES THE 401 (H) INVESTMENTS (continued)
3. Delegation of authority to the CIO to select and terminate investment managersreflects the Board's desire to:
a. Promote efficiency and effectiveness in the manager selection andtermination processes;
b. Focus the Board's time and attention on investment policy, asset allocation,and oversight, rather than manager selection and termination; and
c. Establish clear accountability on the part of the CIO and investment staff formanager selection, retention, evaluation, and termination.
General Constraints and Parameters
A. The CIO's authority to select and terminate investment managers shall be subject to thefollowing general constraints and parameters:
1. Investment managers shall meet the following minimum qualifications to be selectedto manage any assets of the fund:
a. Be registered as an investment advisor under the Investment Advisor’sAct of 1940 or comparable legislation, unless the manager represent andwarrants that it is exempt from such registration under applicable law.
b. Agree to enter into a contract with the Plan requiring them to perform theirservices consistent with the fiduciary services established under (a) theInvestment Advisor’s Act of 1940; (b) California law applicable to fiduciariesof public employee retirement systems, which includes the California StateConstitution, Art. XVI sec. 17 and the San José Municipal Code and/or (c)terms and conditions substantially comparable to the foregoing that aresatisfactory to the Plan.
2. The nature and size of the manager's mandate shall be consistent with:
a. The asset allocation policy of the Plan;
b. Applicable constraints (e.g. manager or strategy concentrations)contained in this Investment Policy Statement; and the total Plan active risklimit(s)1 contained in the risk section of this IPS.
1 Active risk or tracking error limits may apply at the total fund level, or another aggregation (e.g. publicmarkets assets only, excluding private markets). Risk limits may also be based on concentration,expressed for example, as a percentage (%) of some total amount of risk.
3. Notwithstanding paragraph 2) b) above, the CIO shall not approve the selection of aninvestment management firm for mandates that exceed the following limits:
4. When a market movement is the cause of a breach in the following limits, it should bereported to the IC at the earliest of a mutually agreed-upon time during which theInvestment Committee could convene with a quorum, or at the next regularlyscheduled Investment Committee meeting, along with a report on how the breach wasaddressed, or a recommendation to address the breach.
103 Comprehensive Annual Financial Report 2019-2020 San José Police & Fire Retirement Plan

Statement of Investment Policy (continued)
PENSION - INCLUDES THE 401 (H) INVESTMENTS (continued)
Basis* Description Management Firm ConcentrationLimit 2
Separately managed accounts (active) 15%
Commingled funds and SMAs (public, passive) No limit 3
Vehicle Commingled funds (public, active) 15%
Commingled funds (hedge funds) 15%
Commingled funds (private strategies) 15%4
Passive strategies No limit
Public Markets5 Active strategies (excluding hedge funds) 10%
Hedge funds 10%
Transaction Limit 6
Public MarketsTotal $ commitment to asset class (e.g. PrivateDebt)
150% of Board-approved pacingplan (cumulative)7
(excluding venture Primary fund commitment (1st allocation to mgr.) 2%**
capital) Primary fund commitment (follow-on) 3%**
Secondary fund investment 1%**
1 Active risk or tracking error limits may apply at the total fund level, or another aggregation (e.g. public markets assets
only, excluding private markets). Risk limits may also be based on concentration, expressed for example, as a
percentage (%) of some total amount of risk2 Percentage (%) of total Plan assets allowable per investment manager3 Rationale: Fund is constrained by the asset allocation. This is the "default" option for investing, and scale determines
pricing4 For private strategies, limit applied to the capital invested plus future callable commitments5 Some of these limits related to public markets may be "interim", to be replaced by risk-based limits for example6 Percentage (%) of total Plan assets allowable per investment manager.7 This would allow, for example, a commitment that in Year 1 that is 50% above "plan". The "cumulative" provision
would allow for a "catch-up" for any slower-than-planned investments in prior years* To be selected, the manager must satisfy the "Vehicle" constraint and the appropriate "Public Markets" or "Private
Markets" constraints** Percentage (%) of total plan assets
Manager Selection
Manager Selection Process
A. The process used to select an investment manager shall, at a minimum, include the followingelements:
1. Imposition of a Quiet Period/No Contact policy. Board members and staff shall nothave contact with individuals or entities who are seeking engagement by the Plan inresponse to an RFP, RFI, purchase order, or other solicitation or contracting process,except in accordance with the published terms of the contracting process or exceptfor, and limited to, contact necessary in connection with ongoing Plan business withan individual or entity. The Plan’s RFPs, RFIs, and other contract solicitations shallinclude notice that a “quiet period” will be in place from the beginning of thecontracting process until the selection of the successful party such that thesecommunications shall not occur, except as provided above. As part of the contractingprocess, potential contracting parties shall be required to disclose potential conflictsof interest. Board members and staff shall not use or attempt to use influence,outside of the individual authority to cause the organization to enter into a contractwith any individual or entity. Board members and staff may refer individuals or entitiesfor consideration for contracting to the appropriate Plan staff member(s) responsiblefor the particular procurement or contract process.
Comprehensive Annual Financial Report 2019-2020 San José Police & Fire Retirement Plan 104

Statement of Investment Policy (continued)
PENSION - INCLUDES THE 401 (H) INVESTMENTS (continued)
2. Identification of a mandate to implement the Board's SAA Policy Portfolio.
3. Comprehensive operational due diligence performed by the investment staff,qualified investment consultant, or qualified quasi-discretionary investmentsmanager;
4. In the case of private markets, comprehensive operational due diligence performedby the investment staff, qualified investment consultant, or qualified quasi-discretionary investment manager;
5. Legal review by qualified investment counsel of the manager agreement and relateddocumentation;
6. An internal meeting of investment officers, including the CIO and the officerresponsible for the asset class in question, during which staff's due diligence analysisis reviewed and debated and a staff recommendation is made;
7. Approval by the CIO;
8. Concurrence by a qualified investment consultant or quasi-discretionaryinvestment manager as to the reasonableness of the selection decision; and
9. Written affirmation to the Investment Committee by the CIO that the process used toselect the manager complied with applicable policies and the procedures. Suchaffirmation shall be submitted to the Investment Committee at the next regularlyscheduled Investment Committee meeting following the selection of the manager.
B. The procedures shall include any checklists and templates to be used in the duediligence process. Such procedures shall be presented to the Investment Committee forreview and input at least every three years, or sooner upon request of the InvestmentCommittee or any member of the Board.
C. Whenever amendments are made to the procedures, a copy shall be provided to theInvestment Committee at its next regularly scheduled meeting.
D. Should any Investment Officer responsible for performing manager due diligence andpreparing manager selection and termination recommendations to the CIO cease to beemployed by the City for any reason, the CIO shall inform the Investment Committeeimmediately.
E. The selection of an investment manager that would contravene a provision of this policyor the procedures shall require Investment Committee approval.
F. A file or files shall be established to serve as a permanent record of the due diligenceprocess for each investment manager hired and shall contain a summary of the duediligence information and analysis generated during the search process, as well as thelegal documentation.
G. The internal audit plan of the internal auditor shall include a review of a random sampleof investment manager selection decisions at least once per year to confirm compliancewith this policy and the procedures approved by the CIO, the scope of which shall notinclude the investment performance of such selection decisions. The results of suchreview shall be reported to the Audit Committee and the Investment Committee.
H. A “Watch List” will be established for underperforming managers and managers underextraordinary review for qualitative reasons, and will be maintained by the GeneralConsultant.
105 Comprehensive Annual Financial Report 2019-2020 San José Police & Fire Retirement Plan

Statement of Investment Policy (continued)
PENSION - INCLUDES THE 401 (H) INVESTMENTS (continued)
1. Quantitative criteria for underperformance which would trigger placement on theWatch List includes manager underperformance versus the appropriate benchmarkover a three and/or five year period.
2. Potential actions resulting from placement on the Watch List include findingappropriate resolution of outstanding issues, renewed confidence in the manager orstrategy, or determination that the termination of the manager or strategy isappropriate.
3. Investment staff will identify underperforming managers in conjunction withconsultants.
4. As necessary, nuanced investment strategies or fund types may require customizedreview.
I. The Plan will seek alignment of interests when negotiating fees while pursuing the bestnet of fees performance results. Investment costs shall be monitored, controlled, andwhenever possible negotiated to ensure cost effectiveness. The Board shall giveconsideration to the impact of administrative expenses, external management fees andperformance fees when establishing the asset mix policy of the Plan. The Board will beprovided reports on investment costs of the Plan at least annually.
J. The Plan’s staff, in coordination with its investment consultants and legal counsel, willnegotiate, monitor, and report on fees with investment managers regularly to ensuremarket competitiveness and appropriateness.
K. The Plan will seek to ensure that excessive fees are not being paid for alternative assetsby reviewing manager fees at least annually. Fee structures could incorporate fixed fees,performance based fees, high water marks, waterfall, hurdles, floors and caps. The Planmay also incorporate multi-year performance periods with clawbacks as needed.
Manager Termination Procedures
A. City of San José Office of Retirement Services investment staff is aware that the ongoingreview and analysis of investment managers is just as important as the due diligenceimplemented during the investment manager selection process. The performance of theinvestment managers will be monitored on an ongoing basis and it is at the CIO’s discretionto take corrective action by terminating and/or replacing an investment manager if it isdeemed appropriate at any time for any reason.
The CIO, in agreement with the appropriate consultant for the manager/asset class inquestion, may terminate an investment manager or product due to a variety of reasons.These reasons can include but are not limited to the following:
1. Plan asset allocation change
2. limited market opportunity
3. style drift
4. violation of policies and guidelines
5. key personnel turnover
6. failure to achieve performance or risk objectives
7. legal or regulatory action
8. any change deemed likely to impact or impair investment performance
Comprehensive Annual Financial Report 2019-2020 San José Police & Fire Retirement Plan 106

Statement of Investment Policy (continued)
PENSION - INCLUDES THE 401 (H) INVESTMENTS (continued)
9. any other material adverse events, whether reputational or financial, that could beexpected to cause significant headline risk.
Termination of private funds is typically not possible. If the CIO wishes to exit a private fund,they may evaluate opportunities for secondary market sales of fund interests.
The CIO will report any termination actions at the next Committee meeting, detailing therationale for action.
XIII. RISK POLICY
Purpose and Scope
The purpose of this Risk Policy is to ensure that the total portfolio investment risk is consistent with theinvestment beliefs and strategic goals set forth by the San José Police and Fire Retirement Board. Thisdocument defines the roles and responsibilities for maintaining this Risk Policy, management of theinvestment risks of the Plan, and monitoring the results. It also articulates the Board’s philosophytowards investment risk. The Plan intends to use risk management to make more informed decisionsand improve the likelihood of achieving its strategic goals and objectives within the appendix, specificrisk targets and limits are established.
The Risk Policy will cover investment risk, liquidity risk, credit risk, and funding risk. The Risk Policy willnot cover enterprise risk concepts such as operational risk, regulatory risk, legal risk, and counterpartyrisks.
Objectives
The objective of the risk management program are:
A. To communicate the Plan's commitment to risk management and the central role inachieving Plan goals and objectives;
B. To formalize and communicate a consistent approach for managing risk;
C. To ensure the investment risks assumed by the Plan are appropriate given thefinancial health of the Sponsor;
D. To ensure the Plan operates within the agreed risk tolerance and risk limits.
Definitions
To aid with the interpretation of this policy, a glossary of terms is included in the Appendix D, whichdefines all the technical terms use in this policy.
Governance
Consistent with the Board’s governance model, which delegates specific authority, responsibility, andaccountability to others based on areas of expertise, this Risk Policy defines the following roles andresponsibilities. The Board retains sole responsibility of governing the Plan, setting investment policyand risk policy, and monitoring the Investment Program. The Board delegates specific areas ofresponsibility while retaining appropriate oversight of the delegated activity.
Board of Administration
The Board maintains the sole and plenary authority and fiduciary responsibility for the InvestmentProgram. The Board also understands it may delegate certain responsibilities under the InvestmentProgram for purposes of administrative efficiency and expertise. The areas of the Investment Programthe Board may not delegate include:
107 Comprehensive Annual Financial Report 2019-2020 San José Police & Fire Retirement Plan

Statement of Investment Policy (continued)
PENSION - INCLUDES THE 401 (H) INVESTMENTS (continued)
A. Engaging Board consultants and service providers
B. The governance model of the Investment Program
C. Monitoring the Investment Program
D. Establishing and maintaining investment policy, including:
1. The Investment Policy Statement (“IPS”)
2. This Risk Policy
3. Investment objectives
4. Strategic asset allocation
5. Allocation-level performance benchmarks
6. Risk philosophy
Investment Committee
The Investment Committee (“IC”) is a subset of the Board assigned to review investment related mattersin greater detail. The IC has been assigned authority to assist the Board in its duties by meeting on atleast a quarterly basis regarding matters of investment policy, risk management, portfolio structure,vendor selection, real estate operations, human resources, reporting, and monitoring. Please refer to theIC Charter for specific detail.
Staff
San José Retirement Services Staff (“Staff”), including the Chief Executive Officer (CEO) and ChiefInvestment Officer (CIO), is broadly responsible for supporting the Board in the effective execution of theInvestment Program. The CIO has been delegated authority to execute specific elements of theInvestment Program as outlined herein. Staff risk operating zones are defined in Appendix C.
General Investment Consultant
The General Investment Consultant (“GC”) is appointed by the Board to provide independent, objectiveinvestment advice. The GC is a fiduciary to the Plan under California law. The GC works with Staff andspecialty consultants in the development of recommendations while recognizing its fiduciary duty is toprovide prudent investment advice to the Board. The GC provides advice without discretionary authorityto execute on its advice. With regard to this Risk Policy, the GC contributes to the following:
A. Asset allocation recommendations among classes and subclasses
B. Investment manager selection, evaluation and termination
C. Investment performance monitoring
D. Investment risk monitoring
E. Capital markets projections
F. Coordination with the Plan’s actuary in conducting periodic asset/liability studies andother required reporting
G. Recommend changes to the actual portfolio to achieve compliance with this RiskPolicy
H. Board education
Comprehensive Annual Financial Report 2019-2020 San José Police & Fire Retirement Plan 108

Statement of Investment Policy (continued)
PENSION - INCLUDES THE 401 (H) INVESTMENTS (continued)
Specialty Investment Consultants
A. Absolute Return Consultant
The Absolute Return Consultant (“AC”) is appointed by the Board to provideindependent, objective investment advice. The AC is a fiduciary to the Plan underCalifornia law. The AC works with Staff and the other consultants in the developmentof recommendations while recognizing its fiduciary duty is to provide prudentinvestment advice to the Board. The AC provides advice without discretionary authorityto execute on its advice. With regard to this Risk Policy, the AC contributes to thefollowing:
1. Assists with providing transparency into the absolute return investment strategies,including recent holdings and transactions.
2. Assists with the analysis of recommended investment strategies that have not yetbeen incorporated into the Plan including recent holdings and transactions.
3. Board education
B. Risk Advisory Consultant
The Risk Advisory Consultant (“RC”) is appointed by the Board to provide independent,objective investment advice. The RC is a fiduciary to the Plan under California law. TheRC works with Staff and the other consultants in the development of recommendationswhile recognizing its fiduciary duty is to provide prudent investment advice to the Board.The RC provides advice without discretionary authority to execute on its advice. Withregard to this Risk Policy, the RC contributes to the following:
1. Asset allocation recommendations among classes and subclasses
2. Investment manager evaluation
3. Risk policy development and maintenance
4. Investment risk monitoring
5. Recommend changes to the actual portfolio to achieve compliance with this RiskPolicy
6. Board education
Investment Managers
Investment Managers are delegated the responsibility of investing and managing Plan assets inaccordance with the IPS, Risk Policy, and all other applicable laws and the terms of the applicableinvestment documents evidencing the Plan’s acquisition of an interest in an investment vehicle, andother controlling documents. Investment Managers are responsible for making all investment decisionson a discretionary basis regarding assets placed under their jurisdiction and will be accountable forachieving their investment objectives. Such discretion shall include decisions to buy, hold, and sellinvestments in amounts and proportions that are reflective of the stated investment mandate.
Custodian Bank
The Custodian Bank, selected by the Board to act as the principal custodian of assets of the trust, isdelegated the responsibility of holding the assets and evidence of interests owned by the Plan ininvestment vehicles and cash (and equivalents). The Board may authorize the Custodian Bank to investin temporary short-term fixed income investments both for the investment strategies and as a part of thecash portion of Plan assets. Such investments will be managed in general accordance with short-termfixed income investment guidelines as detailed in the Custodial Agreement. Cash managed forinvestment strategies shall be considered to be sub-portions of the assets managed by the directingInvestment Managers.
109 Comprehensive Annual Financial Report 2019-2020 San José Police & Fire Retirement Plan

Statement of Investment Policy (continued)
PENSION - INCLUDES THE 401 (H) INVESTMENTS (continued)
Philosophy
An institutional investment program is inherently exposed to many types of risk. This Risk Policy focusesprimarily on the investment risks caused by the markets to which the Plan is exposed (e.g. domesticequities, real estate, domestic fixed income, and others). Related risks such as counterparty, geo-political, and fraudulent or unethical behavior, among others, are not addressed in this Risk Policy.
This Risk Philosophy represents the foundational principles on which the Investment Program is based.Every investment decision should be made with these foundational principles in mind to promote thefulfillment of fiduciary obligations. The statements below set forth the Board’s Risk Philosophy, in orderof importance:
Investment risk policy should consider the financial health of the sponsor
Contribution volatility (i.e. the volatility of annual contributions made to the Plan by the Sponsor)represents a significant budgetary constraint on the Sponsor’s financial planning with importantimplications for taxpayers. The Investment Program shall, therefore, assume a level of volatility that canbe tolerated by the Sponsor in both normal as well as stressed market conditions.
The funded status (i.e. funded ratio), viewed as a general proxy for the health of the Plan, is reviewed onboth actuarial and fair value of assets bases. While a higher funded ratio is always preferred, theInvestment Program shall not accept a level of risk that for a given probability could cause the fundedratio to fall below the limit identified in Appendix B.
The Plan will manage funding risk in three main ways:
A. Actuarial review: The actuary will periodically review the Plan's liabilities
B. Asset/Liability studies: The general consultant will periodically perform this study toidentify changes in the relationship between assets and liabilities
C. Asset Allocation: The Plan will periodically conduct asset allocation studies to ensure:
1. portfolio diversification
2. expected portfolio returns over the long-term (i.e. 10 years or more) in combinationwith projected contributions are sufficient to meet expected liabilities
Volatility and drawdown are the primary measures of investment risk
Because the Plan must satisfy long-term liabilities and receives regular contributions from the Sponsor,the Investment Program invests for the long-term appreciation of assets. It is, therefore, able towithstand short-term volatility spikes without undue impairment of capital. For this reason, long-termvolatility (i.e. 8 years or more) is considered the appropriate timeframe. Volatility is forecasted throughthe Plan’s strategic asset allocation and risk reporting processes and is measured and monitored asoutlined in Appendix B and C.
Market corrections due to economic recession, geo-political instability, and other causes have historicallyproven detrimental to the funded status of the Plan. Drawdown and tail-risk metrics are designed toassess potential investment returns during such periods of market stress. Historical drawdown scenarioanalysis provides insight into how the portfolio would respond if it were exposed to prior stressed marketconditions. Tail-risk analysis provides insight into the probabilities of experiencing a negative investmentreturn with a small (e.g. 5%) probability. These metrics provide insight into how much may be lost duringa stressed market environment. Because market corrections are statistically infrequent and typicallycaused by unforeseen events, neither approach can be used with certainty, but each provides insightinto the potential impact a worst-case scenario may represent to the Plan and Sponsor.
Comprehensive Annual Financial Report 2019-2020 San José Police & Fire Retirement Plan 110

Statement of Investment Policy (continued)
PENSION - INCLUDES THE 401 (H) INVESTMENTS (continued)
Active risk, factor exposures, and liquidity must be monitored
Implementation of any strategic asset allocation introduces deviations between the Plan’s actual portfolioand its policy index. While it is generally desired to minimize these differences to achieve efficiency,deviations from the policy index may be desirable for various reasons. To ensure the actual portfolio isappropriately adhering to the policy index, active risk must be measured and monitored through trackingerror statistics.
Factor exposures capture the underlying economic drivers supporting asset class returns. While thepolicy index and actual portfolio are constructed primarily through asset class forecasts, factorexposures provide important insight into the underlying economic drivers supporting the InvestmentProgram. Each security owned within each investment strategy has some exposure to various economicdrivers. The Investment Program’s total exposure to the economic drivers is, therefore, driven by theexposures inherent in those securities as well as the correlations across the factor exposures. Tounderstand better the Plan’s exposure to the economic drivers and anticipate how the InvestmentProgram will perform under various economic environments, factor exposures must be measured andmonitored.
In addition to benefit payments, the Plan must meet its obligations to pay its expenses and satisfy capitalcalls. Generally, these cash outflows are predictable and can be met through the normal administrationof the Plan. Under stressed market conditions, however, liquidity within the Investment Program canchange significantly and with little advance notice while the Plan must continue to meet its obligations.Liquidity must, therefore, be monitored and measured to ensure that the Plan can continue to meet itsfinancial obligations during periods of market stress without being forced to sell assets at stressedprices.
Monitoring
Reporting processes are designed to provide the Board with the information needed to execute itsoversight function. As such, the Board has developed the following monitoring structure.
The Investment Committee, CIO and RC will monitor the Investment Program’s risk exposures quarterly.This detailed review process will include security-level exposure analysis of the Investment Program’sfactor exposures; asset class exposures; tracking error; tail-risk and drawdown scenario analysis, andgeographic exposures.
The Board, Staff, and RC will monitor the Investment Program’s adherence to this Risk Policy on aquarterly basis. This review process will summarize the detailed reporting used by the InvestmentCommittee and also include the ranges and targets outlined in Appendix B.
Management
Aside from liquidity management responsibilities assigned to the CIO in the Plan’s IPS, the Board retainsfull authority and responsibility for ensuring adherence of the Investment Program to this Risk Policy.
The Plan’s risk management function is expected to evolve through time. The objective of the riskmanagement function is to ensure the Plan operates within the Board’s agreed risk tolerance and limits.The main goals of the risk management function are:
A. Identify: risks that will impact the Plan's ability to meet its goals and objectives;
B. Estimate the significant risks to which the Plan is exposed;
C. Manage: risk must be managed and should be commensurate with the rewards;
D. Communicate: risks must be reported and monitored on a regular basis.
111 Comprehensive Annual Financial Report 2019-2020 San José Police & Fire Retirement Plan

Statement of Investment Policy (continued)
PENSION - INCLUDES THE 401 (H) INVESTMENTS (continued)
To a large extent, many factors that impact future benefits and contributions are uncontrollable,however, the potential impacts are considered in strategy development. The Plan uses three approaches(actuarial valuation, asset/liability studies, and asset allocation studies, as discussed above) to addressand manage risk.
The Board may delegate authority to the CIO and Staff for certain functions as detailed below.Delegation of authority will be coordinated with workflow, compliance and reporting procedures that areclearly defined, reviewed, and approved. The Board shall be notified timely of all investment decisionsmade by the CIO and their implications to the Plan.
A. Rebalancing
Portfolio rebalancing may occur by adjusting allocations to individual investmentstrategies or managers or through the use of an overlay provider using derivatives.
B. Relative Risk
While the Board recognizes that the majority of investment risk over the long term isdependent on the asset allocation decision, it recognizes the cost of precisely matchingthe strategic asset allocation is considerable and not always optimal. In addition to assetclass weightings versus policy, annualized tracking error will be used to measure thedisparity of returns between the actual positions in the Investment Program compared tothe strategic asset allocation. Annualized tracking error, as measured quarterly by theRC, shall adhere to the targets and ranges outlined in Appendix C.
IX. INVESTMENT COSTS
The Board members intend to monitor and control investment costs at every level of the San José Policeand Fire Department Retirement Plan.
A. Professional fees will be negotiated whenever possible.
B. Where appropriate, passive portfolios will be used to minimize management fees andportfolio turnover.
C. If possible, assets will be transferred in-kind during manager transitions and Planrestructurings to eliminate unnecessary turnover expenses.
D. Managers will be instructed to minimize brokerage and execution costs.
Comprehensive Annual Financial Report 2019-2020 San José Police & Fire Retirement Plan 112

Statement of Investment Policy (continued)
PENSION - INCLUDES THE 401 (H) INVESTMENTS (continued)
Appendix AASSET ALLOCATION TARGETS 8
Target(%)
SAAP Asset ClassBenchmarks
LCPP Asset ClassBenchmarks
Tracking ErrorTarget Range(basis points)
Growth 70
Public Equity 46Custom Public Equity
Benchmark9
LCPP Custom PublicEquity Benchmark9 0-400
Total Private Markets 19 Actual Return N/A Private Equity 6 Russell 3000
Venture/Growth Capital 4 Russell 3000
Private Debt 3 Bloomberg Barclays
Aggregate
Growth Real Estate 3 Global NAREIT
Private Real Assets 3 S&P Global Natural
Resources
Emerging Market Bonds 3
50/50 JPM EMBIGD/JPM GBI-EM GD
50/50 JPM EMBIGD/JPM GBI-EM GD 0-300
High Yield Bonds 2
Bloomberg Barclays HighYield
Bloomberg Barclays HighYield 0-300
Low Beta 8
Market Neutral Strategies 3 0 0 0Immunized cash flows
5 0 0 0
Other 22
TIPS 2Bloomberg Barclays
0-5 Year TIPSBloomberg Barclays
0-5 Year TIPS 0 - 100
Core Real Estate 5NCREIF ODCE Equal
Weighted Global NAREIT 0 - 400
Investment Grade Bonds 12Custom IG Bonds
Benchmark10
Custom IG BondsBenchmark10 0 - 200
Long-Term GovernmentBonds 3
Bloomberg BarclaysTreasury 10+
Bloomberg Barclays
Treasury 10+ 0 - 100
LIABILITY BENCHMARK PORTFOLIO: Bloomberg Barclays U.S. Long Treasury Index
8 Approved by the Board of Administration in March 2020. 9 23% MSCI US IMI, 11% MSCI World ex US IMI, 12% MSCI EM IMI.10 25% Bloomberg Barclays 1-3 Year Government/Credit, 56% US Aggregate, 19% US Securitized MBS/ABS/CMBS.
113 Comprehensive Annual Financial Report 2019-2020 San José Police & Fire Retirement Plan

Statement of Investment Policy (continued)
PENSION - INCLUDES THE 401 (H) INVESTMENTS (continued)
Appendix BSCHEDULE OF OPERATING RANGES AND LIMIT TARGETS
Operating Range Board ApprovedCharacteristic Measurement Min. Max. LimitFunded ratio Probability that the Actuarial funded
ratio will fall below the BoardApproved Limit
80% n.m. 5% probability offalling below 60%
Sponsorcontributions
Probability that Sponsorcontributions in a single year willexceed a specified limit
$160mm $220mm 5% probability ofexceeding $150mm
Interest on UAL Probability that the Interest cost ofunfunded actuarial liability willincrease above a specified limit
$35 mm $80mm 5% probability ofexceeding $150mm
Total fund absolutevolatility
Forecast Annualized standarddeviation of returns of the actualportfolio
8% 10% 12%
Total fund relativevolatility
Forecast Tracking error of the actualportfolio vs. the strategic assetallocation policy index
1% 2% 4%
Drawdownexposure
Average of three worst historicalscenario drawdown events
n/a n/a -30%
Liquidity Liquidity Coverage Ratio (LCR) 5-yrprojection
2.0 3.0 1.2
Appendix CFORECASTED RISK OPERATING ZONES
Risk Guideline CIO IC BoardTotal Portfolio
Total Portfolio Forecast Beta
Total Portfolio Duration
Total Portfolio Credit Spread Duration
Total Portfolio Relative Risk
Equity Factor Relative Risk
Interest Rate Factor Relative Risk
Credit Factor Relative Risk
Currency Factor Relative Risk
Portfolio Active Risk
Average Drawdown Risk
8 - 11%
0.5 - 0.8,
0-3 years
0-3 years
< l 10% l
< l 10% l
< l 10% l
< l 10% l
< l 10% l
0.5 - 3%
0 - 25%
<8%; 11-12%
0.3-0.5; 0.8-1
3-5 years
3-5 years
l 10% l - l 20%l
l 10% l - l 20%l
l 10% l - l 20%l
l 10% l - l 20%l
l 10% l - l 20%l
0-0.5%; 3-4%
25-30%
>12%
<0.3; >1
> 5 years
> 5 years
> l 20% l
> l 20% l
> l 20% l
> l 20% l
> l 20% l
> 4%
<-30%
Comprehensive Annual Financial Report 2019-2020 San José Police & Fire Retirement Plan 114

Statement of Investment Policy (continued)
PENSION - INCLUDES THE 401 (H) INVESTMENTS (continued)
Appendix DDEFINITIONS
Actuarial Assumptions: Assumptions made by the actuary that influence the valuation of liabilities
Active Risk: Measures the volatility of an investment strategy versus its benchmark.
Concentration Risk: Lack of diversification in exposure to markets or managers.
Confidence Interval: A range of values so defined that there is a specified probability that the value of aparameter lies within it.
Counterparty Risk: The risk that a party in a transaction does not fulfill its contractual obligation. Bothsides of a contract are exposed to this risk
Credit Risk: Also referred to as default risk. This is the risk the borrower fails to repay a loan or meet acontractual obligation.
Currency Risk: The potential loss on the price of an asset due to fluctuating foreign currency exchangerates.
Drawdown: A measure of both returns and time over which an investment experienced a decline invalue from a peak to a trough. It is based on actual historical results.
Duration: Measures how long (in years) it takes to be repaid the bond’s price by the bond’s total cashflows. This measure is used to determine the interest rate sensitivity of the portfolio.
Funded Ratio: The ratio of assets to liabilities. Assets can be defined in terms of the fair value of assetsor the actuarial value of assets. Liabilities are defined as all future benefit payments discounted at theactuarial assumed return,
Funding Risk: Also referred to as surplus risk, this is the risk of assets and liabilities not matchingInflation Risk: The risk that general prices of goods and services are rising, which erodes the purchasingpower of money.
Interest Rate Risk: The risk that an investment will decline in value as a result of a change in interestrates. This risk is measured by its duration.
Investment Risk: The risk associated with investing in capital markets
Liquidity: Is comprised of both the time required to complete the transaction and the impact that thetransaction has on the price of the asset. There are two types of liquidity risk: Market liquidity risk andfunding liquidity risk. Market liquidity risk refers to the risk that an asset cannot be sold without loss ofvalue. Funding liquidity risk refers to the risk that the plan will not be able to meet financial obligations asthey come due.
Liquidity Coverage Ratio: The ratio of liquidity available to liquidity needs.
115 Comprehensive Annual Financial Report 2019-2020 San José Police & Fire Retirement Plan

Statement of Investment Policy (continued)
PENSION - INCLUDES THE 401 (H) INVESTMENTS (continued)
Portfolio Construction Engine: A software program relying on mean-variance optimization. Portfoliooptimization requires inputs of asset class returns, standard deviations, and correlations in order todevelop an output of total portfolio expected returns and standard deviations, which can be comparedalong with their Sharpe Ratios.
Risk: The uncertainty of an event occurring
Standard Deviation: The square root of the average squared deviation of the returns from its mean
Strategic Asset Allocation: The asset classes and weights that are targeted for the policy benchmark
Tail Risk: Tail-risk measures both the probability and expected returns of a significant loss. Whenassuming normally distributed returns, tail-risk is the left tail of the return distribution. The normaldistribution used for mean-variance optimization underestimates the risk of rare events when marketsexhibit fat tails (for example, during the Global Financial Crisis).
Volatility: The standard deviation of returns. Standard deviation (SD) is the square root of the averagesquared deviation of the returns from its mean.
Comprehensive Annual Financial Report 2019-2020 San José Police & Fire Retirement Plan 116

Statement of Investment Policy
HEALTHCARE - 115 SUBTRUSTS
1) This investment policy statement governs investments for the City of San José Police and FireDepartment Retiree Health Care Trust Fund (the “Health Care Trust”). The Health Care Trust is anInternal Revenue Code Section 115 trust that was established on June 24, 2012. The Health CareTrust is separate from the City of San José Police and Fire Department Retirement Plan (the “Plan”),and contributed assets are to be used for the sole purpose of providing healthcare benefits to Planbeneficiaries. The Health Care Trust was established to provide an alternative to the existing 401(h)account, which is included within the Plan.
2) The Fund will be managed as an ongoing concern with a long-term investment time horizon.
INVESTMENT OBJECTIVES
3) The Health Care Trust’s sole and exclusive objective is to provide a funding source for the health andwelfare benefits for retirees and dependents of the City of San José Police and Fire DepartmentRetirement Plan.
4) To achieve the goal detailed above, the Health Care Trust’s assets will be managed:
a) To achieve a high level of return with a prudent level of risk;
b) To provide sufficient liquidity to meet all cash needs;
c) To provide sufficient diversification in an effort to avoid significant losses and preservecapital.
FIDUCIARY STANDARDS
5) The Board of Administration is subject to the following duties under law:
a) The assets of the Health Care Trust are trust funds and shall be held for the exclusivepurposes of providing benefits to members of the Plan and their beneficiaries and defrayingreasonable expenses of administering the Health Care Trust;
b) The Board shall discharge their duties with respect to the Health Care Trust solely in theinterest of, and for the exclusive purposes of providing benefits to, members of the Plan andtheir beneficiaries, and defraying reasonable expenses of administering the Health CareTrust. The Board’s duties to the members and their beneficiaries shall take precedence overany other duty;
c) The Board shall discharge their duties with the care, skill, prudence and diligence under thecircumstances then prevailing that a prudent person acting in a like capacity and familiar withthese matters would use in the conduct of an enterprise of like character and with like aims.
6) Investment staff, investment consultants, investment managers, custodians and all other partiescharged with handling the Health Care Trust’s assets shall utilize the care, skill, prudence anddiligence under the circumstances then prevailing that a prudent person acting in a like capacity andfamiliar with these matters would use in the conduct of an enterprise of like character and with likeaims, and shall comply with all applicable laws, rules and regulations.
FUND GOVERNANCE
7) The governance structure of the Health Care Trust is described in the City Charter and in variousgovernance policies established by the Board of Administration, including but not limited to:
117 Comprehensive Annual Financial Report 2019-2020 San José Police & Fire Retirement Plan

Statement of Investment Policy (continued)
HEALTHCARE - 115 SUBTRUSTS (continued)
a) Policy on the Role of the Board of Administration;
b) Policy on the Role of the Investment Committee;
c) Policy on the Role of the Director of Retirement Services;
d) Policy on the Role of the Chief Investment Officer;
e) Policy on Roles in Vendor Selection.
ASSET ALLOCATION
8) The long-term asset allocation of the Health Care Trust will be determined based on the results of anasset allocation study.
9) The current asset allocation policy of the Health Care Trust (at fair value) as of August 1, 2014 is setout below:
Broad Asset Class Minimum Target MaximumEquity 25% 43% 50%
Fixed income 5 15 25
Inflation-linked 12 22 25
Absolute return / Global tactical asset allocation - 20 25
Cash - - 5
Total 100%
10) The Board is committed to implementing and maintaining the above asset allocation policy, but alsorecognizes that circumstances may arise where it is not possible or practical to timely implement ormaintain the policy. In such circumstance, the Trustees will monitor the status of the asset allocationpolicy and seek to comply with the policy when it is possible and prudent to do so.
11) The long-term asset allocation of the Health Care Trust will be reviewed at a minimum every fiveyears, also based on the results of an asset allocation study. Such studies may also be performedon an interim basis, as necessary. The Board may review the current asset allocation targets at anytime in light of market conditions, and make changes as it deems necessary.
12) The Board will also approve an Investment Structure, which provides additional detail as to theallocation of assets to categories of investment within the broad asset classes that comprise theasset allocation policy. The Investment Structure and any changes thereto do not necessarilyrequire that an asset allocation study be performed.
REBALANCING
13) The asset allocation of the Health Care Trust will be monitored on a monthly basis and the assets ofthe Health Care Trust are to be rebalanced to within the target ranges when fluctuations in fairvalues cause the portfolio to fall outside the guideline ranges set out above. Such re-balancing shalloccur as soon as practical unless the approval of the Investment Committee is obtained.
14) When re-balancing, funds will generally be taken from accounts that are most significantly abovetheir approved ranges and will be transferred to accounts that are most significantly below theirapproved ranges until the allocation is within the guideline ranges.
Comprehensive Annual Financial Report 2019-2020 San José Police & Fire Retirement Plan 118

Statement of Investment Policy (continued)
HEALTHCARE - 115 SUBTRUSTS (continued)
DIVERSIFICATION
15) Investments shall be diversified with the intent to minimize the risk of large investment losses.Consequently, the total portfolio will be constructed and maintained to provide prudent diversificationwith regard to the concentration of holdings in individual issues, issuers, or industries. Furthermore,assets will be assigned to a variety of investment managers that employ a range of investmentmanagement strategies.
16) Consistent with paragraph 15 above:
a) No single investment management firm shall be authorized to manage more than 15% of theHealth Care Trust’s actively managed assets without Board approval. There is no limit on theamount of passively managed assets that an investment management firm shall beauthorized to managed;
b) As a general rule, Health Care Trust assets placed with an investment manager should notrepresent more than 10% of the total assets managed by that firm, without Board approval.
LIQUIDITY MANAGEMENT
17) The projected cash flow needs of the Health Care Trust are to be reviewed at least quarterly and thecustodian and investment managers of the Health Care Trust are to be informed in writing in a timelymanner of the liquidity needs of the Health Care Trust Fund. If necessary, cash flow needs will becoordinated through the Health Care Trust’s rebalancing provisions contained herein.
PROXY VOTING
18) Proxies must be voted in the best interest of shareholders in this case the Health Care Trust and itsmembers and beneficiaries. The Health Care Trust may engage the services of one or more thirdparties, including but not limited to its custodian, investment managers, and consultants, to voteproxies for common stocks owned in its portfolios. Such parties must exercise their authority to voteas fiduciaries to the Health Care Trust and in accordance with applicable standards of prudence. TheBoard may establish proxy voting guidelines to further guide the voting of the Health Care Trust’sproxies. Any third parties retained to vote the proxies of the Health Care Trust shall provide periodicreports to the Health Care Trust on their activities.
19) As of the date of this Policy, the Board has delegated its proxy voting authority on all domesticsecurities to a dedicated proxy voting advisor. Investment managers for international securities areresponsible for voting the proxies on international securities, as are hedge fund managers.
HIRING & TERMINATING INVESTMENT MANAGERS
20) Investment managers should meet the following criteria in order to be considered to manage theassets of the Fund.
a) Be capable of providing adequate and satisfactory information on the history of the firm, keypersonnel, key clients, fee schedules, and support personnel. Such information mustdemonstrate acceptable financial and staff stability and longevity;
b) Be able to clearly articulate the investment strategy that will be followed and demonstratethat the strategy has been successfully adhered to over time;
c) Have no past or outstanding legal judgments against them, which reflect negatively upon thefirm or call into question the ability of the firm to serve as a fiduciary of the Health CareTrust.
119 Comprehensive Annual Financial Report 2019-2020 San José Police & Fire Retirement Plan

Statement of Investment Policy (continued)
HEALTHCARE - 115 SUBTRUSTS (continued)
21) Staff-level procedures shall be prepared detailing the additional criteria and processes to be used inconducting investment manager due diligence and in arriving at recommendations to select orterminate an investment manager. Such procedures shall be reviewed with the InvestmentCommittee and the Board from time to time.
22) The procedures noted in paragraph 21 above shall require at a minimum that recommendations toappoint or terminate an investment manager shall be accompanied by a report, prepared by anexternal investment advisor and/or investment staff, containing investment staff’s and/or theinvestment advisor’s recommendations and summary analysis.
MONITORING INVESTMENT MANAGERS
23) The Health Care Trust’s investment managers will be monitored on an ongoing basis and may beterminated by the Health Care Trust at any time due to performance or other developments that callinto question the manager’s ability to continue to effectively manage assets of the Health CareTrust.
24) The majority of the Health Care Trust’s assets are currently passively managed, in which case themanager should be expected to produce long-term returns that are reasonably close to those of therelevant benchmark. For any active investment managers, quarterly performance will be measuredand evaluated relative to appropriate long-term performance benchmark and objectives, though it isunderstood that investment managers will, from time to time, underperform their benchmarks andobjectives. Persistent underperformance by an investment manager, however, will be viewed as thebasis for an extraordinary review of that manager and the manager’s potential termination.
25) Certain other events may also trigger an extraordinary review, and possible termination, of aninvestment manager. These include, but are not limited to:
a) Failure to adhere to the terms of a contract between the manager and the Health Care Trust;
b) Loss of an investment professional(s) directly responsible for managing the Health CareTrust’s assets, or who is/are so significant to the firm’s overall investment process as to callinto question the future efficacy of that process;
c) The sale of the investment management firm to another entity, or other change in ownership;
d) The purchase of another entity by the investment management firm;
e) Significant account losses and/or extraordinary addition of new accounts;
f) Regulatory actions against the firm, particularly any that represent violations of securitieslaws and regulations;
g) Any other event which may impair the manager’s ability to perform in a satisfactory manneror puts the Health Care Trust’s assets at undue risk of loss.
DERIVATIVE SECURITIES
26) Derivative securities are financial instruments that “derive” their value from an underlying commodity,index, or security. Examples include futures, options and forward contracts. Derivatives can providea cost-effective means of managing portions of a portfolio and to manage risk through hedgingactivities. Examples of such uses include:
a) Equitizing cash during portfolio transitions until “physical” securities are in place;
b) Managing asset allocation on a temporary basis;
c) Hedging foreign currency risk, subject to approved limits.
Comprehensive Annual Financial Report 2019-2020 San José Police & Fire Retirement Plan 120

Statement of Investment Policy (continued)
HEALTHCARE - 115 SUBTRUSTS (continued)
27) In general, the use of derivatives for the purposes noted above, and similar risk managementpurposes, is supported by the Investment Committee and the Board. Speculative positions inderivatives, however, are not authorized under any circumstances.
28) Given the nature of many investment managers’ mandates, it is recognized and understood thatinvestment managers retained by the Health Care Trust may use derivatives that are contrary toparagraphs 26 and 27 above.
29) This policy allows for the use of derivatives within the specific portfolios being managed by theinvestment managers retained by the Health Care Trust. Use of derivatives at the Health Care Trustlevel (i.e. Total Fund) must be authorized by this Investment Policy Statement prior to being utilizedwithin the Health Care Trust.
INVESTMENT RESTRICTIONS
30) Health Care Trust assets are currently invested primarily in mutual fund investment vehicles, giventhe current asset size of the Health Care Trust. The type of investment vehicles utilized by the HealthCare Trust will be revisited as the asset size of the portfolio increases. In instances when the HealthCare Trust invests through a commingled fund or separate account, investment managementagreements will be established for each investment manager retained by the Health Care Trust.Such agreements shall specify any policies, risk controls, portfolio characteristics, reportingrequirements, and other requirements or restrictions that may be applicable to the manager.
INVESTMENT COSTS
31) Investment costs shall be monitored, controlled, and whenever possible negotiated to ensure costeffectiveness. The Board shall give consideration to the impact of administrative expenses, externalmanagement fees and performance fees when establishing the asset mix policy of the Health CareTrust.
32) The Board will be provided reports on investment costs of the Health Care Trust at least annually.
VALUATION OF INVESTMENTS
33) The Health Care Trust’s investments shall be valued using fair values or other suitable methods ofvaluation. The frequency of valuation shall be dependent upon the nature of the asset.
34) Where a public market price is not available for an investment, a suitable method of valuation shallbe used including the use of: discounted cash flows, earnings multiples, appraisals, prevailingmarket rates for instruments with similar characteristics or other pricing models as appropriate.Independent, qualified appraisers may be used to provide valuations or verify the reasonableness ofinternal valuations.
OTHER
35) Appendix A contains the Long-term Policy Benchmark.
36) Exceptions to this Investment Policy Statement must be approved by the Board of Administration ofthe Health Care Trust.
POLICY REVIEW & HISTORY
37) This policy will be reviewed at least annually.
38) This policy was most recently reviewed by the Investment Committee on June 6, 2013.
121 Comprehensive Annual Financial Report 2019-2020 San José Police & Fire Retirement Plan

Statement of Investment Policy (continued)
HEALTHCARE - 115 SUBTRUSTS (continued)
Appendix ALONG-TERM BENCHMARK
Asset Class Benchmark Target (%)Equity MSCI ACWI IMI (Net) 43
Fixed Income BC Aggregate 15
Inflation-Linked MSCI U.S. REIT 10
Bloomberg Commodity Index 12
Absolute Return/GTAA 60% MSCI World / 40% CITI WGBI 20
Comprehensive Annual Financial Report 2019-2020 San José Police & Fire Retirement Plan 122

Investment ProfessionalsAs of June 30, 2020
PUBLIC EQUITY
Artisan Partners GQG Partners RWC Emerging Markets Equity Fund
Cove Street Capital Northern Trust Asset Management Wellington Management
Dimensional Fund Advisors Oberweis Asset Management
PRIVATE EQUITY
57 Stars LLC Industry Ventures Portfolio Advisors LLC
CCMP Capital Investors Innovation Endeavors Siguler Guff & Company, LP
Crescent Capital Group Neuberger Berman TCW
Francisco Partners Northern Trust Asset Management TPG Capital
HarbourVest Partners Pantheon Ventures Warburg Pincus LLC
GROWTH REAL ESTATE
Blackstone Group KSL Capital Partners, LLC Torchlight Investors
Brookfield Asset Management Sculptor Capital Management LLC Tristan Capital Partners
DRA Advisors LLC Orion Capital Managers LLP
GEM Realty Capital TA Associates Realty
PRIVATE DEBT
Arbour Lane Capital Management Eagle Point Shoreline Capital
Blackstone Group Medley Capital LLC White Oak Global Advisors
Crestline Investors Inc Octagon Credit Investors
Cross Ocean Partners Park Square Capital, LLP
PRIVATE REAL ASSETS
Brookfield Asset Management Global Infrastructure Partners Lime Rock Partners
EMERGING MARKET BONDS
Blue Bay Asset Management Wellington Management
HIGH YIELD BONDS
BNY Mellon Asset Management
LONG-TERM GOVERNMENT BONDS
BlackRock Financial Management Inc.
INVESTMENT GRADE BONDS
Northern Trust Asset Management Voya Investment Management
MARKET NEUTRAL STRATEGIES
D.E. Shaw & Co., LP JD Capital Pine River Captial Management LP
Hudson Bay Capital Managmenet Kepos Capital LP
IMMUNIZED CASH FLOWS
Insight Investment
TREASURY INFLATION-PROTECTED SECURITIES (TIPS)
Northern Trust Asset Management
CORE REAL ESTATE
BlackRock Financial Management Inc. Clarion Partners
COMMODITIES
Credit Suisse Asset Management
CONSULTANTS
Albourne America LLC(Absolute Return)
Meketa Investment Group (General Consultant)
Verus Advisory Inc. (Risk Advisory Services)
CUSTODIAN
State Street Bank & Trust Company
PORTFOLIO OVERLAY SERVICES
Russell Investments
123 Comprehensive Annual Financial Report 2019-2020 San José Police & Fire Retirement Plan

Schedule of Investment Results for Pension Trust Including 401(h)
NET PERFORMANCE SUMMARY BY ASSET CLASS
For Period Ended June 30, 2020
One Year Three Years Five Years Ten YearsTotal Fund with Overlay (net of manager fees) 3.1% 4.7% 4.6% 6.2%
Policy Benchmark 2.9% 5.0% 5.1% 6.7%
InvMetrics Public DB > $1B Net Median 1.3% 5.0% 5.4% 7.8%
Total Public Equity 1.2% 5.2% 6.0% 8.9%Public Equity Benchmark 0.3% 5.4% 6.0% 9.3%.
Total Private Equity 8.3% 12.2% 10.9% 11.7%San José Custom Total Private Equity Benchmark (1.8)% 8.6% 8.9% 11.5%
Total Private Real Assets (5.6)% 2.6% N/A N/A
Total Private Debt (4.4)% (0.8)% N/A N/AS&P Global Leveraged Loan + 2% (0.5)% 3.6% N/A N/A
Total Immunized Cash Flows 4.6% N/A N/A N/AImmunized Cash Flow Benchmark 4.6% N/A N/A N/A
Total Core Real Estate 3.6% 6.0% 7.5% N/ANCREIF ODCE Equal Weighted (Net) 1.7% 5.1% 6.7% N/A
Total Emerging Market Bonds 8.7% 6.2% 5.7% N/AeV All Emg Mkts Fixed Inc Net Median (1.2)% 2.4% 4.3% 5.1%
Total Growth Real Estate 0.1% 7.6% 7.2% N/A
NCREIF ODCE Equal Weighted 2.6% 6.0% 7.6% N/A
Total Market Neutral Strategies 0.0% 3.8% 2.5% N/AMarket Neutral Strategies 1.6% 1.5% 0.8% N/A
Total Long Term Govenment Bonds N/A N/A N/A N/ALong Term Government Bonds Benchmark N/A N/A N/A N/A
Treasury Inflation-Protected Securities (TIPS) 3.5% N/A N/A N/ABBgBarc US Treasury TIPS 0-5 Yr TR 3.4% N/A N/A N/A
Total Cash and Cash Equivalents 1.9% 1.8% 1.2% 0.7%ICE BofA 91 Days T-Bills TR 1.6% 1.8% 1.2% 0.1%
Total High Yield Bonds N/A N/A N/A N/ABBgBarc US Corporate High Yield TR N/A N/A N/A N/A
Basis of Calculation : Time-Weighted Rate of Retun
Source: Meketa Investment Group's Fund Evaluation Report dated June 30, 2020
Comprehensive Annual Financial Report 2019-2020 San José Police & Fire Retirement Plan 124

Schedule of Investment Results of Healthcare Trust - 115 Subtrusts
NET PERFORMANCE SUMMARY BY ASSET CLASS
For Period Ended June 30, 2020
One Year Three Years Five Years Ten YearsTotal Fund (net of manager fees) 2.2% 3.5% 3.6% N/A
Policy Benchmark 1.6% 4.5% 4.8% N/A
Total Public Equity 1.1% 6.1% 6.6% N/APublic Equity Benchmark 1.2% 5.8% 6.3% N/A
Total Short-Term Investment Grade Bonds 1.7% N/A N/A N/AICE BofA 91 Days T-Bills TR 1.6% N/A N/A N/A
Total Core Real Estate 2.1% 5.0% 7.0% N/ACore Real Estate Benchmark 1.7% 5.4% 7.3% N/A
Total Commodities (7.6)% (2.0)% (3.3)% N/ABloomberg Commodity Index TR USD (17.4)% (6.1)% (7.7)% N/A
Total Cash and Cash Equivalents 1.5% 1.5% 1.0% N/AICE BofA 91 Days T-Bills TR 1.6% 1.8% 1.2% N/A
Basis of Calculation: Time-Weighted Rate of Return
Source: Meketa Investment Group's Fund Evaluation Report dated June 30, 2020
125 Comprehensive Annual Financial Report 2019-2020 San José Police & Fire Retirement Plan

Pension Investment ReviewINCLUDES THE 401(H) INVESTMENTS
TARGET ASSET ALLOCATION As of June 30, 2020
ACTUAL ASSET ALLOCATION As of June 30, 2020
Non-GAAP Basis
Asset Class $ MillionsPublic equityPrivate equityInvestment grade bondsPrivate debtImmunized cash flowsCore real estate
$1,725.6359.5335.0187.0163.5145.0
Cash and overlayGrowth real estateMarket neutral strategiesEmerging market bondsLong-term government bonds
136.0128.2118.0117.0111.0
Treasury inflation-protected securities (TIPS) 75.0High yield bonds 74.1Private real assets 34.0
TOTAL $3,708.9Comprehensive Annual Financial Report 2019-2020 San José Police & Fire Retirement Plan 126

Pension Investment Review (continued)
INCLUDES THE 401(H) INVESTMENTS (continued)
HISTORICAL ASSET ALLOCATION (Actual)As of June 30,2011 - June 30,2020
FAIR VALUE GROWTH OF PLAN ASSETSFor Ten Years Ended June 30, 2020
(Dollars in Millions)
127 Comprehensive Annual Financial Report 2019-2020 San José Police & Fire Retirement Plan

Pension Investment Review (continued)
INCLUDES THE 401(H) INVESTMENTS (continued)
HISTORY OF GROSS PERFORMANCEFor Fiscal Years 2011 - 2020
(Based on Fair Value)
HISTORY OF NET PERFORMANCEFor Fiscal Years 2011 - 2020
(Based on Fair Value)
Comprehensive Annual Financial Report 2019-2020 San José Police & Fire Retirement Plan 128

Healthcare Investment Review
115 SUBTRUSTSTARGET ASSET ALLOCATION
As of June 30, 2020
ACTUAL ASSET ALLOCATION As of June 30, 2020
Non-GAAP Basis
Asset Class $ Millions
Public equity $100.2
Short-term investment grade bonds 51.5
Core real estate 13.0
Commodities 9.1
Cash and cash equivalents 4.1
TOTAL $177.9
129 Comprehensive Annual Financial Report 2019-2020 San José Police & Fire Retirement Plan

Healthcare Investment Review (continued)
115 SUBTRUSTS (continued)
HISTORICAL ASSET ALLOCATION (Actual)As of June 30, 2013 - June 30, 2020
FAIR VALUE GROWTH OF PLAN ASSETS For Seven Years Ended June 30, 2020
(Dollars in Millions)
Comprehensive Annual Financial Report 2019-2020 San José Police & Fire Retirement Plan 130

Healthcare Investment Review (continued)
115 SUBTRUSTS (continued)
HISTORY OF GROSS PERFORMANCEFor Fiscal Years 2013 - 2020
(Based on Fair Value)
HISTORY OF NET PERFORMANCEFor Fiscal Years 2013 - 2020
(Based on Fair Value)
131 Comprehensive Annual Financial Report 2019-2020 San José Police & Fire Retirement Plan

List of Largest Asset Held
LARGEST DISCLOSABLE STOCK HOLDINGS (By Fair Value) For Pension
As of June 30, 2020
Description County Shares Fair Value ($US)SAMSUNG ELECTRONICS CO LTD Korea, Republic of 273,450 $ 12,003,292
FACEBOOK INC CLASS A United States 44,410 $ 10,084,179
UBS GROUP AG REG Switzerland 847,047 $ 9,748,348
COGNIZANT TECH SOLUTIONS A United States 164,827 $ 9,365,470
FEDEX CORP United States 66,699 $ 9,352,534
CIE FINANCIERE RICHEMONT REG Switzerland 141,635 $ 9,034,267
ORACLE CORP United States 163,260 $ 9,023,380
BANK OF NEW YORK MELLON CORP United States 231,770 $ 8,957,911
ALPHABET INC CL A United States 6,173 $ 8,753,623
NXP SEMICONDUCTORS NV Netherlands 75,745 $ 8,637,960
A complete list of portfolio holdings is available upon request.
LARGEST DISCLOSABLE BOND HOLDINGS (By Fair Value) For Pension
As of June 30, 2019
Security Name Country Maturity Date Interest Rate Par ValueFair Value
($US)FEDERAL HOME LOAN BANK United States 9/8/2023 3.375% $ 6,835,000 $ 7,502,711
US TREASURY N/B United States 8/15/2023 2.500% $ 6,879,000 $ 7,375,320
US TREASURY N/B United States 6/30/2023 1.375% $ 6,892,000 $ 7,138,596
US TRESURY N/B United States 9/30/2023 1.375% $ 6,680,900 $ 6,938,983
US TREASURY N/B United States 3/31/2023 1.500% $ 6,625,000 $ 6,865,951
US TREASURY N/B United States 9/30/2022 1.875% $ 6,589,000 $ 6,841,227
US TREASURY N/B United States 1/31/2023 1.750% $ 6,563,000 $ 6,828,342
FEDERAL HOME LOAN BANK United States 3/10/2023 2.125% $ 6,485,000 $ 6,799,263
STRIPS United States 5/15/2023 0.000% $ 6,681,000 $ 6,641,716
STRIPS United States 11/15/2022 0.000% $ 6,667,000 $ 6,637,265
A complete list of portfolio holdings is available upon request.
Comprehensive Annual Financial Report 2019-2020 San José Police & Fire Retirement Plan 132

Schedule of Investment FeesFor Fiscal Year Ended June 30, 2020
Includes the 401 (h) and 115 Subtrusts
Assets UnderManagement at
Fair Value1 Fees Basis PointsInvestment Managers' Fees
Public equity $ 1,825,818 $ 3,251,035 18
Private equity 359,550 1,942,699 54
Investment grade bonds 334,617 112,562 3
Growth real estate 128,222 2,763,498 216
Private debt 187,315 2,104,933 112
Immunized cash flows 163,697 87,559 5
Core real estate 157,769 1,161,454 74
Market neutral strategies 118,239 2,108,335 178
Treasury inflation-protected securities 74,784 36,556 5
High yield bonds / Emerging market bonds 191,275 68,876 4
Long-term government bonds 111,451 - -
Short-term investment bonds 51,533 53,801 10
Private real estate 33,804 948,208 281
Sovereign bonds ex US - 39,584 -
Commodities 9,068 243,411 268
Cash and cash equilavents 139,672 - -
TOTAL INVESTMENT MANAGERS' FEES $ 3,886,814 $ 14,922,511 38
1 Includes cash in managers' accounts, non-GAAP Basis
FeesOther Investment Fees
Investment consultants $ 580,000
Custodian bank 307,702
Investment legal fees 136,954
Other investment fees 16,630
TOTAL OTHER INVESTMENT FEES $ 1,041,286
133 Comprehensive Annual Financial Report 2019-2020 San José Police & Fire Retirement Plan

Schedule of CommissionsFor the Fiscal Year Ended June 30, 2020
Brokerage Firm Shares / Par Base
Commissions Base CommCost / Share
AAPEX CLEARING CORPORATION 15,689 222.07 0.0142
BBANK J. VONTOBEL UND CO. AG 1,800 269.62 0.1498
BANK OF AMERICA CORPORATION 1,548 80.73 0.0522
BANK OF AMERICA MERRILL LYNCHSECUR INC 48,485 683.60 0.0141
BARCLAYS CAPITAL 416,755 4,132.43 0.0099
BARCLAYS CAPITAL INC 26,397 687.80 0.0261
BMO CAPITAL MARKETS CORP 20,174 553.32 0.0274
BNP PARIBAS SECURITIES SERVICES 632,127 1,599.76 0.0025
BNP PARIBAS SECURITIES SERVICESAUSTR BR 349,674 1,646.12 0.0047
BNP PARIBAS SECURITIES SERVICES SA 85,200 1,309.64 0.0154
B OF A SECURITIES, INC 834,702 100,142.65 0.1200
BTIG LLC 10,700 214.00 0.0200
CCACEIS BANK DEUTSCHLAND GMBH 7,387 538.33 0.0729
CANACCORD GENUITY CORP. 106,900 1,635.89 0.0153
CANTOR CLEARING SERVICES 200 4.00 0.0200
CANTOR FITZGERALD EUROPE 5,945 48.69 0.0082
CARNEGIE A S 31,800 424.18 0.0133
CARNEGIE INVESTMENT BANK AB 121,900 5,765.52 0.0473
CARNEGIE SECURITIES FINLAND 21,900 777.36 0.0355
CHINA INTERNATIONAL CAPITAL CO 272,500 1,951.91 0.0072
CICC US SECURITIES INC 4,382 175.28 0.0400
CITIBANK N.A. 23,434 512.24 0.0219
CITIGROUP GLOBAL MARKET INC. 149,909 323.28 0.0022
CITIGROUP GLOBAL MARKETS LIMITED 117,281 731.94 0.0062
CLSA SECURITIES KOREA LTD 2,878 356.59 0.1239
CLSA SINGAPORE PRE LTD. 33,200 1,843.41 0.0555
COWEN AND COMPANY, LLC 56,335 1,217.76 0.0216
CRAIG - HALLUM 3,100 62.00 0.0200
CREDIT INDUSTRIEL ET COMMERCIA 33,600 705.06 0.0210
CREDIT LYONNAIS SECURITIES (USA) INC 27,368 754.36 0.0276
CREDIT LYONNAIS SECURITIES (ASIA) INC 165,500 1,013.91 0.0061
CREDIT MUTUEL-CIC BANQUES 43,600 1,796.61 0.0412
CREDIT SUISSE SECURITIES (EUROPE)LTD 196,556 1,858.51 0.0095
CREDIT SUISSE SECURITIES (USA) LLC 1,335,420 9,410.11 0.0070
DDAIWA SECURITIES AMERICA INC 422,900 22,073.60 0.0522
Comprehensive Annual Financial Report 2019-2020 San José Police & Fire Retirement Plan 134

Schedule of Commissions (continued)
For the Fiscal Year Ended June 30, 2020
Brokerage Firm Shares / Par
BaseCommissions
Base CommCost / Share
DAIWA SECURITIES COMPANY LTD 13,839 764.79 0.0553
DANSKE BANK A.S. 60,300 2,019.68 0.0335
DNB MARKETS CUSTODY, A BUSINESSUNIT OF 13,970 100.31 0.0072
EELECTRONIC BROKERAFE SYSTEMS LLC 26,819 214.55 0.0080
EXANE S.A. 13,220 707.04 0.0535
GGOLDMAN SACHS & CO LLC 1,791,305 22,443.14 0.0125
GOLDMAN SACHS INTERNATIONAL 27,915 377.57 0.0135
HHAITONG INTL SECS COMPANY LTD 21,800 445.66 0.0204
HSBC BANK PLC 371,641 1,978.13 0.0053
IICHIYOSHI SECURITIES CO., LTD. 69,000 4,709.46 0.0683
INDUSTRIAL AND COMMERICAL BANK 200 4.00 0.0200
INSTINET 1,883,229 19,296.29 0.0102
INSTINET PACIFIC LIMITED 451,600 1,828.75 0.0040
INSTINET U.K. LTD 71,100 3,414.02 0.0480
INVESTEC BANK PLC 3,870 115.66 0.0299
JJ.P. MORGAN SECURITIES INC 30,669 625.07 0.0204
J.P. MORGAN CLEARING CORP. 148,276 1,186.20 0.0080
J.P. MORGAN SECURITIES LIMITED 6,975 272.22 0.0390
J.P. MORGAN SECURITIES LLC 7,112 56.90 0.0080
J.P. MORGAN SECURITIES PLC 1,570,514 22,169.09 0.0141
J.P. MORGAN SECURITIES (FAR EAST) LTDSEOUL 3,651 105.55 0.0289
JPMORGAN SECURITIES (ASIA PACIFIC) LTD 317,200 1,380.63 0.0044
JEFFERIES & COMPANY INC. 349,215 6,402.40 0.0183
JEFFERIES HONG KONG LIMITED 143,900 299.18 0.0021
JEFFERIES INTERNATIONAL LTD 337,466 950.09 0.0028
JOH BERENBERG GOSSLER AND CO KG 162,714 5,499.21 0.0338
JONES TRADING INSTITUTIONAL SERVICESLLC 7,100 213.00 0.0300
JONES TRADING INSTITUTIONAL SERVICESLLC 37,700 564.71 0.0150
KKEPLER EQUITIES PARIS 64,879 3,098.72 0.0478
KOREA INVESTMENT AND SECURITIES COLTD 2,537 314.82 0.1241
135 Comprehensive Annual Financial Report 2019-2020 San José Police & Fire Retirement Plan

Schedule of Commissions (continued)
For the Fiscal Year Ended June 30, 2020
Brokerage Firm Shares / Par
BaseCommissions
Base CommCost / Share
LLIQUIDNET CANADA INC 749,187 7,201.39 0.0096
LIQUIDNET EUROPE LIMITED 1,667,187 7,701.33 0.0046
LIQUIDNET INC 185,000 2,419.00 0.0131
MMACQUARIE BANK LIMITED 957,860 5,679.14 0.0059
MACQUARIE CAPITAL (USA) INC 2,224 88.96 0.0400
MAINFIRST BANK DE 1,650 213.41 0.1293
MERRILL LYNCH INTERNATIONAL 7,105,789 24,528.59 0.0035
MITSUBSHI UFJ SECURITIES (USA) 55,400 2,717.39 0.0491
MIZUHO SECURITIES USA INC 79,200 4,029.65 0.0509
MIZUHO SECURITIES USA INC 4,572 182.88 0.0400
MORGAN STANLEY AND COINTERNATIONAL 1,911 25.71 0.0135
MORGAN STANLEY CO INCORPORATED 1,945,457 12,768.62 0.0066
NNATIONAL FINANCIAL SERVICESCORPORATION 35,862 206.39 0.0058
NBC CLEARING SERVICES INCORPORATED 6,100 91.24 0.0150
NEEDHAM & COMPANY LLC 19,900 398.00 0.0200
NOMURA FINANCIAL INVESTMENT KOREACO LTD 31,436 2,456.92 0.0782
NUMIS SECURITIES INC 541,000 6,282.58 0.0116
OODDO ET CIE 64,510 823.65 0.0128
PPAREL 39,966 1,887.03 0.0472
PEEL HUNT LLP 219,200 2,148.76 0.0098
PERSHING SECURITIES LIMITED 882,134 11,349.64 0.0129
PIPER JAFFRAY & CO. 500 10.00 0.0200
PIPER JAFFRAY & HOPWOOD 955 19.10 0.0200
RRBC DOMINION SECURITIES INC 5,890 189.20 0.0321
REDBURN (EUROPE) LIMITED 96,288 1,451.22 0.0151
ROBERT W. BAIRD CO. INCORPORATED 26,005 641.96 0.0247
ROYAL BANK OF CANADA EUROPE LTD 1,349 128.59 0.0953
SSAMSUNG SECURITIES CO LTD 1,068 207.10 0.1939
SANFORD C BERNSTEIN AND CO. LLC 32,618 757.52 0.0232
SANFORD C BERNSTEIN LTD 7,754 725.46 0.0936
SANTANDER SECURITIES SERVICES SA 3,479 335.33 0.0964
Comprehensive Annual Financial Report 2019-2020 San José Police & Fire Retirement Plan 136

Schedule of Commissions (continued)
For the Fiscal Year Ended June 30, 2020
Brokerage Firm Shares / Par
BaseCommissions
Base CommCost / Share
SCOTIA CAPITAL (USA) INC 4,365 87.30 0.0200
SCOTIA CAPITAL INC. 8,729 67.26 0.0077
SKANDINAVISKA ENSKILDA BANKEN 71,800 2,075.49 0.0289
SKANDINAVISKA ENSKILDA BANKENLONDON 23,500 660.80 0.0281
SMBC SECURITIES INC 114,400 5,900.87 0.0516
SOCIETE GENERALE 16,337 276.51 0.0169
SOCIETE GENERALE LONDON BRANCH 2,573,452 20,849.85 0.0081
STIFEL, NICOLAUS AND COMPANY, INC 34,403 739.86 0.0215
STIFEL, NICOLAUS AND COMPANY,INCORPORATED 1,500 16.20 0.0108
SUNTRUST CAPITAL MARKETS, INC. 11,200 224.00 0.0200
SVENSKA HANDELSBANKEN 149,142 2,481.79 0.0166
TTHE HONGKONG AND SHANGHAI BANK 3,101 49.41 0.0159
TORONTO DOMINION SECURITIES INC 30,900 463.34 0.0150
U
UBS AG 32,473 1,298.45 0.0400
UBS AG LONDON BRANCH 7,162 637.46 0.0890
UBS SECURITIES PTE.LTD., SEOUL 31,500 2,998.25 0.0952
WWELLS FARGO BANK N.A. 138,634 3,138.76 0.0226
WILLIAM BLAIR & T COMPANY LLC 5,551 222.04 0.0400
WINTERFLOOD SECURITIES LTD 21,065 42.47 0.0020
TOTAL 31,687,627 $ 406,974.99 $ 0.0128
137 Comprehensive Annual Financial Report 2019-2020 San José Police & Fire Retirement Plan

Investment Summary
PENSION - INCLUDES THE 401(H) INVESTMENTS As of June 30, 2020 (Dollars in Thousands)
Type of Investments Fair Value % of PortfolioPublic equity $ 1,725,610 46.5%
Private equity 359,550 9.6
Investment grade bonds 334,615 9.0
Private debt 187,314 5.1
Immunized cash flows 163,700 4.4
Core real estate 144,750 3.9
Cash and cash equivalents 135,530 3.7
Growth real estate 128,221 3.5
Market neutral strategies 118,240 3.2
Emerging market bonds 117,060 3.2
Long-tern government bonds 111,450 3.0
Treasury inflation-protected securities (TIPS) 74,783 2.0
High yield bonds 74,217 2.0
Private real assets 33,803 0.9
TOTAL FAIR VALUE $ 3,708,843 100.0%
The amounts presented above may vary from the amounts presented in the financial statements, due to the investmentsummary presenting amounts at the manager level and the financial statements presenting amounts at the security level.
Includes cash to support synthetic exposure.
HEALTHCARE - 115 SUBTRUSTSAs of June 30, 2020 (Dollars in Thousands)
Type of Investments Fair Value % of PortfolioPublic equity $ 100,208 56.3%
Short-term investment grade bonds 51,532 29.0
Core real estate 13,023 7.3
Commodities 9,067 5.1
Cash and cash equivalents 4,141 2.3
TOTAL FAIR VALUE $ 177,971 100.0%
The amounts presented above may vary from the amounts presented in the financial statements, due to the investmentsummary presenting amounts at the manager level and the financial statements presenting amounts at the security level.
Comprehensive Annual Financial Report 2019-2020 San José Police & Fire Retirement Plan 138

This page intentionally left blank

City�of�San�José�Police�and�Fire�Department�Retirement�Plan
Comprehensive�Annual�Financial�Report�for�the�Fiscal�Years�ended�June�30,�2020�and�June�30,�2019
Pension�Trust�and�Postemployment�Healthcare�Trust��
Funds�of�the�City�of�San�José,�California
Actuarial�Section

Actuary's Certification Letter - Pension
September 9, 2020
Board of Administration
City of San José Police and Fire Department Retirement Plan
1737 North 1st
Street, Suite 580
San José, CA 95112
Dear Members of the Board:
The purpose of this letter is to provide the certification for the Actuarial Section of the
Comprehensive Annual Financial Report (CAFR) for the City of San José Police and Fire
Department Retirement Plan (Plan) with respect to pension benefits.
Actuarial Valuation Used for Funding Purposes
Actuarial valuations are performed annually. The most recent actuarial valuation was performed
as of June 30, 2019. Please refer to that report for additional information related to the funding of
the Plan.
We prepared the following schedules for inclusion in the Actuarial Section of the CAFR based
on the June 30, 2019 actuarial valuation. All historical information prior to the June 30, 2011
actuarial valuation shown in these schedules is based on information reported by the prior
actuary, The Segal Group, Inc.
� Summary of Actuarial Assumptions and Methods
� Schedule of Active Member Valuation Data
� Schedule of Retirees and Beneficiaries Added to and Removed from Rolls
� Analysis of Financial Experience
� Schedule of Funded Liabilities by Type
� Schedule of Funding Progress
� Summary of Plan Provisions
The funding ratios shown in the schedule of funded liabilities by type and the schedule of
funding progress exhibits are ratios compared to the funding target and are for the purpose of
evaluating funding progress in a budgeting context. These ratios are not appropriate for
measuring or assessing the sufficiency of Plan assets to cover the estimated cost of settling the
Plan8s benefit obligations.
The Board of Administration is responsible for establishing and maintaining the contribution
policy for the Plan. The actuarial methods and assumptions used in the actuarial valuation are
adopted by the Board of Administration with advice from the actuary. In our opinion, the
assumptions and methods used in the actuarial valuation for funding purposes are consistent with
applicable Actuarial Standards of Practice. The actuarial cost method and the actuarial
assumptions used for funding purposes are the same as those used for financial reporting
purposes.
139 Comprehensive Annual Financial Report 2019-2020 San José Police & Fire Retirement Plan

Actuary's Certification Letter - Pension (continued)
Board of Administration
September 9, 2020
Page 2
Actuarial Valuation Used for Financial Reporting Purposes
For financial reporting purposes, the Total Pension Liability is based on the June 30, 2019
actuarial valuation updated to the measurement date of June 30, 2020. The Board changed some
of the demographic assumptions used in the June 30, 2019 valuation based on an experience
study. These changes are reflected effective July 1, 2019 for financial reporting purposes. There
were no significant events between the valuation date and the measurement date, so the update
procedures only include the addition of service cost and interest cost offset by actual benefit
payments.
Please refer to our GASB 67/68 report as of June 30, 2020 for additional information related to
the financial reporting of the Plan. We prepared the following schedules for inclusion in the
Financial Section of the CAFR based on the June 30, 2020, GASB 67/68 report.
� Change in Net Pension Liability
� Sensitivity of Net Pension Liability to Changes in Discount Rate
� Schedule of Changes in Net Pension Liability and Related Ratios
� Notes to the Schedule of Employer Contributions
Reliance on the Information Provided by the Plan and Compliance with ASOPs and GAAP
In preparing our valuations and the schedules for the CAFR, we relied on information (some oral
and some written) supplied by the City of San José Office of Retirement Services. This
information includes, but is not limited to, the plan provisions, employee data, and financial
information. We performed an informal examination of the obvious characteristics of the data for
reasonableness and consistency in accordance with Actuarial Standard of Practice No. 23.
Future actuarial measurements for funding and financial reporting purposes may differ
significantly from the current measurements presented in this CAFR due to such factors as the
following: plan experience differing from that anticipated by the assumptions; changes in
assumptions; and, changes in plan provisions or applicable law.
This letter and the schedules named above have been prepared in accordance with generally
recognized and accepted actuarial principles and practices and our understanding of the Code of
Professional Conduct and applicable Actuarial Standards of Practice set out by the Actuarial
Standards Board as well as applicable laws and regulations. The schedules provided for financial
reporting purposes have been prepared in accordance with our understanding of generally
accepted accounting principles as promulgated by the GASB. Furthermore, as credentialed
actuaries, we meet the Qualification Standards of the American Academy of Actuaries to render
the opinion contained in this letter and these exhibits. This letter does not address any contractual
or legal issues. We are not attorneys and our firm does not provide any legal services or advice.
Comprehensive Annual Financial Report 2019-2020 San José Police & Fire Retirement Plan 140

Actuary's Certification Letter - Pension (continued)
Board of Administration
September 9, 2020
Page 3
This letter and the schedules named above were prepared for the Plan for the purposes described
herein. Other users of this information are not intended users as defined in the Actuarial
Standards of Practice, and Cheiron assumes no duty or liability to any other user.
Sincerely,
Cheiron
William R. Hallmark, ASA, EA, FCA, MAAA
Consulting Actuary
Anne D. Harper, FSA, EA, MAAA
Principal Consulting Actuary
Timothy S. Doyle, ASA, EA, MAAA
Associate Actuary
141 Comprehensive Annual Financial Report 2019-2020 San José Police & Fire Retirement Plan

Actuarial Assumptions and Methods
DEFINED BENEFIT PENSION
Actuarial Assumptions
The discount rate used in this report was adopted by the Board of Administration with our input at theNovember 1, 2018 Board meeting. All other assumptions were adopted at the November 7, 2019 Boardmeeting based on recommendations from our experience study covering plan experience through June30, 2019. Please refer to the experience study for the rationale for each of the assumptions.
1) Discount Rate
6.75% net of investment expenses. The long-term expected return on assets based on Meketa's capitalmarket assumptions for a 10-year time horizon is 7.2%. The Board applied a margin for adversedeviation to improve the probability of achieving the discount rate.
2) Wage Inflation 3.25% per annum (0.75% real wage growth).
3) Price Inflation 2.50% per annum.
4) Merit Salary Increase Rate
The following merit component is added to wage inflation, based on an individual member's years ofservice:
Table B-1 Salary Merit IncreasesYears ofService
Merit /Longevity
Years ofService
Merit /Longevity
Years ofService
Merit /Longevity
0 6.50% 4 4.50% 8 1.25%
1 6.25% 5 3.75% 9 1.00%
2 5.75% 6 2.75% 10 0.75%
3 5.25% 7 1.75% 11 + 0.50%
5) Family Composition
Percentage married is shown in the following Table B-2. Women are assumed to be three years youngerthan men.
Table B-2 Percentage MarriedMales Females
Percentage 85% 85%
6) Rates of Termination
Rates of termination are shown in the following Table B-3. 75% of terminating employees are assumedto subsequently work for a reciprocal employer and receive 3.25% pay increases per year.
Table B-3 Rates of TerminationService Police Fire Service Police Fire Service Police Fire
0 13.75% 8.50% 7 5.50% 0.80% 14 2.75% 0.50%
1 11.75% 4.00% 8 5.00% 0.70% 15 2.25% 0.50%
2 10.00% 2.75% 9 4.75% 0.60% 16 1.75% 0.50%
3 8.50% 1.75% 10 4.50% 0.50% 17 1.50% 0.50%
4 7.50% 1.25% 11 4.25% 0.50% 18 1.25% 0.50%
5 6.75% 1.00% 12 3.75% 0.50% 19+ 1.00% 0.50%
6 6.00% 0.90% 13 3.25% 0.50%
Termination rates do not apply once a member is eligible for retirement.
Comprehensive Annual Financial Report 2019-2020 San José Police & Fire Retirement Plan 142

Actuarial Assumptions and Methods (continued)
DEFINED BENEFIT PENSION (continued)
7) Rates of Disability
For Police, disability rates are equal to the CalPERS police industrial and non-industrial rates for publicagencies multiplied by 90% for ages under 50 and 140% for ages 50 and older. For Fire, disability ratesare equal to the CalPERS fire industrial and non-industrial rates for public agencies multiplied by 90%for ages under 50 and 180% for ages 50 and older. Sample disability rates of active participants areprovided in Table B-4. 100% of disabilities are assumed to be duty related.
Table B-4 Rates of Disability at Selected AgesAge 25 30 35 40 45 50 55 60 65Police 0.16% 0.45% 0.74% 1.03% 1.32% 2.70% 6.88% 8.71% 10.47%
Fire 0.03% 0.08% 0.15% 0.28% 0.50% 5.08% 7.54% 10.77% 14.84%
8) Rates of Mortality
Mortality rates for actives, retirees, beneficiaries, terminated vested, and reciprocals are based on thesex-distinct employee and annuitant mortality tables shown below. Future mortality improvements arereflected by applying the SOA MP-2019 projection scale on a generational basis from the base year of2010 (2009 for beneficiary tables). It is assumed that 50% of active deaths are service related.
Table B-5 Base Mortality Table
Category Male FemaleHealthy Retirees 1.002 times the 2010 Public Safety
Above Median Income Mortality Table(Pub(s)-2010(A)) for healthy retirees
1.002 times the 2010 Public SafetyAbove Median Income Mortality Table(Pub(s)-2010(A)) for healthy retirees
Disabled Retiree 0.915 times the Public Safety MortalityTable (PubS-2010) for disabled retirees
0.915 times the Public Safety MortalityTable (PubS-2010) for disabled retirees
Beneficiaries 0.948 times the CALPERS 2009Healthy Annuitant Mortality Table
1.048 times the CALPERS 2009Healthy Annuitant Mortality Table
HealthyNon-Annuitant
0.979 times the 2010 Public SafetyAbove Median Income Mortality Table(Pub(s)-2010(A)) for healthy employees
0.979 times the 2010 Public SafetyAbove Median Income Mortality Table(Pub(s)-2010(A)) for healthy employees
9) Rates of Retirement
Rates of retirement are based on age and service according to the following Table B-6, B-7, and B-8.Tier 1 rates only apply when the member is eligible for unreduced benefits.Tier 1 vested terminatedmembers are assumed to retire at age 50 if they have 25 or more years of service or at age 55 if theyhave less than 25 years of service. Tier 2 vested terminated members are assumed to retire at age 60.
Table B-6 Tier 1 Rates of Retirement by Age and ServicePolice Fire
Age <30 Years 30+ Years <30 Years 30+ Years50 55.0% 100.0% 35.0% 100.0%
51 45.0% 100.0% 35.0% 100.0%
52 40.0% 100.0% 35.0% 100.0%
53 30.0% 100.0% 35.0% 100.0%
54 30.0% 100.0% 35.0% 100.0%
55 30.0% 100.0% 30.0% 100.0%
56 30.0% 100.0% 25.0% 100.0%
57 30.0% 100.0% 20.0% 100.0%
58 - 61 50.0% 100.0% 27.5% 100.0%
62+ 100.0% 100.0% 100.0% 100.0%
143 Comprehensive Annual Financial Report 2019-2020 San José Police & Fire Retirement Plan

Actuarial Assumptions and Methods (continued)
DEFINED BENEFIT PENSION (continued)
Table B-7 Police Tier 2 Rates of Retirement by Age and ServiceAge 5-19 Years 20 - 24 Years 25 - 29 Years 30+ Years
50 - 56 2.0% 2.0% 2.0% 5.0%
57 - 59 7.5% 10.0% 20.0% 100.0%
60 - 61 10.0% 20.0% 35.0% 100.0%
62 - 64 25.0% 50.0% 75.0% 100.0%
65+ 100.0% 100.0% 100.0% 100.0%
Table B-8 Fire Tier 2 Rates of Retirement by Age and ServiceAge 5-19 Years 20 - 24 Years 25 - 29 Years 30+ Years
50 - 56 1.0% 1.0% 1.0% 2.5%
57 - 59 5.0% 7.5% 15.0% 100.0%
60 - 61 7.5% 15.0% 25.0% 100.0%
62 - 64 20.0% 35.0% 50.0% 100.0%
65+ 100.0% 100.0% 100.0% 100.0%
10) Administrative Expenses
For FYE 2020, administrative expenses are assumed to equal $1,275 per member and are assumed toincrease at the wage inflation assumption of 3.25% per annum. Historically, the administrative expenseswere assumed to reduce the investment return assumption by 10 basis points which resulted in a highernormal cost. To maintain the same historic division of Tier 1 member and City contributions foradministrative expenses for this valuation, members were allocated a portion of the administrativeexpenses equal to 3/11ths of the difference in normal cost that a 10 basis point reduction in theinvestment return assumption would cause. Tier 2 members pay 50 percent of administrative expenses.
11) Changes Since Last Valuation
New demographic assumptions were adopted by the Board at the meeting on November 7, 2019. A fulldetail of the changes can be found in the report on the experience study.
Contribution Allocation Procedure
The contribution allocation procedure primarily consists of an actuarial cost method, an asset smoothingmethod, and an amortization method as described below. All components of the contribution allocationprocedure were established prior to the June 30, 2011 actuarial valuation except as specifically notedbelow.
1) Actuarial Cost Method
The Entry Age actuarial cost method was used for active employees, whereby the normal cost iscomputed as the level annual percentage of pay required to fund the retirement benefits between eachmember’s date of hire and assumed retirement. The actuarial liability is the difference between thepresent value of future benefits and the present value of future normal cost. The unfunded actuarialliability is the difference between the actuarial liability and the actuarial value of assets.
2) Asset Valuation Method
For the purposes of determining the employer’s contribution, we use an actuarial value of assets. Theasset smoothing method dampens the volatility in asset values that could occur because of thefluctuations in market conditions. Use of an asset smoothing method is consistent with the long-termnature of the actuarial valuation process. Assets are assumed to be used exclusively for the provision ofretirement benefits and expenses.
Comprehensive Annual Financial Report 2019-2020 San José Police & Fire Retirement Plan 144

Actuarial Assumptions and Methods (continued)
DEFINED BENEFIT PENSION (continued)
The actuarial value of assets is calculated by recognizing the deviation of actual investment returnscompared to the expected return (6.875% for fiscal year end 2018 and 2017, 7.00% for fiscal year end2016 and 2015, and 7.125% for fiscal year end 2014) over a five-year period. The dollar amount of theexpected return on the fair value of assets is determined using the actual contributions and benefitpayments during the year. Any difference between this amount and the actual net investment earnings isconsidered a gain or loss.
Finally, the actuarial value of assets is restricted to a corridor between 80 percent and 120 percent of thefair value of assets.
3) Amortization Method
Actuarial gains and losses and plan changes are amortized over a 15-year period (16 years for gainsand losses prior to June 30, 2016) beginning with the valuation date in which they first arise. Changes inmethods and assumptions are amortized over a 20-year period (16 years for changes prior to June 30,2011) beginning with the valuation date on which they are effective. Amortization payments areassumed to increase 2.50% each year. In this section, some prior amortization periods were adjusted tosmooth the pattern of future contributions.
SCHEDULE OF ACTIVE MEMBER DATA
Valuation Year Active Count Annual Payroll Monthly Average PayPercentage Change
in Average Pay2019 1,701 $ 235,818,000 $ 11,553 3.96%
2018 1,638 218,429,000 11,113 1.02%
2017 1,544 203,816,000 11,000 12.69%
2016 1,577 184,733,000 9,762 2.96%
2015 1,654 188,189,000 9,481 5.18%
2014 1,707 184,645,000 9,014 (1.13)%
2013 1,718 187,959,000 9,117 (0.48)%
2012 1,735 190,726,000 9,161 (11.51)%
2011 2,021 251,058,000 10,352 1.39%
2010 2,083 255,223,000 10,211 14.92%
SCHEDULE OF RETIREES AND BENEFICIARIES ADDED TO AND REMOVED FROM ROLLSBeginning of Period Added to Rolls Removed from Rolls End of Period % Increase Average
Period CountAnnual
Allowances CountAnnual
Allowance CountAnnual
Allowances CountAnnual
AllowancesIn Annual
Allowances1Annual
Allowances2018-2019 2,250 $ 211,220 122 $ 17,005 54 $ 3,922 2,318 $ 224,303 6.2% $ 96,766
2017-2018 2,192 200,197 120 15,558 62 4,535 2,250 211,220 5.5% 93,876
2016-2017 2,149 190,897 87 11,816 44 2,516 2,192 200,197 4.9% 91,331
2015-2016 2,108 182,185 72 10,843 31 2,131 2,149 190,897 4.8% 88,831
2014-2015 2,032 170,872 115 13,700 39 2,387 2,108 182,185 6.6% 86,426
2013-2014 1,994 162,716 73 10,142 35 1,986 2,032 170,872 5.0% 84,091
2012-2013 1,942 154,381 91 10,259 39 1,924 1,994 162,716 5.4% 81,603
2011-2012 1,885 144,139 88 11,583 31 1,341 1,942 154,381 7.1% 79,496
2010-2011 1,810 131,014 133 15,384 58 2,259 1,885 144,139 10.0% 76,466
2009-2010 1,700 115,573 152 17,238 42 1,797 1,810 131,014 13.4% 72,383
2007-2009 1,477 90,061 276 27,537 53 2,025 1,700 115,573 28.3% 67,984
2005-2007 1,385 76,071 143 15,913 51 1,923 1,477 90,061 18.4% 60,976
2003-2005 1,271 62,314 161 15,619 47 1,862 1,385 76,071 22.1% 54,925
1Years prior to 2009-2010 are increases over a two-year period, not an annual increase Annual allowances in thousands
145 Comprehensive Annual Financial Report 2019-2020 San José Police & Fire Retirement Plan

Actuarial Assumptions and Methods (continued)
DEFINED BENEFIT PENSION (continued)
In the table below, non-recurring items include changes in assumptions and changes in plan provisions.
ANALYSIS OF FINANCIAL EXPERIENCEGain or (Loss) for Year(s) Ending on Valuation Date Due To:
ActuarialValuation Date
InvestmentIncome
CombinedLiability
ExperienceTotal Financial
ExperienceNon-Recurring
Items Total Experience6/30/2019 $ (116,232)$ (27,406)$ (143,638)$ (80,853)$ (224,491)
6/30/2018 (53,615) 13,448 (40,167) (76,425) (116,592)
6/30/2017 (50,882) (57,971) (108,853) 127,571 18,718
6/30/2016 (106,785) (54,528) (161,313) (72,680) (233,993)
6/30/2015 2,806 7,291 10,097 (90,004) (79,907)
6/30/2014 78,462 (14,678) 63,784 (55,787) 7,997
6/30/2013 (92,499) 11,115 (81,384) (28,233) (109,618)
6/30/2012 (172,759) 39,432 (133,327) (75,220) (208,548)
6/30/2011 (96,473) 278,051 181,578 12,360 193,938
6/30/2010 (149,621) 43,880 (105,741) (104,240) (209,981)
Amounts prior to June 30, 2011 calculated by prior actuary Dollar amounts in thousandsDollar amounts in thousands
SCHEDULE OF FUNDED LIABILITIES BY TYPEActuarial Liability for:
ActuarialValuation
ActiveMember
Contributions
Retirees,Beneficiaries
and OtherInactives
RemainingActive
Members'Liability
ReportedAssets
Portion of Actuarial LiabilitiesCovered by Reported Assets
Date (A) (B) (C) (A) (B) (C)6/30/2019 $308,023 $3,446,977 $1,233,427 $3,706,302 100% 99% 0%
6/30/2018 304,454 3,227,859 1,164,115 3,596,590 100% 100% 6%
6/30/2017 299,933 3,050,871 1,113,598 3,439,922 100% 100% 8%
6/30/2016 294,535 2,999,773 1,061,682 3,303,550 100% 100% 1%
6/30/2015 285,538 2,819,410 953,462 3,212,776 100% 100% 11%
6/30/2014 288,227 2,585,611 939,987 3,025,101 100% 100% 16%
6/30/2013 280,727 2,452,728 844,576 2,771,924 100% 100% 5%
6/30/2012 276,047 2,310,295 811,450 2,703,539 100% 100% 14%
6/30/2011 260,172 2,174,044 761,791 2,685,721 100% 100% 33%
6/30/2010 246,356 1,907,931 1,076,169 2,576,705 100% 100% 39%
Amounts prior to June 30, 2011 calculated by prior actuary Dollar amounts in thousands
Comprehensive Annual Financial Report 2019-2020 San José Police & Fire Retirement Plan 146

Actuarial Assumptions and Methods (continued)
DEFINED BENEFIT PENSION (continued)
SCHEDULE OF FUNDING PROGRESS
ActuarialValuation Date
Actuarial Valueof Assets
ActuarialLiability (AL)
UnfundedActuarialLiability
FundedRatio
CoveredPayroll
Unfunded ALas a % of
Covered Payroll
6/30/2019 $3,706,302 $4,988,427 $1,282,125 74.3% $235,818 543.7%
6/30/2018 3,596,590 4,696,428 1,099,838 76.6% 218,429 503.5%
6/30/2017 3,439,922 4,464,402 1,024,480 77.1% 203,816 502.6%
6/30/2016 3,303,550 4,355,990 1,052,440 75.8% 194,072 542.3%
6/30/2015 3,212,776 4,058,410 845,634 79.2% 184,733 457.8%
6/30/2014 3,025,101 3,813,825 788,724 79.3% 188,189 419.1%
6/30/2013 2,771,924 3,578,031 806,107 77.5% 184,645 436.6%
6/30/2012 2,703,539 3,397,792 694,253 79.6% 187,959 369.4%
6/30/2011 2,685,721 3,196,007 510,286 84.0% 190,726 267.5%
6/30/2010 2,576,705 3,230,456 653,751 79.8% 251,058 260.4%
Amounts prior to June 30, 2011 were calculated by the prior actuary Dollar amounts in thousands
147 Comprehensive Annual Financial Report 2019-2020 San José Police & Fire Retirement Plan

Summary of Pension Plan Provisions - Tier 1
1) Membership Requirement
Participation in the plan is immediate upon the first day of employment with the City of San José as apolice officer or fire fighter except for the following:
a. Independent contractors;
b. Person in City service principally for training or educational purposes;
c. Auxiliary or voluntary police officers or fire fighters;
d. Part-time or non-salaried employees; and
e. Employees receiving credit in any other retirement or pension system.
Persons eligible for Tier 1 membership include:
a. Any police officer hired prior to August 4, 2013 or any firefighter hired prior to January 2, 2015;
b. Any person who was a member of this plan as an employee of the police department prior toAugust 4, 2013, and terminated employment with the city, and returned to employment with thecity in a position covered by this plan on or after August 4, 2013;
c. Any person who was a member of this plan as an employee of the fire department prior toJanuary 2, 2015, and terminated employment with the city, and returned to employment withthe city in a position covered by this plan on or after January 2, 2015;
d. Any person accepting employment in the police department or fire department of the city on orafter January 1, 2013, who is otherwise eligible for this plan and who was an active member inanother California public retirement system with which this plan has reciprocity under Part 16,and who has a break in service of less than six months from that covered employment andemployment with the city.
2) Final Compensation
The highest 12 consecutive months of compensation in covered employment. However, in determiningfinal compensation, no compensation in the last 12 months of employment that exceeds 108% ofcompensation during the 12 months immediately preceding the last 12 months shall be considered.Compensation excludes overtime pay and expense allowances.
3) Credited Service
Years of service in covered employment plus service purchased for military leave of absence, Federatedservice, and unpaid leaves of absence.
4) Contributions
a. Member:
The amount needed to fund 3/11ths of normal cost calculated under the Entry Age actuarial cost methodplus the amortization payment on the February 4, 1996 benefit improvement. For Police members, thereis an additional amortization payment for member contributions not made for the last 6 months of 2006.
b. Employer:
The Employer contributes the remaining amounts necessary to fund the Plan in accordance with theBoard’s funding policy.
5) Service Retirement
Eligibility
Age 55 with 20 years of service, age 50 with 25 years of service, age 70 with no service requirement, orany age with 30 years of service. Reduced benefits are also available at age 50 with 20 years of service.
Comprehensive Annual Financial Report 2019-2020 San José Police & Fire Retirement Plan 148

Summary of Pension Plan Provisions - Tier 1 (continued)
Benefit
Police: 2.5% of final compensation for each year of credited service up to 20 years plus 4.0% of finalcompensation for each year of credited service in excess of 20, subject to a maximum of 90%of final compensation.
Fire: For members with less than 20 years of service, 2.5% of final compensation for each year ofcredited service. For members with 20 or more years of service, 3.0% of final compensation foreach year of service, subject to a maximum of 90% of final compensation.
6) Service Connected Disability Retirement
Eligibility
No age or service requirement.
Benefit
Police: 50% of final compensation plus 4.0% of final compensation for each year of credited service inexcess of 20, subject to a maximum of 90% of final compensation.
Fire: For members with less than 20 years of service, 50% of final compensation. For members with20 or more years of service, 3.0% of final compensation for each year of service, subject to amaximum of 90% of final compensation.
7) Non-Service Connected Disability Retirement
Eligibility
Two years of service.
Benefit
For members with less than 20 years of service, 32% of final compensation plus 1% of finalcompensation for each year of service in excess of two. For members with 20 or more years of service,the benefit amount equals the amount that would be calculated under the service retirement formula.
8) Non-Service Connected Death
Less than 2 years of service:
Lump sum benefit equal to the greater of accumulated employee contributions with interest or $1,000.
Disabled retirees or members ineligible for service retirement:
Spouse receives 24.0% of final compensation plus 0.75% of final compensation for each year of servicein excess of two, subject to a maximum of 37.5% of final compensation. If a member has eligibledependent children, an additional benefit is payable as follows:
1 Child: 25.0% of final compensation
2 Children: 37.5% of final compensation
3+ Children: 50.0% of final compensation
The total benefit payable to a family is limited to 75.0% of final compensation.
If a member does not have a spouse or eligible dependent children, a lump sum benefit equal to thegreater of accumulated employee contributions with interest or $1,000.
Service retirees or members eligible for service retirement:
Spouse receives the greater of 37.5% of final compensation or 50.0% of the member’s serviceretirement benefit, subject to a maximum of 42.5% of final compensation for Police and 45% of finalcompensation for Fire. Eligible dependent children will receive the same benefit as defined under thenon-service connected death for disabled retirees or members ineligible for service retirement. The totalbenefit payable to a family is limited to 75.0% of final compensation.
149 Comprehensive Annual Financial Report 2019-2020 San José Police & Fire Retirement Plan

Summary of Pension Plan Provisions - Tier 1 (continued)
9) Service-Connected Death
Spouse receives the greater of 37.5% of final compensation or 50.0% of the member’s serviceretirement benefit, subject to a maximum of 42.5% of final compensation for Police and 45.0% of finalcompensation for Fire. If a member has eligible dependent children, an additional benefit of 25.0% offinal compensation is payable for each eligible dependent child. The total benefit payable to a family islimited to 75.0% of final compensation.
10) Termination Benefits
Less than 10 years of service:
Lump sum benefit equal to the accumulated employee contributions with interest at 2.0% per annum.
10 or more years of credited service:
The amount of the service retirement benefit, payable at the later of age 55 or 20 years from date ofmembership.
11) Post-retirement Cost-of-Living Benefit
Benefits are increased every February 1 by 3.0%.
12) Changes Since Last Valuation
None.
Comprehensive Annual Financial Report 2019-2020 San José Police & Fire Retirement Plan 150

Summary of Pension Plan Provisions - Tier 2
1) Membership Requirement
Any police officer who is hired by the City on or after August 4, 2013, or any fire fighter who is hired bythe City on or after January 2, 2015, and who does not meet the eligibility requirement for Tier 1.
2) Final Compensation
The highest average monthly compensation of the member during any thirty-six consecutive months ofcovered employment. Compensation excludes overtime pay and expense allowances.
3) Credited Service
One year of service credit is given for 2,080 or more hours of City service rendered in any calendar year.A partial year (fraction with the numerator equal to the hours worked, and the denominator equal to2,080) is given for each calendar year with less than 2,080 hours worked.
4) Member Contributions
50.0% of total Tier 2 contributions to the pension plan, including, but not limited to administrativeexpenses, normal cost and unfunded actuarial liability. Increases in members' unfunded actuarialliability contribution are limited to one-third of one percent of compensation each year. Contributionscannot be less than 50% of normal cost.
5) Unreduced Service Retirement
Eligibility:
Age 57 with 5 years of service.
Benefit - Member:
2.4% of final compensation for each year of credited service up to 20 years, plus 3.0% of finalcompensation for each year of credited service between 20 years and 25 years, plus 3.4% of finalcompensation for each year of credited service in excess of 25 years, subject to a maximum of 80.0% offinal compensation.
Benefit - Survivor:
50.0% joint and survivor annuity.
6) Early Service Retirement
Eligibility:
Age 50 with 5 years of service.
Benefit - Member:
Reduced 7.0% per year for each year between age 57 and the member's age at retirement.
7) Service-Connected Disability Retirement
Eligibility:
No age or service requirement.
Benefit - Member:
The greater of:
• Monthly benefit equivalent to 50% of final compensation.
• The service retirement benefit, if eligible for service retirement.
• A service retirement benefit actuarially reduced from age 50, if not eligible for service retirement.
8) Non-Service Connected Disability Retirement
Eligibility:
Five years of service.
151 Comprehensive Annual Financial Report 2019-2020 San José Police & Fire Retirement Plan

Summary of Pension Plan Provisions - Tier 2 (continued)
Benefit - Member:
1.8% of final compensation for each year of credited service if less than age 50, or the service pensionbenefit if older than age 50.
9) Death Before Retirement
If death occurs before retirement eligibility is reached and after two years of service:
Monthly benefit equal to 24% of final compensation plus 0.75% of final compensation for each year ofservice in excess of two, up to a maximum of 37.5% of final compensation.
If death occurs after retirement eligibility is reached:
Benefit equivalent to what the employee would have received if retired at the time of death.
Employees killed in the line of duty:
Monthly benefit equal to the greater of:
• 37.5% of final compensation or
• 50.0% of what the employee would have received if retired at the time of death.
10) Withdrawal Benefits
Less than five years of credited service:
Lump sum benefit equal to the accumulated employee contributions with interest.
Five or more years of credited service:
The amount of the service retirement benefit, actuarially reduced for early retirement, and payable whenretirement eligibility is reached.
11) Benefit Forms
Retiree may choose an optional settlement at retirement that reduces their allowance to provide a highersurvivorship allowance to their spouse/domestic partner.
12) Post-retirement Cost-of-Living Benefit
Benefits are increased every April 1 by the change in the December CPI-U for San José-San Francisco-Oakland, subject to a cap of 2.0%. The first COLA after retirement shall be prorated based on thenumber of months retired.
13) Changes Since Last Valuation
There have been no changes in plan provisions since the last valuation.
Comprehensive Annual Financial Report 2019-2020 San José Police & Fire Retirement Plan 152

Actuary's Certification Letter - Police OPEB
September 22, 2020
Board of Administration
City of San José Police and Fire Department Retirement Plan
1737 North 1st Street, Suite 580
San José, CA 95112
Dear Members of the Board:
The purpose of this letter is to provide the certification for the Actuarial Section of the
Comprehensive Annual Financial Report (CAFR) for the City of San José Police and Fire
Department Retirement Plan with respect to Other Postemployment Benefits (OPEB) provided
through the City of San José Police Department Postemployment Healthcare Plan (Plan).
Actuarial Valuation Used for Funding Purposes
Actuarial valuations are performed annually, and the most recent actuarial valuation was
performed as of June 30, 2019. Please refer to that report for additional information related to the
funding of the Plan.
We prepared the following schedules for inclusion in the Actuarial Section of the CAFR based
on the June 30, 2019 actuarial valuation. All historical information prior to the June 30, 2011
actuarial valuation shown in these schedules is based on information reported by the prior
actuary, The Segal Group, Inc.
� Summary of Actuarial Assumptions and Methods
� Schedule of Active Member Valuation Data
� Schedule of Retirees and Beneficiaries Added to and Removed from Rolls
� Member Benefit Coverage Information
� Analysis of Financial Experience
� Schedule of Funding Progress
� Summary of Key Substantive Plan Provisions
The funding ratios shown in the member benefit coverage information and the schedule of
funding progress exhibits are ratios compared to the funding target and are for the purpose of
evaluating funding progress in a budgeting context. These ratios are not appropriate for
measuring or assessing the sufficiency of plan assets to cover the estimated cost of settling the
plan s benefit obligations.
Historically, member and City contributions to the plan have been negotiated through collective
bargaining and have not been actuarially determined. With the implementation of Measure F,
member contributions are fixed at 8.0% of pay; the City s contribution toward the explicit
subsidy is actuarially determined; and the City also pays the implicit subsidy on a pay-as-you-go
basis as a part of active health premiums. In addition, the City has the option to limit its
contribution for the explicit subsidy to 11% of the total Police and Fire payroll.
153 Comprehensive Annual Financial Report 2019-2020 San José Police & Fire Retirement Plan

Actuary's Certification Letter - Police OPEB (continued)
Board of Administration
September 22, 2020
Page 2
The actuarial methods and assumptions used in the actuarial valuation are adopted by the Board
of Administration with advice from the actuary. In our opinion, the assumptions and methods
used in the actuarial valuation for funding purposes are consistent with applicable Actuarial
Standards of Practice. The actuarial cost method and the actuarial assumptions used for funding
purposes are the same as those used for financial reporting purposes.
Actuarial Valuation Used for Financial Reporting Purposes
For financial reporting purposes, the Total OPEB Liability is based on the June 30, 2019
actuarial valuation updated to the measurement date of June 30, 2020. The Board changed some
economic and demographic assumptions for the June 30, 2019 valuation based on an experience
study. These changes are detailed in the actuarial assumptions and methods attachment of this
letter. These changes are reflected effective July 1, 2019 for financial reporting purposes.
Consequently, the update was based upon the Total OPEB Liability as of the valuation date
reflecting the new assumptions, and projected to the measurement date with the addition of
service cost and interest cost offset by actual benefit payments.
Please refer to our GASB 74/75 report as of June 30, 2020 for additional information related to
the financial reporting of the Plan. We prepared the following schedules for inclusion in the
Financial Section of the CAFR as shown in the June 30, 2020, GASB 74/75 report.
� Change in Net OPEB Liability
� Sensitivity of Net OPEB Liability to Changes in Discount Rate and Healthcare Cost
Trend Rates
� Schedule of Changes in Net OPEB Liability and Related Ratios
� Schedule of Employer Contributions
Reliance on the Information Provided by the System and Compliance with GAAP
In preparing our valuations and the schedules for the CAFR, we relied on information (some oral
and some written) supplied by the City of San José Office of Retirement Services. This
information includes, but is not limited to, the plan provisions, employee data, and financial
information. We performed an informal examination of the obvious characteristics of the data for
reasonableness and consistency in accordance with Actuarial Standard of Practice No. 23.
Future actuarial measurements for funding and financial reporting purposes may differ
significantly from the current measurements presented in this CAFR letter due to such factors as
the following: plan experience differing from that anticipated by the assumptions; changes in
assumptions; and, changes in plan provisions or applicable law.
This letter and the schedules named above have been prepared in accordance with generally
recognized and accepted actuarial principles and practices and our understanding of the Code of
Comprehensive Annual Financial Report 2019-2020 San José Police & Fire Retirement Plan 154

Actuary's Certification Letter - Police OPEB (continued)
Board of Administration
September 22, 2020
Page 3
Professional Conduct and applicable Actuarial Standards of Practice set out by the Actuarial
Standards Board as well as applicable laws and regulations. Furthermore, as credentialed
actuaries, we meet the Qualification Standards of the American Academy of Actuaries to render
the opinion contained in this letter and these exhibits. This letter does not address any contractual
or legal issues. We are not attorneys and our firm does not provide any legal services or advice.
This letter and the schedules named above were prepared for the Plan for the purposes described
herein. Other users of this information are not intended users as defined in the Actuarial
Standards of Practice, and Cheiron assumes no duty or liability to any other user.
This letter and the exhibits named above do not reflect future changes in benefits, penalties,
taxes, or administrative costs that may be required as a result of the Patient Protection and
Affordable Care Act of 2010, related legislation, or regulations.
Sincerely,
Cheiron
William R. Hallmark, ASA, EA, FCA, MAAA
Consulting Actuary
Michael W. Schionning, FSA, MAAA
Principal Consulting Actuary
Jacqueline R. King, FSA, EA, MAAA
Associate Actuary
155 Comprehensive Annual Financial Report 2019-2020 San José Police & Fire Retirement Plan

Actuarial Assumptions and MethodsPOLICE POSTEMPLOYMENT HEALTHCARE
Economic Assumptions
The expected return on plan assets and per person cost trend assumptions shown below were adoptedby the Board of Administration with the actuary's input at the January 9, 2020 Board meeting.
1) Expected Return on Plan Assets
6.50% per year. The Board expects a long-term rate of return of 7.6% based on Meketa's 20-year capitalmarket assumptions and the Plan's current investment policy.
2) Per Person Cost Trends
Medical trends were developed using the 2019 Getzen model published by the Society of Actuariesusing the following parameter:
Initial trend rate: Non-Medicare Eligible: 8.0% Medicare Eligible: 4.0%
Inflation: 2.5% Real GDP per Capita: 1.4%
Excess Medical Cost Growth: 1.0% Expected GDP Share in 2028: 20.5%
Resistance Point: 20.0% Year limited to GDP growth: 2075
Police Department - Annual Increase %Calendar Year 20201 2021 2022 2023 2024 2025 2026 2027 2028 2029 2030 2031 2032 2033 2034Pre-Medicare 0.00 7.66 7.33 6.99 6.66 6.32 5.98 5.65 5.31 4.97 4.81 4.78 4.76 4.74 4.72
MedicareEligible 0.00 4.11 4.22 4.32 4.43 4.54 4.65 4.76 4.87 4.97 4.81 4.78 4.76 4.74 4.72
Dental 0.00 3.50 3.50 3.50 3.50 3.50 3.50 3.50 3.50 3.50 3.50 3.50 3.50 3.50 3.50
Part B 0.00 3.73 0.04 0.06 0.06 5.97 5.90 6.18 8.02 7.73 7.44 7.16 6.87 6.58 6.29
Calendar Year 2035 2036 2037 2038 2039 2040 2041 2042 2043 2044 2045 2046 2047 2048 2049Pre-Medicare 4.71 4.69 4.68 4.66 4.65 4.64 4.63 4.61 4.60 4.59 4.58 4.57 4.56 4.55 4.55
MedicareEligible 4.71 4.69 4.68 4.66 4.65 4.64 4.63 4.61 4.60 4.59 4.58 4.57 4.56 4.55 4.55
Dental 3.50 3.50 3.50 3.50 3.50 3.50 3.50 3.50 3.50 3.50 3.50 3.50 3.50 3.50 3.50
Part B 6.00 5.72 5.43 5.14 4.85 4.56 4.28 3.99 3.70 3.70 3.70 3.70 3.70 3.70 3.70
Calendar Year 2050 2051 2052 2053 2054 2055 2056 2057 2058 2059 2060 2061 2062 2063 2064
Pre-Medicare 4.54 4.53 4.52 4.51 4.51 4.50 4.49 4.48 4.48 4.47 4.46 4.46 4.45 4.44 4.44
MedicareEligible 4.54 4.53 4.52 4.51 4.51 4.50 4.49 4.48 4.48 4.47 4.46 4.46 4.45 4.44 4.44
Dental 3.50 3.50 3.50 3.50 3.50 3.50 3.50 3.50 3.50 3.50 3.50 3.50 3.50 3.50 3.50
Part B 3.70 3.70 3.70 3.70 3.70 3.70 3.70 3.70 3.70 3.70 3.70 3.70 3.70 3.70 3.70
Calendar Year 2065 2066 2067 2068 2069 2070 2071 2072 2073 2074 2075 2076+ Pre-Medicare 4.43 4.42 4.37 4.32 4.27 4.22 4.17 4.12 4.07 4.03 3.98 3.94
MedicareEligible 4.43 4.42 4.37 4.32 4.27 4.22 4.17 4.12 4.07 4.03 3.98 3.94
Dental 3.50 3.50 3.50 3.50 3.50 3.50 3.50 3.50 3.50 3.50 3.50 3.50
Part B 3.70 3.70 3.70 3.70 3.70 3.70 3.70 3.70 3.70 3.70 3.70 3.70
1Actual premiums used
Actual premium increases for 2020 were reflected in the valuation. Deductibles, co-payments, out-of-pocket maximums, and annual maximum (where applicable) are assumed to increase at the above trendrates.
3) Changes Since Last Valuation
The per-person cost trends were updated.
Comprehensive Annual Financial Report 2019-2020 San José Police & Fire Retirement Plan 156

Actuarial Assumptions and Methods (continued)
POLICE POSTEMPLOYMENT HEALTHCARE (continued)
Demographic Assumptions
The postemployment healthcare assumptions were adopted by the Board of Administration at theJanuary 9, 2020 Board meeting based on our recommendations. The demographic assumptions sharedwith the pension plan shown below were adopted at the November 7, 2019 Board meeting based onrecommendations from our experience study covering Plan experience through June 30, 2019. Pleaserefer to the full experience study report for details, including the rationale for each assumption
1) Retirement Rates
Rates of retirement are based on age and service according to following tables. Tier 1 rates only applywhen the member is eligible for unreduced pension benefits. Tier 1 vested terminated members areassumed to retire at age 50 if they have 25 or more years of service or at age 55 if they have less than25 years of service. Tier 2 vested terminated members are assumed to retire at age 60.
Police Tier 1 Rates of Retirement by Age and ServiceAge 50 51 52 53-55 56-57 58-61 62+
<30 years 55.0% 45.0% 40.0% 30.0% 30.0% 50.0% 100.0%
30+ years 100.0% 100.0% 100.0% 100.0% 100.0% 100.0% 100.0%
Police Tier 2 Rates of Retirement by Age and ServiceAge 50-56 57-59 60-61 62-64 65+
5-19 years 2.0% 7.5% 10.0% 25.0% 100.0%
20-24 years 2.0% 10.0% 20.0% 50.0% 100.0%
25-29 years 2.0% 20.0% 35.0% 75.0% 100.0%
30+ years 5.0% 100.0% 100.0% 100.0% 100.0%
2) Disability Rates
Disability rates are equal to the CalPERS police industrial and non-industrial rates for publicagencies multiplied by 90% for ages under 50 and 140% for ages 50 and older. 100% of disabilities areassumed to be duty related. Sample disability rates of active participants are provided in the tablebelow:
Police Department - Rates of Disability at Selected AgesAge 25 30 35 40 45 50 55 60 65
Police 0.16% 0.45% 0.74% 1.03% 1.32% 2.70% 6.88% 8.71% 10.47%
3) Rates of Mortality
Mortality rates for actives, retirees, beneficiaries, terminated vested and reciprocals are based on thesex-distinct employee and annuitant mortality tables shown below. Future mortality improvements arereflected by applying the SOA MP-2019 projection scale on a generational basis from the base year of2010 (2009 for beneficiary tables).
157 Comprehensive Annual Financial Report 2019-2020 San José Police & Fire Retirement Plan

Actuarial Assumptions and Methods (continued)
POLICE POSTEMPLOYMENT HEALTHCARE (continued)
Police Department - Base Mortality TableCategory Male Female
Healthy Retirees
1.002 times the 2010 Public SafetyAbove Median Income MortalityTable (Pub(s)-2010(A)) for healthyretirees
1.002 times the 2010 Public SafetyAbove Median Income MortalityTable (Pub(s)-2010(A)) for healthyretirees
Disabled Retirees0.915 times the Public SafetyMortality Table (PubS-2010) fordisabled retirees
0.915 times the Public SafetyMortality Table (PubS-2010) fordisabled retirees
Beneficiaries0.948 times the CALPERS 2009Healthy Annuitant Mortality Table
1.048 times the CALPERS 2009Healthy Annuitant Mortality Table
Healthy Non-Annuitant
0.979 times the 2010 Public SafetyAbove Median Income MortalityTable (Pub(s)-2010(A)) for healthyemployees
0.979 times the 2010 Public SafetyAbove Median Income MortalityTable (Pub(s)-2010(A)) for healthyemployees
4) Rates of Termination
Sample rates of refund/termination are shown in the following table.
Police Department - Rates of TerminationService Police Service Police Service Police Service Police
0 13.75% 5 6.75% 10 4.50% 15 2.25%
1 11.75% 6 6.00% 11 4.25% 16 1.75%
2 10.00% 7 5.50% 12 3.75% 17 1.50%
3 8.50% 8 5.00% 13 3.25% 18 1.25%
4 7.50% 9 4.75% 14 2.75% 19+ 1.00%
Termination rates do not apply once a member is eligible for unreduced retirement.
5) Salary Increase Rate
Wage inflation component: 3.25%.
The following merit component is added to wage inflation, based on an individual member's years ofservice.
Police Department - Merit Salary Increases
Years ofService
Merit /Longevity
Years ofService
Merit /Longevity
Years ofService
Merit /Longevity
0 6.50% 4 4.50% 8 1.25%
1 6.25% 5 3.75% 9 1.00%
2 5.75% 6 2.75% 10 0.75%
3 5.25% 7 1.75% 11+ 0.50%
6) Percent of Retirees Electing Coverage
70% of active members are assumed to elect coverage upon retirement and 30% are assumed to enterthe In-Lieu credit program. 50% of term vested members are assumed to elect coverage uponretirement and 50% are assumed to enter the In-Lieu credit program. Retirees are assumed to continuein their current plan.
Members who elect to receive the In-Lieu credits are assumed to remain in the In-Lieu credit program for5 years, after which they are assumed to elect coverage and use their In-Lieu credits. Their medical tierelection assumptions are provided in the following table.
Comprehensive Annual Financial Report 2019-2020 San José Police & Fire Retirement Plan 158

Actuarial Assumptions and Methods (continued)
POLICE POSTEMPLOYMENT HEALTHCARE (continued)
Assumed Medical Tier Elections for Future Retirees who Elect In-Lieu Coverage1
Pre-Medicare Retirees % Electing Medicare-Eligible Retirees % ElectingRetiree only 25% Retiree only 60%
Retiree plus spouse 25% Retiree plus spouse 40%
Retiree plus family 50% Retiree plus family 0%1 Eligible for coverage
The Sutter Health and Blue Shield plans will no longer be offered as of January 1, 2020. They arereplaced with Anthem plan options effective January 1, 2020.
Retirees who are not yet age 65 are assumed to be eligible for Medicare when they reach age 65 andare assumed to enroll in the Medicare-eligible plan corresponding to their current pre-Medicare planelection. Future retirees are assumed to elect plans in the proportion shown in the following table.
Police Department - Assumed Plan Elections For Future Retirees1
Pre-MedicareMedical Plans % Electing
Medicare-EligibleMedical Plans % Electing
Kaiser DHMO 8% Kaiser Senior Advantage 41%
Kaiser $25 co-pay 56% Anthem Medicare HMO 6%
Kaiser HDHP 5% Anthem Medicare PPO 53%
Anthem DHMO 1%
Anthem $20 co-pay 7%
Anthem HDHP PPO 0% Dental Plans (All Retirees) Anthem Select PPO 0% Delta Dental PPO 99%
Anthem Classic PPO 23% DeltaCare HMO 1%1Eligible for coverage and elect coverage
7) Enrollment by Rating Tier
For current retirees, their actual enrollment by rating tier is used to value the explicit subsidy. 100% ofemployees with a spouse will elect spouse coverage in a dental plan at retirement. For future retirees,the following assumptions are used:
Police Department - Assumed Rating Tier Elections for Future Retirees
Pre-Medicare Medical Plans Single Employee/Spouse Employee/Child Family
Males 20% 34% 7% 39%
Females 52% 13% 22% 13%
Medicare Medical Plans
Males 27% 73% 0% 0%
Females 74% 26% 0% 0%
8) Married Percentage
Police Department - Percentage Married
Males Females
Percentage 85% 85%
159 Comprehensive Annual Financial Report 2019-2020 San José Police & Fire Retirement Plan

Actuarial Assumptions and Methods (continued)
POLICE POSTEMPLOYMENT HEALTHCARE (continued)
9) Dependent Age
For current retirees, actual spouse date of birth was used when available. For future retirees, husbandsare assumed to be three years older than their wives.
10) Administrative Expenses
For FYE 2021, trust administrative expenses are assumed to equal $41 per full benefit member and areassumed to increase at the wage inflation assumption of 3.25% per annum.
11) Changes Since Last Valuation
In-Lieu elections and the administrative expense assumption were updated.
Demographic assumptions were updated based on the most recent experience study covering theperiod through June 30, 2019. Please refer to the full experience study report for detail on the specificchanges.
Claim and Health Plan Benefit Expense Assumptions
The claim and expense assumptions shown below were adopted by the Board of Administration at theJanuary 9, 2020 Board meeting based upon the actuary's recommendations.
The claims costs are based on the fully insured premiums charged to the City for the active and retireepopulation in 2019 and 2020. For non-Medicare adults, the premiums for each coverage tier (retireeonly, retiree plus spouse, retiree plus child(ren), and retiree plus family) were blended based onenrollment data for the 2019 calendar year. The same process was used for Medicare adults, exceptonly Medicare-eligible retirees were included. The resulting per person per month (PPPM) cost was thenadjusted using age curves. The pre-Medicare adult claims curves were then loaded for the cost ofchildren; the load for children decreases by retiree age since older retirees have fewer children. Theimpact of children on Medicare costs was assumed to be de minimis. All claims costs are developedseparately for the Federated, Police, and Fire Postemployment Healthcare Plans of the City of SanJosé.
This report does not reflect future changes in benefits, penalties, taxes, or administrative costs that maybe required as a result of the Patient Protection and Affordable Care Act of 2010 related legislation andregulations.
1) Average Annual Claims and Expense Assumptions
The following claim and expense assumptions were developed as of July 1, 2019 based on thepremiums for 2019 and 2020. The explicit subsidy amount (100% of the premium for the lowest costhealth plan available to active City employees) is assumed to grow based on the pre-Medicare cost trendrates.
The following tables show the claims costs for each medical plan as of the valuation date:
POLICE DEPARTMENT - SAMPLE CLAIMS COSTS - NON-MEDICARE ELIGIBLEKaiser DHMO Kaiser $25 Co-Pay Kaiser HDHP
Age Male Female Male Female Male Female40 $ 6,607 $ 8,184 $ 10,184 $ 12,496 $ 6,594 $ 8,053
45 6,817 8,036 10,392 12,178 6,692 7,819
50 7,273 8,264 10,959 12,412 7,016 7,933
55 8,123 8,821 12,105 13,129 7,705 8,352
60 9,567 9,326 14,122 13,768 8,944 8,721
64 11,315 9,207 16,604 13,515 10,484 8,534
Comprehensive Annual Financial Report 2019-2020 San José Police & Fire Retirement Plan 160

Actuarial Assumptions and Methods (continued)
POLICE POSTEMPLOYMENT HEALTHCARE (continued)
POLICE DEPARTMENT - SAMPLE CLAIMS COSTS - NON-MEDICARE ELIGIBLESutter / Anthem DHMO Sutter / Anthem $20 Co-Pay Blue Shield / Anthem PPO
Age Male Female Male Female Male Female40 $ 9,456 $ 11,559 $ 10,701 $ 13,118 $ 14,575 $ 18,382
45 9,606 11,230 10,908 12,775 15,360 18,301
50 10,082 11,402 11,489 13,008 16,736 19,127
55 11,083 12,014 12,676 13,747 19,064 20,750
60 12,876 12,555 14,773 14,403 22,825 22,243
64 15,101 12,292 17,359 14,129 27,265 22,179
POLICE DEPARTMENT - SAMPLE CLAIMS COSTS - MEDICARE ELIGIBLEKaiser Senior Adv BS / Anthem Med PPO BS / Anthem HMO
Age Male Female Male Female Male Female65 $ 3,288 $ 2,900 $ 5,607 $ 4,946 $ 5,936 $ 5,236
70 3,491 2,957 5,954 5,043 6,303 5,338
75 4,013 3,326 6,843 5,671 7,245 6,004
80 4,557 3,771 7,770 6,431 8,226 6,808
85 4,921 4,121 8,392 7,028 8,884 7,440
POLICE DEPARTMENT - SAMPLE CLAIMS COSTS - DENTAL
Delta Dental PPO DeltaCare HMOAge Male Female Male Female
All $ 727 $ 727 $ 316 $ 316
2) Medicare Part D Subsidy
Per GASB guidance, the Part D Subsidy has not been reflected in this valuation.
3) Medicare Part B
All Medicare eligible retirees are assumed to participate in Medicare Part B.
4) Medicare Eligibility
All retirees who turn age 65 are assumed to be eligible for Medicare.
5) Annual Limits
Assumed to increase at the same rate as trend.
6) Lifetime Maximums
Are not assumed to have any financial impact.
7) Geography
Implicitly assumed to remain the same as current retirees.
8) Retiree Contributions
Retirees pay the difference between the actual premium for the elected medical plan and the lowest costmedical plan available to active members, if the retiree is eligible to receive the explicit subsidy. Noretiree contributions are required for dental.
9) Changes Since Last Valuation
All claims costs were updated to reflect the changes in plan premiums and the populations covered.
161 Comprehensive Annual Financial Report 2019-2020 San José Police & Fire Retirement Plan

Actuarial Assumptions and Methods (continued)
POLICE POSTEMPLOYMENT HEALTHCARE (continued)
Contribution Allocation Procedure
The contribution allocation procedure primarily consists of an actuarial cost method, an asset smoothingmethod, and an amortization method as described below.
1) Actuarial Cost Method
The Entry Age actuarial cost method was used for active employees, whereby the normal cost iscomputed as the level annual percentage of pay required to fund the retirement benefits between eachmember’s date of hire and assumed retirement. The actuarial liability is the difference between thepresent value of future benefits and the present value of future normal costs. Or, equivalently, it is theaccumulation of normal costs for all periods prior to the valuation date. The normal cost and actuarialliability are calculated on an individual basis. The sum of the individual amounts is the normal cost andactuarial liability for the Plan. The actuarial liability for the Plan represents the target amount of assetsthe Plan should have as of the valuation date according to the actuarial cost method.
2) Asset Valuation Method
The Actuarial Value of Assets equals the Fair Value of Assets.
3) Amortization Method
The unfunded actuarial liability is the difference between the actuarial liability and the actuarial value ofassets. The Unfunded Actuarial Liability as of June 30, 2017 was amortized as a level percent of payrollover a closed 25-year period. All future amortization bases will be amortized over 25-year periods with a3-year phase-in and phase-out.
4) Contributions
The City will contribute the annual implicit subsidy as part of active employee health premiums and willprefund the explicit subsidy based on the normal cost, administrative expenses and amortizationpayment described above less expected employee contributions. The City has the option to limit itscontribution to no more than 11% of total payroll. Active members that are eligible for full benefits will contribute 8% of pay.
5) Changes Since Last Valuation
None.
POLICE DEPARTMENT - SCHEDULE OF ACTIVE MEMBER DATAActive Member Counts Annual Average Change in
Valuation Date Under Age 65 Age 65+ Total Payroll Annual Pay Average Pay6/30/2019 1,039 0 1,039 $ 146,865,241 $ 141,352 4.4%
6/30/2018 974 0 974 131,888,184 135,409 1.0%
6/30/2017 897 0 897 120,299,327 134,113 10.0%
6/30/2016 911 0 911 111,028,782 121,876 3.1%
6/30/2015 929 0 929 109,868,577 118,265 4.4%
6/30/2014 997 0 997 112,946,895 113,287 6.1%
6/30/2013 1,028 0 1,028 109,783,295 106,793 6.5%
6/30/2012 1,076 0 1,076 107,929,300 100,306 (7.6)%
6/30/2011 1,122 0 1,122 121,735,722 108,499 (10.8)%
6/30/2010 1,295 0 1,295 157,605,258 121,703
Comprehensive Annual Financial Report 2019-2020 San José Police & Fire Retirement Plan 162

Actuarial Assumptions and Methods (continued)
POLICE POSTEMPLOYMENT HEALTHCARE (continued)
POLICE DEPARTMENT - SCHEDULE OF RETIREES AND BENEFICIARIES ADDED TO AND REMOVED FROM ROLLS
Beginning of PeriodAdded
to Rolls
RemovedfromRolls End of Period Net Change % Increase Average
Period CountAnnualSubsidy Count Count Count
AnnualSubsidy Count
AnnualSubsidy
in AnnualSubsidy
AnnualSubsidy
Medical2018-19 1,233 $ 10,632,870 69 60 1,242 $ 11,216,786 9 $ 583,916 5.5% $9,031
2017-18 1,198 12,718,518 73 38 1,233 10,632,870 35 (2,085,648) (16.4)% 8,624
2016-17 1,169 12,037,441 56 27 1,198 12,718,518 29 681,078 5.7% 10,616
2015-16 1,141 11,640,679 60 32 1,169 12,037,441 28 396,761 3.4% 10,297
2014-15 1,106 11,899,604 71 36 1,141 11,640,679 35 (258,925) (2.2)% 10,202
2013-14 1,083 11,801,848 50 27 1,106 11,899,604 23 97,756 0.8% 10,759
2012-13 1,037 12,823,451 66 20 1,083 11,801,848 46 (1,021,603) (8.0)% 10,897
2011-12 991 12,266,722 77 31 1,037 12,823,451 46 556,729 4.5% 12,366
2010-11 N/A N/A N/A N/A 991 12,266,722 N/A N/A N/A N/A
2009-10 N/A N/A N/A N/A N/A N/A N/A N/A N/A N/A
Dental
2018-19 1,269 $ 1,625,889 70 24 1,315 $ 1,693,224 46 $ 67,335 4.1% $ 1,288
2017-18 1,248 1,605,396 59 38 1,269 1,625,889 21 20,493 1.3% 1,281
2016-17 1,220 1,509,608 50 22 1,248 1,605,396 28 95,789 6.3% 1,286
2015-16 1,199 1,497,139 42 21 1,220 1,509,608 21 12,468 0.8% 1,237
2014-15 1,139 1,428,059 79 19 1,199 1,497,139 60 69,081 4.8% 1,249
2013-14 1,111 1,352,967 45 17 1,139 1,428,059 28 75,092 5.6% 1,254
2012-13 1,070 1,384,063 53 10 1,111 1,352,967 41 (31,096) (2.2)% 1,218
2011-12 1,028 1,330,289 50 11 1,070 1,384,063 42 53,774 4.0 1,294
2010-11 N/A N/A N/A N/A 1,028 1,330,289 N/A N/A N/A N/A
2009-10 N/A N/A N/A N/A N/A N/A N/A N/A N/A N/A
Annual subsidies are explicit amounts
Police Department - Member Benefit Coverage Information
Actuarial Liability
Actuarial Valuation Date
Retirees andVested
TerminatedActive
Members
FairValue of Assets1
Portion of Liability Covered byActuarial Value of Assets
(A) (B) (A) (B)
6/30/2019 $ 293,344 $ 142,094 $ 124,990 43% 0%
6/30/2018 305,606 166,211 111,659 37% 0%
6/30/2017 280,546 150,792 99,926 36% 0%
6/30/2016 307,941 188,002 97,412 32% 0%
6/30/2015 290,354 179,969 85,322 29% 0%
6/30/2014 275,902 180,568 70,102 25% 0%
6/30/2013 268,633 183,266 57,832 22% 0%
6/30/2012 374,949 268,590 49,797 13% 0%
6/30/2011 381,819 262,855 43,108 11% 0%
6/30/2010 358,073 252,508 N/A N/A N/A1 Actuarial value of assets for 6/30/2016 and earlier Dollar amounts in thousands
163 Comprehensive Annual Financial Report 2019-2020 San José Police & Fire Retirement Plan

Actuarial Assumptions and Methods (continued)
POLICE POSTEMPLOYMENT HEALTHCARE (continued)
POLICE DEPARTMENT - ANALYSIS OF FINANCIAL EXPERIENCE
Gain or (Loss) for the Year Ending on Valuation Date Due to:
ActuarialValuation Date
InvestmentIncome
CombinedLiability
ExperienceTotal Financial
ExperienceAssumption
ChangesTotal
Experience
6/30/2019 $ (2,839) $ 64,974 $ 62,135 $ (6,817) $ 55,318
6/30/2018 (2,442) 3,712 1,270 (22,819) (21,549)
6/30/2017 2,647 (15,108) (12,461) 29,245 16,784
6/30/2016 (2,914) (2,728) (5,642) 4,864 (778)
6/30/2015 582 7,990 8,572 (3,449) 5,123
6/30/2014 2,802 16,222 19,024 13,689 32,713
6/30/2013 2,437 (4,536) (2,099) 258,939 256,840
6/30/2012 (6,011) 4,760 (1,251) 58,173 56,922
6/30/2011 (2,661) 5,967 3,306 1,146 4,452
6/30/2010 (3,067) (11,242) (14,309) (122,599) (136,908)
The analysis was combined for Police and Fire for 6/30/2017 and earlier Dollar amounts in thousands
The schedule of funding progress compares the assets used for funding purposes to the comparableliabilities to determine how well the Plan is funded and how this status has changed over the pastseveral years. The actuarial liability is compared to the actuarial value of assets to determine thefunding ratio. Since the June 30, 2017 valuation, the actuarial value of assets is equal to the fair valueof assets.
POLICE DEPARTMENT - SCHEDULE OF FUNDING PROGRESS
Actuarial
Valuation Date
ActuarialValue ofAssets
ActuarialLiability
UnfundedActuarialLiability(UAL) Funded Ratio
AnnualCoveredPayroll
UAL as aPercentage of
CoveredPayroll
(a) (b) (b-a) (a / b) (c) ((b-a) / c)6/30/2019 $ 124,990 $ 435,438 $ 310,448 %28.7 $ 146,865 %211
6/30/2018 111,659 471,817 360,158 %23.7 131,888 %273
6/30/2017 99,926 431,338 331,412 %23.2 120,299 %275
6/30/2016 97,412 495,943 398,531 %19.6 111,029 %359
6/30/2015 85,322 470,323 385,001 %18.1 109,783 %351
6/30/2014 70,102 456,470 386,368 %15.4 112,947 %342
6/30/2013 57,832 451,899 394,067 %12.8 109,783 %359
6/30/2012 49,797 643,539 593,742 %7.7 107,929 %550
6/30/2011 43,108 644,674 601,566 %6.7 121,736 %494
6/30/2010 N/A 610,581 N/A N/A N/A N/A
Dollar amounts in thousands
Comprehensive Annual Financial Report 2019-2020 San José Police & Fire Retirement Plan 164

Summary of Key Substantive Plan Provisions
POLICE POSTEMPLOYMENT HEALTHCARE
Eligibility
Employees hired before July 2013 that did not elect to opt-in to the Voluntary Employees' BeneficiaryAssociation (VEBA).
Medical/Dental:
Employees who retire (include deferred vested members) with at least 15 years of service with the City(“OPEB benefit service”), or with a monthly pension equal to at least 37.5% of final compensation, areeligible to elect medical coverage upon retirement. Tier 1 employees (hired before August 4, 2013) areeligible for unreduced service retirement at age 55 with 20 years of service, age 50 with 25 years ofservice, age 70 with no service requirement, or any age with 30 years of service. Reduced serviceretirement is available at age 50 with 20 years of service. Service credited through reciprocityagreements counts towards an employee’s required service to retire, but only service with the Citycounts towards the required years of service to receive OPEB benefits.
Employees who become disabled with at least 15 years of service or have a monthly pension equal to atleast 37.5% of final compensation are eligible to elect medical coverage upon retirement.
Spouses or domestic partners of retired members are allowed to participate if they were enrolled in theCity’s medical plan at the time of the member’s retirement. Dependent children are eligible to receivecoverage until the age of 26.
Surviving spouses/domestic partners/children of deceased members are eligible for coverage if thefollowing conditions are met:
1. The employee has 15 years of service at time of death or is entitled to a monthly pension of at least 37.5% of final compensation and,
2. Both the member and the survivors were enrolled in the active medical plan immediately before death; and,
3. The survivor will receive a monthly pension benefit.
Employees who separate from service after July 5, 1992, with 20 years of service, leaving contributionsin the retirement plan, are eligible to elect medical and/or dental coverage upon retirement.
Benefits for Retirees
Medical:
The Retirement Plan, through the medical benefit account, pays 100% of the premium for the lowestcost health plan available to active City employees. The member pays the difference, if another plan iselected.
To the extent that the elected plan premium is less than the maximum subsidy amount, Medicare-eligibleretirees receive reimbursement of Medicare Part B premiums for themselves and their covered spouse,if applicable.
Dental:
The Retirement Plan, through the medical benefit account, pays 100% of the dental insurancepremiums.
165 Comprehensive Annual Financial Report 2019-2020 San José Police & Fire Retirement Plan

Summary of Key Substantive Plan Provisions (continued)
POLICE POSTEMPLOYMENT HEALTHCARE (continued)
Premiums:
Monthly premiums before adjustments for 2019 and 2020 are as follows.
POLICE DEPARTMENT - 2019 MONTHLY PREMIUMS
Single Employee /
Spouse Employee /
Child Family Medical
Non-Medicare Monthly Rates
Kaiser DHMO $ 528.20 $ 1,056.40 $ 924.36 $ 1,584.60
Kaiser $25 Co-pay 645.08 1,290.16 1,128.88 1,935.24
Kaiser HDHP 445.04 890.08 778.82 1,335.12
Blue Shield PPO $25 Co-pay 1,435.38 2,870.74 2,511.94 4,306.12
Sutter Health $20 Co-pay 652.28 1,304.56 1,141.44 1,956.78
Sutter Health DHMO 534.06 1,068.12 934.56 1,602.12
Sutter Health Vista 445.74 891.50 780.04 1,337.22
Medicare-Eligible Monthly Rates
Kaiser Senior Advantage $ 300.80 $ 601.60 $ 601.60 $ 902.40
Blue Shield Medicare PPO 528.57 1,057.14 1,057.14 1,585.71
Blue Shield Medicare HMO 602.56 1,205.12 1,205.12 1,807.68
Dental
Delta Dental PPO $ 50.88 $ 111.92 $ 122.12 $ 157.72
DeltaCare HMO 24.44 48.86 42.74 73.30
Blue Shield HMO Medicare family rates assume the children are on the Non-Medicare $20 Co-pay HMO
POLICE DEPARTMENT - 2020 MONTHLY PREMIUMS
Single Employee /
Spouse Employee /
Child Family Medical
Non-Medicare Monthly Rates
Kaiser DHMO $ 574.36 $ 1,148.72 $ 1,005.14 $ 1,723.08
Kaiser $25 Co-pay 701.46 1,402.92 1,227.54 2,104.38
Kaiser HDHP 483.94 967.88 846.90 1,451.82
Anthem HMO $20 Co-pay 671.12 1,476.46 1,208.02 2,080.46
Anthem DHMO 517.42 1,138.34 931.36 1,604.02
Anthem HDHP 905.36 1,991.82 1,629.66 2,806.66
Anthem Select PPO 1,469.66 3,233.24 2,645.38 4,555.94
Anthem Classic PPO 1,571.82 3,458.02 2,829.28 4,872.66
Medicare-Eligible Monthly Rates
Kaiser Senior Advantage $ 289.14 $ 578.28 $ 578.28 $ 867.42
Anthem Medicare PPO 508.56 1,017.12 1,017.12 1,525.68
Anthem Medicare HMO 453.55 907.10 907.10 1,360.65
Dental
Delta Dental PPO $ 50.88 $ 111.92 $ 122.12 $ 157.72
DeltaCare HMO 24.44 48.86 42.74 73.30
Comprehensive Annual Financial Report 2019-2020 San José Police & Fire Retirement Plan 166

Summary of Key Substantive Plan Provisions (continued)
POLICE POSTEMPLOYMENT HEALTHCARE (continued)
POLICE DEPARTMENT - SUMMARY OF 2020 BENEFIT PLANS
Non-MedicarePlans:
KaiserHigh
DeductibleKaiserDHMO
Kaiser$25 Co-pay
Anthem$20 Co-pay
HMOAnthemDHMO
AnthemSelect PPO
(In-Network)
AnthemClassic PPO (In-Network)
AnthemHigh
Deductible(In-Network)
Annual out-of-pocketmaximum (single / family)
$5,950 /$11,900
$4,000 /$8,000
$1,500 /$3,000
$1,500 /$3,000
$4,000 /$8,000
$2,100 /$4,200
$2100 /$4,200
$4,000 /$8,000
Annualdeductible(single / family)
$3,000 /$6,000
$1,500 /$3,000 None None
$1,500 /$3,000
$100 /$200
$100 /$200
$2,500 /$5,000
Office visitco-pay 30%1 $40 $25 $20 $20 $25 $25 20%1
Emergencyroom co-pay 30%1 30%1 $100 $100 30%1 $100 $100 20%1
Hospital careco-pay 30%1 30%1 $100 $100 30%1 10%1 10%1 20%1
Prescription Drug Retail Co-pay (30-day supply):
Generic $10 $10 $10 $10 $10 $10 $10 $10
Brand 30 $30 $25 $30 $30 $25 $25 $30
Non-formulary N/A N/A N/A $60 $60 $40 $40 $60
1After deductible is paid
Medicare-Eligible Plans: Kaiser Anthem HMO Anthem PPO
Annual out-of-pocket maximum (single / family)$1,500 /$3,000
$1,000 permember $0
Annual deductible (single / family) None None None
Office visit co-pay $25 $25 $0
Emergency room co-pay $50 $100 $0
Hospital care co-pay $250 $100 $0
Prescription Drug Retail Co-pay (30-day supply):
Generic $10 $10 $10
Brand $10 $25 $25
Non-formulary N/A $40 $40
167 Comprehensive Annual Financial Report 2019-2020 San José Police & Fire Retirement Plan

Summary of Key Substantive Plan Provisions (continued)
POLICE POSTEMPLOYMENT HEALTHCARE (continued)
Cost Sharing Provisions
It is assumed for the purpose of this valuation that the City of San José will in the future maintain aconsistent level of cost sharing for benefits with the retirees. This may be achieved by adjusting benefitprovisions, contributions or both.
CATASTROPHIC DISABILITY HEALTHCARE PROGRAM
Eligibility: Employees hired after June 2013 or employees who elected to opt-in to the Voluntary Employees' Beneficiary Association (VEBA).
Contributions: Employees are required to make mandatory contributions into the VEBA on a pre-tax basis.
Medical: VEBA funds can be used to reimburse members for eligible healthcare expenses.
VEBA members on service-connected disability will receive benefits from the
Postemployment Healthcare Plan only up to age 65 once VEBA funds exhausted.
Comprehensive Annual Financial Report 2019-2020 San José Police & Fire Retirement Plan 168

Actuary's Certification Letter - Fire OPEB
September 22, 2020
Board of Administration
City of San José Police and Fire Department Retirement Plan
1737 North 1st Street, Suite 580
San José, CA 95112
Dear Members of the Board:
The purpose of this letter is to provide the certification for the Actuarial Section of the
Comprehensive Annual Financial Report (CAFR) for the City of San José Police and Fire
Department Retirement Plan with respect to Other Postemployment Benefits (OPEB) provided
through the City of San José Fire Department Postemployment Healthcare Plan (Plan).
Actuarial Valuation Used for Funding Purposes
Actuarial valuations are performed annually, and the most recent actuarial valuation was
performed as of June 30, 2019. Please refer to that report for additional information related to the
funding of the Plan.
We prepared the following schedules for inclusion in the Actuarial Section of the CAFR based
on the June 30, 2019 actuarial valuation. All historical information prior to the June 30, 2011
actuarial valuation shown in these schedules is based on information reported by the prior
actuary, The Segal Group, Inc.
� Summary of Actuarial Assumptions and Methods
� Schedule of Active Member Valuation Data
� Schedule of Retirees and Beneficiaries Added to and Removed from Rolls
� Member Benefit Coverage Information
� Analysis of Financial Experience
� Schedule of Funding Progress
� Summary of Key Substantive Plan Provisions
The funding ratios shown in the member benefit coverage information and the schedule of
funding progress exhibits are ratios compared to the funding target and are for the purpose of
evaluating funding progress in a budgeting context. These ratios are not appropriate for
measuring or assessing the sufficiency of plan assets to cover the estimated cost of settling the
plan s benefit obligations.
Historically, member and City contributions to the plan have been negotiated through collective
bargaining and have not been actuarially determined. With the implementation of Measure F,
member contributions are fixed at 8.0% of pay; the City s contribution toward the explicit
subsidy is actuarially determined; and the City also pays the implicit subsidy on a pay-as-you-go
basis as a part of active health premiums. In addition, the City has the option to limit its
contribution for the explicit subsidy to 11% of the total Police and Fire payroll.
169 Comprehensive Annual Financial Report 2019-2020 San José Police & Fire Retirement Plan

Actuary's Certification Letter - Fire OPEB (continued)
Board of Administration
September 22, 2020
Page 2
The actuarial methods and assumptions used in the actuarial valuation are adopted by the Board
of Administration with advice from the actuary. In our opinion, the assumptions and methods
used in the actuarial valuation for funding purposes are consistent with applicable Actuarial
Standards of Practice. The actuarial cost method and the actuarial assumptions used for funding
purposes are the same as those used for financial reporting purposes.
Actuarial Valuation Used for Financial Reporting Purposes
For financial reporting purposes, the Total OPEB Liability is based on the June 30, 2019
actuarial valuation updated to the measurement date of June 30, 2020. The Board changed some
economic and demographic assumptions for the June 30, 2019 valuation based on an experience
study. These changes are detailed in the actuarial assumptions and methods attachment of this
letter. These changes are reflected effective July 1, 2019 for financial reporting purposes.
Consequently, the update was based upon the Total OPEB Liability as of the valuation date
reflecting the new assumptions, and projected to the measurement date with the addition of
service cost and interest cost offset by actual benefit payments.
Please refer to our GASB 74/75 report as of June 30, 2020 for additional information related to
the financial reporting of the Plan. We prepared the following schedules for inclusion in the
Financial Section of the CAFR as shown in the June 30, 2020, GASB 74/75 report.
� Change in Net OPEB Liability
� Sensitivity of Net OPEB Liability to Changes in Discount Rate and Healthcare Cost
Trend Rates
� Schedule of Changes in Net OPEB Liability and Related Ratios
� Schedule of Employer Contributions
Reliance on the Information Provided by the System and Compliance with GAAP
In preparing our valuations and the schedules for the CAFR, we relied on information (some oral
and some written) supplied by the City of San José Office of Retirement Services. This
information includes, but is not limited to, the plan provisions, employee data, and financial
information. We performed an informal examination of the obvious characteristics of the data for
reasonableness and consistency in accordance with Actuarial Standard of Practice No. 23.
Future actuarial measurements for funding and financial reporting purposes may differ
significantly from the current measurements presented in this CAFR letter due to such factors as
the following: plan experience differing from that anticipated by the assumptions; changes in
assumptions; and, changes in plan provisions or applicable law.
This letter and the schedules named above have been prepared in accordance with generally
recognized and accepted actuarial principles and practices and our understanding of the Code of
Comprehensive Annual Financial Report 2019-2020 San José Police & Fire Retirement Plan 170

Actuary's Certification Letter - Fire OPEB (continued)
Board of Administration
September 22, 2020
Page 3
Professional Conduct and applicable Actuarial Standards of Practice set out by the Actuarial
Standards Board as well as applicable laws and regulations. Furthermore, as credentialed
actuaries, we meet the Qualification Standards of the American Academy of Actuaries to render
the opinion contained in this letter and these exhibits. This letter does not address any contractual
or legal issues. We are not attorneys and our firm does not provide any legal services or advice.
This letter and the schedules named above were prepared for the Plan for the purposes described
herein. Other users of this information are not intended users as defined in the Actuarial
Standards of Practice, and Cheiron assumes no duty or liability to any other user.
This letter and the exhibits named above do not reflect future changes in benefits, penalties,
taxes, or administrative costs that may be required as a result of the Patient Protection and
Affordable Care Act of 2010, related legislation, or regulations.
Sincerely,
Cheiron
William R. Hallmark, ASA, EA, FCA, MAAA
Consulting Actuary
Michael W. Schionning, FSA, MAAA
Principal Consulting Actuary
Jacqueline R. King, FSA, EA, MAAA
Associate Actuary
171 Comprehensive Annual Financial Report 2019-2020 San José Police & Fire Retirement Plan

Actuarial Assumptions and MethodsFIRE POSTEMPLOYMENT HEALTHCARE
Economic Assumptions
The expected return on plan assets and per person cost trend assumptions shown below were adoptedby the Board of Administration with the actuary's input at the January 9, 2020 Board meeting. Pleaserefer to the presentation for that meeting for details, including the rationale for each assumption.
1) Expected Return on Plan Assets
6.50% per year. The Board expects a long-term rate of return of 7.6% based on Meketa's 20-year capitalmarket assumptions and the Plan's current investment policy.
2) Per Person Cost Trends
Medical trends were developed using the 2019 Getzen model published by the Society of Actuariesusing the following parameter:
Initial trend rate: Non-Medicare Eligible: 8.0% Medicare Eligible: 4.0%
Inflation: 2.5% Real GDP per Capita: 1.4%
Excess Medical Cost Growth: 1.0% Expected GDP Share in 2028: 20.5%
Resistance Point: 20.0% Year limited to GDP growth: 2075
Fire Department - Annual Increase %
Calendar Year 20201 2021 2022 2023 2024 2025 2026 2027 2028 2029 2030 2031 2032 2033 2034
Pre-Medicare 0.00 7.66 7.33 6.99 6.66 6.32 5.98 5.65 5.31 4.97 4.81 4.78 4.76 4.74 4.72
MedicareEligible 0.00 4.11 4.22 4.32 4.43 4.54 4.65 4.76 4.87 4.97 4.81 4.78 4.76 4.74 4.72
Dental 0.00 3.50 3.50 3.50 3.50 3.50 3.50 3.50 3.50 3.50 3.50 3.50 3.50 3.50 3.50
Part B 0.00 3.73 0.04 0.06 0.06 5.97 5.90 6.18 8.02 7.73 7.44 7.16 6.87 6.58 6.29
Calendar Year 2035 2036 2037 2038 2039 2040 2041 2042 2043 2044 2045 2046 2047 2048 2049
Pre-Medicare 4.71 4.69 4.68 4.66 4.65 4.64 4.63 4.61 4.60 4.59 4.58 4.57 4.56 4.55 4.55
MedicareEligible 4.71 4.69 4.68 4.66 4.65 4.64 4.63 4.61 4.60 4.59 4.58 4.57 4.56 4.55 4.55
Dental 3.50 3.50 3.50 3.50 3.50 3.50 3.50 3.50 3.50 3.50 3.50 3.50 3.50 3.50 3.50
Part B 6.00 5.72 5.43 5.14 4.85 4.56 4.28 3.99 3.70 3.70 3.70 3.70 3.70 3.70 3.70
Calendar Year 2050 2051 2052 2053 2054 2055 2056 2057 2058 2059 2060 2061 2062 2063 2064
Pre-Medicare 4.54 4.53 4.52 4.51 4.51 4.50 4.49 4.48 4.48 4.47 4.46 4.46 4.45 4.44 4.44
MedicareEligible 4.54 4.53 4.52 4.51 4.51 4.50 4.49 4.48 4.48 4.47 4.46 4.46 4.45 4.44 4.44
Dental 3.50 3.50 3.50 3.50 3.50 3.50 3.50 3.50 3.50 3.50 3.50 3.50 3.50 3.50 3.50
Part B 3.70 3.70 3.70 3.70 3.70 3.70 3.70 3.70 3.70 3.70 3.70 3.70 3.70 3.70 3.70
Calendar Year 2065 2066 2067 2068 2069 2070 2071 2072 2073 2074 2075 2076+
Pre-Medicare 4.43 4.42 4.37 4.32 4.27 4.22 4.17 4.12 4.07 4.03 3.98 3.94
MedicareEligible 4.43 4.42 4.37 4.32 4.27 4.22 4.17 4.12 4.07 4.03 3.98 3.94
Dental 3.50 3.50 3.50 3.50 3.50 3.50 3.50 3.50 3.50 3.50 3.50 3.50
Part B 3.70 3.70 3.70 3.70 3.70 3.70 3.70 3.70 3.70 3.70 3.70 3.70
Actual premium increases for 2020 were reflected in the valuation. Deductibles, co-payments, out-of-Pocket Maximums, and Annual Maximum (where applicable) are assumed to increase at the abovetrend rates.
Comprehensive Annual Financial Report 2019-2020 San José Police & Fire Retirement Plan 172

Actuarial Assumptions and Methods (continued)
FIRE POSTEMPLOYMENT HEALTHCARE (continued)
3) Changes Since Last Valuation
The per-person cost trends were updated.
Demographic Assumptions
The postemployment healthcare assumptions were adopted by the Board of Administration at theJanuary 9, 2020 Board meeting based on our recommendations. The other demographic assumptionsshown below were adopted at the November 7, 2019 Board meeting based on recommendations fromour experience study covering the plan experience through June 30, 2019. Please refer to the fullexperience study report for details, including the rationale for each assumption.
1) Retirement Rates
Rates of retirement are based on age and service according to following tables. Tier 1 rates only applywhen the member is eligible for unreduced pension benefits. Tier 1 terminated vested members areassumed to retire at age 50 if they have 25 or more years of service or at age 55 if they have less than25 years of service. Tier 2 terminated vested members are assumed to retire at age 60.
Fire Department Tier 1 - Rates of Retirement by Age and Service
Age 50 51-54 55 56 57 58-61 62+
<30 years 35.0% 35.0% 30.0% 25.0% 20.0% 27.5% 100.0%
30+ years 100.0% 100.0% 100.0% 100.0% 100.0% 100.0% 100.0%
Fire Department Tier 2 - Rates of Retirement by Age ServiceAge 50-56 57-59 60-61 62-64 65+
5-19 years 1.0% 5.0% 7.5% 20.0% 100.0%
20-24 years 1.0% 7.5% 15.0% 35.0% 100.0%
25-29 years 1.0% 15.0% 25.0% 50.0% 100.0%
30+ years 2.5% 100.0% 100.0% 100.0% 100.0%
2) Disability Rates
Disability rates are equal to the CalPERS fire industrial and non-industrial rates for public agenciesmultiplied by 90% for ages under 50 and 180% for ages 50 and older. 100% of disabilities are assumedto be duty related. Sample disability rates of active participants are provided in the table below:
Fire Department - Rates of Disability at Selected Ages
Age 25 30 35 40 45 50 55 60 65
Fire 0.03% 0.08% 0.15% 0.28% 0.50% 5.08% 7.54% 10.77% 14.84%
3) Rates of Mortality
Mortality rates for actives, retirees, beneficiaries, terminated vested and reciprocals are based on thesex-distinct employee and annuitant mortality tables shown below. Future mortality improvements arereflected by applying the SOA MP-2019 projection scale on a generational basis from the base year of2010 (2009 for beneficiary tables).
173 Comprehensive Annual Financial Report 2019-2020 San José Police & Fire Retirement Plan

Actuarial Assumptions and Methods (continued)
FIRE POSTEMPLOYMENT HEALTHCARE (continued)
Fire Department - Base Mortality Table
Category Male Female
Healthy Retirees 1.002 times the 2010 Public Safety
Above Median Income Mortality Table
(Pub(s)-2010(A)) for healthy retirees
1.002 times the 2010 Public Safety
Above Median Income Mortality Table
(Pub(s)-2010(A)) for healthy retirees
Disabled Retirees 0.915 times the Public Safety
Mortality Table (PubS-2010) for
disabled retirees
0.915 times the Public Safety
Mortality Table (PubS-2010) for
disabled retirees
Beneficiaries 0.948 times the CALPERS 2009
Healthy Annuitant Mortality Table
1.048 times the CALPERS 2009
Healthy Annuitant Mortality Table
Healthy Non-Annuitant 0.979 times the 2010 Public Safety
Above Median Income Mortality Table
(Pub(s)-2010(A)) for healthy
employees
0.979 times the 2010 Public Safety
Above Median Income Mortality Table
(Pub(s)-2010(A)) for healthy
employees
4) Rates of Termination
Sample rates of refund/termination are shown in the following table.
Fire Department - Rates of Termination1
Service Fire Service Fire Service Fire Service Fire0 8.50% 5 1.00% 10 0.50% 15 0.50%
1 4.00% 6 0.90% 11 0.50% 16 0.50%
2 2.75% 7 0.80% 12 0.50% 17 0.50%
3 1.75% 8 0.70% 13 0.50% 18 0.50%
4 1.25% 9 0.60% 14 0.50% 19+ 0.50%
1 Termination rates do not apply once a member is eligible for unreduced retirement.
5) Salary Increase Rate
Wage inflation component: 3.25%.
The following merit component is added to wage inflation, based on an individual member's years ofservice:
Fire Department - Merit Salary Increases
Years ofService
Merit/Longevity
Years ofService
Merit/Longevity
Years ofService
Merit/Longevity
0 6.50% 4 4.50% 8 1.25%
1 6.25% 5 3.75% 9 1.00%
2 5.75% 6 2.75% 10 0.75%
3 5.25% 7 1.75% 11+ 0.50%
6) Percent of Retirees Electing Coverage
70% of active members are assumed to elect coverage upon retirement and 30% are assumed to enterthe In-Lieu credit program. 50% of term vested members are assumed to elect coverage uponretirement and 50% are assumed to enter the In-Lieu credit program. Retirees are assumed to continuein their current plan.
Comprehensive Annual Financial Report 2019-2020 San José Police & Fire Retirement Plan 174

Actuarial Assumptions and Methods (continued)
FIRE POSTEMPLOYMENT HEALTHCARE (continued)
Members who elect to receive the In-Lieu credits are assumed to remain in the In-Lieu credit program for5 years, after which they are assumed to elect coverage and use their In-Lieu credits. Their medical tierelection assumptions are provided in the following table.
Assumed Medical Tier Elections for Future Retirees who Elect In-Lieu Coverage1
Pre-Medicare Retirees % Electing Medicare-Eligible Retirees % ElectingRetiree only 25% Retiree only 60%
Retiree plus spouse 25% Retiree plus spouse 40%
Retiree plus family 50% Retiree plus family 0%1Eligible for coverage
The Sutter Health and Blue Shield plans will no longer be offered as of January 1, 2020. They arereplaced with Anthem plan options effective January 1, 2020.
Retirees who are not yet age 65 are assumed to be eligible for Medicare when they reach age 65 andare assumed to enroll in the Medicare-eligible plan corresponding to their current pre-Medicare planelection. Future retirees are assumed to elect plans in the proportion shown in the following table.
Fire Department - Assumed Plan Elections for Future Retirees1
Pre-MedicareMedical Plans % Electing
Medicare - EligibleMedical Plans % Electing
Kaiser DHMO 8% Kaiser Senior Advantage 41%
Kaiser $25 Co-pay 56% Anthem Medicare HMO 6%
Kaiser HDHP 5% Anthem Medicare PPO 53%
Anthem DHMO 1%
Anthem $20 co-pay 7%
Anthem HDHP PPO 0% Dental Plans (All Retirees) % Electing
Anthem Select PPO 0% Delta Dental PPO 99%
Anthem Classic PPO 23% DeltaCare HMO 1%
1Eligible for coverage and elect coverage
7) Enrollment by Rating Tier
For current retirees, their actual enrollment by rating tier is used to value the explicit subsidy. 100% ofemployees with a spouse will elect spouse coverage in a dental plan at retirement. For future retirees,the following assumptions are used:
Fire Department - Assumed Rating Tier Elections for Future Retirees
Pre-Medicare Medical Plans Single Employee / Spouse Employee / Child Family
Males 20% 34% 7% 39%
Females 52% 13% 22% 13%
Medicare Medical Plans
Males 27% 73% 0% 0%
Females 74% 26% 0% 0%
8) Married Percentage
Fire Department - Percentage Married
Males Females
Percentage 85% 85%
175 Comprehensive Annual Financial Report 2019-2020 San José Police & Fire Retirement Plan

Actuarial Assumptions and Methods (continued)
FIRE POSTEMPLOYMENT HEALTHCARE (continued)
9) Dependent Age
For current retirees, actual spouse date of birth was used when available. For future retirees, husbandsare assumed to be three years older than their wives.
10) Administrative Expenses
For FYE 2021, trust administrative expenses are assumed to equal $41 per full benefit member and areassumed to increase at the wage inflation assumption of 3.25% per annum.
11) Changes Since Last Valuation
In-Lieu elections and the administrative expense assumption were updated.
Demographic assumptions were updated based on the most recent experience study covering theperiod through June 30, 2019. Please refer to the full experience study report for detail on the specificchanges.
Claim and Health Plan Benefit Expense Assumptions
The claim and expense assumptions shown below were adopted by the Board of Administration at theJanuary 9, 2020 Board meeting based upon the actuary's recommendations.
The claims costs are based on the fully insured premiums charged to the City for the active and retireepopulation in 2019 and 2020. For non-Medicare adults, the premiums for each coverage tier (retireeonly, retiree plus spouse, retiree plus child(ren), and retiree plus family) were blended based onenrollment data for the 2019 calendar year. The same process was used for Medicare adults, exceptonly Medicare-eligible retirees were included. The resulting per person per month (PPPM) cost was thenadjusted using age curves. The pre-Medicare adult claims curves were then loaded for the cost ofchildren; the load for children decreases by retiree age since older retirees have fewer children. Theimpact of children on Medicare costs was assumed to be de minimis. All claims costs are developedseparately for the Federated, Police, and Fire Postemployment Healthcare Plans of the City of SanJosé.
This report does not reflect future changes in benefits, penalties, taxes, or administrative costs that maybe required as a result of the Patient Protection and Affordable Care Act of 2010 related legislation andregulations.
1) Average Annual Claims and Expense Assumptions
The following claim and expense assumptions were developed as of July 1, 2019 based on thepremiums for 2019 and 2020. The explicit subsidy amount (100% of the premium for the lowest costhealth plan available to active City employees) is assumed to grow based on the pre-Medicare cost trendrates.
The following tables show the claims costs for each medical plan as of the valuation date:
FIRE DEPARTMENT - SAMPLE CLAIMS COSTS - NON- MEDICARE ELIGIBLE
Kaiser DHMO Kaiser $25 Co-Pay Kaiser HDHP
Age Male Female Male Female Male Female
40 $ 6,607 $ 8,184 $ 10,184 $ 12,496 $ 6,594 $ 8,053
45 6,817 8,036 10,392 12,178 6,692 7,819
50 7,273 8,264 10,959 12,412 7,016 7,933
55 8,123 8,821 12,105 13,129 7,705 8,352
60 9,567 9,326 14,122 13,768 8,944 8,721
64 11,315 9,207 16,604 13,515 10,484 8,534
Comprehensive Annual Financial Report 2019-2020 San José Police & Fire Retirement Plan 176

Actuarial Assumptions and Methods (continued)
FIRE POSTEMPLOYMENT HEALTHCARE (continued)
FIRE DEPARTMENT - SAMPLE CLAIMS COSTS-NON-MEDICARE ELIGIBLE
Sutter / Anthem DHMO Sutter / Anthem $20 Co-Pay Blue Shield / Anthem PPO
Age Male Female Male Female Male Female
40 $ 9,456 $ 11,559 $ 10,701 $ 13,118 $ 14,575 $ 18,382
45 9,606 11,230 10,908 12,775 15,360 18,301
50 10,082 11,402 11,489 13,008 16,736 19,127
55 11,083 12,014 12,676 13,747 19,064 20,750
60 12,876 12,555 14,773 14,403 22,825 22,243
64 15,101 12,292 17,359 14,129 27,265 22,179
FIRE DEPARTMENT - SAMPLE CLAIMS COSTS - MEDICARE ELIGIBLE
Kaiser Senior AdvBlue Shield /
Anthem Med PPOBlue Shield /Anthem HMO
Age Male Female Male Female Male Female
65 $ 3,288 $ 2,900 $ 5,607 $ 4,946 $ 5,936 $ 5,236
70 3,491 2,957 5,954 5,043 6,303 5,338
75 4,013 3,326 6,843 5,671 7,245 6,004
80 4,557 3,771 7,770 6,431 8,226 6,808
85 4,921 4,121 8,392 7,028 8,884 7,440
FIRE DEPARTMENT - SAMPLE CLAIMS COSTS - DENTAL
Delta Dental PPO DeltaCare HMO
Age Male Female Male Female
All $ 727 $ 727 $ 316 $ 316
2) Medicare Part D Subsidy
Per GASB guidance, the Part D Subsidy has not been reflected in this valuation.
3) Medicare Part B
All Medicare eligible retirees are assumed to participate in Medicare Part B.
4) Medicare Eligibility
All retirees who turn age 65 are assumed to be eligible for Medicare.
5) Annual Limits
Assumed to increase at the same rate as trend.
6) Lifetime Maximums
Are not assumed to have any financial impact.
7) Geography
Implicitly assumed to remain the same as current retirees.
8) Retiree Contributions
Retirees pay the difference between the actual premium for the elected plan and the lowest cost medicalplan available to active members, if the retiree is eligible to receive the explicit subsidy. No retireecontributions are required for dental.
177 Comprehensive Annual Financial Report 2019-2020 San José Police & Fire Retirement Plan

Actuarial Assumptions and Methods (continued)
FIRE POSTEMPLOYMENT HEALTHCARE (continued)
9) Changes Since Last Valuation
All claims costs were updated to reflect the changes in plan premiums and the populations covered.
Contribution Allocation Procedure
The contribution allocation procedure primarily consists of an actuarial cost method, an asset smoothingmethod, and an amortization method as described below.
1) Actuarial Cost Method
The Entry Age actuarial cost method was used for active employees, whereby the normal cost iscomputed as the level annual percentage of pay required to fund the retirement benefits between eachmember’s date of hire and assumed retirement. The actuarial liability is the difference between thepresent value of future benefits and the present value of future normal costs. Or, equivalently, it is theaccumulation of normal costs for all periods prior to the valuation date. The normal cost and actuarialliability are calculated on an individual basis. The sum of the individual amounts is the normal cost andactuarial liability for the Plan. The actuarial liability for the Plan represents the target amount of assetsthe Plan should have as of the valuation date according to the actuarial cost method.
2) Asset Valuation Method
The Actuarial Value of Assets equals the Fair Value of Assets.
3) Amortization Method
The unfunded actuarial liability is the difference between the actuarial liability and the actuarial value ofassets. The Unfunded Actuarial Liability as of June 30, 2017 was amortized as a level percent of payrollover a closed 25-year period. All future amortization bases will be amortized over 25-year periods with a3-year phase-in and phase-out.
4) Contributions
The City will contribute the annual implicit subsidy as part of active employee health premiums and willprefund the explicit subsidy based on the normal cost, administrative expenses and amortizationpayment described above less expected employee contributions. The City has the option to limit itscontribution to no more than 11% of total payroll.
Active members that are eligible for full benefits will contribute 8% of pay.
5) Changes Since Last Valuation
None.
FIRE DEPARTMENT - SCHEDULE OF ACTIVE MEMBER DATA
Active Member Counts Annual Average PercentChange
Valuation Date Under Age 65 Age 65+ Total Payroll Annual Pay in Average Pay
6/30/2019 662 - 662 $ 88,952,979 $ 134,370 3.1%
6/30/2018 664 - 664 86,541,114 130,333 1.0%
6/30/2017 646 - 646 83,370,711 129,057 4.3%
6/30/2016 671 - 671 83,043,310 123,761 7.5%
6/30/2015 648 - 648 74,613,261 115,144 0.5%
6/30/2014 657 - 657 75,241,817 114,523 3.9%
6/30/2013 679 - 679 74,861,955 110,253 9.4%
6/30/2012 642 - 642 64,696,203 100,773 (10.5)%
6/30/2011 613 - 613 68,990,536 112,546 (12.6)%
6/30/2010 725 1 726 93,453,215 128,723
Comprehensive Annual Financial Report 2019-2020 San José Police & Fire Retirement Plan 178

Actuarial Assumptions and Methods (continued)
FIRE POSTEMPLOYMENT HEALTHCARE (continued)
FIRE DEPARTMENT - SCHEDULE OF RETIREES AND BENEFICIARIES ADDED TO AND REMOVED FROM ROLLS
Beginning of Period
Added
to RollsRemovedfrom Rolls End of Period Net change % Increase Average
Period Count
Annual
Subsidy Count Count Count
Annual
Subsidy Count
Annual
Subsidy
in Annual
Subsidy
Annual
Subsidy
Medical
2018-19 803 $ 6,518,064 27 31 799 $ 6,790,517 (4) $ 272,453 4.2% $ 8,499
2017-18 776 7,455,411 47 20 803 6,518,064 27 (937,347) (12.6)% 8,117
2016-17 752 6,976,403 42 18 776 7,455,411 24 479,008 6.9% 9,607
2015-16 758 6,965,107 28 34 752 6,976,403 (6) 11,296 0.2% 9,277
2014-15 743 7,095,176 35 20 758 6,965,107 15 (130,068) (1.8)% 9,189
2013-14 749 7,736,739 29 35 743 7,095,176 (6) (641,564) (8.3)% 9,549
2012-13 752 8,665,479 28 31 749 7,736,739 (3) (928,740) (10.7)% 10,329
2011-12 745 8,838,250 30 23 752 8,665,479 7 (172,771) (2.0)% 11,523
2010-11 N/A N/A N/A N/A 745 8,838,250 N/A N/A N/A N/A
2009-10 N/A N/A N/A N/A N/A N/A N/A N/A N/A N/A
Dental
2018-19 828 $ 961,884 26 26 828 $ 963,334 0 $ 1,450 0.2% $ 1,163
2017-18 808 942,196 39 19 828 961,884 20 19,688 2.1% 1,162
2016-17 798 893,441 30 20 808 942,196 10 48,756 5.5% 1,166
2015-16 793 891,245 23 18 798 893,441 5 2,195 0.2% 1,120
2014-15 778 875,826 29 14 793 891,245 15 15,420 1.8% 1,124
2013-14 779 948,537 23 24 778 875,826 (1) (72,711) (7.7)% 1,126
2012-13 785 1,014,672 18 23 779 948,537 (6) (66,135) (6.5)% 1,218
2011-12 770 994,744 20 7 785 1,014,672 15 19,928 2.0% 1,293
2010-11 N/A N/A N/A N/A 770 994,744 N/A N/A N/A N/A
2009-10 N/A N/A N/A N/A N/A N/A N/A N/A N/A N/A
Annual subsidies are explicit amounts
179 Comprehensive Annual Financial Report 2019-2020 San José Police & Fire Retirement Plan

Actuarial Assumptions and Methods (continued)
FIRE POSTEMPLOYMENT HEALTHCARE (continued)
FIRE DEPARTMENT - MEMBER BENEFIT COVERAGE INFORMATION
Actuarial Liability
ActuarialValuation Date
Retirees andVested
Terminated Active MembersFair Value of
Assets1
Portion of Liability Covered byActuarial Value of Assets
(A) (B) (A) (B)
6/30/2019 $ 154,885 $ 103,007 $ 60,967 39% 0%
6/30/2018 161,946 113,510 50,861 31% 0%
6/30/2017 147,204 101,704 42,591 29% 0%
6/30/2016 164,063 118,866 37,795 23% 0%
6/30/2015 161,381 108,049 29,243 18% 0%
6/30/2014 153,132 97,108 23,503 15% 0%
6/30/2013 153,366 95,261 17,203 11% 0%
6/30/2012 225,919 127,862 16,587 7% 0%
6/30/2011 240,872 118,249 17,600 7% 0%
6/30/2010 210,538 125,189 N/A N/A N/A
1Actuarial value of assets for 6/30/2016 and earlier Dollar amounts in thousands
FIRE DEPARTMENT - ANALYSIS OF FINANCIAL EXPERIENCE
Gain or (Loss) for the Year Ending on Valuation Date Due to:
ActuarialValuation Date
InvestmentIncome
CombinedLiability
ExperienceTotal Financial
ExperienceAssumption
Change
Total
Experience6/30/2019 $ (1,205) $ 34,915 $ 33,710 $ (1,749) $ 31,961
6/30/2018 (1,548) (311) (1,859) (13,568) (15,427)
6/30/2017 2,647 (15,108) (12,461) 29,245 16,784
6/30/2016 (2,914) (2,828) (5,642) 4,864 (778)
6/30/2015 582 7,990 8,572 (3,449) 5,123
6/30/2014 2,802 16,222 19,024 13,689 32,713
6/30/2013 2,437 (4,536) (2,099) 258,939 256,840
6/30/2012 (6,011) 4,760 (1,251) 58,173 56,922
6/30/2011 (2,661) 5,967 3,306 1,146 4,452
6/30/2010 (3,067) (11,242) (14,309) (122,599) (136,908)
The analysis was combined for Police and Fire for 6/30/2017 and earlier Dollar amount in thousands
Comprehensive Annual Financial Report 2019-2020 San José Police & Fire Retirement Plan 180

Actuarial Assumptions and Methods (continued)
FIRE POSTEMPLOYMENT HEALTHCARE (continued)
The schedule of funding progress compares the assets used for funding purposes to the comparableliabilities to determine how well the Plan is funded and how this status has changed over the pastseveral years. The actuarial liability is compared to the actuarial value of assets to determine thefunding ratio. Since the June 30, 2017 valuation, the actuarial value of assets is equal to the fair valueof assets.
FIRE DEPARTMENT - SCHEDULE OF FUNDING PROGRESS
ActuarialValuation Date
Actuarial Valueof Assets
ActuarialLiability
UnfundedActuarial
Liability (UAL) Funded Ratio
AnnualCoveredPayroll
UAL as aPercentage of
CoveredPayroll
(a) (b) (b-a) (a / b) (c) ((b-a) / c)
6/30/2019 $ 60,967 $ 257,891 $ 196,925 23.6% $ 88,953 221%
6/30/2018 50,861 275,456 224,595 18.5% 86,541 260%
6/30/2017 42,591 248,908 206,317 17.1% 83,517 247%
6/30/2016 37,795 282,929 245,134 13.4% 83,043 295%
6/30/2015 29,243 269,430 240,187 10.9% 74,950 320%
6/30/2014 23,503 250,239 226,736 9.4% 75,242 301%
6/30/2013 17,203 248,627 231,424 6.9% 74,862 309%
6/30/2012 16,587 353,781 337,194 4.7% 64,696 521%
6/30/2011 17,600 359,121 341,521 4.9% 68,991 495%
6/30/2010 N/A 335,727 N/A N/A N/A N/A
Dollar amounts in thousands
181 Comprehensive Annual Financial Report 2019-2020 San José Police & Fire Retirement Plan

Summary of Key Substantive Plan Provisions
FIRE POSTEMPLOYMENT HEALTHCARE
Eligibility
Employees hired before July 2013 that did not elect to opt-in to the Voluntary Employees' BeneficiaryAssociation (VEBA).
Medical/Dental:
Employees who retire (include deferred vested members) with at least 15 years of service with the City(“OPEB benefit service”), or with a monthly pension equal to at least 37.5% of final compensation, areeligible to elect medical coverage upon retirement. Tier 1 employees (hired before August 4, 2013) areeligible for unreduced service retirement at age 55 with 20 years of service, age 50 with 25 years ofservice, age 70 with no service requirement, or any age with 30 years of service. Reduced serviceretirement is available at age 50 with 20 years of service. Service credited through reciprocityagreements counts towards an employee’s required service to retire, but only service with the Citycounts towards the required years of service to receive OPEB benefits.
Employees who become disabled with at least 15 years of service or have a monthly pension equal to atleast 37.5% of final compensation are eligible to elect medical coverage upon retirement.
Spouses or domestic partners of retired members are allowed to participate if they were enrolled in theCity’s medical plan at the time of the member’s retirement. Dependent children are eligible to receivecoverage until the age of 26.
Surviving spouses/domestic partners/children of deceased members are eligible for coverage if thefollowing conditions are met:
1. The employee has 15 years of service at time of death or is entitled to a monthly pension of at least 37.5% of final compensation; and,
2. Both the member and the survivors were enrolled in the active medical plan immediately before death; and,
3. The survivor will receive a monthly pension benefit.
Employees who separate from service after July 5, 1992, with 20 years of service, leaving contributionsin the retirement plan, are eligible to elect medical and/or dental coverage upon retirement.
Benefits for Retirees
Medical:
The Retirement Plan, through the medical benefit account, pays 100% of the premium for the lowestcost health plan available to active City employees. The member pays the difference, if another plan iselected.
To the extent that the elected plan premium is less than the maximum subsidy amount, Medicare-eligibleretirees receive reimbursement of Medicare Part B premiums for themselves and their covered spouse,if applicable.
Dental:
The Retirement Plan, through the medical benefit account, pays 100% of the dental insurancepremiums.
Comprehensive Annual Financial Report 2019-2020 San José Police & Fire Retirement Plan 182

Summary of Key Substantive Plan Provisions (continued)
FIRE POSTEMPLOYMENT HEALTHCARE (continued)
Premiums:
Monthly premiums before adjustments for 2019 and 2020 are as follows.
FIRE DEPARTMENT - 2019 MONTHLY PREMIUMS
SingleEmployee /
SpouseEmployee /
Child Family
Medical
Non-Medicare Monthly Rates
Kaiser DHMO $ 528.20 $ 1,056.40 $ 924.36 $ 1,584.60
Kaiser $25 Co-pay 645.08 1,290.16 1,128.88 1,935.24
Kaiser HDHP 445.04 890.08 778.82 1,335.12
Blue Shield PPO $25 Co-pay 1,435.38 2,870.74 2,511.94 4,306.12
Sutter Health $20 Co-pay 652.28 1,304.56 1,141.44 1,956.78
Sutter Health DHMO 534.06 1,068.12 934.56 1,602.12
Sutter Health Vista 445.74 891.50 780.04 1,337.22
Medicare-Eligible Monthly Rates
Kaiser Senior Advantage $ 300.80 $ 601.60 $ 601.60 $ 902.40
Blue Shield Medicare PPO 528.57 1,057.14 1,057.14 1,585.71
Blue Shield Medicare HMO 602.56 1,205.12 1,205.12 1,807.68
Dental
Delta Dental PPO $ 50.88 $ 111.92 $ 122.12 $ 157.72
DeltaCare HMO 24.44 48.86 42.74 73.30
Blue Shield HMO Medicare family rates assume the children are on the Non-Medicare $20 Co-pay HMO.
FIRE DEPARTMENT - 2020 MONTHLY PREMIUMS
SingleEmployee /
SpouseEmployee /
Child Family
Medical
Non-Medicare Monthly Rates
Kaiser DHMO $ 574.36 $ 1,148.72 $ 1,005.14 $ 1,723.08
Kaiser $25 Co-pay 701.46 1,402.92 1,227.54 2,104.38
Kaiser HDHP 483.94 967.88 846.90 1,451.82
Antherm HMO $25 co-pay 671.12 1,476.46 1,208.02 2,080.46
Anthem DHMO 517.42 1,138.34 931.36 1,604.02
Anthem HDHP 905.36 1,991.82 1,629.66 2,806.66
Anthem Selelct PPO 1,469.66 3,233.24 2,645.38 4,555.94
Anthem Classic PPO 1,571.82 3,458.02 2,829.28 4,872.66
Medicare-Eligible Monthly Rates
Kaiser Senior Advantage $ 289.14 $ 578.28 $ 578.28 $ 867.42
Anthem Medicare PPO 508.56 1,017.12 1,017.12 1,525.68
Anthem Medicare HMO 453.55 907.10 907.10 1,360.65
Dental
Delta Dental PPO $ 50.88 $ 111.92 $ 122.12 $ 157.72
DeltaCare HMO 24.44 48.86 42.74 73.30
183 Comprehensive Annual Financial Report 2019-2020 San José Police & Fire Retirement Plan

Summary of Key Substantive Plan Provisions (continued)
FIRE POSTEMPLOYMENT HEALTHCARE (continued)
FIRE DEPARTMENT - SUMMARY OF 2020 BENEFIT PLANS
Non-MedicarePlans:
KaiserHigh
DeductibleKaiserDHMO
Kaiser $25Co-Pay
Anthem$20
Co-payHMO
AnthemDHMO
AnthemSelect PPO
(In-Network)
AnthemClassicPPO(In-Network)
AnthemHigh
Deductible(In-Network)
Annual out-of-
maximum
(single / family)
$5,950 /
$11,900
$4,000 /
$8,000
$1,500 /
$3,000
$1,500 /
$3,000
$4,000 /
$8,000
$2,100 /
$4,200
$2,100 /
$4,200
$4,000 /
$8,000
Annual
deductible
(single / family)
$3,000 /
$6,000
$1,500 /
$3,000 None None
$1,500 /
$3,000
$100 /
$200
$100 /
$200
$2,500 /
$5,000
Office visit
co-pay 30%1 $40 $25 $20 $20 $25 $25 20%1
Emergency
room co-pay 30%1 30%1 $100 $100 30%1 $100 $100 20%1
Hospital care
co-pay 30%1 30%1 $100 $100 30%1 10%1 10%1 20%1
Prescription Drug retail co-pay (30-day supply):
Generic $10 $10 $10 $10 $10 $10 $10 $10
Brand $30 $30 $25 $30 $30 $25 $25 $30
Non-formulary N/A N/A N/A $60 $60 $40 $40 $60
1After deductible is paid
Medicare-Eligible Plans: Kaiser Anthem HMO Anthem PPO
Annual out-of-pocket maximum (single / family)
$1,500 /
$3,000
$1,000 per
person $0
Annual deductible None None None
Office visit co-pay $25 $25 $0
Emergency room co-pay $50 $100 $0
Hospital care co-pay $250 $100 $0
Prescription Drug retail co-pay (30-day supply)
Generic $10 $10 $10
Brand $10 $25 $25
Non-formulary N/A $40 $40
Comprehensive Annual Financial Report 2019-2020 San José Police & Fire Retirement Plan 184

Summary of Key Substantive Plan Provisions (continued)
FIRE POSTEMPLOYMENT HEALTHCARE (continued)
Cost Sharing Provisions
It is assumed for the purpose of this valuation that the City of San José will in the future maintain aconsistent level of cost sharing for benefits with the retirees. This may be achieved by adjusting benefitprovisions, contributions or both.
CATASTROPHIC DISABILITY HEALTHCARE PROGRAM
Eligibility: Employees hired after June 2013 or employees who elected to opt-in to the Voluntary Employees' Beneficiary Association (VEBA).
Contributions: Employees are required to make mandatory contributions into the VEBA on a pre-tax basis.
Medical: VEBA funds can be used to reimburse members for eligible healthcare expenses.
VEBA members on service-connected disability will receive benefits from the Postemployment Healthcare Plan only up to age 65 once VEBA funds exhausted.
185 Comprehensive Annual Financial Report 2019-2020 San José Police & Fire Retirement Plan

Statistical�Section
City�of�San�José�Police�and�Fire�Department�Retirement�Plan
Comprehensive�Annual�Financial�Report�for�the�Fiscal�Years�ended�June�30,�2020�and�June�30,�2019
Pension�Trust�and�Postemployment�Healthcare�Trust��
Funds�of�the�City�of�San�José,�California
The�Statistical�Section�provides�additional�historical�perspective,�
context,�and�detail�in�order�to�provide�a�more�comprehensive�
XQGHUVW�QGLQJ�RI�WKLV�¿VF�O�\H�U¶V�¿Q�QFL�O�VW�WHPHQWV��QRWH�
GLVFORVXUHV���QG�VXSSOHPHQW�U\�LQIRUP�WLRQ��ZKLFK�FRYHUV�
3HQVLRQ�3O�Q��QG�3RVWHPSOR\PHQW�+H�OWKF�UH�3O�QV��LQFOXGLQJ�
����K���QG��� ��7KLV�VHFWLRQ��OVR�SURYLGHV���PXOWL�\H�U�WUHQG�RI�
¿Q�QFL�O��QG�RSHU�WLQJ�LQIRUP�WLRQ�WR�I�FLOLW�WH�FRPSUHKHQVLYH�
XQGHUVW�QGLQJ�RI�KRZ�WKH�RUJ�QL]�WLRQ¶V�¿Q�QFL�O�SRVLWLRQ��QG�
SHUIRUP�QFH�K�V�FK�QJHG�RYHU�WLPH��0RUH�VSHFL¿F�OO\��WKH�
¿Q�QFL�O��QG�RSHU�WLQJ�LQIRUP�WLRQ�SURYLGHV�FRQWH[WX�O�G�W��IRU�
WKH�3O�Q¶V�QHW��VVHWV��'HQH¿WV��UHIXQGV��FRQWUL'XWLRQ�U�WHV���QG�
GLIIHUHQW�W\SHV�RI�UHWLUHPHQW�'HQH¿WV��7KH�¿Q�QFL�O��QG�RSHU�WLQJ�
WUHQG�LQIRUP�WLRQ�LV�ORF�WHG�RQ�WKH�IROORZLQJ�S�JHV�

Statistical Review
CHANGES IN PLAN NET POSITION FOR FISCAL YEARS 2011 - 2020 (In Thousands)
DEFINED BENEFIT PENSION PLAN (Schedule 1a)
2020 2019 2018 2017 2016 2015 2014 2013 2012 2011Additions
Employeecontributions $ 27,645 $ 24,811 $ 23,841 $ 20,580 $ 21,508 $ 20,747 $ 21,115 $ 20,227 $ 19,345 $ 29,629
Employercontributions 188,481 176,618 157,712 136,957 132,480 129,279 123,583 105,234 121,009 77,918
Investment income /(loss) 1 134,085 114,179 233,475 292,734 (29,206) (27,690) 404,978 248,725 (34,341) 396,377
Total additions toplan net position 350,211 315,608 415,028 450,271 124,782 122,336 549,676 374,186 106,013 503,924
DeductionsBenefit payments 216,206 204,652 194,139 184,596 176,029 166,331 157,635 150,811 142,314 129,472
Death benefits 14,238 13,162 12,102 11,072 10,083 9,220 8,738 8,005 7,480 7,213
Refunds 564 194 389 364 828 702 1,024 886 1,926 435
Administrativeexpenses and other 5,605 5,369 5,464 4,635 4,254 4,191 3,631 3,423 3,556 3,127
Total deductions fromplan net position 236,613 223,377 212,094 200,667 191,194 180,444 171,028 163,125 155,276 140,247
Changes in Plan NetPosition $ 113,598 $ 92,231 $ 202,934 $ 249,604 $ (66,412)$ (58,108)$ 378,648 $ 211,061 $ (49,263)$ 363,677
1Net of expenses
187 Comprehensive Annual Financial Report 2019-2020 San José Police & Fire Retirement Plan

Statistical Review (continued)
CHANGES IN PLAN NET POSITION FOR FISCAL YEARS 2011 - 2020 (In Thousands)
POST EMPLOYMENT HEALTHCARE PLANS (Schedule 1b)
2020 2019 2018 2017Post-
employ-ment
Health-care
401(h)
PoliceDept
Health-careSub-trust
FireDept
Health-careSub-trust
Post-employ-ment
Health-care
401(h)
PoliceDept
Health-careSub-trust
FireDept
Health-careSub-trust
Post-employ-ment
Health-care
401(h)
PoliceDept
Health-careSub-trust
FireDept
Health-careSub-trust
Post-employ-ment
Health-care
401(h)
PoliceDept
Health-careSub-trust
FireDept
Health-careSub-trust
Additions
Employee contributions $ 13,135 $ - $ - $ 13,315 $ - $ - $ 16,127 $ - $ - $18,116 $ - $ -
Employer contributions 3,347 14,595 9,408 5,716 14,086 8,942 5,716 11,265 8,401 1,599 10,905 8,163
Investment income / (loss) 1 1,220 3,722 2,301 1,288 4,099 2,520 3,058 2,511 1,502 4,278 5,220 2,955
Total additions 17,702 18,317 11,709 20,319 18,185 11,462 24,901 13,776 9,903 23,993 16,125 11,118
Deductions
Healthcare insurance premiums 25,031 - - 26,403 - - 27,686 - - 24,799 - -
Administrative expenses and other 72 31 19 80 28 18 75 55 29 69 71 42
VEBA transfer - - - - - - - 5,276 2,621 - - -
Total deductions 25,103 31 19 26,483 28 18 27,761 5,331 2,650 24,868 71 42
Change in Plan Net Position $ (7,401)$ 18,286 $ 11,690 $ (6,164)$ 18,157 $ 11,444 $ (2,860)$ 8,445 $ 7,253 $ (875)$(16,054)$ 11,076
2016 2015 2014 2013 2012 2011Post-
employ-ment
Health-care
401(h)
PoliceDept
Health-careSub-trust
FireDept
Health-careSub-trust
Post-employ-ment
Health-care
401(h)
PoliceDept
Health-careSub-trust
FireDept
Health-careSub-trust
Post-employ-ment
Health-care
401(h)
PoliceDept
Health-careSub-trust
FireDept
Health-careSub-trust
Post-employ-ment
Health-care
401(h)
PoliceDept
Health-careSub-trust
Post-employ-ment
Health-care
401(h)
Post-employ-ment
Health-care
401(h)
Post-employ-ment
Health-care
401(h)
AdditionsEmployee contributions $ 18,007 $ - $ - $ 17,017 $ - $ - $ 15,674 $ - $ - $ 13,498 $ - $ - $ 11,474 $ 11,229
Employer contributions 1,389 11,576 8,100 - 13,073 7,837 - 11,712 5,555 - 11,074 4,734 21,205 17,001
Investment income / (loss) 1 (465) (798) (420) (499) (753) (363) 7,942 3,210 1,443 5,613 588 246 (805) 8,966
Total additions 18,931 10,778 7,680 16,518 12,320 7,474 23,616 14,922 6,998 19,111 11,662 4,980 31,874 37,196
DeductionsHealthcare insurance Premiums 23,449 - - 24,205 - - 22,510 - - 23,934 - - 28,479 28,273
Administrative expenses and other 74 44 21 82 24 17 73 15 15 78 - - 87 73
Total deductions 23,523 44 21 24,287 24 17 22,583 15 15 24,012 - - 28,566 28,346
Change in Plan Net position $ (4,592)$ 10,734 $ 7,659 $ (7,769)$ 12,296 $ 7,457 $ 1,033 $ 14,907 $ 6,983 $ (4,901)$ 11,662 $ 4,980 $ 3,308 $ 8,850
1Net of expenses
Comprehensive Annual Financial Report 2019-2020 San José Police & Fire Retirement Plan 188

Statistical Review (continued)
BENEFIT AND REFUND DEDUCTIONS FROM PLAN NET POSITION BY TYPE (In Thousands)
PENSION BENEFITS (Schedule 2a)
Type of Benefit 2020 2019 2018 2017 2016 2015 2014 2013 2012 2011
Age and Service Benefits Retirees - service $ 119,030 $ 109,078 $ 101,338 $ 96,317 $ 90,944 $ 86,672 $ 83,664 $ 80,902 $ 77,239 $ 68,780
Retirees - deferredvested 6,171 5,499 4,983 4,352 3,730 3,056 2,873 2,522 2,184 1,948
Survivors - service 4,556 3,870 3,321 2,815 2,537 2,201 1,826 1,566 1,402 1,301
Survivors -deferred vested 201 99 110 105 97 78 62 60 59 51
Death in ServiceBenefits 1,772 1,721 1,722 1,713 1,606 1,493 1,396 1,502 1,366 1,246
Disability BenefitsRetirees - duty 86,198 84,239 81,874 78,801 76,440 71,980 66,865 63,410 59,108 55,998
Retirees - non-duty 1,607 1,876 1,130 973 928 903 903 748 770 674
Survivors - duty 7,355 7,072 6,567 6,076 5,532 5,135 5,022 4,587 4,328 3,888
Survivors - non-duty 323 318 312 266 230 235 274 265 266 124
Ex-Spouse
Benefits 3,231 4,042 4,884 4,249 4,068 3,798 3,488 3,254 3,072 2,675
Total Benefits 230,444 217,814 206,241 195,667 186,112 175,551 166,373 158,816 149,794 136,685
Type of Refund Separation 564 194 389 364 828 1,024 886 1,926 435 196
Total Refunds $ 564 $ 194 $ 389 $ 364 $ 828 $ 1,024 $ 886 $ 1,926 $ 435 $ 196
Source: Pension Administration System
189 Comprehensive Annual Financial Report 2019-2020 San José Police & Fire Retirement Plan
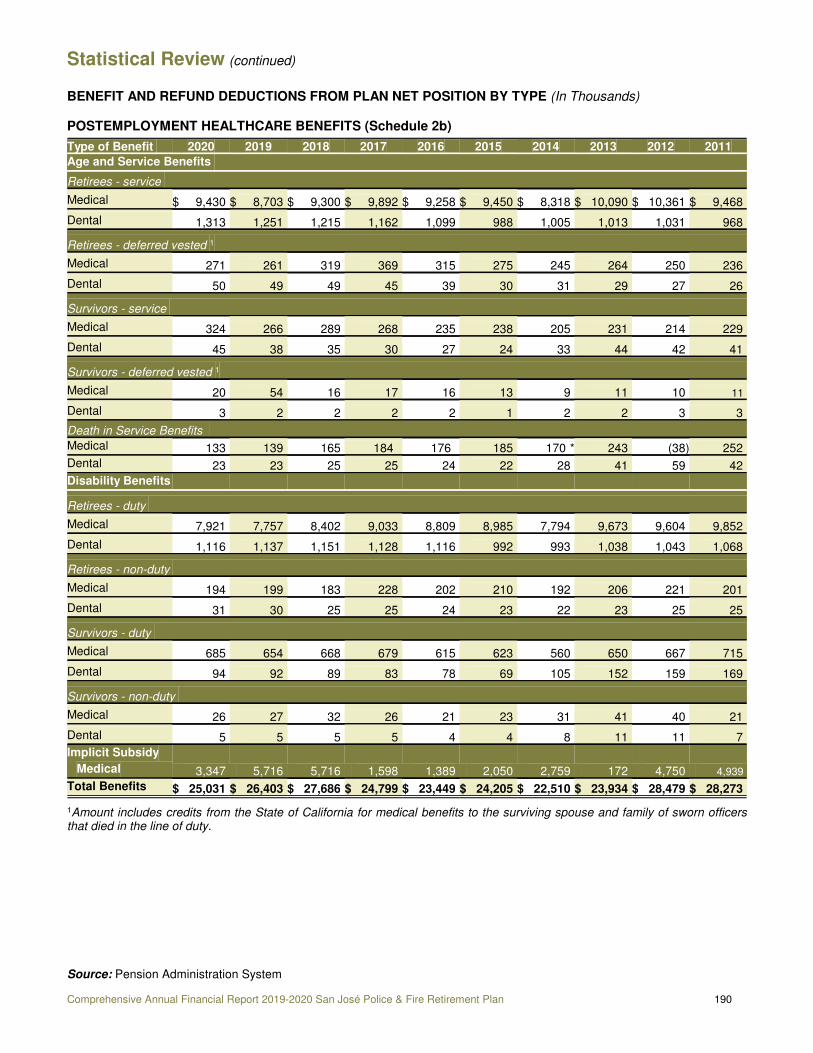
Statistical Review (continued)
BENEFIT AND REFUND DEDUCTIONS FROM PLAN NET POSITION BY TYPE (In Thousands)
POSTEMPLOYMENT HEALTHCARE BENEFITS (Schedule 2b)
Type of Benefit 2020 2019 2018 2017 2016 2015 2014 2013 2012 2011Age and Service Benefits
Retirees - service
Medical $ 9,430 $ 8,703 $ 9,300 $ 9,892 $ 9,258 $ 9,450 $ 8,318 $ 10,090 $ 10,361 $ 9,468
Dental 1,313 1,251 1,215 1,162 1,099 988 1,005 1,013 1,031 968
Retirees - deferred vested 1
Medical 271 261 319 369 315 275 245 264 250 236
Dental 50 49 49 45 39 30 31 29 27 26
Survivors - service
Medical 324 266 289 268 235 238 205 231 214 229
Dental 45 38 35 30 27 24 33 44 42 41
Survivors - deferred vested 1
Medical 20 54 16 17 16 13 9 11 10 11
Dental 3 2 2 2 2 1 2 2 3 3
Death in Service Benefits
Medical 133 139 165 184 176 185 *170 243 (38) 252
Dental 23 23 25 25 24 22 28 41 59 42
Disability Benefits
Retirees - duty
Medical 7,921 7,757 8,402 9,033 8,809 8,985 7,794 9,673 9,604 9,852
Dental 1,116 1,137 1,151 1,128 1,116 992 993 1,038 1,043 1,068
Retirees - non-duty
Medical 194 199 183 228 202 210 192 206 221 201
Dental 31 30 25 25 24 23 22 23 25 25
Survivors - duty
Medical 685 654 668 679 615 623 560 650 667 715
Dental 94 92 89 83 78 69 105 152 159 169
Survivors - non-duty
Medical 26 27 32 26 21 23 31 41 40 21
Dental 5 5 5 5 4 4 8 11 11 7
Implicit SubsidyMedical 3,347 5,716 5,716 1,598 1,389 2,050 2,759 172 4,750 4,939
Total Benefits $ 25,031 $ 26,403 $ 27,686 $ 24,799 $ 23,449 $ 24,205 $ 22,510 $ 23,934 $ 28,479 $ 28,273
1Amount includes credits from the State of California for medical benefits to the surviving spouse and family of sworn officersthat died in the line of duty.
Source: Pension Administration System
Comprehensive Annual Financial Report 2019-2020 San José Police & Fire Retirement Plan 190

Statistical Review (continued)
EMPLOYER AND EMPLOYEE CONTRIBUTION RATES FOR FISCAL YEARS 2011-2020 (Schedule 3)
Fiscal YearEnded
Police Tier 1Employee Rate %
Police Tier 2Employee Rate %
Fire Tier 1Employee Rate %
Fire Tier 2Employee Rate %
2020 18.70% 14.06% 19.46% 15.53%
2019 18.28% 13.71% 19.09% 15.13%
Police Employer Rate Fire Employer RateFiscalYear
Ended
Tier 1Pension
%
Tier 1Minimum
Dollar Amount
Tier 2Pension
% Tier 1 / Tier 2
OPEB $
Tier 1Pension
%
Tier 1Minimum
Dollar Amount
Tier 2Pension
% Tier 1 / Tier 2
OPEB $2020 31.43% $30,375,726 14.06% $14,595,078 32.25% $23,917,358 15.53% $9,407,688
2019 97.55% N/A 13.71% $13,471,000 98.49% N/A 15.13% $8,591,000
Beginning fiscal year 2019, the Board approved the contribution policy that sets the City OPEB contributions as a flat dollaramount.
Police Department Rate Fire Department RateTier 1 Tier 2 Tier 1 Tier 2
FiscalYear
EndedEmployee
RateEmployer
RateEmployee
Rate Employer
Rate Employee
Rate Employer
Rate Employee
Rate Employer
Rate
% % % % % % % %
2018 18.88 105.62 15.17 25.48 19.38 106.68 16.26 26.88
2017 20.10 90.71 20.48 21.28 20.81 92.23 20.35 21.23
2016 20.77 83.32 20.78 21.58 21.57 85.57 20.90 21.79
2015 21.26 83.14 20.80 21.80 20.13 82.75 19.43 20.21
2014 21.15 75.63 20.49 21.29 19.07 74.75 N/A N/A
2013 19.39 65.53 N/A N/A 17.32 65.05 N/A N/A
2012 17.47 56.90 N/A N/A 15.62 56.32 N/A N/A
2011 15.57 44.58 N/A N/A 13.70 44.16 N/A N/A
191 Comprehensive Annual Financial Report 2019-2020 San José Police & Fire Retirement Plan

Retired Members by Type of Benefit
PENSION BENEFITSAs of June 30, 2020
Type of Retirement1 Option Selected 2
Monthly BenefitAmount
Number ofRetirees &
Beneficiaries 1 2 3 4 5 6 7 8 A B C D Total$1 - 500 8 0 0 3 0 0 0 2 3 5 0 3 0 8
$501 - 1,000 32 0 0 0 0 0 2 2 28 16 0 14 2 32
$1,001 - 1,500 39 0 0 1 0 6 3 6 23 15 6 18 0 39
$1,501 - 2,000 49 0 0 0 0 5 5 10 29 24 1 18 6 49
$2,001 - 2,500 69 1 0 3 1 12 15 8 29 41 0 25 3 69
$2,501 - 3,000 70 11 0 2 0 8 18 9 22 49 1 19 1 70
$3,001 - 3,500 78 17 0 0 1 11 23 10 16 54 1 19 4 78
$3,501 - 4,000 82 12 1 0 3 12 43 5 6 58 3 16 5 82
$4,001 - 4,500 81 21 0 1 6 7 28 5 13 67 3 8 3 81
$4,501 - 5,000 80 35 4 1 11 4 19 3 3 59 6 9 6 80
$5,001 - 5,500 86 46 3 6 9 2 13 4 3 55 8 14 9 86
$5,501 - 6,000 124 66 2 2 29 0 18 0 7 76 9 18 21 124
$6,001 - 6,500 129 73 2 4 36 1 9 4 0 80 10 25 14 129
$6,501 - 7,000 110 58 5 0 33 0 11 3 0 73 8 14 15 110
$7,001 - 7,500 96 44 0 2 42 1 5 2 0 58 11 12 15 96
$7,501 - 8,000 133 47 3 1 75 3 3 0 1 91 8 16 18 133
$8,001 - 8,500 141 54 0 1 83 0 0 2 1 101 9 15 16 141
$8,501 - 9,000 143 57 2 0 81 0 1 2 0 96 11 15 21 143
$9,001 - 9,500 115 36 3 2 74 0 0 0 0 86 7 11 11 115
$9,501 - 10,000 119 36 2 0 78 0 1 2 0 73 4 21 21 119
$10,001 - 10,500 98 37 0 0 56 0 1 4 0 57 11 9 21 98
$10,501 - 11,000 94 35 0 0 57 0 0 2 0 59 8 14 13 94
Over $11,000 525 185 3 0 317 0 5 15 0 322 43 69 91 525
TOTAL 2,501 871 30 29 992 72 223 100 184 1,615 168 402 316 2,501
1 Retirement Codes 2 Option Descriptions
1. Service Connected Disability A. Unmodified with Beneficiary (default for married)2. Early Service B. Contingent Joint & Survivorship (increased percentage to 3. Non-Service Connected Disability survivor/reduce pension to member)4. Service C. Unmodified with No Beneficiary (default for unmarried)5. Survivor (survivor of active employee) D. Joint & Survivorship Pop-Up (same as option A but if spouse 6. Continuance (survivor of retired employee) predeceases member, person goes back to original pension 7. Deferred Vested calculation)8. Ex-Spouse
POSTEMPLOYMENT HEALTHCARE BENEFITSAs of June 30, 2020
Type of Subsidy Average Monthly Benefit Health Dental Ineligible/Deferred $ 321 $ 286
$1 - 60 - 625
$61 - 250 109 1,590
$251 - 500 753 -
$501 - 1,000 1,041 -
Over $1,000 277 -
Totals $ 2,501 $ 2,501
Source : Pension Administration System
Comprehensive Annual Financial Report 2019-2020 San José Police & Fire Retirement Plan 192

Retired Members by Type of Benefit (continued)
PENSION BENEFITS BY FAMILY UNIT
As of June 30, 2020
Type of Retirement1
Monthly BenefitAmount
Number ofRetirees &
Beneficiaries 1 2 3 4 5 6 7 8$0 - 999 34 0 0 3 0 0 2 4 25
$1,000 - 1,999 72 0 0 1 0 3 3 13 52
$2,000 - 2,999 130 12 0 3 1 4 44 18 48
$3,000 - 3,999 154 28 1 1 2 13 72 16 21
$4,000 - 4,999 150 52 4 3 14 5 49 7 16
$5,000 - 5,999 194 107 5 8 28 1 30 5 10
$6,000 - 6,999 236 132 7 4 68 1 18 6 0
$7,000 - 7,999 229 93 3 3 114 3 9 2 2
$8,000 - 8,999 284 106 2 1 166 2 3 3 1
$9,000 - 9,999 244 74 5 2 156 2 3 2 0
$10,000 - 10,999 206 80 0 0 117 0 1 8 0
$11,000 - 11,999 204 82 0 0 118 0 1 3 0
$12,000 - 12,999 128 49 0 0 72 0 2 5 0
$13,000 - 13,999 83 24 1 0 53 0 2 3 0
$14,000 - 14,999 46 17 2 0 25 0 0 2 0
$15,000 - 15,999 21 7 0 0 14 0 0 0 0
$16,000 - 16,999 17 4 0 0 12 0 0 1 0
$17,000 - 17,999 20 3 0 0 16 0 0 1 0
$18,000 - 18,999 7 1 0 0 6 0 0 0 0
$19,000 - 19,999 5 0 0 0 5 0 0 0 0
$20,000 - 20,999 3 0 0 0 3 0 0 0 0
$21,000 - 23,999 4 1 0 0 3 0 0 0 0
$24,000 + 0 0 0 0 0 0 0 0 0
TOTAL 2,471 872 30 29 993 34 239 99 175
1Retirement Codes
1. Service Connected Disability2. Early Service3. Non-Service Connected Disability4. Service5. Survivor (survivor of active employee)6. Continuance (survivor of retired employee)7. Deferred Vested8. Ex-Spouse
Source : Pension Administration System
193 Comprehensive Annual Financial Report 2019-2020 San José Police & Fire Retirement Plan

Average Benefit Payment Amounts
PENSION BENEFITS
As of June 30, 2020
Years of Service CreditTime Periods 0 - 5 6 - 10 11 - 15 16 - 20 21 - 25 26 - 30 31+
As of June 30, 2020
Average monthly benefit1 $ 2,208 $ 3,882 $ 4,756 $ 6,112 $ 8,451 $ 10,839 $ 11,762
Average final average salary 2 $ 7,827 $ 5,869 $ 7,518 $ 9,124 $ 9,753 $ 9,619 $ 8,696
Number of retired members3 16 51 122 198 519 835 129
Average monthly benefit (No FAS)1 $ - $ 2,241 $ 1,853 $ 3,524 $ 5,626 $ 8,124 $ 9,244
Number of retired members2 - 3 2 9 24 94 20
As of June 30, 2019
Average monthly benefit1 $ 2,268 $ 3,922 $ 4,587 $ 5,922 $ 8,193 $ 10,502 $ 11,396
Average final average salary2 $ 7,038 $ 5,624 $ 7,384 $ 8,987 $ 9,499 $ 9,428 $ 8,657
Number of retired numbers3 15 50 122 192 487 814 134
Average monthly benefit (No FAS)1 $ - $ 2,175 $ 1,799 $ 3,421 $ 5,324 $ 7,858 $ 8,943
Number of retired members2 - 3 2 9 25 98 21
As of June 30, 2018
Average monthly benefit1 $ 2,595 $ 3,902 $ 4,487 $ 5,630 $ 7,934 $ 10,174 $ 10,961
Average final average salary2 $ 6,169 $ 5,522 $ 7,284 $ 8,701 $ 9,285 $ 9,262 $ 8,558
Number of retired members3 12 49 122 183 461 791 160
Average monthly benefit (No FAS)1 $ - $ 2,112 $ 1,747 $ 3,290 $ 5,030 $ 7,580 $ 8,683
Number of retired members2 - 3 2 8 27 101 21
As of June 30, 2017
Average monthly benefit1 $ 2,514 $ 3,724 $ 4,359 $ 5,451 $ 7,703 $ 9,851 $ 10,627
Average final average salary2 $ 5,836 $ 4,876 $ 7,204 $ 8,414 $ 9,110 $ 9,103 $ 8,482
Number of retired members3 12 50 121 170 436 788 161
Average monthly benefit (No FAS)1 $ - $ 2,050 $ 1,696 $ 3,192 $ 4,778 $ 7,303 $ 8,374
Number of retired members2 - 3 2 9 29 105 22
As of June 30, 2016
Average monthly benefit 1 $ 2,308 $ 3,631 $ 4,203 $ 5,271 $ 7,469 $ 9,546 $ 10,280
Average final average salary2 $ 4,623 $ 4,620 $ 6,694 $ 8,302 $ 8,940 $ 8,979 $ 8,416
Number of retired members3 10 51 114 166 422 773 166
Average monthly benefit (No FAS)1 $ - $ 1,991 $ 1,348 $ 3,099 $ 4,618 $ 7,080 $ 8,043
Number of retired members2 - 3 3 9 30 107 23
As of June 30, 2015
Average monthly benefit 1 $ 2,477 $ 3,462 $ 4,004 $ 5,051 $ 7,004 $ 8,940 $ 9,657
Average final average salary2 $ 4,014 $ 4,222 $ 6,433 $ 7,649 $ 8,124 $ 7,765 $ 7,206
Number of retired members3 10 51 113 151 403 774 168
Average monthly benefit (No FAS)1 $ - $ 1,933 $ 1,523 $ 3,009 $ 4,478 $ 6,858 $ 7,794
Number of retired members2 - 3 4 9 31 110 24
Comprehensive Annual Financial Report 2019-2020 San José Police & Fire Retirement Plan 194

Average Benefit Payment Amounts (continued)
PENSION BENEFITS
As of June 30, 2020Years of Service Credit
Time Periods 0 - 5 6 - 10 11 - 15 16 - 20 21 - 25 26 - 30 31+
As of June 30, 2014
Average monthly benefit1 $ 4,060 $ 3,383 $ 3,904 $ 4,897 $ 6,763 $ 8,671 $ 9,392
Average final average salary2 $ 4,166 $ 4,097 $ 6,123 $ 7,384 $ 7,846 $ 7,637 $ 7,151
Number of retired members3 23 47 103 132 365 755 145
Average monthly benefit (No FAS)1 $ 2,852 $ 3,187 $ 3,706 $ 4,725 $ 6,511 $ 8,399 $ 9,011
Number of retired members2 1 3 4 9 32 115 25
As of June 30, 2013
Average monthly benefit1 $ 2,852 $ 3,187 $ 3,706 $ 4,725 $ 6,511 $ 8,399 $ 9,011
Average final average salary2 $ 3,993 $ 3,758 $ 5,746 $ 6,988 $ 7,620 $ 7,552 $ 7,006
Number of retired members3 11 47 98 125 344 755 150
Average monthly benefit (No FAS)1 $ - $ 1,822 $ 1,321 $ 3,233 $ 4,197 $ 6,486 $ 7,398
Number of retired members2 - 3 5 11 32 117 27
As of June 30, 2012
Average monthly benefit 1 $ 2,304 $ 3,101 $ 3,395 $ 4,465 $ 6,248 $ 8,101 $ 8,676
Average final average salary2 $ 1,540 $ 3,368 $ 4,931 $ 6,555 $ 7,431 $ 7,398 $ 6,940
Number of retired members3 6 44 81 115 341 749 154
Average monthly benefit (No FAS)1 $ - $ 1,769 $ 1,282 $ 3,023 $ 4,075 $ 6,302 $ 7,020
Number of retired members2 - 3 5 12 32 120 28
As of June 30, 2011
Average monthly benefit1 $ 2,199 $ 3,028 $ 3,310 $ 4,509 $ 5,872 $ 8,035 $ 8,573
Average final average salary2 $ 1,540 $ 3,402 $ 4,695 $ 6,818 $ 7,309 $ 8,344 $ 8,094
Number of retired members3 6 44 74 102 278 714 157
Average monthly benefit (No FAS)1 $ - $ 1,688 $ 1,455 $ 2,989 $ 3,956 $ 6,051 $ 6,766
Number of retired members2 - 3 5 12 36 129 30
1 Includes cost-of-living increases
2 Final average salary not available for those that retired prior to April 1998, except for service-connected disability retirees. Those without final average salary are not included in average monthly benefit.
3 Does not include survivors and ex-spouses
Source: Pension Administration System
195 Comprehensive Annual Financial Report 2019-2020 San José Police & Fire Retirement Plan

Average Benefit Payment Amounts (continued)
POSTEMPLOYMENT HEALTHCARE BENEFITS As of June 30, 2020
Years of Service CreditTime Periods 0 - 5 6 - 10 11 - 15 16 - 20 21 - 25 26 - 30 31+
As of June 30, 2020Average health subsidy $ 711 $ 802 $ 817 $ 749 $ 812 $ 806 $ 708
Number of health participants1 8 40 92 156 525 960 155
Average dental subsidy $ 102 $ 105 $ 116 $ 110 $ 107 $ 109 $ 100
Number of dental participants1 8 42 94 159 528 969 155
As of June 30, 2019Average health subsidy $ 683 $ 738 $ 848 $ 757 $ 785 $ 778 $ 689
Number of health participants1 7 38 81 143 471 922 155
Average dental subsidy $ 93 $ 107 $ 115 $ 111 $ 108 $ 109 $ 102
Number of dental participants1 8 43 93 156 494 952 159
As of June 30, 2018Average health subsidy $ 600 $ 693 $ 797 $ 701 $ 759 $ 749 $ 654
Number of health participants1 7 39 88 154 465 890 173
Average dental subsidy $ 93 $ 105 $ 116 $ 112 $ 109 $ 109 $ 103
Number of dental participants1 8 44 92 157 476 906 175
As of June 30, 2017Average health subsidy $ 910 $ 878 $ 1,060 $ 940 $ 949 $ 901 $ 743
Number of health participants1 7 42 83 140 437 869 169
Average dental subsidy $ 93 $ 103 $ 117 $ 113 $ 109 $ 110 $ 102
Number of dental participants1 8 47 93 150 455 905 173
As of June 30, 2016Average health subsidy $ 934 $ 865 $ 991 $ 903 $ 909 $ 861 $ 719
Number of health participants1 6 39 81 138 427 862 172
Average dental subsidy $ 95 $ 102 $ 111 $ 108 $ 105 $ 105 $ 98
Number of dental participants1 7 46 89 147 441 894 179
As of June 30, 2015Average health subsidy $ 899 $ 811 $ 985 $ 860 $ 894 $ 857 $ 727
Number of health participants1 7 42 83 124 407 874 178
Average dental subsidy $ 89 $ 101 $ 112 $ 108 $ 107 $ 105 $ 99
Number of dental participants1 8 50 91 132 424 899 181
As of June 30, 2014Average health subsidy $ 549 $ 779 $ 845 $ 779 $ 896 $ 879 $ 746
Number of health participants1 19 44 87 121 384 843 166
Average dental subsidy $ 67 $ 97 $ 96 $ 97 $ 106 $ 106 $ 99
Number of dental participants1 21 47 91 128 396 865 169
Comprehensive Annual Financial Report 2019-2020 San José Police & Fire Retirement Plan 196

Average Benefit Payment Amounts (continued)
POSTEMPLOYMENT HEALTHCARE BENEFITS As of June 30, 2020
Years of Service CreditTime Periods 0 - 5 6 - 10 11 - 15 16 - 20 21 - 25 26 - 30 31+
As of June 30, 2013
Average health subsidy $ 519 $ 783 $ 769 $ 785 $ 924 $ 932 $ 844
Number of health participants1 8 44 81 118 366 855 174
Average dental subsidy $ 84 $ 96 $ 85 $ 92 $ 101 $ 101 $ 102
Number of dental participants1 9 47 86 124 375 872 177
As of June 30, 2012Average health subsidy $ 776 $ 850 $ 839 $ 865 $ 1,018 $ 1,055 $ 928
Number of health participants1 6 42 66 110 357 850 177
Average dental subsidy $ 109 $ 106 $ 88 $ 97 $ 107 $ 108 $ 108
Number of dental participants1 6 46 70 114 372 869 182
As of June 30, 2011Average health subsidy $ 730 $ 918 $ 1,050 $ 1,019 $ 1,052 $ 1,086 $ 1,029
Number of health participants1 6 40 59 96 273 709 29
Average dental subsidy $ 110 $ 110 $ 110 $ 110 $ 109 $ 109 $ 110
Number of dental participants1 6 43 63 98 278 714 30
1Does not include survivors and ex-spouses.
Source : Pension Administration System
Source: Pension Administration System
197 Comprehensive Annual Financial Report 2019-2020 San José Police & Fire Retirement Plan

Retirements During Fiscal Year 2019-2020
SERVICE RETIREMENTSPOLICE DEPARTMENT FIRE DEPARTMENT
Alvares, Mark S. Mizgorski, Richard J. Abasolo, Joseph
Archer, Matthew J. Navarro, Daniel Gamban, Daniel C.
Baldwin, Glenn W. Nelms, Steven D. Gonzales, Alan F.
Becerra, William Nieves, Rafael Gutierrez, Robert V.
Birch, Lawrence P. Payne, Vanessa V. Hernandez, Eric J.
Bustillos, Mark C. Pedreira, Eduardo M. Katsuyoshi, Wade N.
Crooker, Colin L. Pineda, Mark A. King, George D.
Finnie, Robert Plamenco, Roberto C. Miller, Charles T.
Fittreau, Kevin B Ramirez, Anastacio D. Morton, Howard R.
Foster, Richard R. Rodriguez, Aurelio Moseley, David M.
Gaines, Eugene Rodriguez, Gerardo Murphy, Christopher L.
Gonzales, Jaime A. Schnutenhaus, Thomas P. Mushock, Jeffrey R.
Guggiana, Steven T. Serenil, Arthur J. Polverino, Victor E.
Gutierrez, David C.. Sivertsen, Jeannette P. Schmidt, Douglas R.
Iglesias, Jose M. Speaks, Nicholas L. Tom, James Q.
Jackson, Lyle T. Starkey, Ronald S. Una Dia, Jeffrey
Jackson, Timothy Stewart, Joseph K. Welch, Jeffrey L.
Keller, Alexander S. Tabron, Ronald Zamora, Eleazar
Kyono, Kevin M. Trias, Gerardo M.
La Cap, Tedy V. Valdes, Alberto M.
Magdaleno, Robert Vasquez, Hector M.
Mc Millin, Kevin P. Williams, Shawny K.
Melloch, Barbara J. Yeung, Wilson.
Milliken, Bertrand Y. Young, Bruce A.
Mills, Fred A.
EARLY RETIREMENTSPOLICE DEPARTMENT FIRE DEPARTMENT
None None
DEFERRED VESTEDPOLICE DEPARTMENT FIRE DEPARTMENT
Braxton, Nathaniel Misener, Brian E. Gutierrez, Mary F.
Chrisman, Paul A. Nguyen, Alex T.
Deras, Joseph H. Phan, Minh N.
Fenn, Randy Rangel, Humberto
Hathaway, Parker L. Sims, James W.
Lee, Alan M.
SERVICE-CONNECTED DISABILITY RETIREMENTSPOLICE DEPARTMENT FIRE DEPARTMENT
Oliveri, Marcello J. None
Sarmento, Manuel L.
NON SERVICE-CONNECTED DISABILITY RETIREMENTS POLICE DEPARTMENT FIRE DEPARTMENT
None Wheeler, Dennis
Comprehensive Annual Financial Report 2019-2020 San José Police & Fire Retirement Plan 198

Deaths During Fiscal Year 2019-2020
DEATHS AFTER RETIREMENT POLICE DEPARTMENT FIRE DEPARTMENT
Adams, Eugene C. Nunes, John P. Carriere, Melvin
Avila, Robert G. Oiseth, Edmund R. Croyle, Philip G.
Baker, Irwin C. Pierce, Mervin E. Flair, Gary L.
Barker, Kenneth W. Raul Marcella E. Gallagher, Timothy J.
Blackmore, Charles R. Rolen, Dalton C. La Mar, James A.
Cadenasso, Richard B. Rosendin, Gregg Lane, Gaylord R.
Demkowski, Lawrence T. Shigemasa, Thomas K. MC Quaide, William J.
Ewing, Donald E. Springer, George J. Newman, Don M.
Hernandez, Victor Thomas, Richard F. Richardson, Harold
Hunter, Richard D. Trussler, Phyllis Spinler, Jack
Kennedy, Tommy J. Sutton, Randall R.
Martorano, John D. Torguson, Donald L.
DEATHS BEFORE RETIREMENT POLICE DEPARTMENT FIRE DEPARTMENT
Sandez, Margaret A. None
199 Comprehensive Annual Financial Report 2019-2020 San José Police & Fire Retirement Plan


2I�FH�RI�5HWLUHPHQW�6HUYLFHV��
�����1RUW��)LUVW�6WUHHW��6XLWH������
6DQ�-RVp��&DOLIRUQLD� !��"�$!�!
3�RQH�$�&�� $������)D'�$�&�� "����"��
www.sjretirement.com


![CAMBIO DE PIEL CARLOS FUENTES Y ]OSÉ TRIGO · PDF fileviolencia y lo sagrado. Una serie de vasos comunicantes provoca encuentros entre]osé Trigo y Cambio de piel. Sobresale la búsqueda](https://img.pdfslide.net/doc/110x75/5a97aba27f8b9a30358d48f7/cambio-de-piel-carlos-fuentes-y-os-trigo-y-lo-sagrado-una-serie-de-vasos-comunicantes.jpg)


![El Rvdo. P. ]osé Tous y Soler nació en Igualada (Barcelona ...€¦ · EL RVDO. P. JOSÉ TOUS Y SOLER: ACTIVIDADES Y ESPIRITUALIDAD El Rvdo. P. ]osé Tous y Soler nació en Igualada](https://img.pdfslide.net/doc/110x75/5e8e3a1341995e7e7f155266/el-rvdo-p-os-tous-y-soler-naci-en-igualada-barcelona-el-rvdo-p-jos.jpg)