Embed Size (px)
Citation preview

cover graphicv3.indd 1 27/10/2016 11:22:43 AM
WA INFRASTRUCTURE REPORT 2017Civil ContraCtors Federation Wa
A construction economy in transition

Elizabeth Quay construction site. Photo courtesy of SRG Limited.
© November 2016 Civil Contractors Federation WA. All rights reserved.
This report has been prepared by Adrian Hart, Rubhen Jeya, Andrew Iemma and Steven Gosarevski from BIS Shrapnel. It has been prepared on the basis of publicly available information. BIS Shrapnel has relied upon and assumed, without independent verification, the accuracy and completeness of all such information. It contains selected information and does not purport to be all-inclusive or to contain all of the information that may be relevant to the Purpose. The recipient acknowledges that circumstances may change and that this report may become outdated as a result. BIS Shrapnel is under no obligation to update or correct this report. BIS Shrapnel, its related bodies corporate and other affiliates, and their respective directors, employees, consultants and agents (‘Shrapnel Group’) make no representation or warranty as to the accuracy, completeness, timeliness or reliability of the contents of this report. To the maximum extent permitted by law, no member of the Shrapnel Group accepts any liability (including, without limitation, any liability arising from fault or negligence on the part of any of them) for any loss whatsoever arising from the use of this report or its contents or otherwise arising in connection with it. This report may contain forward-looking statements, forecasts, estimates and projections. No independent third party has reviewed the reasonableness of any such statements or assumptions. No member of the Shrapnel Group represents or warrants that such Forward Statements will be achieved or will prove to be correct. Actual future results and operations could vary materially from the Forward Statements. Similarly, no representation or warranty is made that the assumptions on which the Forward Statements are based may be reasonable. No audit, review or verification has been undertaken by the Shrapnel Group or an independent third party of the assumptions, data, results, calculations and forecasts presented or referred to in this report.
Civil Contractors FederationWestern Australia Branch70 Verde DriveJandakot, WA 6164Phone: (08) 9414 1486Fax: (08) 9414 1496Email: [email protected]: ccfwa.com.auTwitter: @CCFWA
BIS Shrapnel Pty LtdLevel 8, 99 Walker StreetNorth Sydney NSW 2060Contact: Adrian HartSenior Manager - Infrastructure and MiningPhone: (02) 8458 4233Fax: (02) 9959 5795 Email: [email protected]: bis.com.auTwitter: @BISShrapnel
cover graphicv3.indd 1 27/10/2016 11:22:43 AM
WA Infrastructure Report 2017: A construction economy in transition 5
Contents
Executive Summary 6Key findings 6Challenges and recommendations 7
1. Economic Outlook for Western Australia 101.1 Outlook for the global economy 101.2 Risks to the global economy 121.3 Outlook for commodity prices 131.5 Outlook for the Western Australian economy 161.6 Key risks to the Western Australian economic forecasts 17
2. Western Australia Infrastructure Outlook 192.1 Recent trends and outlook for construction activity 202.2 State of play and outlook for infrastructure and mining construction 222.3 Western Australia construction cost trends 26
3. Challenges, Implications and Recommendations 303.1 Implications and challenges: Western Australia in transition 313.2 Should Western Australia cut back further on public infrastructure invest-ment? 353.3 Funding infrastructure spending 363.4 Is public debt too high? 423.5 Could public debt be used to fund Western Australian infrastructure? 463.6 Conclusions and recommendations 50
About CCF WA 53
WA INFRASTRUCTURE REPORT 2017A construction economy in transition

6 BIS Shrapnel – CCF WA
This is the second Infrastructure Outlook Report published by the Civil Contractors Federation of Western Australia in conjunction with BIS Shrapnel research, forecasting and analysis. As in 2015, it comes at a crucial time for
the civil construction industry, as the Western Australian economy continues to be impacted by the largest recorded decline in domestic demand, and State and Federal Governments grapple with debts and deficits in framing their budgets and infrastructure spending plans.
Contractors and suppliers to the civil construction industry have already felt the impact of falling construction work on their businesses and the near term outlook is challenging, to say the least. While falling resources-related investment is the key architect of the construction downturn, falling State Government revenues and rising debt has also stymied publicly funded civil construction.
This is the challenge now facing the civil construction industry in Western Australia and the broader economy. It demands that governments and industry work together on solutions that will sustain industries, provide jobs and maintain living standards in the face of the deepest and most prolonged decline in domestic demand that Western Australia has ever seen.
Key findings
Measured civil construction activity is set to slump over the next two years, as the last leg of the resources investment boom – LNG construction – finally unwinds. Oil and gas construction will be responsible for $20 billion of the projected $27 billion civil construction market decline in Western Australia over the next three years.
Given the importance of resources investment to the State economy, its fall will impact heavily across most industries as well as supporting building and construction subcategories. The resources investment boom stimulated supporting industries as well as stimulating residential and non-residential building and infrastructure development. Now, however, these drivers are all in reverse, with lower civil construction to be joined by slumping building activity.
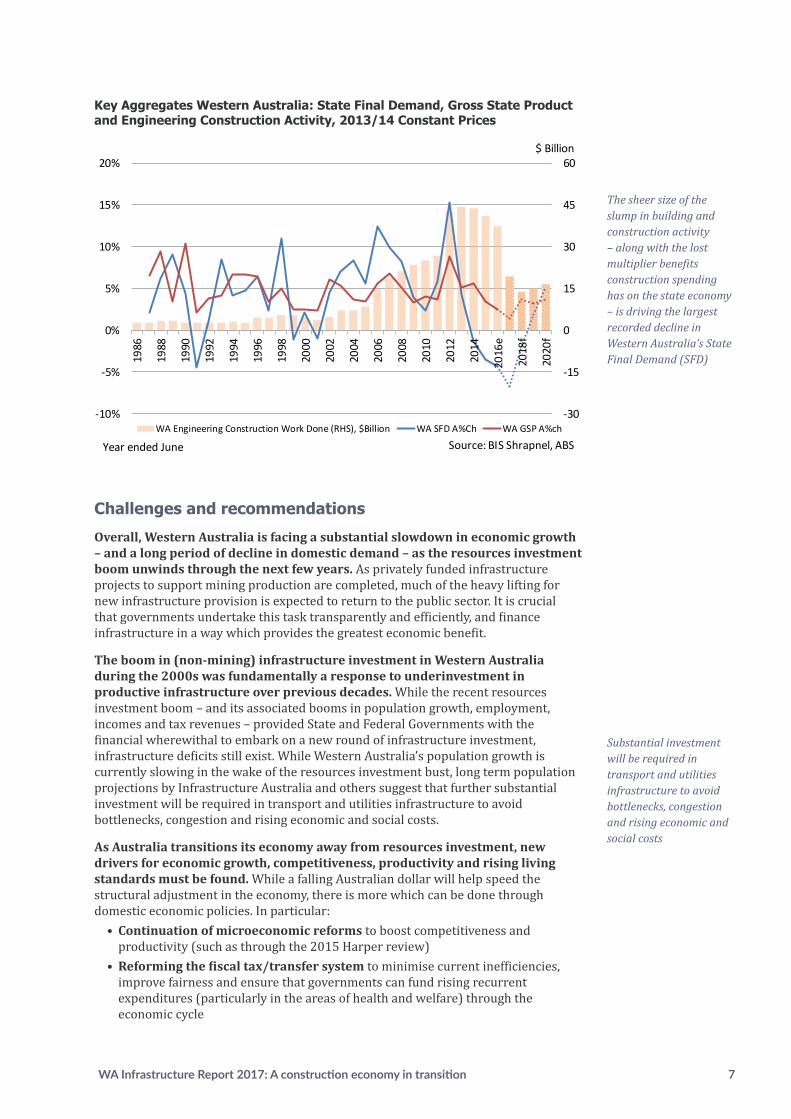
The sheer size of the slump in building and construction activity – along with the lost multiplier benefits construction spending has on the State economy – is driving the largest recorded decline in Western Australia’s State Final Demand (SFD). Western Australia is effectively in the midst of what is projected to be a five year demand recession. Overall, domestic demand in Western Australia has shrunk 8.9per cent since the September 2013 peak and is projected to fall a further 8.5per cent over the next two years, bringing the total decline to 17per cent – having enormous implications for state incomes, employment and the standard of living.
By contrast, measures of economic production (such as Gross State Product or GSP) should continue to grow in Western Australia, supported by rising mining output, though at a much slower rate than during the investment boom.
Weaker multipliers from mining production compared to mining investment, however, means that the unemployment rate in Western Australia is expected to rise. Construction sector employment is projected to fall from 149,000 in 2015/16 to 110,000 by 2018/19 – a direct loss of 40,000 jobs representing just over a quarter of the currently employed construction workforce.
Executive Summary
WA Infrastructure Report 2017: A construction economy in transition 7
Key Aggregates Western Australia: State Final Demand, Gross State Product and Engineering Construction Activity, 2013/14 Constant Prices
Key Aggregates Western Australia: State Final Demand, Gross State Product and Engineering Construction Activity, 2013/14 Constant Prices
Source: BIS Shrapnel, ABS data
Challenges and Recommendations
Overall, Western Australia is facing a substantial slowdown in economic growth – and a long period of decline in domestic demand – as the resources investment boom unwinds through the next few years. As privately funded infrastructure projects to support mining production are completed, much of the “heavy lifting” for new infrastructure provision is expected to return to the public sector. It is crucial that governments undertake this task transparently and efficiently, and finance infrastructure in a way which provides the greatest economic benefit.
The boom in (non-mining) infrastructure investment in Western Australia during the 2000s was fundamentally a response to underinvestment in productive infrastructure over previous decades. While the recent resources investment boom – and its associated boom in population growth, employment, incomes and tax revenues – provided State and Federal Governments with the financial wherewithal to embark on a new round of infrastructure investment, infrastructure deficits still exist. While Western Australia’s population growth is currently slowing in the wake of the resources investment bust, long term population projections by Infrastructure Australia and others suggest that further substantial investment will be required in transport and utilities infrastructure to avoid bottlenecks, congestion and rising economic and social costs.
As Australia transitions its economy away from resources investment, new drivers for economic growth, competitiveness, productivity and rising living standards must be found. While a falling Australian dollar will help speed the structural adjustment in the economy, there is more which can be done through domestic economic policies. In particular:
Continuation of microeconomic reforms to boost competitiveness and productivity (such as through the recent Harper review)
-30
-15
0
15
30
45
60
-10%
-5%
0%
5%
10%
15%
20%
1986
1988
1990
1992
1994
1996
1998
2000
2002
2004
2006
2008
2010
2012
2014
2016
e
2018
f
2020
f
WA Engineering Construction Work Done (RHS), $Billion WA SFD A%Ch WA GSP A%ch
Source: BIS Shrapnel, ABS
$ Billion
Year ended June
Challenges and recommendations
Overall, Western Australia is facing a substantial slowdown in economic growth – and a long period of decline in domestic demand – as the resources investment boom unwinds through the next few years. As privately funded infrastructure projects to support mining production are completed, much of the heavy lifting for new infrastructure provision is expected to return to the public sector. It is crucial that governments undertake this task transparently and efficiently, and finance infrastructure in a way which provides the greatest economic benefit.
The boom in (non-mining) infrastructure investment in Western Australia during the 2000s was fundamentally a response to underinvestment in productive infrastructure over previous decades. While the recent resources investment boom – and its associated booms in population growth, employment, incomes and tax revenues – provided State and Federal Governments with the financial wherewithal to embark on a new round of infrastructure investment, infrastructure deficits still exist. While Western Australia’s population growth is currently slowing in the wake of the resources investment bust, long term population projections by Infrastructure Australia and others suggest that further substantial investment will be required in transport and utilities infrastructure to avoid bottlenecks, congestion and rising economic and social costs.
As Australia transitions its economy away from resources investment, new drivers for economic growth, competitiveness, productivity and rising living standards must be found. While a falling Australian dollar will help speed the structural adjustment in the economy, there is more which can be done through domestic economic policies. In particular:
• Continuation of microeconomic reforms to boost competitiveness and productivity (such as through the 2015 Harper review)
• Reforming the fiscal tax/transfer system to minimise current inefficiencies, improve fairness and ensure that governments can fund rising recurrent expenditures (particularly in the areas of health and welfare) through the economic cycle
The sheer size of the slump in building and construction activity – along with the lost multiplier benefits construction spending has on the state economy – is driving the largest recorded decline in Western Australia’s State Final Demand (SFD)
Substantial investment will be required in transport and utilities infrastructure to avoid bottlenecks, congestion and rising economic and social costs

8 BIS Shrapnel – CCF WA
Executive Summary
• Embarking on a new phase of productive infrastructure investment by taking advantage of low interest rates and lower industry costs
In this context, the resources investment bust presents an enormous opportunity for economic reform and investment in productive infrastructure, which in turn will help the Western Australian economy transition towards balanced growth. While State and Commonwealth debt levels are higher than they were pre-boom, they do not of themselves provide an insurmountable obstacle to infrastructure development. To the contrary, the cost of finance continues to fall to historic lows, and in Western Australia there is significant spare industry capacity to meet the infrastructure challenge. In this situation, financing productive new infrastructure through debt is not only fair on intergenerational equity grounds, but also provides the best economic ‘bang for the buck’ compared to other financing methods. The challenge is ensuring that infrastructure projects are selected on a rigorous, transparent, evidence-based system and their net benefits above the cost of capital are clearly identified. Outside of debt, State and Commonwealth governments have a range of other funding solutions available to them, ranging from asset recycling, value capture and user charges, not to mention facilitating direct private provision of infrastructure where possible.
With these challenges in mind, this Report makes the following recommendations:
A. Developing a long-term infrastructure program
Recommendation 1. Given the projected prolonged weakness in domestic demand and employment, the Western Australian State Government and the Commonwealth Government should immediately expand the scope of productivity-enhancing public infrastructure provision. This should focus on shovel-ready projects initially and then on maintaining a rolling, long term infrastructure investment program that provides industry confidence and certainty.
Recommendation 2. Western Australia should establish an independent infrastructure agency, as in other states, to undertake or review business cases on specific infrastructure initiatives and establish a pipeline of productive infrastructure projects in the state.
Recommendation 3. Commonwealth and Western Australian State Governments engage with industry and infrastructure agencies to develop longer term (15 to 20 year) infrastructure plans, with bipartisan support, with a clear ranking of projects so they can be prioritised or deprioritised according to prevailing economic conditions.
Recommendation 4. Both short term and long term public investment programs should be based on maximising economic benefits through transparent cost benefit analysis (CBA). This, in turn, requires (i) the publication of CBAs supporting public investment decisions so they can be rigorously and independently tested, but also (ii) improvement in the quality of the data collected by the Australian Bureau of Statistics (ABS) which form key inputs to the CBA process, particularly surrounding the value of capital stock, investment, construction, construction costs and productivity.
B. Funding productive infrastructure
Recommendation 5. With interest rates at historical lows and excess capacity in the civil construction industry, further debt funding of productive infrastructure should be used as an effective means to address the infrastructure deficit.
The resources investment bust presents an enormous opportunity.The cost of finance continues to fall to new historic lows, and in Western Australia there is significant spare industry capacity to meet the infrastructure challenge

WA Infrastructure Report 2017: A construction economy in transition 9
Recommendation 6. Given the fiscal headroom of the Commonwealth Government, the vertical fiscal imbalance embedded in Commonwealth-State relations, and the relative benefits of using debt to fund productive infrastructure investment, the Commonwealth Government should guarantee the debt of any expanded infrastructure program by the Western Australia State Government to a defined maximum figure so long as those projects are shown to be productive through the transparent CBA process.
Recommendation 7. The Commonwealth Government should provide five-yearly pooled infrastructure funding to the States and reduce the use of project specific or tied (conditional) s96 grants (such as to the Perth Freight Link project) as outlined by the National Commission of Audit report in 2014.
Recommendation 8. The State Government should urgently consider long-term asset leases to fund infrastructure investment but only after rigorous analysis to demonstrate that the benefits outweigh the costs and that effective regulatory processes are in place.
Recommendation 9. The Commonwealth Government should reactivate its 15 per cent Asset Recycling Initiative to encourage State Governments to fund new productive infrastructure and which compensates for the loss of the future income stream of publicly held assets.
Recommendation 10. The State Government should develop policies for encouraging and assessing unsolicited infrastructure investment proposals from the private sector, as operating in other states such as Queensland, New South Wales and Victoria.
C. Boosting efficiency and reducing costs
Recommendation 11. To maximise efficiencies in public infrastructure provision and reduce costs, both the Commonwealth and State Governments should follow through with reforms to the public infrastructure procurement process, as outlined by the Productivity Commission’s review in 2014. This includes governments investing more in initial designs; contributing to bid costs where innovation is genuinely in prospect; leaving more of the detailed planning and design to the preferred tenderer (rather than all bidders at the tender stage); packaging projects into contract sizes that foster broader competition and a sustainable contracting industry; and removing unnecessary, duplicative or otherwise inefficient approvals processes or regulations.
Recommendation 12. Western Australia should harmonise procurement policies and approaches across all levels of government, including the use of open (rather than closed) tenders, local content rules, and de-bundling large infrastructure projects to boost competition and the sustainability of the civil construction industry.
Recommendation 13. That Western Australia and Commonwealth Governments look to increase funding for infrastructure maintenance as a more cost effective way of sustaining the existing asset stock and reducing future requirements for costly asset replacement.
Recommendation 14. Both Commonwealth and State Governments should continue to make concerted efforts to eliminate structural deficits in their Budgets (which entail borrowing to fund recurrent expenditures across the economic cycle) through wholesale tax and expenditure reforms. This would be assisted, in turn, by improvements in the quality of Budget reporting to better isolate capital and recurrent expenditure items and the degree to which each are effectively funded through debt.
10 BIS Shrapnel – CCF WA
Western Australia’s economic prospects are closely related to the prospects for the global economy, given the increasing linkages for resources investment and trade. However, the current global oversupply in most metals and energy markets means that Western Australia needs
other industries to step up to sustain growth in demand and employment.
The key points to this outlook include:
Global economic growth is struggling to gain momentum, but should improve a little this year and next. While there are positive signs for growth in the US and India, China’s economic growth continues to ease and prospects for Japan and the Eurozone economies remain weak. Stronger global growth is necessary for higher commodity prices. Higher global growth and industrial production has a strong bearing on demand for metals and energy, which drives future levels of investment activity in resource-rich provinces such as Western Australia.
Commodity prices remain weak, stalling resources investment and slicing royalty revenue for the State Government. Commodity prices remain weak as increasing volumes of supply pour into the market. In turn, low prices are deterring the next round of resources investment, although prospects are better in those commodities which were not as heavily oversupplied during the recent boom, including gold, nickel, other base metals and rare earths. Cutbacks in investment will eventually see demand absorb the oversupply, but the process is expected to take several years. Low commodity prices also means lower royalty revenues for the State Government, affecting its ability to fund recurrent expenditure as well as public investment.
A re-acceleration in the Australian economy towards 3 per cent growth through 2015/16 is a false dawn, with growth expected to ease from here and remain constrained in the 2-3 per cent range for the rest of this decade. Australia’s main economic issues are domestic. With the end of the resources investment boom, a protracted and difficult structural transition is underway. This involves rebuilding trade-exposed industries (such as education, tourism and manufacturing) that were decimated by the high Australian dollar, in turn driving a recovery in non-mining growth in production and investment. This will take time – and sensible government policy.
The Western Australian economy is in the midst of the largest contraction in domestic demand since consistent ABS records began in the mid-1980s. Strong growth in mining exports is cushioning the impact of falling mining investment on state economic growth, but it is not enough to prevent a decline in employment and the contagion of falling investment across other asset classes including residential building and commercial offices. Meanwhile public spending is in retreat given the rapid widening in the budget deficit and sharp growth in net debt. With key drivers of consumer spending, business spending and investment in retreat, the Western Australian economy is projected to grow at the slowest rate recorded in 30 years.
1.1 Outlook for the global economy
The world economy grew by 3.2 per cent in calendar year 2015, well below its long-run average of 3.6 per cent. Many advanced economies are still in protracted recovery from their GFC-induced economic downturns.
Despite uncertainty created by the United Kingdom’s decision to exit the European
With the end of the resources investment boom, a protracted and difficult structural transition is underway
1. Economic Outlook for Western Australia
The Western Australian economy is projected to grow at the slowest rate recorded in 30 years

WA Infrastructure Report 2017: A construction economy in transition 11
Union (Brexit) and further slowing in the world’s largest economy, China, global growth should improve over the next few years, with the United States economy providing solid support.
In China, GDP growth has moderated in recent years, partly reflecting the authorities’ efforts to rebalance the economy from investment towards household consumption. From double digit growth rates in the mid-2000s, economic growth slowed to 6.9 per cent in calendar 2015, and growth is expected to slow further through the next few years as its economy transitions. However, given the quadrupling in the size of the Chinese economy since 2000, this growth is now coming from a much larger base.
Even at these lower growth rates, China adds just under the equivalent of an entire Australian economy to its own economy each year (approximately US$1 trillion in purchasing power parity terms). The challenge for Australia (and particularly for a resource-rich state such as Western Australia), is that this growth is becoming less energy and metals intensive, but will provide longer term opportunities for trade in services and skills.
The United States economy has made steady progress since the GFC-induced economic downturn, with growth in calendar 2015 matching 2014 (2.4 per cent). Rising employment allowed the federal reserve to raise interest rates to 0.25 per cent in December 2015 – the first rise in 10 years – although uncertainties created by falling equity prices (in early 2016) and Brexit (mid-2016), coupled with weak inflation, saw no more rate rises during the first half of calendar 2016.
Despite these events, the fundamentals for the US economy remain positive. Employment continues to rise, energy costs are low, and fiscal and monetary policies are supportive. Against this, the US economy faces some headwinds from weak population growth and lower levels of private investment, putting the onus of growth on productivity gains through education, training and technology. While calendar 2016 growth may end up weaker than 2015 given the sluggish start, a return to stronger growth is expected for subsequent years.
The Eurozone economies continue to struggle from a lack of competitiveness under the common Euro currency (with the exception of Germany), but growth did accelerate to 1.9 per cent in calendar 2015, up from 0.9 per cent in calendar 2014. However, growth prospects in Europe have been downgraded by the United Kingdom’s recent Brexit decision.
Brexit is expected to dent growth in the United Kingdom through the second half of 2016 and over subsequent years (mainly through weaker business investment) which, in turn will have repercussions for key European trading partners. Brexit’s impact on Australia is likely to be insignificant given most of our trade is with China and South-East Asia. Meanwhile, high debt, deflationary pressures and weak domestic demand are expected to persist as economies in the Eurozone continue to reset their cost bases against Germany.
Japan continues to pursue quantitative easing stimulus measures in an attempt to ward off deflationary pressures and revive growth, which has been faltering since the 1990s. Nonetheless, private consumption has remained subdued since the increase in consumption tax in early 2014. This led the Japanese government to postpone the next scheduled increase in the consumption tax from April 2017 to October 2019. A falling working age population and high debt remain a challenge. Overall, the Japanese economy is expected to eke out only weak (albeit positive) growth in calendar 2016, with prospects for slightly stronger growth thereafter.
India’s economy continues to accelerate (as it has done for the past two years) and is set to become the fastest growing major economy in 2016. Rising industrial and agriculture production is the key driver. Growth is expected to remain robust over the
Chinese economic growth slowed to 6.9 per cent in calendar 2015, however this growth is now coming from a much larger base
12 BIS Shrapnel – CCF WA
next few years, reflecting the policy direction of the new government, as well as an improvement in standards of governance including institutional reforms to speed up the implementation of large scale infrastructure projects.
1.2 Risks to the global economy
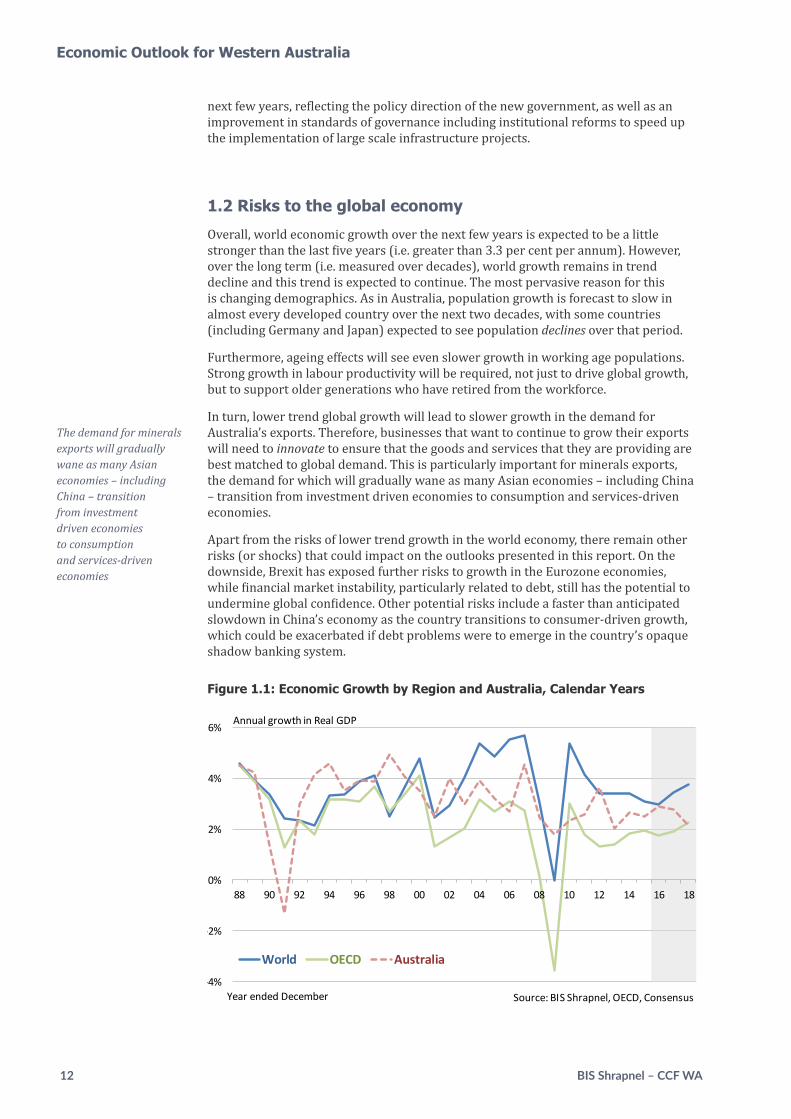
Overall, world economic growth over the next few years is expected to be a little stronger than the last five years (i.e. greater than 3.3 per cent per annum). However, over the long term (i.e. measured over decades), world growth remains in trend decline and this trend is expected to continue. The most pervasive reason for this is changing demographics. As in Australia, population growth is forecast to slow in almost every developed country over the next two decades, with some countries (including Germany and Japan) expected to see population declines over that period.
Furthermore, ageing effects will see even slower growth in working age populations. Strong growth in labour productivity will be required, not just to drive global growth, but to support older generations who have retired from the workforce.
In turn, lower trend global growth will lead to slower growth in the demand for Australia’s exports. Therefore, businesses that want to continue to grow their exports will need to innovate to ensure that the goods and services that they are providing are best matched to global demand. This is particularly important for minerals exports, the demand for which will gradually wane as many Asian economies – including China – transition from investment driven economies to consumption and services-driven economies.
Apart from the risks of lower trend growth in the world economy, there remain other risks (or shocks) that could impact on the outlooks presented in this report. On the downside, Brexit has exposed further risks to growth in the Eurozone economies, while financial market instability, particularly related to debt, still has the potential to undermine global confidence. Other potential risks include a faster than anticipated slowdown in China’s economy as the country transitions to consumer-driven growth, which could be exacerbated if debt problems were to emerge in the country’s opaque shadow banking system.
Figure 1.1: Economic Growth by Region and Australia, Calendar Years
Outlook for Commodity Prices
The long lead times between executing investment decisions and the period when new production reaches the market means commodity prices will always contain a natural element of volatility and cyclicality. Even so, the experience of the 2000s commodities “supercycle” has been extraordinary by any measure. Strong growth in international demand for commodities through the 2000s, driven mostly by the emergence of China, spurred a tremendous boom in prices and, eventually, investment and new production. With demand growth easing just as growth in supply was ramping up, most commodity markets moved sharply into oversupply, which will still take several years to eliminate. The consequence of this has been much lower prices for Australia’s key commodity exports. Australia’s energy, minerals and metals commodity prices virtually halved, in US$ terms, over the three years from the unprecedented 2011/12 peak, although the fall was tempered by the 19 per cent decline in the US$/A$ exchange rate. However, the decline in commodity prices from mid-2015 to early 2016 was just as dramatic, and although prices for most commodities have recovered partially during 2016, the overall year-average decline in US$ prices in 2015/16 is estimated to be another 28 per cent decline (partially offset by the 13 per cent depreciation in the A$ to around US73 cents for the year). Meanwhile, in response to steep price declines, global investment in new capacity has been slashed, unprofitable operations (at these lower prices) closed, and production costs cut right across the mining industry. This is a natural response, but we note that in curtailing growth in
-4%
-2%
0%
2%
4%
6%
88 90 92 94 96 98 00 02 04 06 08 10 12 14 16 18
World OECD Australia
Year ended December Source: BIS Shrapnel, OECD, Consensus
Annual growth in Real GDP
Economic Outlook for Western Australia
The demand for minerals exports will gradually wane as many Asian economies – including China – transition from investment driven economies to consumption and services-driven economies
WA Infrastructure Report 2017: A construction economy in transition 13
Meanwhile, countries reliant on energy revenues (such as OPEC and Russia) have been battered by the sharp drop in energy prices and this could still lead to corrective actions to reduce spending. On the positive side, lower energy prices are a boon to energy dependent economies and could help drive lower production costs, higher profitability and new investment.
Finally, geopolitical issues could still be a threat to the global economy, with actions by China (now the world’s largest economy), Russia and the United States and their respective responses likely to be the biggest political risk factors going forward.
1.3 Outlook for commodity prices
The long lead times between executing investment decisions and the period when new production reaches the market means commodity prices will always contain a natural element of volatility and cyclicality.
Even so, the experience of the 2000s commodities supercycle has been extraordinary by any measure. Strong growth in international demand for commodities through the 2000s, driven mostly by the emergence of China, spurred a tremendous boom in prices and, eventually, investment and new production. With demand growth easing just as growth in supply was ramping up, most commodity markets moved sharply into oversupply, which will still take several years to eliminate.
The consequence of this has been much lower prices for Australia’s key commodity exports. Australia’s energy, minerals and metals commodity prices virtually halved, in US dollar terms, over the three years from the unprecedented 2011/12 peak, although the fall was tempered by the 19 per cent decline in the US$/A$ exchange rate.
However, the decline in commodity prices from mid-2015 to early 2016 was just as dramatic, and although prices for most commodities have recovered partially during 2016, the overall year-average decline in US$ prices in 2015/16 is estimated to be another 28 per cent decline (partially offset by the 13 per cent depreciation in the A$ to around US73c for the year).
Meanwhile, in response to steep price declines, global investment in new capacity has been slashed, unprofitable operations (at these lower prices) closed, and production costs cut right across the mining industry. This is a natural response, but we note that in curtailing growth in supply, these decisions will eventually sow the seeds of commodity price recovery and new investment cycles, although this will likely play out very differently for each commodity.
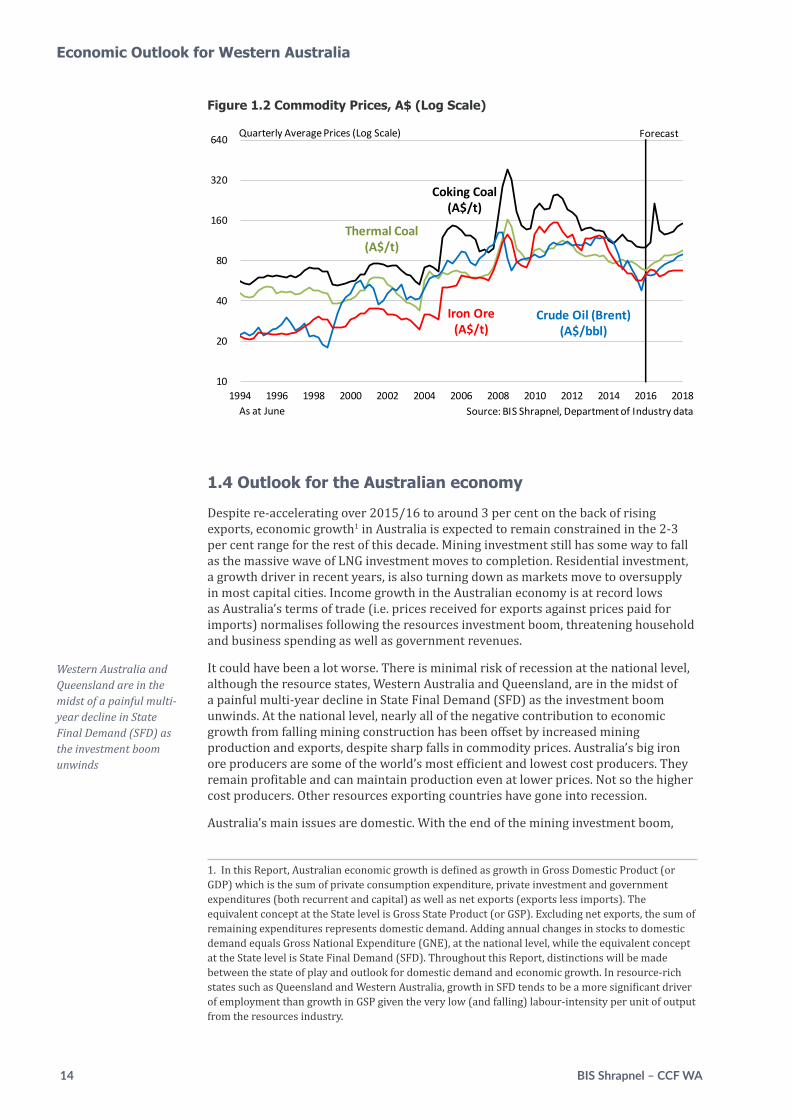
Even so, the price weakness for commodities is expected to continue in the short term. BIS Shrapnel expects that base metals, coking coal and oil prices will be among the first to recover through the latter stages of 2016 and into 2017. On the other hand, iron ore and thermal coal prices are expected to remain weak (with potential downside risk) for the next several years, given very low marginal costs of production and, through recent and current investments, an ability to upscale production if demand growth were to pick up more than expected.
Meanwhile, gold prices are expected to retreat as global markets settle down (post-Brexit) and as US interest rates rise.
For Western Australia, the oil price (affecting gas contract prices) and iron ore price are particularly relevant for driving new resources investment, and hence domestic demand, employment and economic growth.
Global investment in new capacity has been slashed, unprofitable operations closed, and production costs cut right across the mining industry
14 BIS Shrapnel – CCF WA
Figure 1.2 Commodity Prices, A$ (Log Scale)
10
20
40
80
160
320
640
1994 1996 1998 2000 2002 2004 2006 2008 2010 2012 2014 2016 2018
Forecast
As at June Source: BIS Shrapnel, Department of Industry data
Quarterly Average Prices (Log Scale)
Crude Oil (Brent)(A$/bbl)
Coking Coal(A$/t)
Thermal Coal(A$/t)
Iron Ore(A$/t)
1.4 Outlook for the Australian economy
Despite re-accelerating over 2015/16 to around 3 per cent on the back of rising exports, economic growth1 in Australia is expected to remain constrained in the 2-3 per cent range for the rest of this decade. Mining investment still has some way to fall as the massive wave of LNG investment moves to completion. Residential investment, a growth driver in recent years, is also turning down as markets move to oversupply in most capital cities. Income growth in the Australian economy is at record lows as Australia’s terms of trade (i.e. prices received for exports against prices paid for imports) normalises following the resources investment boom, threatening household and business spending as well as government revenues.
It could have been a lot worse. There is minimal risk of recession at the national level, although the resource states, Western Australia and Queensland, are in the midst of a painful multi-year decline in State Final Demand (SFD) as the investment boom unwinds. At the national level, nearly all of the negative contribution to economic growth from falling mining construction has been offset by increased mining production and exports, despite sharp falls in commodity prices. Australia’s big iron ore producers are some of the world’s most efficient and lowest cost producers. They remain profitable and can maintain production even at lower prices. Not so the higher cost producers. Other resources exporting countries have gone into recession.
Australia’s main issues are domestic. With the end of the mining investment boom,
1. In this Report, Australian economic growth is defined as growth in Gross Domestic Product (or GDP) which is the sum of private consumption expenditure, private investment and government expenditures (both recurrent and capital) as well as net exports (exports less imports). The equivalent concept at the State level is Gross State Product (or GSP). Excluding net exports, the sum of remaining expenditures represents domestic demand. Adding annual changes in stocks to domestic demand equals Gross National Expenditure (GNE), at the national level, while the equivalent concept at the State level is State Final Demand (SFD). Throughout this Report, distinctions will be made between the state of play and outlook for domestic demand and economic growth. In resource-rich states such as Queensland and Western Australia, growth in SFD tends to be a more significant driver of employment than growth in GSP given the very low (and falling) labour-intensity per unit of output from the resources industry.
Western Australia and Queensland are in the midst of a painful multi-year decline in State Final Demand (SFD) as the investment boom unwinds
Economic Outlook for Western Australia
WA Infrastructure Report 2017: A construction economy in transition 15
a protracted and difficult structural transition is underway. This involves rebuilding trade-exposed industries (such as education, tourism and manufacturing) that were decimated by the high Australian dollar, in turn driving a recovery in non-mining growth in production and investment. This will take time. Over the next few years, the Australian economy will be characterised by:
• Further falls in mining investment (mainly in oil and gas) taking the total decline to 74 per cent below the peak
• Falling residential building, a key driver of growth over the last three years• Recovery in infrastructure spending by governments• Recovery in finance and business services as non-mining growth and investment
gradually build momentum• Major regional and industry shifts• Low inflation and interest rates• An Australian dollar staying in the US$0.70 to US$0.80 band
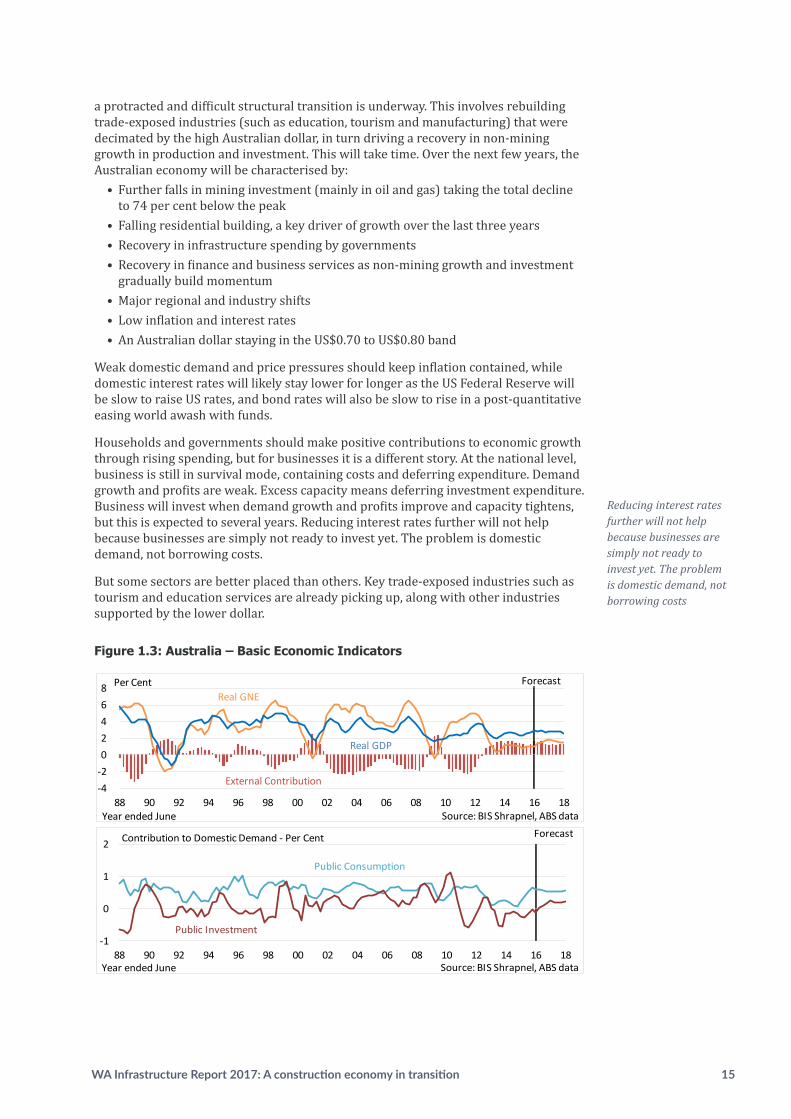
Weak domestic demand and price pressures should keep inflation contained, while domestic interest rates will likely stay lower for longer as the US Federal Reserve will be slow to raise US rates, and bond rates will also be slow to rise in a post-quantitative easing world awash with funds.
Households and governments should make positive contributions to economic growth through rising spending, but for businesses it is a different story. At the national level, business is still in survival mode, containing costs and deferring expenditure. Demand growth and profits are weak. Excess capacity means deferring investment expenditure. Business will invest when demand growth and profits improve and capacity tightens, but this is expected to several years. Reducing interest rates further will not help because businesses are simply not ready to invest yet. The problem is domestic demand, not borrowing costs.
But some sectors are better placed than others. Key trade-exposed industries such as tourism and education services are already picking up, along with other industries supported by the lower dollar.
Figure 1.3: Australia – Basic Economic Indicators
Outlook for the Western Australian Economy
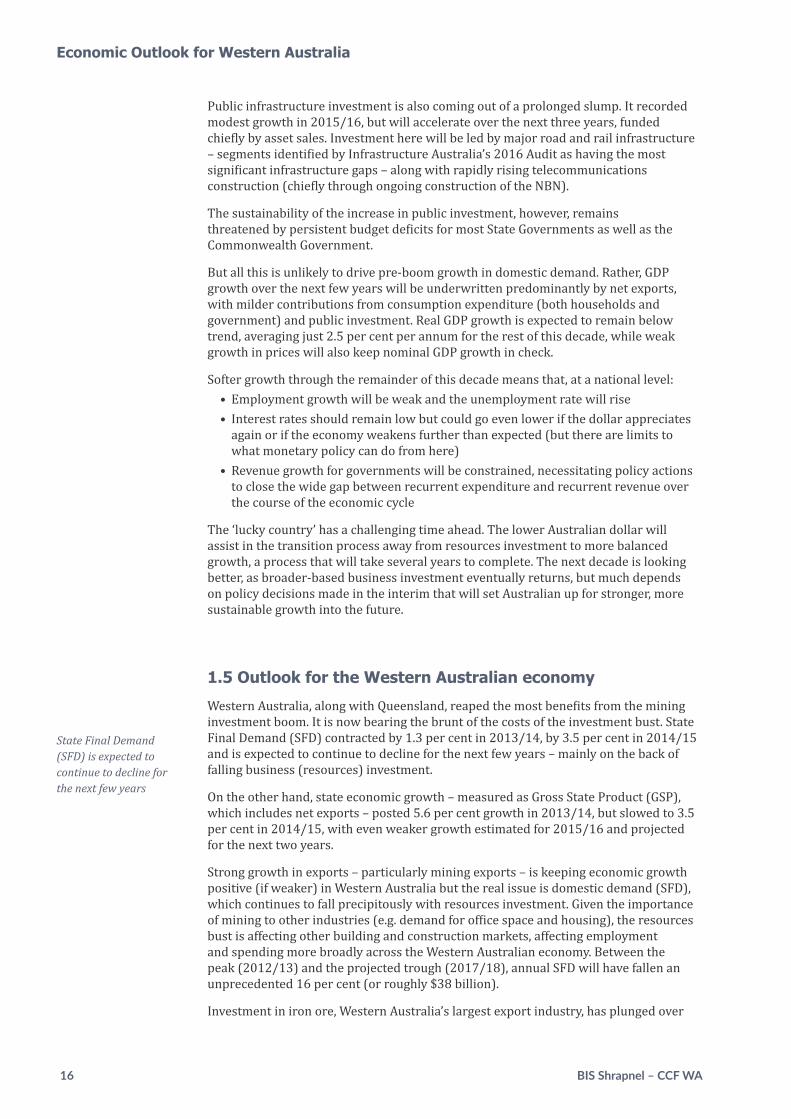
Western Australia, along with Queensland, reaped the most benefits from the mining investment boom. It is now bearing the brunt of the costs of the investment bust. State Final Demand (SFD) contracted by 1.3 per cent in 2013/14, by 3.5 per cent in 2014/15 and is expected to continue to decline for the next few years – mainly on the back of falling business (resources) investment. On the other hand, state economic growth – measured as Gross State Product (GSP), which includes net exports – posted 5.6 per cent growth in 2013/14, but slowed to 3.5 per cent in 2014/15, with even weaker growth estimated for 2015/16 and projected for the next two years. Strong growth in exports – particularly mining exports – is keeping economic growth positive (if weaker) in Western Australia but the real issue is domestic demand (SFD), which continues to fall precipitously with resources investment. Given the importance of mining to other industries (e.g. demand for office space and housing), the resources bust is affecting other building and construction markets, affecting employment and spending more broadly across the Western Australian economy. Between the peak (2012/13) and the projected trough (2017/18), annual SFD will have fallen an unprecedented 16 per cent (or roughly $38 billion). Investment in iron ore, Western Australia’s largest export industry, has plunged over the past few years in tandem with iron ore prices, which has had a dampening effect on other sectors such as harbours, railways and electricity. Iron ore investment is also expected to fall further (it has already more than halved from the 2012/13 peak) as key producers have all indicated significant cut backs in capital expenditure programs over the next few years. On the other hand, new
0
5
10
15
-4-202468
88 90 92 94 96 98 00 02 04 06 08 10 12 14 16 18
Per Cent
External Contribution
ForecastReal GNE
Real GDP
Year ended June Source: BIS Shrapnel, ABS data
02468101214161820
-1
0
1
2
88 90 92 94 96 98 00 02 04 06 08 10 12 14 16 18
Public Consumption
Public Investment
Source: BIS Shrapnel, ABS dataYear ended June
Contribution to Domestic Demand - Per Cent Forecast
Reducing interest rates further will not help because businesses are simply not ready to invest yet. The problem is domestic demand, not borrowing costs
16 BIS Shrapnel – CCF WA
Public infrastructure investment is also coming out of a prolonged slump. It recorded modest growth in 2015/16, but will accelerate over the next three years, funded chiefly by asset sales. Investment here will be led by major road and rail infrastructure – segments identified by Infrastructure Australia’s 2016 Audit as having the most significant infrastructure gaps – along with rapidly rising telecommunications construction (chiefly through ongoing construction of the NBN).
The sustainability of the increase in public investment, however, remains threatened by persistent budget deficits for most State Governments as well as the Commonwealth Government.
But all this is unlikely to drive pre-boom growth in domestic demand. Rather, GDP growth over the next few years will be underwritten predominantly by net exports, with milder contributions from consumption expenditure (both households and government) and public investment. Real GDP growth is expected to remain below trend, averaging just 2.5 per cent per annum for the rest of this decade, while weak growth in prices will also keep nominal GDP growth in check.
Softer growth through the remainder of this decade means that, at a national level:• Employment growth will be weak and the unemployment rate will rise• Interest rates should remain low but could go even lower if the dollar appreciates
again or if the economy weakens further than expected (but there are limits to what monetary policy can do from here)
• Revenue growth for governments will be constrained, necessitating policy actions to close the wide gap between recurrent expenditure and recurrent revenue over the course of the economic cycle
The ‘lucky country’ has a challenging time ahead. The lower Australian dollar will assist in the transition process away from resources investment to more balanced growth, a process that will take several years to complete. The next decade is looking better, as broader-based business investment eventually returns, but much depends on policy decisions made in the interim that will set Australian up for stronger, more sustainable growth into the future.
1.5 Outlook for the Western Australian economy
Western Australia, along with Queensland, reaped the most benefits from the mining investment boom. It is now bearing the brunt of the costs of the investment bust. State Final Demand (SFD) contracted by 1.3 per cent in 2013/14, by 3.5 per cent in 2014/15 and is expected to continue to decline for the next few years – mainly on the back of falling business (resources) investment.
On the other hand, state economic growth – measured as Gross State Product (GSP), which includes net exports – posted 5.6 per cent growth in 2013/14, but slowed to 3.5 per cent in 2014/15, with even weaker growth estimated for 2015/16 and projected for the next two years.
Strong growth in exports – particularly mining exports – is keeping economic growth positive (if weaker) in Western Australia but the real issue is domestic demand (SFD), which continues to fall precipitously with resources investment. Given the importance of mining to other industries (e.g. demand for office space and housing), the resources bust is affecting other building and construction markets, affecting employment and spending more broadly across the Western Australian economy. Between the peak (2012/13) and the projected trough (2017/18), annual SFD will have fallen an unprecedented 16 per cent (or roughly $38 billion).
Investment in iron ore, Western Australia’s largest export industry, has plunged over
State Final Demand (SFD) is expected to continue to decline for the next few years
Economic Outlook for Western Australia
WA Infrastructure Report 2017: A construction economy in transition 17
the past few years in tandem with iron ore prices, which has had a dampening effect on other sectors such as harbours, railways and electricity. Iron ore investment is also expected to fall further (it has already more than halved from the 2012/13 peak) as key producers have all indicated significant cut backs in capital expenditure programs over the next few years. On the other hand, new projects are commencing in nickel, gold and other minerals, helped by the 30 per cent depreciation of the Australian dollar over the past three years (offsetting much of the US$ price decline in gold and nickel prices) and significant falls in construction and development costs.
However, it is the 80 per cent plunge in oil and gas construction over the next three years – as the massive Gorgon, Wheatstone and Prelude LNG projects are completed (and not replaced by similar sized projects) – which will drive the 76 per cent peak-to-trough decline in resources engineering construction, effectively back to 2005 levels.
On a positive note, not all of the decline in measured resources investment will be concentrated in Western Australia itself. There has been a large and growing component of the value categorised to engineering construction which has been sourced from overseas (e.g. LNG modules fabricated offshore), while some of the ‘local’ content also is sourced from interstate. So while WA did not receive absolutely all of the benefits of the huge upswing in resources-related engineering construction, it will also not suffer all of the negatives of the downturn. But even so, the downturn’s effects on the domestic economy will still be very painful, and unprecedented in size.
Employment growth remained surprisingly resilient in 2013/14 and 2014/15, but turned negative through 2015/16, with a net loss of 11,000 jobs. Similar losses are anticipated over the next two years. With fewer jobs, growth in retail turnover and household spending has been weak over the last two years, and this trend is expected to continue.
Meanwhile, following a boom through much of the 2000s, Government spending (both recurrent and capital) has also fallen in recent years, as State Government finances have been hit by the collapse in commodity prices and associated royalties, as well as the lagged impact of a much lower share of GST revenues.
1.6 Key risks to the Western Australian economic forecasts
Over the next few years, the biggest risk for the Western Australian economy relates to the economic outlook for key trading partners, such as China and India – in particular, the strategic decisions those nations make in achieving sustainable growth, and how this will impact on the global trade of resources for which Western Australia has a strong supply position, particularly in iron ore and gas. Much of this remains outside of the control of Australian government and industry.
While an orderly decline in resources investment over the next few years is assumed, the risk is the downturn could be sharper if economic growth is weaker than expected in China and/or strategic decisions are made which otherwise reduce growth in demand for resources.
There are also upside and downside risks surrounding the state’s other trade-exposed industries. The weaker dollar will encourage overseas and domestic tourists, potentially expanding the tourism industry, while agriculture and manufacturing exports will add to burgeoning mining exports to boost GSP growth. However, property and business services and financial and insurance services will face an unavoidable decline over the next few years as demand from mining firms and firms servicing the mining industry contracts.
Finally, the remaining key risk surrounds commodity prices, and the impact it will
New projects are commencing in nickel, gold and other minerals, helped by depreciation of the Australian dollar over the past three years and significant falls in construction and development costs
18 BIS Shrapnel – CCF WA
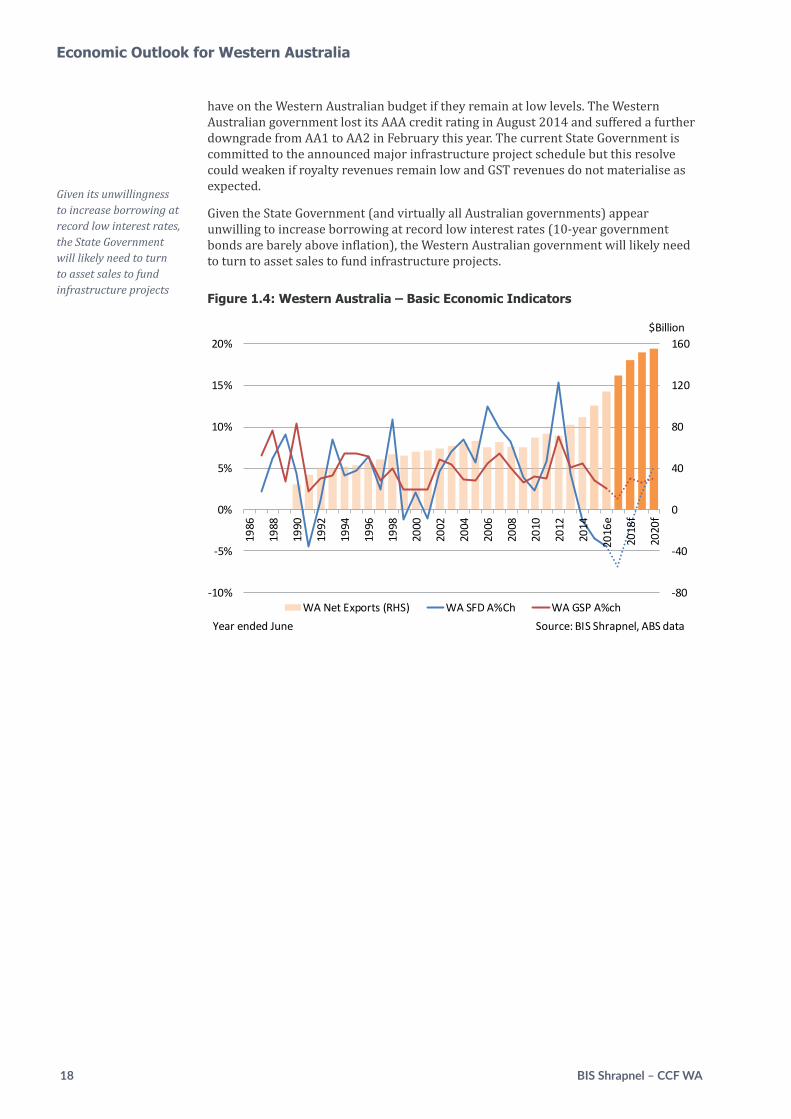
have on the Western Australian budget if they remain at low levels. The Western Australian government lost its AAA credit rating in August 2014 and suffered a further downgrade from AA1 to AA2 in February this year. The current State Government is committed to the announced major infrastructure project schedule but this resolve could weaken if royalty revenues remain low and GST revenues do not materialise as expected.
Given the State Government (and virtually all Australian governments) appear unwilling to increase borrowing at record low interest rates (10-year government bonds are barely above inflation), the Western Australian government will likely need to turn to asset sales to fund infrastructure projects.
Figure 1.4: Western Australia – Basic Economic Indicators
Given its unwillingness to increase borrowing at record low interest rates, the State Government will likely need to turn to asset sales to fund infrastructure projects
-80
-40
0
40
80
120
160
-10%
-5%
0%
5%
10%
15%
20%
1986
1988
1990
1992
1994
1996
1998
2000
2002
2004
2006
2008
2010
2012
2014
2016
e
2018
f
2020
f
WA Net Exports (RHS) WA SFD A%Ch WA GSP A%ch
$Billion
Source: BIS Shrapnel, ABS dataYear ended June
Economic Outlook for Western Australia
WA Infrastructure Report 2017: A construction economy in transition 19
With the last phase of the Western Australia resources investment boom – LNG – now moving towards completion, measured construction activity is expected to contract severely. The resources boom attracted greater
net population inflows (from other states as well as from overseas migration) boosting demand for services, office space and housing while the promise of stronger government revenues encouraged large infrastructure programs to support the mining regions as well as increasingly congested urban areas. But now this virtuous cycle of investment and growth is in sharp reverse, with falling construction work driving an unprecedented collapse in domestic demand. In this weaker environment, cost growth is expected to be contained, with productivity improvements key to the fortunes of the Western Australian construction industry.
The key points can be summarised as follows:
Following significant declines in recent years, the Western Australian construction market is set to plummet over 2016/17 and 2017/18. From a peak of around $57 billion in 2013/14, total construction work done (encompassing residential building, non-residential building and engineering construction) has declined around 11 per cent, to a little over $50 billion in 2015/16. However, a sharp downturn is in prospect, with total construction expected to trough at $23.5 billion in 2018/19, around 55 per cent below 2015/16 levels. This trajectory has large negative consequences for State employment and economic growth.
The majority of the downturn will occur in the engineering construction segment as major resources project works move to completion. The sheer size of the mega LNG projects, particularly, means that oil and gas construction will be responsible for $20 billion of the projected $27 billion construction market decline in Western Australia over the next three years. Further declines are also expected on other minerals construction as a consequence of low commodity prices, with some opportunities for gold, rare earths and mineral sands projects. Overall, the decline in other minerals construction will be relatively modest from here – being already 60 per cent lower than the 2012/13 peak in work done.
The downturn in resources investment has already driven a collapse in the construction of resources-related civil infrastructure. Privately funded rail and port construction work has already fallen a combined $7.8 billion since the 2012/13 peak and privately funded electricity construction work is down 85 per cent ($1.8 billion). Apart from other minerals construction, this is where the construction downturn so far has hit the hardest. Further falls in resources-related infrastructure construction are expected in coming years, led by a 90 per cent fall in pipelines construction as LNG works are completed.
Publicly funded infrastructure construction is set to stabilise around current levels over 2016/17 and 2017/18. Growing sectors here include telecommunications (NBN), railways (Forrestfield-Airport Link) and roads (Roe 8 and NorthLink WA), but growth in these sectors is likely to be offset by falling construction work in harbours, electricity and recreation.
Falling construction activity, as well as lower prices for international inputs such as steel and oil, has implications for costs. Aggregate measures of construction costs, such as the Road and Bridge Index published by the Australian Bureau of Statistics, have shown cost growth has slowed significantly since the peak of the investment boom, with costs falling in 2015/16. Further falls cannot be ruled out given that the Western Australian construction industry remains under substantial pressure to boost productivity and survive the challenges of the downturn.
2. Western Australia Infrastructure Outlook
Total construction work done in WA will trough at $23.5 billion in 2018/19, around 55 per cent below 2015/16 levels
Growth in publicly funded telecommunications, rail and road infrastructure is likely to be offset by declines in harbours, electricity and recreation
20 BIS Shrapnel – CCF WA
2.1 Recent trends and outlook for construction activity
Western Australia’s construction activity has undergone dramatic shifts over the past decade, with resources investment the key driver. In the decade between 2002/03 and 2012/13 (the peak), annual construction work done in Western Australia soared from $14.8 billion to $56.9 billion.1 Much of this growth occurred in the heavily resources-exposed engineering construction market, which grew from $7.0 billion in 2002/03 to a peak of $44.3 billion in 2012/13. However, through stimulating population growth and domestic demand, the resources investment boom also drove increases in residential and non-residential building, while rising tax revenues at the Federal and State level also provided the fiscal capability to fund a substantial non-resources infrastructure asset program.
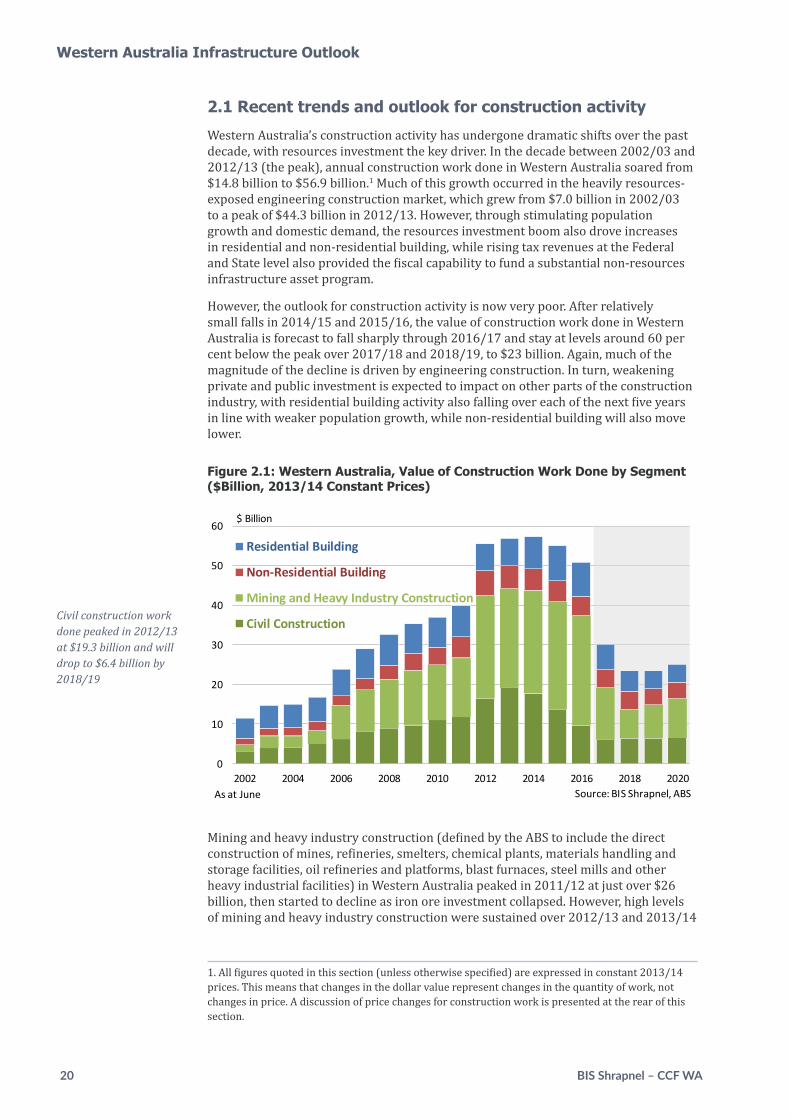
However, the outlook for construction activity is now very poor. After relatively small falls in 2014/15 and 2015/16, the value of construction work done in Western Australia is forecast to fall sharply through 2016/17 and stay at levels around 60 per cent below the peak over 2017/18 and 2018/19, to $23 billion. Again, much of the magnitude of the decline is driven by engineering construction. In turn, weakening private and public investment is expected to impact on other parts of the construction industry, with residential building activity also falling over each of the next five years in line with weaker population growth, while non-residential building will also move lower.
Figure 2.1: Western Australia, Value of Construction Work Done by Segment ($Billion, 2013/14 Constant Prices)
Figure 2.1: Western Australia, Value of Construction Work Done by Segment $Billion, 2013/14 Constant Prices
0
10
20
30
40
50
60
2002 2004 2006 2008 2010 2012 2014 2016 2018 2020As at June
Residential Building
Non-Residential Building
Mining and Heavy Industry Construction
Civil Construction
Source: BIS Shrapnel, ABS
$ Billion
Mining and heavy industry construction (defined by the ABS to include the direct construction of mines, refineries, smelters, chemical plants, materials handling and storage facilities, oil refineries and platforms, blast furnaces, steel mills and other heavy industrial facilities) in Western Australia peaked in 2011/12 at just over $26 billion, then started to decline as iron ore investment collapsed. However, high levels of mining and heavy industry construction were sustained over 2012/13 and 2013/14
1. All figures quoted in this section (unless otherwise specified) are expressed in constant 2013/14 prices. This means that changes in the dollar value represent changes in the quantity of work, not changes in price. A discussion of price changes for construction work is presented at the rear of this section.
Civil construction work done peaked in 2012/13 at $19.3 billion and will drop to $6.4 billion by 2018/19
Western Australia Infrastructure Outlook

WA Infrastructure Report 2017: A construction economy in transition 21
as rising oil and gas construction (from the large LNG projects) more or less offset the falls in other minerals work done. Through 2015/16, however, mining and heavy industry construction actually started rising again as oil and gas-related construction (as measured by the ABS, and likely dominated by offshore work) boomed. But the LNG boom construction phase is projected to wind down sharply in coming years and hence, so too will measured mining and heavy industry construction – activity here is expected to halve through 2016/17 and halve again the falling year. Meanwhile, civil construction peaked in 2012/13 at $19.3 billion, but has since fallen sharply as both public and private (resources-related) infrastructure investment has waned. BIS Shrapnel estimates that civil construction work done in Western Australia through 2015/16 has fallen to around $9.5 billion, but this value is expected to drop to a trough of $6.4 billion by 2018/19 – a fall of 66 per cent from the 2012/13 peak. To put this into a historical perspective, this is roughly equivalent to the (non-mining) civil work which occurred in 2005/06.
Construction EmploymentThe dramatic decline in construction work through the next few years will also impact directly on construction employment. According to the ABS, construction employment in Western Australia rose from a trough of 70,000 persons in late 2002 to a peak of 162,000 persons in mid-2015. Since then, construction employment has fallen by around 22,000 persons, and a similar decline in projected by BIS Shrapnel over the next two years as construction work done slumps.
Residential BuildingResidential building in Western Australia was positively influenced by the 2000s resources investment boom, with population growth running well ahead of housing construction right up until 2013/14. Weak commencements following the GFC were simply unable to keep pace with demand for housing stock as the second phase of the resources boom (driven by both new LNG and iron ore investments) got underway from 2009/10. Consequently, a sizeable dwelling stock deficiency emerged, both in Greater Perth as well as in mining regions.
It was not until 2012/13 that housing commencements began to surge again in response to demand, prices and yields, with increases for detached, medium density and high rise residential building. The strong pipeline of developments, coupled with the significant underlying stock deficiency and low interest rates, kept residential building work done in Western Australia at high levels in 2015/16 (down just 2.5 per cent from the previous year’s peak). But now, with completions running well ahead of demand and population growth slumping (particularly as interstate migration flows switch from positive to negative), a sharp downward correction in residential building is projected. According to BIS Shrapnel, residential building work done in Western Australia will nearly halve over the next four years, with no upswing in sight.
Non-Residential BuildingNon-residential building work done across Western Australia tripled during the resources investment boom years, to reach $6.1 billion in work done in 2011/12. While commercial and industrial building was the main driver, education stimulus funding also caused a spike in the early 2010s. However, with the fading of the education building stimulus, and oversupply emerging in commercial property markets, total non-residential building started to decline in 2012/13. By 2015/16, activity had fallen back nearly one quarter from the 2011/12 peak, but further substantial falls are in prospect as more major commercial developments move to completion (and add to the glut in commercial property space) as well as work on other projects such as the new Perth Stadium.
22 BIS Shrapnel – CCF WA
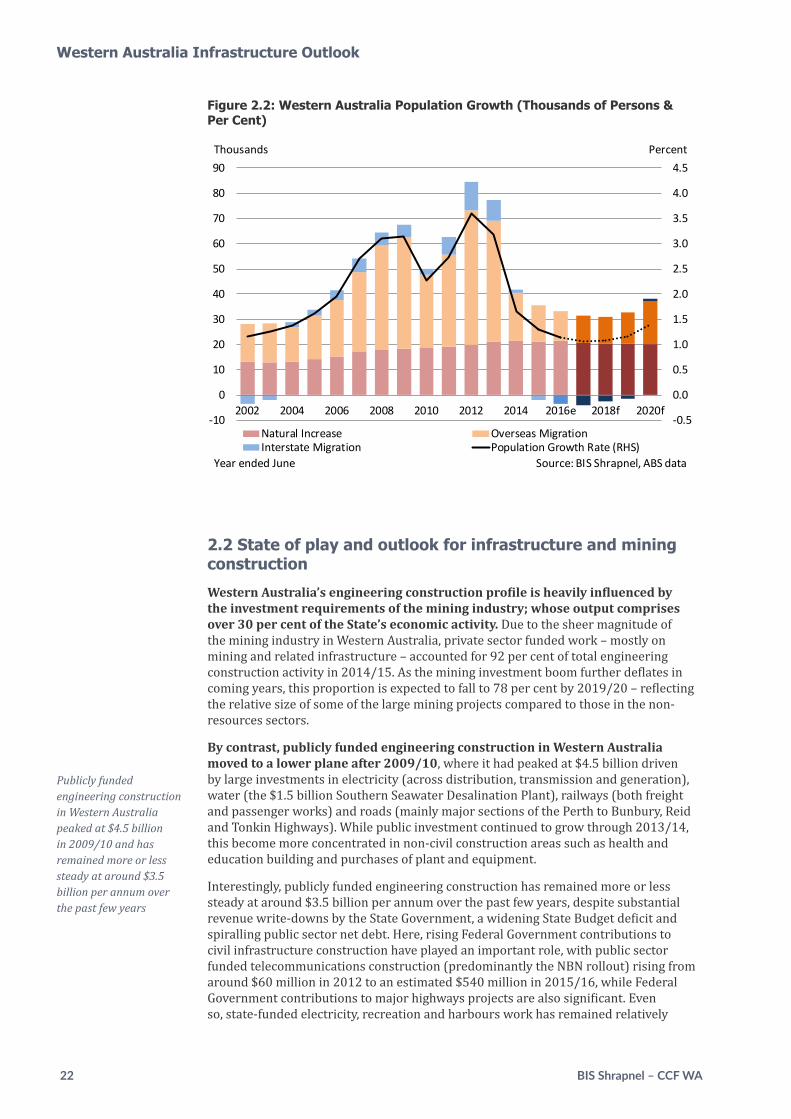
Figure 2.2: Western Australia Population Growth (Thousands of Persons & Per Cent)
-0.5
0.0
0.5
1.0
1.5
2.0
2.5
3.0
3.5
4.0
4.5
-10
0
10
20
30
40
50
60
70
80
90
2002 2004 2006 2008 2010 2012 2014 2016e 2018f 2020f
Natural Increase Overseas MigrationInterstate Migration Population Growth Rate (RHS)
Source: BIS Shrapnel, ABS data
Percent
Year ended June
Thousands
2.2 State of play and outlook for infrastructure and mining construction
Western Australia’s engineering construction profile is heavily influenced by the investment requirements of the mining industry; whose output comprises over 30 per cent of the State’s economic activity. Due to the sheer magnitude of the mining industry in Western Australia, private sector funded work – mostly on mining and related infrastructure – accounted for 92 per cent of total engineering construction activity in 2014/15. As the mining investment boom further deflates in coming years, this proportion is expected to fall to 78 per cent by 2019/20 – reflecting the relative size of some of the large mining projects compared to those in the non-resources sectors.
By contrast, publicly funded engineering construction in Western Australia moved to a lower plane after 2009/10, where it had peaked at $4.5 billion driven by large investments in electricity (across distribution, transmission and generation), water (the $1.5 billion Southern Seawater Desalination Plant), railways (both freight and passenger works) and roads (mainly major sections of the Perth to Bunbury, Reid and Tonkin Highways). While public investment continued to grow through 2013/14, this become more concentrated in non-civil construction areas such as health and education building and purchases of plant and equipment.
Interestingly, publicly funded engineering construction has remained more or less steady at around $3.5 billion per annum over the past few years, despite substantial revenue write-downs by the State Government, a widening State Budget deficit and spiralling public sector net debt. Here, rising Federal Government contributions to civil infrastructure construction have played an important role, with public sector funded telecommunications construction (predominantly the NBN rollout) rising from around $60 million in 2012 to an estimated $540 million in 2015/16, while Federal Government contributions to major highways projects are also significant. Even so, state-funded electricity, recreation and harbours work has remained relatively
Western Australia Infrastructure Outlook
Publicly funded engineering construction in Western Australia peaked at $4.5 billion in 2009/10 and has remained more or less steady at around $3.5 billion per annum over the past few years

WA Infrastructure Report 2017: A construction economy in transition 23
robust, but will likely prove unsustainable in future years. Western Australian public infrastructure funding is likely to become more dependent on Federal contributions from here, with the slight uptick in work done projected by BIS Shrapnel based on projects such as the $2 billion Forrestfield Airport Link and the $1.8 billion Perth Freight Link, which have significant Federal Government contributions ($490 million and $1.2 billion respectively).
Figure 2.3: Western Australia Engineering Construction, $Billion, 2013/14 Prices
0
10
20
30
40
50
1994 1996 1998 2000 2002 2004 2006 2008 2010 2012 2014 2016e 2018f 2020f
Privately funded
Publicly funded
Year ended June Source: BIS Shrapnel, ABS
$ Billion (in constant prices), value of work done
Transport InfrastructureTransport infrastructure construction includes the construction or roads, bridges, railways and harbours, and amounted to $3.1 billion in work done during 2015/16 according to BIS Shrapnel estimates. This is down 50 per cent from the previous year, and 73 per cent below the peak in 2012/13.
Figure 2.4: Western Australia Engineering Construction, $Billion, 2013/14 Prices – Transport Sectors
0
2
4
6
8
10
12
1994 1996 1998 2000 2002 2004 2006 2008 2010 2012 2014 2016e 2018f 2020f
Harbours
Railways
Bridges
Roads
Year ended June Source: BIS Shrapnel, ABS
$ Billion (in constant prices), value of work done
24 BIS Shrapnel – CCF WA
The fall in transport infrastructure is a direct consequence of the decline in resources-related investment in harbours and rail
The scale of the decline is a direct consequence of the inevitable decline in resources investment, with the segments driving most of the decline being harbours and rail. Harbours work done has fallen from a peak of $5.5 billion in 2012/13 to an estimated $700 million in 2015/16 as substantial works on Pilbara iron ore ports moves to completion. Similarly, railways construction has fallen from $3.6 billion in 2012/13 to an estimated $2.5 billion in 2014/15 as Pilbara iron ore rail projects wind down. Road construction has also fallen away, from $2.4 billion in 2012/13 to an estimated $1.75 billion in 2015/16. Again, much of the decline in road construction in recent years has occurred in the private sector (representing mining access roads as well as subdivision developments), with publicly funded road construction generally steady in the $1.1-$1.2 billion per annum range over the past five years.
While we are close to the bottom of the bust in transport construction, only very modest growth is projected for the next few years, as shown in Figure 2.4. Transport infrastructure construction is expected to fall again through 2016/17, as the completion of major harbours and railways works for the iron ore industry more than offset rising public infrastructure works. Transport infrastructure construction is then tipped to rise significantly over the subsequent three years, led by public sector funded projects including Perth Freight Link, NorthLink WA and the Forrestfield Airport Link.
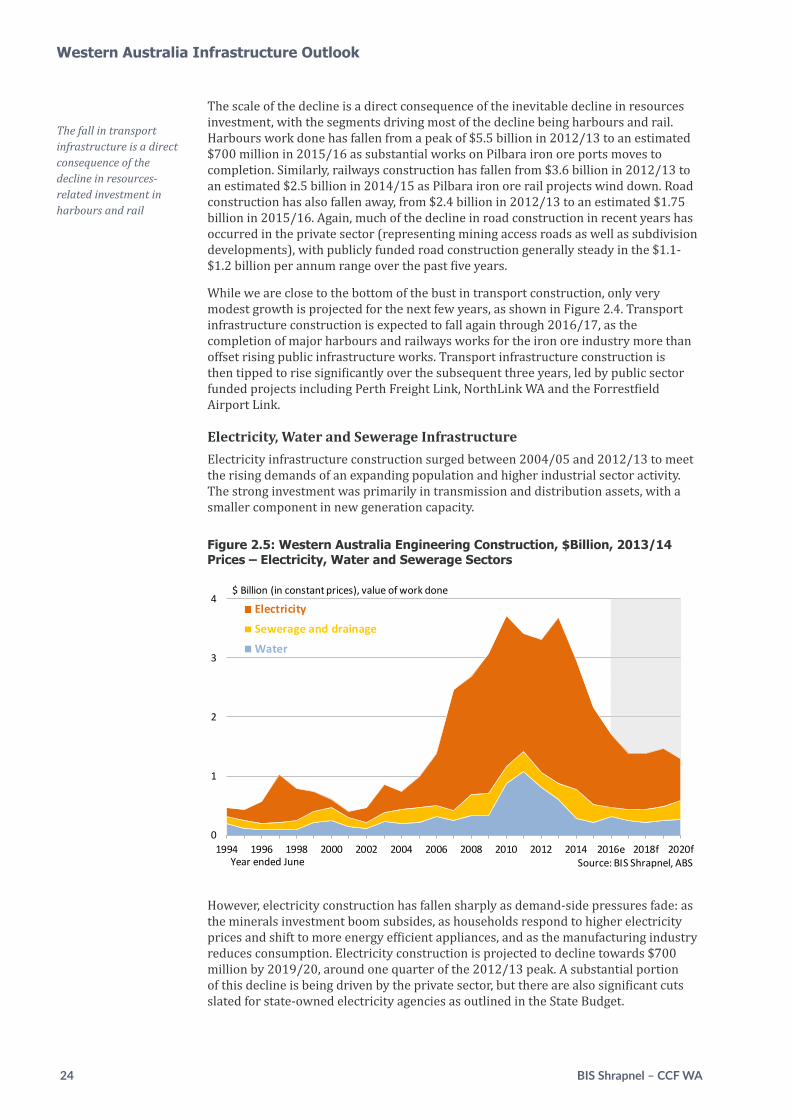
Electricity, Water and Sewerage InfrastructureElectricity infrastructure construction surged between 2004/05 and 2012/13 to meet the rising demands of an expanding population and higher industrial sector activity. The strong investment was primarily in transmission and distribution assets, with a smaller component in new generation capacity.
Figure 2.5: Western Australia Engineering Construction, $Billion, 2013/14 Prices – Electricity, Water and Sewerage Sectors
0
1
2
3
4
1994 1996 1998 2000 2002 2004 2006 2008 2010 2012 2014 2016e 2018f 2020f
Electricity
Sewerage and drainage
Water
Year ended June Source: BIS Shrapnel, ABS
$ Billion (in constant prices), value of work done
However, electricity construction has fallen sharply as demand-side pressures fade: as the minerals investment boom subsides, as households respond to higher electricity prices and shift to more energy efficient appliances, and as the manufacturing industry reduces consumption. Electricity construction is projected to decline towards $700 million by 2019/20, around one quarter of the 2012/13 peak. A substantial portion of this decline is being driven by the private sector, but there are also significant cuts slated for state-owned electricity agencies as outlined in the State Budget.
Western Australia Infrastructure Outlook
WA Infrastructure Report 2017: A construction economy in transition 25
Water infrastructure construction has also fallen steeply over the past few years, with the completion of the Southern Seawater Desalination Plant the key driver. While the outlook for water infrastructure construction is now relatively flat, sewerage construction activity will likely move higher driven by the construction phase of the Woodman Point wastewater treatment plant. This follows a hiatus in sewerage-related works with the completion of construction of the East Rockingham and Port Hedland wastewater treatment plant projects.
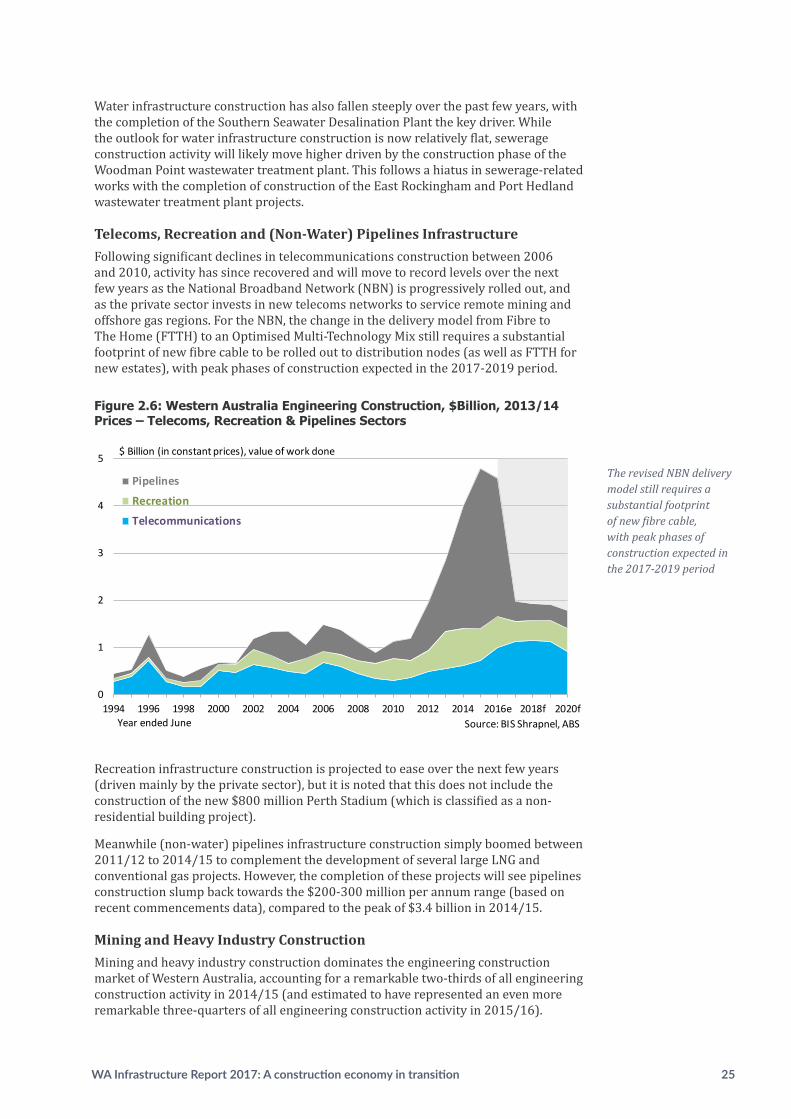
Telecoms, Recreation and (Non-Water) Pipelines InfrastructureFollowing significant declines in telecommunications construction between 2006 and 2010, activity has since recovered and will move to record levels over the next few years as the National Broadband Network (NBN) is progressively rolled out, and as the private sector invests in new telecoms networks to service remote mining and offshore gas regions. For the NBN, the change in the delivery model from Fibre to The Home (FTTH) to an Optimised Multi-Technology Mix still requires a substantial footprint of new fibre cable to be rolled out to distribution nodes (as well as FTTH for new estates), with peak phases of construction expected in the 2017-2019 period.
Figure 2.6: Western Australia Engineering Construction, $Billion, 2013/14 Prices – Telecoms, Recreation & Pipelines Sectors
0
1
2
3
4
5
1994 1996 1998 2000 2002 2004 2006 2008 2010 2012 2014 2016e 2018f 2020f
Pipelines
Recreation
Telecommunications
Year ended June Source: BIS Shrapnel, ABS
$ Billion (in constant prices), value of work done
Recreation infrastructure construction is projected to ease over the next few years (driven mainly by the private sector), but it is noted that this does not include the construction of the new $800 million Perth Stadium (which is classified as a non-residential building project).
Meanwhile (non-water) pipelines infrastructure construction simply boomed between 2011/12 to 2014/15 to complement the development of several large LNG and conventional gas projects. However, the completion of these projects will see pipelines construction slump back towards the $200-300 million per annum range (based on recent commencements data), compared to the peak of $3.4 billion in 2014/15.
Mining and Heavy Industry ConstructionMining and heavy industry construction dominates the engineering construction market of Western Australia, accounting for a remarkable two-thirds of all engineering construction activity in 2014/15 (and estimated to have represented an even more remarkable three-quarters of all engineering construction activity in 2015/16).
The revised NBN delivery model still requires a substantial footprint of new fibre cable, with peak phases of construction expected in the 2017-2019 period
26 BIS Shrapnel – CCF WA
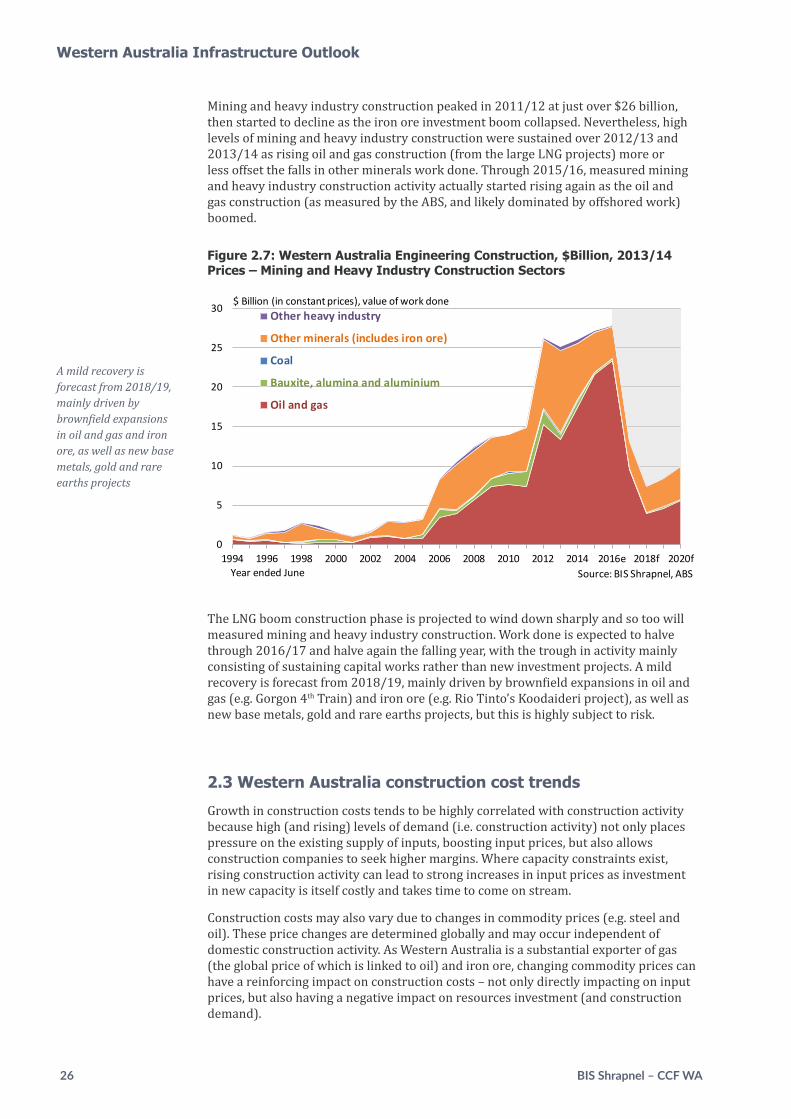
Mining and heavy industry construction peaked in 2011/12 at just over $26 billion, then started to decline as the iron ore investment boom collapsed. Nevertheless, high levels of mining and heavy industry construction were sustained over 2012/13 and 2013/14 as rising oil and gas construction (from the large LNG projects) more or less offset the falls in other minerals work done. Through 2015/16, measured mining and heavy industry construction activity actually started rising again as the oil and gas construction (as measured by the ABS, and likely dominated by offshored work) boomed.
Figure 2.7: Western Australia Engineering Construction, $Billion, 2013/14 Prices – Mining and Heavy Industry Construction Sectors
0
5
10
15
20
25
30
1994 1996 1998 2000 2002 2004 2006 2008 2010 2012 2014 2016e 2018f 2020f
Other heavy industry
Other minerals (includes iron ore)
Coal
Bauxite, alumina and aluminium
Oil and gas
Year ended June Source: BIS Shrapnel, ABS
$ Billion (in constant prices), value of work done
The LNG boom construction phase is projected to wind down sharply and so too will measured mining and heavy industry construction. Work done is expected to halve through 2016/17 and halve again the falling year, with the trough in activity mainly consisting of sustaining capital works rather than new investment projects. A mild recovery is forecast from 2018/19, mainly driven by brownfield expansions in oil and gas (e.g. Gorgon 4th Train) and iron ore (e.g. Rio Tinto’s Koodaideri project), as well as new base metals, gold and rare earths projects, but this is highly subject to risk.
2.3 Western Australia construction cost trends
Growth in construction costs tends to be highly correlated with construction activity because high (and rising) levels of demand (i.e. construction activity) not only places pressure on the existing supply of inputs, boosting input prices, but also allows construction companies to seek higher margins. Where capacity constraints exist, rising construction activity can lead to strong increases in input prices as investment in new capacity is itself costly and takes time to come on stream.
Construction costs may also vary due to changes in commodity prices (e.g. steel and oil). These price changes are determined globally and may occur independent of domestic construction activity. As Western Australia is a substantial exporter of gas (the global price of which is linked to oil) and iron ore, changing commodity prices can have a reinforcing impact on construction costs – not only directly impacting on input prices, but also having a negative impact on resources investment (and construction demand).
A mild recovery is forecast from 2018/19, mainly driven by brownfield expansions in oil and gas and iron ore, as well as new base metals, gold and rare earths projects
Western Australia Infrastructure Outlook
WA Infrastructure Report 2017: A construction economy in transition 27
Figure 2.8: Western Australia Construction and Cost Indexes, 2013/14=100
0
10
20
30
40
50
60
70
40
50
60
70
80
90
100
110
120
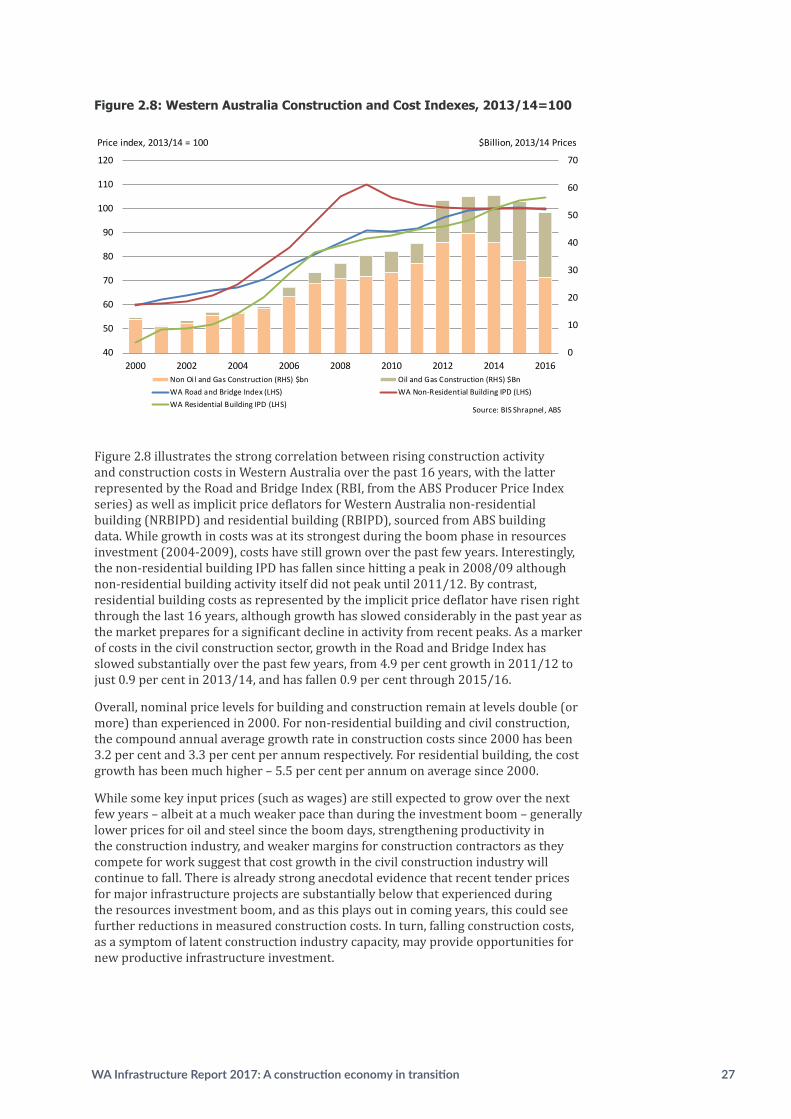
2000 2002 2004 2006 2008 2010 2012 2014 2016Non Oil and Gas Construction (RHS) $bn Oil and Gas Construction (RHS) $BnWA Road and Bridge Index (LHS) WA Non-Residential Building IPD (LHS)WA Residential Building IPD (LHS)
Source: BIS Shrapnel, ABS
Price index, 2013/14 = 100 $Billion, 2013/14 Prices
Figure 2.8 illustrates the strong correlation between rising construction activity and construction costs in Western Australia over the past 16 years, with the latter represented by the Road and Bridge Index (RBI, from the ABS Producer Price Index series) as well as implicit price deflators for Western Australia non-residential building (NRBIPD) and residential building (RBIPD), sourced from ABS building data. While growth in costs was at its strongest during the boom phase in resources investment (2004-2009), costs have still grown over the past few years. Interestingly, the non-residential building IPD has fallen since hitting a peak in 2008/09 although non-residential building activity itself did not peak until 2011/12. By contrast, residential building costs as represented by the implicit price deflator have risen right through the last 16 years, although growth has slowed considerably in the past year as the market prepares for a significant decline in activity from recent peaks. As a marker of costs in the civil construction sector, growth in the Road and Bridge Index has slowed substantially over the past few years, from 4.9 per cent growth in 2011/12 to just 0.9 per cent in 2013/14, and has fallen 0.9 per cent through 2015/16.
Overall, nominal price levels for building and construction remain at levels double (or more) than experienced in 2000. For non-residential building and civil construction, the compound annual average growth rate in construction costs since 2000 has been 3.2 per cent and 3.3 per cent per annum respectively. For residential building, the cost growth has been much higher – 5.5 per cent per annum on average since 2000.
While some key input prices (such as wages) are still expected to grow over the next few years – albeit at a much weaker pace than during the investment boom – generally lower prices for oil and steel since the boom days, strengthening productivity in the construction industry, and weaker margins for construction contractors as they compete for work suggest that cost growth in the civil construction industry will continue to fall. There is already strong anecdotal evidence that recent tender prices for major infrastructure projects are substantially below that experienced during the resources investment boom, and as this plays out in coming years, this could see further reductions in measured construction costs. In turn, falling construction costs, as a symptom of latent construction industry capacity, may provide opportunities for new productive infrastructure investment.
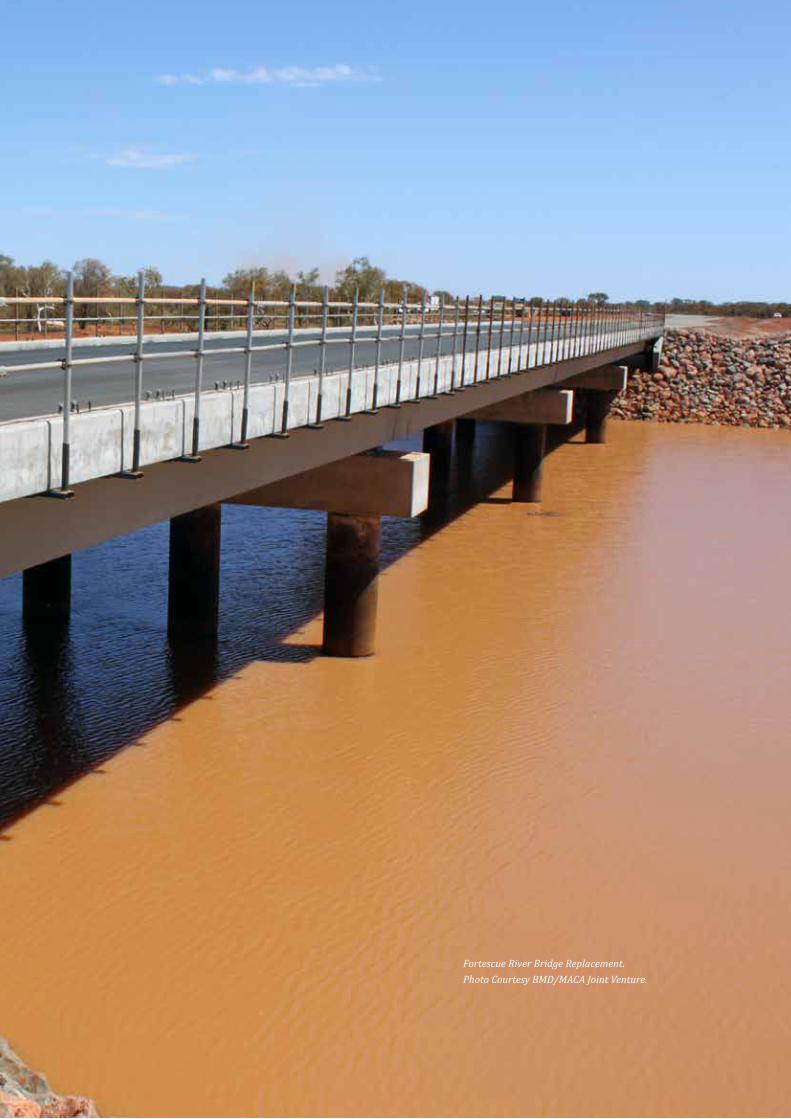
Onslow Water Tanks Project. Photo courtesy of SRG Limited
Fortescue River Bridge Replacement. Photo Courtesy BMD/MACA Joint Venture.
30 BIS Shrapnel – CCF WA
3. Challenges, Implications and Recommendations
Figure 3.1 summarises the state of play and outlook for civil construction in Western Australia along with the broader State economy. Several key points are worth emphasising:
Civil construction activity is set to slump over the next two years. While ABS engineering construction data shows that the decline in work done over the past two years has been relatively mild, this is due to a strong ramp up in oil and gas construction work, while infrastructure construction (mining and non-mining related) has been in sharp decline.
Overwhelmingly, the biggest driver of the decline in civil work from here is the slump in resources investment and, specifically, oil and gas construction – which has helped keep overall construction relatively high in recent years. BIS Shrapnel estimates that the sheer size of the mega LNG projects such as Wheatstone and Gorgon, particularly, means that oil and gas construction will be responsible for $20 billion of the projected $27 billion construction market decline in Western Australia over the next three years.
Given the importance of the mining industry to the State economy, the fall in resources investment will impact heavily across most industries as well as building and construction subcategories. The resources investment boom provided a boost to most industries as it drove strong population inflows to Western Australia, benefitting retail, transport, housing and business services sectors. In turn, the boom stimulated residential and non-residential building, as well as increasing demands on existing infrastructure. Now, however, these drivers are all in reverse, with lower civil construction to be joined by slumping building activity as interstate migration to the faster growing eastern states accelerates and direct overseas migration falls.
In turn, the sheer size of the slump in building and construction activity – along with the lost multiplier benefits construction spending has on the State economy – is driving the largest recorded decline in Western Australia’s State Final Demand (SFD). Western Australia is effectively in the midst of a five year demand recession. SFD is a measure of the value of goods and services sold in the state; essentially the sum of capital and recurrent spending by the public and private sectors. SFD fell 1.3 per cent in 2013/14 (the biggest single year decline since the 1991 recession), a further 3.5 per cent in 2014/15 and 4.6 per cent in 2015/16. Overall, domestic demand in Western Australia has shrunk 8.9 per cent since the September 2013 peak – and there is more to come. If anything, the decline in SFD is currently accelerating, with the June quarter 2016 result 7.3 per cent lower than the corresponding quarter in 2015. BIS Shrapnel forecasts SFD to fall a further 8.5 per cent over the next two years, bringing the total decline to 17 per cent – having enormous implications for state incomes, employment and the standard of living. By way of comparison, the next largest previous bust in the WA economy – the 1991 recession – produced a 5 per cent decline in SFD.
By contrast, measures of economic production (such as Gross State Product or GSP) should continue to grow in Western Australia, supported by rising mining output, though at a much slower rate than the recent boom in construction work. BIS Shrapnel estimates that GSP growth has halved from the boom days to just 2.5 per cent through 2015/16 and will halve again to just 1.4 per cent through 2016/17, before recovering over the subsequent three years. Weaker multipliers from mining production compared to mining investment, however, means that the unemployment rate in Western Australia is expected to rise as employment growth fails to keep up with growth in the working age population. Construction sector employment is projected to fall from 149,000 in 2015/16 to just 110,000 by 2018/19 – a direct loss of 40,000 jobs representing just over a quarter of the currently employed construction workforce.
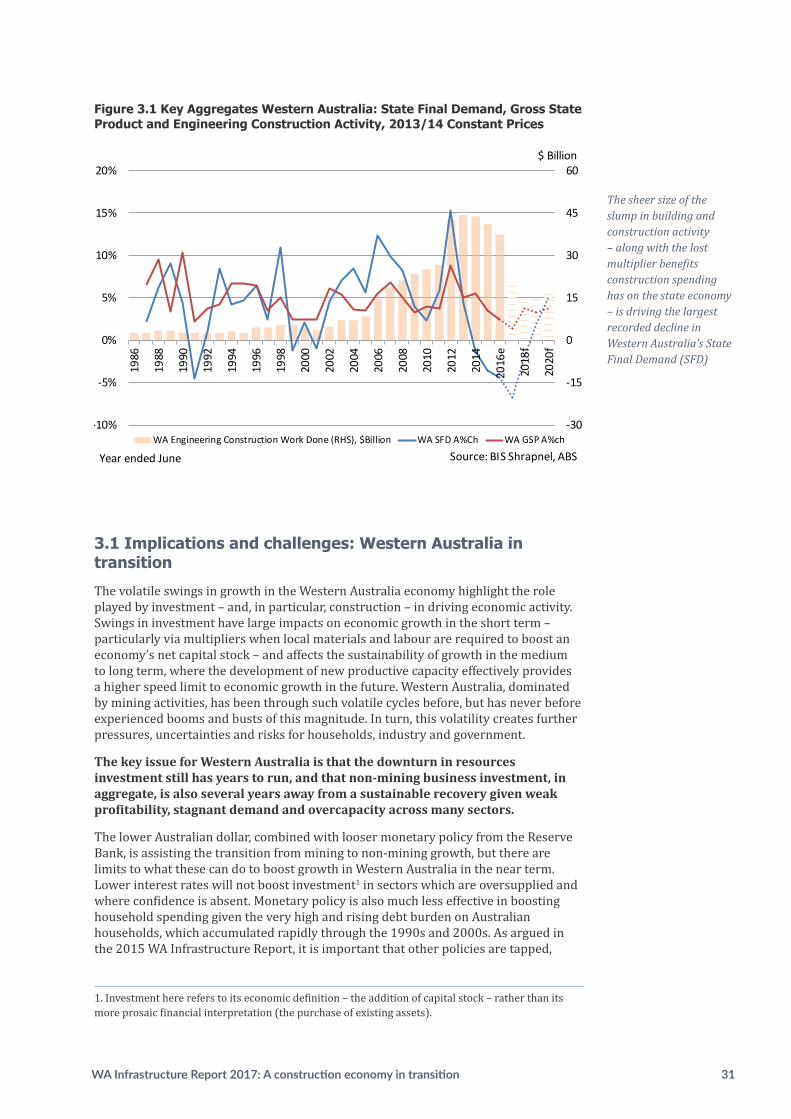
WA Infrastructure Report 2017: A construction economy in transition 31
Figure 3.1 Key Aggregates Western Australia: State Final Demand, Gross State Product and Engineering Construction Activity, 2013/14 Constant Prices
-30
-15
0
15
30
45
60
-10%
-5%
0%
5%
10%
15%
20%
1986
1988
1990
1992
1994
1996
1998
2000
2002
2004
2006
2008
2010
2012
2014
2016
e
2018
f
2020
f
WA Engineering Construction Work Done (RHS), $Billion WA SFD A%Ch WA GSP A%ch
Source: BIS Shrapnel, ABS
$ Billion
Year ended June
3.1 Implications and challenges: Western Australia in transition
The volatile swings in growth in the Western Australia economy highlight the role played by investment – and, in particular, construction – in driving economic activity. Swings in investment have large impacts on economic growth in the short term – particularly via multipliers when local materials and labour are required to boost an economy’s net capital stock – and affects the sustainability of growth in the medium to long term, where the development of new productive capacity effectively provides a higher speed limit to economic growth in the future. Western Australia, dominated by mining activities, has been through such volatile cycles before, but has never before experienced booms and busts of this magnitude. In turn, this volatility creates further pressures, uncertainties and risks for households, industry and government.
The key issue for Western Australia is that the downturn in resources investment still has years to run, and that non-mining business investment, in aggregate, is also several years away from a sustainable recovery given weak profitability, stagnant demand and overcapacity across many sectors.
The lower Australian dollar, combined with looser monetary policy from the Reserve Bank, is assisting the transition from mining to non-mining growth, but there are limits to what these can do to boost growth in Western Australia in the near term. Lower interest rates will not boost investment1 in sectors which are oversupplied and where confidence is absent. Monetary policy is also much less effective in boosting household spending given the very high and rising debt burden on Australian households, which accumulated rapidly through the 1990s and 2000s. As argued in the 2015 WA Infrastructure Report, it is important that other policies are tapped,
1. Investment here refers to its economic definition – the addition of capital stock – rather than its more prosaic financial interpretation (the purchase of existing assets).
The sheer size of the slump in building and construction activity – along with the lost multiplier benefits construction spending has on the state economy – is driving the largest recorded decline in Western Australia’s State Final Demand (SFD)

32 BIS Shrapnel – CCF WA
The Reserve Bank Governor suggested that governments were in fact in a far better position to “take on more debt and spend” than, say, households
Challenges, Implications and Recommendations
apart from interest rates alone, to build a narrative for economic growth. Chief among these policies was public sector investment in productive infrastructure (which in certain situations is best addressed via debt funding according to IMF research2), alongside real exchange rate depreciation and productivity enhancing reforms. 3
Some of these themes were revisited by Glenn Stevens in his final public speech as Reserve Bank Governor4, where he recently noted:
“Slower growth is here now and has been for a while… [and] we can’t just assume that monetary policy can simply dial up the growth we need. We need some realism here.
“In the end, the most powerful domestic expansionary impetus that comes from low interest rates surely comes when someone, somewhere, has both the balance sheet capacity and the willingness to take on more debt and spend. The problem now is that there is a limit to how much we can expect to achieve by relying on already indebted entities taking on more debt. So for policymakers looking to use low interest rates to boost growth, the question is: which entities, if any, in the economy can accept higher leverage safely?
“In some countries there may be no safe way of borrowing and spending because debt, both public and private, is just too high. In Australia, gross public debt, for all levels of government, adds up to about 40 per cent of GDP. We are rightly concerned about the future trajectory of this ratio. But gross household debt is three times larger – about 125 per cent of GDP. That is not unmanageable – but nor is it a low number. It’s an interesting question which sector would have the greater capacity to take on more debt, in the event that we were to need a big demand stimulus… The point I am trying to inject here is simply that popular debate in Australia about government debt and how we limit or reduce it seems so often to be conducted while largely ignoring the size of private debt. To outside observers this seems odd. Foreign visitors to the Reserve Bank over the years have tended to raise questions about household debt much more frequently than they have raised questions about government debt.”
As in previous speeches, the Reserve Bank Governor was relatively direct in focusing attention away from an overreliance on monetary policy, and suggesting that governments were in fact in a far better position to “take on more debt and spend” than, say, households, given substantially lower leverage. Even so, Stevens’ comments were not a carte blanche call for debt-funded government spending:
“Let me be clear that I am not advocating an increase in deficit financing of day-to-day government spending. The case for governments being prepared to borrow for the right investment assets – long-lived assets that yield an economic return – does not extend to borrowing to pay pensions, welfare and routine government expenses, other than under the most exceptional circumstances. It remains the case that, over time, the gap in the recurrent budget has to be closed, because rising public debt that is not held against assets will start to be a material problem.”5
2. IMF (2014) “World Economic Outlook”, October, ppxvi, p77.3. Garnaut, R. 2015 “We Need a Plan to Revive The Economy” Australian Financial Review, 8th April, p8.4. Stevens, G. 2016 “An Accounting”, Address to the Anika Foundation Luncheon, 10th August, viewed 9th September 2016, http://www.rba.gov.au/speeches/2016/sp-gov-2016-08-10.html 5. Ibid.

WA Infrastructure Report 2017: A construction economy in transition 33
Debate over the desirability or otherwise of budget deficits and debt is muddied by the structure of budget reporting in Australia, which often bundles together recurrent and capital expenditures
Interestingly, these themes have been re-emphasised by the new Reserve Bank Governor, Philip Lowe, in his first appearance as Governor at the House of Representatives Standing Committee on Economics in September 2016:
“The global sense is that monetary policy is not working as effectively as it might have in previous years. I think there are three possible responses to that. The one we have been doing is to just do more monetary policy: if it is not working, do a bit more until it does work... Another option is for some entity in the economy to use the low interest rates to increase its spending. The reason why monetary policy is not working globally is that no-one wants to use the low interest rates to increase their spending. Some entity could do that. Governments are one entity, but governments typically do not want to do that.
“One thing that I find attractive is the idea that government uses either its balance sheet or its planning capacity to do infrastructure spending, not more recurrent spending... If someone in the economy can use their balance sheet to build assets within a rate of return greater than two per cent, that is another option… we do have options here and too much globally has been relied on for the monetary option.”6
In this context, the importance of budgetary reforms to eliminate structural deficits in the budget (both at the State and Commonwealth level) cannot be understated. Current debates regarding the desirability or otherwise of budget deficits and debt are, unfortunately, muddied by the very structure of budget reporting in Australia, which often bundles together recurrent and capital expenditures. Consequently, cuts to infrastructure investment, for example, could be given the same weight as cuts in recurrent expenditure as part of the mechanism to bring budgets towards balance. Such approaches run the risk of confusing budget deficits (regardless of purpose) as unsustainable. Rather, what is important for budget sustainability in the long term are the following two conditions:
• That recurrent expenditures are brought in line to recurrent revenues (over an economic cycle) via either recurrent expenditure cuts, taxation increases or some combination of the two, and
• Government investment is directed into assets that yield a positive economic return (i.e. are productive in the sense that their returns exceed the cost of capital)
The first condition allows for recurrent budgets to dip into deficit naturally in weak economic conditions (as tax revenues fall and welfare spending increases), so long as it is balanced by recurrent budget surpluses in the stronger part of the cycle. In so doing, the budget acts as an automatic stabiliser, cushioning the impact of economic downturns (by increasing public spending) and having a mitigating effect on the upturn (through net saving by the public sector).
The second condition argues that all capital decisions by governments should be addressed on their merits in relation to achieving positive economic returns, and not in reference to the first condition. Satisfaction of this criterion would be much assisted by a separation of State and Commonwealth Budgets into capital (capex) and recurrent (opex) components so that the success or failure of policies to achieve structural balance of the budget over the economic cycle can be readily distinguished from those policies designed to target investment goals.
This is important in interpreting current State and Commonwealth Budgets as, while public debt and deficits are still rising (and attracting considerable attention) budget
6. Commonwealth of Australia 2016, House of Representatives Standing Committee On Economics, Reserve Bank of Australia annual report 2015, Proof Committee Hansard, Thursday, 22 September 2016, p9.
34 BIS Shrapnel – CCF WA
Government should aim to cushion the impact of the downturn
Challenges, Implications and Recommendations
repair should not necessarily come at the expense of public investment. At the national level, new public investment (i.e. excluding net asset sales to the private sector) recorded modest growth of 2.1 per cent in 2015/16 after four years of declines – but it is expected to pick up further over the next two years.
While it is the Commonwealth budget that attracts the majority of the media attention, it is the State budget that matters the most for total public spending in Western Australia, with State and Local Governments accounting for around 80 per cent of general government (non-defence) investment and two-thirds of general government spending on goods and services. In Western Australia, sharply declining royalty revenue from falling commodity prices has put a dent in public spending plans, but June quarter 2016 data showed a somewhat surprising jump in public investment which, if sustained, would offer a transitional growth path for the Western Australian economy.
The other key growth driver for the Western Australian economy remains the Australian dollar. After a decade of constraint or recession, non-mining dollar-exposed industries in Western Australia (as well as other states) are beginning to recover. At the national level, tourism and education exports increased by 11.5 per cent and 3.8 per cent respectively in 2015/16. These sectors will need to refurbish and then expand to meet demand. Other dollar-exposed industries, too, are benefiting from the improved competitiveness of a lower dollar, showing initial signs of recovery. That will broaden to growth and, eventually, investment in the non-mining sectors. But it will be a very long process.
Overall, the key challenges facing Western Australia are:
Non-mining investment is much, much lower than mining investment and the latter has still a long way to fall. The sheer size of the downturn in private sector (resources driven) investment is swamping the (still negligible) uptick in public sector investment, and will get worse over the coming year. Consequently, the key aim for government should not be to try to offset the decline, but rather cushion the impact through sensible productive public infrastructure decisions, encourage private investment where possible and put measures into place to bridge the gap between recurrent expenditures and revenues.
Slumping commodity prices, which have put a substantial hole in projected State Government revenues, limiting the ‘own source’ funding available for productive infrastructure investment. Since the 2015-16 Budget, Western Australia government revenues have been scaled down $2.8 billion for 2016/17, $3.4 billion for 2017/18 and another $3.2 billion for 2018/19 – a total of $9.4 billion written out of revenues over the next three years, mostly as a consequence of lower (albeit more realistic) commodity prices and royalties forecasts. Overall, revenues and expenses are expected to move back towards balance by the end of the decade, but the revenue gap is set to widen net State Government debt from $28 billion in 2015/16 to over $40 billion by 2018/19 (132 per cent of revenue), up from $35.8 billion (107 per cent of revenue) projected for that year in the 2015-16 Budget. Achieving budget balance is becoming a harder proposition.
In this environment, it is pertinent to ask:• Should Western Australia be reducing its public infrastructure investment?• If not, given the circumstances, what are the best ways to fund infrastructure
investment?• Is debt a viable option for infrastructure funding? • Are other options available for infrastructure investment?
WA Infrastructure Report 2017: A construction economy in transition 35
Australia’s infrastructure backlog is estimated at $300 billion
3.2 Should Western Australia cut back further on public infrastructure investment?
Over the past decade, there was a substantial lift in public investment in infrastructure in Western Australia occurring alongside a huge cycle in private, resources-driven, investment. However, as resources investment has fallen away, so too has public infrastructure investment, particularly over the four years to (and including) 2015/16. Forward projections from the 2016-17 State Budget asset investment program, along with BIS Shrapnel’s own analysis of major projects, indicate that public infrastructure investment is stabilising, will tick up again over the next two years, and generally remain above pre-boom levels through the remainder of the decade, albeit below that which occurred during the boom.
Given the State’s budgetary position, is this appropriate? While increasing public infrastructure investment adds to the Western Australia cash budget deficit in the short term (particularly while revenues are in decline), the decision to invest should be based on longer term criteria than simply year to year budgetary positions. As long as the investment is in productive assets (i.e. those that yield a positive net economic benefit including the cost of capital), the decision to invest is appropriate. Furthermore, investment will be most effective where it addresses known infrastructure deficits, which will have longer term economic costs if they are not addressed. In this case, the more appropriate question is whether, after a decade of higher public infrastructure investment, does Western Australia still have infrastructure deficits?
While quantification of existing infrastructure adequacy and measurements or an infrastructure deficit is fraught with difficulties,7 there is substantial evidence to suggest that higher levels of infrastructure investment need to be sustained well into the future – given expected economic and population growth in Australia – to avoid high economic costs from infrastructure bottlenecks and congestion.
At the national level, a range of reports have sought to quantify the levels of infrastructure investment required. In 2008, a report by ABN Amro (now the Royal Bank of Scotland) quantified Australia’s infrastructure investment task at $455 billion (in 2007 terms) over the next decade. Citigroup, in mid-2008 estimated that the economic infrastructure investment task over the decade ahead was more than $770 billion (in 2007 terms), if the quality of capital stock was to return to a level that will sustain Australia’s ongoing prosperity.8 In 2013 (following a surge in public sector infrastructure investment over the preceding decade), Infrastructure Australia still estimated Australia’s infrastructure backlog to be approximately $300 billion.9
Globally, Australia has performed well in regards to infrastructure investment in infrastructure since the GFC, with infrastructure investment between 2008 and 2013 generally higher (as a percentage of GDP) than most developed economies and (if sustained) above the rate required to meet projected infrastructure needs between 2016 to 2030.10 Where Australia failed in this comparison, however, was in the quality of infrastructure spending given the level of income, and the downward trajectory of
7. Terill, M. and B. Coates 2016, “Budget explainer: does Australia really have an infrastructure deficit?”, Gratten Institute, April 28th 2016, viewed 29th September 2016 https://grattan.edu.au/news/4058/ 8. Infrastructure Partnerships Australia 2012 “The Role of Superannuation in Building Australia’s Future”9. Infrastructure Australia 2013 “National Infrastructure Plan”, Commonwealth Government, Canberra.10. McKinsey Global Institute (2016) Bridging Global Infrastructure Gaps, p12.
36 BIS Shrapnel – CCF WA
Challenges, Implications and Recommendations
The Property Council of Australia has estimated Western Australia’s infrastructure deficit at just under $60 billion
public infrastructure investment since 2010.11 This points to two important issues in the infrastructure debate: (i) whether recent higher levels of infrastructure investment can be sustained at the levels required into the long term and (ii) choosing the right infrastructure projects and programmes – including boosting expenditures on smaller (but more productive) projects as well as maintenance to make the most of the infrastructure in place.
What of Western Australia? In 2010 (the most recent comprehensive evaluation), Engineers Australia rated the quality and adequacy of the state’s infrastructure assets. While most assets were ranked as adequate, the Engineers Australia report noted that the ratings had slipped since the earlier review in 2005 and that changes were required (both minor and major) to meet future adequacy requirements. In 2014, the Property Council of Australia went one step further by suggesting that, based on international infrastructure investment to GDP norms12, Western Australia has an infrastructure deficit in 2012/13 of just under $60 billion – a figure more or less consistent with that of prior analyses at the national level.
In 2015, the Australian Infrastructure Audit commissioned by Infrastructure Australia also found evidence of an infrastructure deficit at both the national and Western Australian level. With Australia’s population projected to grow to 30.5 million by 2031 (and with three quarters of this growth to take place in Australia’s four largest capital cities – Sydney, Melbourne, Brisbane and Perth), a key finding of the report was that existing infrastructure gaps in urban transport and regional water will continue to widen unless infrastructure investment is increased.
Indeed, the problems were likely to be exacerbated in Western Australia given the expectation of economic and population growth rising at a rate far above the national average over the 20 years to 2031, putting pressure on transport for the Greater Perth region specifically, but also for key regional centres and along freight routes. Given the geography of Perth itself (particularly along the heavily populated north-south axis) and the state of existing infrastructure, the direct economic cost of congestion in Perth, currently estimated at $1.8 billion per annum, will rise to $15.9 billion per annum by 2031 if not adequately addressed.13
This outcome was reinforced in Infrastructure Australia’s Australian Infrastructure Plan and Priority List, published in February 2016, which included Perth Freight Link as one of two high-priority infrastructure projects nationwide, but also included Perth CBD-north corridor capacity, the Forrestfield Airport Link rail line, Perth Airport third runway, Perth container terminal upgrades and major east-west and southern corridor urban road capacity upgrades as priority projects, as they related to solving infrastructure gaps identified in the Audit. These projects have been maintained in the updated Priority List14 published in September 2016.
3.3 Funding infrastructure spending
Even with the range of projects listed by Infrastructure Australia, one of the significant issues is how infrastructure solutions are to be funded. This is an important question. Not only are state governments under increasing budgetary pressure, but the
11. Ibid, pp10-11.12. Mainly, that infrastructure investment should be roughly sustained at 3.8 per cent of GDP per annum, and that the value of infrastructure stock be around 70 per cent of GDP.13. Infrastructure Australia 2015, “Australian Infrastructure Audit”, Commonwealth Government, Canberra, p9, 8314. Infrastructure Australia 2016, “Infrastructure Priority List”.
WA Infrastructure Report 2017: A construction economy in transition 37
Commonwealth Government’s own Intergenerational Report (along with other studies such as Infrastructure Australia’s Infrastructure Audit) suggest that with the ageing of the population a greater demand will be placed upon governments to fund welfare and health services – potentially affecting their ability to fund economic infrastructure. As such, there are calls for governments to facilitate greater direct private investment and operation of infrastructure.15
Meeting overarching infrastructure goals will no doubt involve a mixture of public and private funding, and it would be counterproductive to limit funding strategies to just one funding source or the other. These strategies are outlined below, but regardless of the approach taken, there is evidence to suggest that Australia could be getting much better ‘bang for the buck’ with infrastructure spending if sensible governance approaches are adopted including fact-based (rather than political) project selection, streamlined delivery and maximising the use of existing assets through effective maintenance strategies.
McKinsey (2016) estimates that 38 per cent of global infrastructure investment spending could be saved if processes across these three areas were improved. For Western Australia, the benefits could be even more significant given current excess capacity in the construction industry and lower prices for construction work as the mining investment boom subsides. This, in turn, could reduce the overall funding challenge facing governments.
Private sector fundingDespite the recent downturn in private investment, there is still a very important role for direct private involvement in infrastructure funding, and the Western Australia State Government could support this funding avenue through maintaining a proper assessment system for considering unsolicited private sector infrastructure proposals. Such systems are already in place in New South Wales, Victoria and Queensland, and has seen significant investments proposed and now rolling out, including Sydney’s $3 billion NorthConnex project, as well as the $5.5 billion Western Distributor project in Melbourne (both put forward by Transurban). The Queensland government is also considering an unsolicited proposal to develop a $100 million cruise terminal within the Port of Brisbane, following the inclusion of market-led proposals as a key strategic plank of its State Infrastructure Plan. The unsolicited proposal approach also allowed governments the opportunity to contribute to these projects, leveraging a large amount of private investment for a relatively small public contribution.
By contrast, Western Australia has an unsolicited bid program for the purchase or lease of public land, but ideally this could be broadened to include infrastructure proposals.
Unlike the experience of Victoria’s failed East West Link project, there should also be greater bipartisan political support for beneficial private infrastructure projects to eliminate sovereign risk as far as possible. Undertaking transparent cost benefit analyses (CBAs) is a necessary condition to developing a more stable political environment for major infrastructure projects, but so long as there are ‘winners and losers’ in infrastructure development it will be difficult to eliminate politics completely.
In some cases (where the measured social benefits of infrastructure projects exceed potential revenue capture by the private sector) governments can facilitate private investment by financing the benefit gap. However, governments should not use this as an excuse to finance projects which would have proceeded with private support
15. Infrastructure Australia 2015, “Australian Infrastructure Audit”, Commonwealth Government, Canberra, p8

38 BIS Shrapnel – CCF WA
Challenges, Implications and Recommendations
Nationally, private sector-funded civil infrastructure construction will stabilise at around $20 billion per annum over the next four years
anyway. Governments can also encourage private sector funded investment through reforms which reduce procurement costs, such as relaxing financing and design requirements at the tender stage, amongst other policies.
At the national level, BIS Shrapnel is forecasting overall private sector funded civil infrastructure construction to stabilise at around $20 billion per annum over the next four years – as shown in Figure 3.2. While this is well down on previous years (largely due to the downturn in resources-related investment, particularly affecting railways and ports), it still represents a substantial volume of infrastructure investment. Here, recent successes from the unsolicited proposal approach are boosting investment in road assets, particularly, while recent and past privatisations also see more reliance on the private sector to fund required investments in ports, telecommunications (excluding the NBN) and electricity.
Figure 3.2 Engineering Construction Work Done (Excluding Mining and Heavy Industry Construction), Private Sector Funded, Australia, $Billion, 2013/14 Prices
0
5
10
15
20
25
30
35
40
2000
2001
2002
2003
2004
2005
2006
2007
2008
2009
2010
2011
2012
2013
2014
2015
2016
e
2017
f
2018
f
2019
f
2020
f
Roads Railways Ports Water Sewerage Electricity Pipelines Recreation Telecoms
Year ended June Source: BIS Shrapnel, ABS data
$ Billion
Public sector fundingNotwithstanding support from the private sector, it is governments which are tasked with the challenge of funding new infrastructure. BIS Shrapnel projects publicly funded civil infrastructure construction to recover to over $30 billion in 2016/17, and above $35 billion in 2017/18 and 2018/19, along with substantial commitments to infrastructure maintenance. With this, comes the responsibility to ensure that public infrastructure choices and the procurement process are handled transparently, productively and financed in a way which satisfies both fairness and efficiency objectives. This means:
• Choosing projects with the greatest economic ‘bang for the buck’. In a world where finance may be constrained, it is vital that infrastructure projects are selected according to a transparent cost-benefit analysis (CBA) process which ranks alternative options and uses for funds. This in turn becomes an argument for better economic and industry data to feed into the CBA process and the publication of CBA outcomes to stimulate debate and provide greater transparency to the electorate. While the establishment of politically independent infrastructure agencies, such as Infrastructure Australia, is promoting better project selection, there is still a long way to go. Put simply, not all projects are
WA Infrastructure Report 2017: A construction economy in transition 39
Not all states and territories have a politically independent infrastructure agency established to guide productive project selection
being subjected to rigorous CBA before being approved by governments and as such there is no defined ranking of projects (beyond those that reach the Priority List) showing that funding is being used wisely. Worse, not all states and territories – responsible for the bulk of infrastructure funding – have a politically independent infrastructure agency established to guide productive project selection.
• Undertaking reforms which maximise efficiencies at the procurement stage. According to the Productivity Commissions’ 2014 inquiry in public infrastructure provision, inefficiencies caused by poor procurement processes and regulations can exacerbate infrastructure development costs and deter investment. Boosting public investment in initial designs and bid costs; reduced design requirements at the initial tender stage; packaging projects into contract sizes that foster broader competition and a sustainable contracting industry; and removing inefficient approvals processes or regulations are examples of the types of reforms in mind.
• Utilising a mix of sustainable funding mechanisms for investment over the longer term, including user charges (where possible), asset (capital) recycling, tax reforms and public sector borrowings.
Ultimately, the aim of public sector infrastructure funding should not be to maintain peak levels of investment and construction activity – with all the economic and industrial challenges that inevitably creates. In a state like Western Australia – where privately funded engineering construction is projected to fall by $30 billion from peak to trough – such a policy will almost certainly result to investing in projects with zero or negative net economic benefits. Rather, a key objective for governments should be to sustain industry capability through sensible infrastructure project selection through the weakest phases of the private investment cycle, whilst also providing long term confidence in the economy through a sustained commitment to a pipeline of infrastructure projects. Here, several funding mechanisms are available:
• User charges• Capital recycling• Value capture• Debt financing
In theory, market-based user charges may be the best means of funding infrastructure in that they reveal consumers’ willingness to pay for new infrastructure (and is why they are used for utilities such as electricity, gas, water and telecommunications). But user charges may not work well in all circumstances. The financial failures of toll road projects in Queensland and New South Wales demonstrates that – when executed poorly and when risks are unable to be priced correctly – market-based charges may not reflect the full cost of building and operating single road assets which form part of a broader network. In these situations, it can be difficult to price the use of these assets efficiently, and hence match revenues with social benefits.
Indeed, for the roads sector a broader user charge price mechanism reflecting the costs of the entire road network (as recommended by the 2015 Competition Policy Review16 , the 2014 Productivity Commission Inquiry into Public Infrastructure and the 2016 Infrastructure Plan from Infrastructure Australia) would preferably be established. This would be based on the type of vehicle, routes and distance travelled rather than via fuel taxes and registration charges (which are not growing enough anyway to meet current, let alone future, costs of building and maintaining the road network). Furthermore, a broader road pricing system could be implemented in a revenue neutral fashion by simply reducing the latter indirect charges. Such a system could help resolve chronic underfunding of road construction and maintenance as
16. The Australian Government Competition Policy Review 2015, “Final Report”, Commonwealth Government, p38
A broader user charge price mechanism could help resolve chronic underfunding of road construction and maintenance
40 BIS Shrapnel – CCF WA
Challenges, Implications and Recommendations
these activities would then be more directly linked to consumers’ use of the asset and willingness to pay, and could be readily implemented using existing technologies.
In the absence of initiatives such as road pricing, capital recycling has emerged as another way for governments to fund infrastructure projects. Here, governments privatise (or offer as a long term lease) income generating public sector assets and use the resultant funds to build new infrastructure. Capital recycling schemes in New South Wales are providing more than $20 billion to the Rebuild NSW fund. Victoria recently realised $9.7 billion in infrastructure funding through the long term lease of the Port of Melbourne, and this may be further increased by payments from the Commonwealth Government under the Asset Recycling Initiative. However, the approach has been slower to take hold in Western Australia, mainly due to delays in timing leasing processes, and has not really been promoted by Queensland at all.
The main advantage of capital recycling for State Governments is that it provides a source of funding without increasing debt and debt funding costs, keeping debt ratings agencies onside. Secondly, the policy allows governments to effectively de-risk greenfield infrastructure assets for future sale by using the funds raised through recycling to build and own assets until they generate a more reliable income stream – raising their attractiveness to private sector purchasers. This process may then create an ongoing sequence of infrastructure funding and investment.
However, as noted previously, capital recycling also comes with costs and is not a magic pudding for infrastructure funding.17 First and foremost, governments lose their rights to revenue earned by the assets once they are transferred to the private sector, and this should be considered as a direct cost of the policy. Secondly, the policy can be detrimental to overall efficiency if governments simply aim to maximise transaction revenue. This may mean not promising a strong regulatory regime in place to limit price increases for asset users once it is transferred to the private sector, or offering other benefits to asset purchasers which otherwise limit competition to the asset for a period of time.
While commercial pressures and incentives may encourage efficiencies under private ownership, there is no hard and fast rule that says that private sector ownership always yields stronger efficiencies than public sector ownership. In many cases, the devil is in the detail of the transaction itself, as well as the monopoly characteristics of the asset being recycled. With respect to the latter, it is no coincidence that the largest revenues won by governments have been for assets with very strong monopoly characteristics, including airports, ports and transmission and distribution utilities.
Finally, as with all infrastructure investment decisions, the promised projects to be built with the privatisation proceeds should provide demonstrable net economic benefits via a transparent CBA process. This means that funds should not necessarily be earmarked for investment in the region where the asset was privatised – the decisions to transfer the asset and the use of resultant funds should be de-linked. If any of these conditions are not met, capital recycling can be a highly inefficient and unsustainable way of raising infrastructure finance.
Value capture is another funding mechanism being considered, particularly for transport infrastructure at the state level (where higher debt levels make debt financing of infrastructure more challenging). In essence, this approach involves governments taxing18 the windfall uplift in property values or other benefits driven
17. Menezes, F. 2014 “Capital Recycling plan good in theory, difficult in practice”, 6th May, The Conversation, viewed 23rd July 2015, http://theconversation.com/capital-recycling-plan-good-in-theory-difficult-in-practice-25855 18. A softer term would be ‘sharing’. Brown C. 2015, “Value Capture is infrastructure magic bullet”, Australian Financial Review, October 21st 2015, viewed 29th September 2016 http://www.afr.com/opinion/value-capture-is-infrastructure-magic-bullet-20151021-gkeqj9
WA Infrastructure Report 2017: A construction economy in transition 41
A more efficient and sustainable revenue system for state governments would see inefficient property taxes such as stamp duties replaced by a broader-based and more stable land tax system
Infrastructure benefits multiple generations, so it is sensible that the costs of infrastructure be spread over multiple generations
by the development of new infrastructure as a means of infrastructure finance. While not new – having been used for decades to fund transport infrastructure in Hong Kong and Japan, as well as the United States (under the term Tax Increment Financing or TIF) the mechanism has gained significant interest in the past year as part of Prime Minister Malcolm Turnbull’s Smart Cities Plan, Queensland’s State Infrastructure Plan and for funding specific transport developments ranging from New South Wales’ $1.5 billion Parramatta Light Rail to a privately sponsored proposal to build a $200 billion high speed east coast rail link.19
While value capture is a sensible and equitable way to fund infrastructure projects, there are challenges which may limit the effectiveness of the approach in the near term. Most importantly, for value capture to work effectively, it requires that a method for calculating the uplift in property values is properly enounced before implementation of the policy or the announcement of infrastructure projects that may be funded by it to prevent speculation. Secondly, the timing of the policy would need to ensure that the funding mechanism isn’t applied retrospectively. Thirdly, there needs to be a robust agreement on how the charge is to be collected – typically either as an ongoing property tax or paid when properties are sold.
Ideally, the development of an optimal value capture system at the state level could be combined with a reassessment of inefficient state-based property taxes such as stamp duties. A more efficient and sustainable revenue system for state governments would see these inefficient taxes replaced by a broader-based land tax system which embeds the impact of infrastructure development on land values – and diverts the uplift itself to a designated infrastructure fund. Another advantage of this approach would be that state government revenue growth would tend to be more stable overall (and perhaps less pro-cyclical), reducing the political temptation to boost public spending excessively during economic booms. However, such substantive changes to state government funding are unlikely to take place, at least in the near term, and may differ significantly from state to state.
In the interim, value capture approaches may be limited to governments either providing low cost access to residential and commercial space for developers, which can then be on-sold to help finance private infrastructure provision, or simply levying a charge on new developments near the infrastructure location.20
The main remaining avenue for funding public infrastructure is through increasing public borrowings. On intergenerational equity grounds, this is a perfectly reasonable approach. Infrastructure benefits multiple generations, so it is sensible that the costs of infrastructure (through principal and interest repayments) similarly be spread over multiple generations. It also makes sense from an economic efficiency perspective, so long as the funds are used for projects with positive net economic benefits (including any costs or benefits associated with debt financing) and are procured efficiently – once again emphasising the need for proper and transparent CBA processes to identify viable projects in the first instance.
Ultimately, however, with government expenses currently exceeding revenues, sustainable public funding for infrastructure over the long term will require tax and expenditure reforms. While there is no economic reason why productive infrastructure investment should be constrained because of budget deficits and rising debt, there is no doubt that it is politically difficult currently to increase public investment in these circumstances. In the broader media, the issue of rising debt often takes on its
19. Martin, S. 2016 “Land deals sealed for $200bn high-speed east-coast rail link”, The Australian, Thursday 14th July 2016, p1. 20. Gurren, N,. and S. Lawler (2016) “Explainer: what is ‘value capture’ and what does it mean for cities?”, The Conversation, June 22nd 2016, viewed 29th September 2016 http://theconversation.com/explainer-what-is-value-capture-and-what-does-it-mean-for-cities-58776
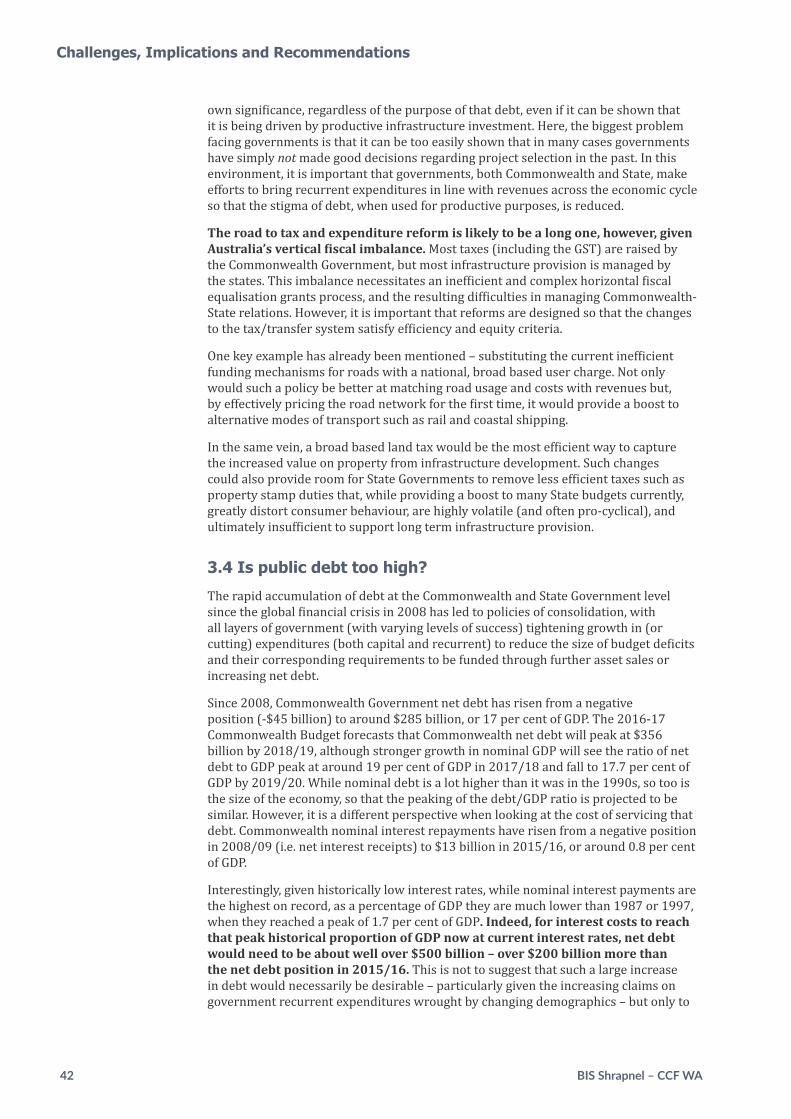
42 BIS Shrapnel – CCF WA
Challenges, Implications and Recommendations
own significance, regardless of the purpose of that debt, even if it can be shown that it is being driven by productive infrastructure investment. Here, the biggest problem facing governments is that it can be too easily shown that in many cases governments have simply not made good decisions regarding project selection in the past. In this environment, it is important that governments, both Commonwealth and State, make efforts to bring recurrent expenditures in line with revenues across the economic cycle so that the stigma of debt, when used for productive purposes, is reduced.
The road to tax and expenditure reform is likely to be a long one, however, given Australia’s vertical fiscal imbalance. Most taxes (including the GST) are raised by the Commonwealth Government, but most infrastructure provision is managed by the states. This imbalance necessitates an inefficient and complex horizontal fiscal equalisation grants process, and the resulting difficulties in managing Commonwealth-State relations. However, it is important that reforms are designed so that the changes to the tax/transfer system satisfy efficiency and equity criteria.
One key example has already been mentioned – substituting the current inefficient funding mechanisms for roads with a national, broad based user charge. Not only would such a policy be better at matching road usage and costs with revenues but, by effectively pricing the road network for the first time, it would provide a boost to alternative modes of transport such as rail and coastal shipping.
In the same vein, a broad based land tax would be the most efficient way to capture the increased value on property from infrastructure development. Such changes could also provide room for State Governments to remove less efficient taxes such as property stamp duties that, while providing a boost to many State budgets currently, greatly distort consumer behaviour, are highly volatile (and often pro-cyclical), and ultimately insufficient to support long term infrastructure provision.
3.4 Is public debt too high?
The rapid accumulation of debt at the Commonwealth and State Government level since the global financial crisis in 2008 has led to policies of consolidation, with all layers of government (with varying levels of success) tightening growth in (or cutting) expenditures (both capital and recurrent) to reduce the size of budget deficits and their corresponding requirements to be funded through further asset sales or increasing net debt.
Since 2008, Commonwealth Government net debt has risen from a negative position (-$45 billion) to around $285 billion, or 17 per cent of GDP. The 2016-17 Commonwealth Budget forecasts that Commonwealth net debt will peak at $356 billion by 2018/19, although stronger growth in nominal GDP will see the ratio of net debt to GDP peak at around 19 per cent of GDP in 2017/18 and fall to 17.7 per cent of GDP by 2019/20. While nominal debt is a lot higher than it was in the 1990s, so too is the size of the economy, so that the peaking of the debt/GDP ratio is projected to be similar. However, it is a different perspective when looking at the cost of servicing that debt. Commonwealth nominal interest repayments have risen from a negative position in 2008/09 (i.e. net interest receipts) to $13 billion in 2015/16, or around 0.8 per cent of GDP.
Interestingly, given historically low interest rates, while nominal interest payments are the highest on record, as a percentage of GDP they are much lower than 1987 or 1997, when they reached a peak of 1.7 per cent of GDP. Indeed, for interest costs to reach that peak historical proportion of GDP now at current interest rates, net debt would need to be about well over $500 billion – over $200 billion more than the net debt position in 2015/16. This is not to suggest that such a large increase in debt would necessarily be desirable – particularly given the increasing claims on government recurrent expenditures wrought by changing demographics – but only to
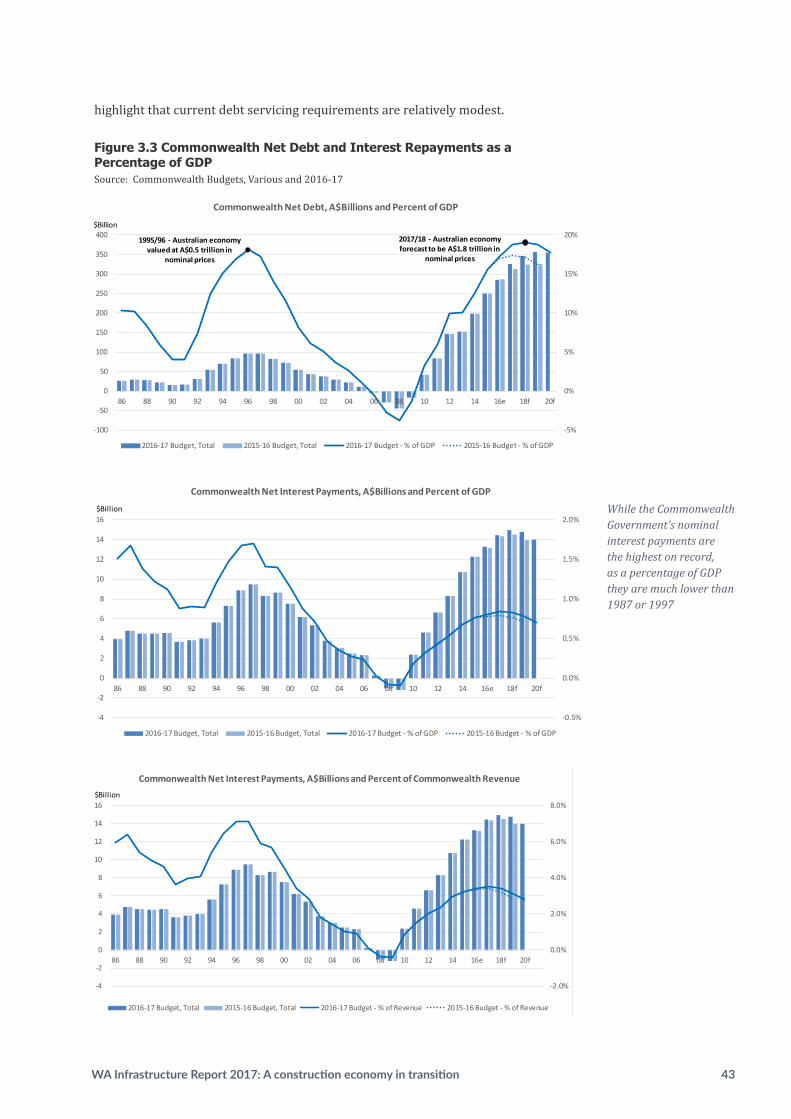
WA Infrastructure Report 2017: A construction economy in transition 43
While the Commonwealth Government’s nominal interest payments are the highest on record, as a percentage of GDP they are much lower than 1987 or 1997
highlight that current debt servicing requirements are relatively modest.
Figure 3.3 Commonwealth Net Debt and Interest Repayments as a Percentage of GDP Source: Commonwealth Budgets, Various and 2016-17
-5%
0%
5%
10%
15%
20%
-100
-50
0
50
100
150
200
250
300
350
400
86 88 90 92 94 96 98 00 02 04 06 08 10 12 14 16e 18f 20f
Commonwealth Net Debt, A$Billions and Percent of GDP
2016-17 Budget, Total 2015-16 Budget, Total 2016-17 Budget - % of GDP 2015-16 Budget - % of GDP
$Billion
1995/96 - Australian economy valued at A$0.5 trillion in
nominal prices
2017/18 - Australian economy forecast to be A$1.8 trillion in
nominal prices
-0.5%
0.0%
0.5%
1.0%
1.5%
2.0%
-4
-2
0
2
4
6
8
10
12
14
16
86 88 90 92 94 96 98 00 02 04 06 08 10 12 14 16e 18f 20f
Commonwealth Net Interest Payments, A$Billions and Percent of GDP
2016-17 Budget, Total 2015-16 Budget, Total 2016-17 Budget - % of GDP 2015-16 Budget - % of GDP
$Billion
-2.0%
0.0%
2.0%
4.0%
6.0%
8.0%
-4
-2
0
2
4
6
8
10
12
14
16
86 88 90 92 94 96 98 00 02 04 06 08 10 12 14 16e 18f 20f
Commonwealth Net Interest Payments, A$Billions and Percent of Commonwealth Revenue
2016-17 Budget, Total 2015-16 Budget, Total 2016-17 Budget - % of Revenue 2015-16 Budget - % of Revenue
$Billion
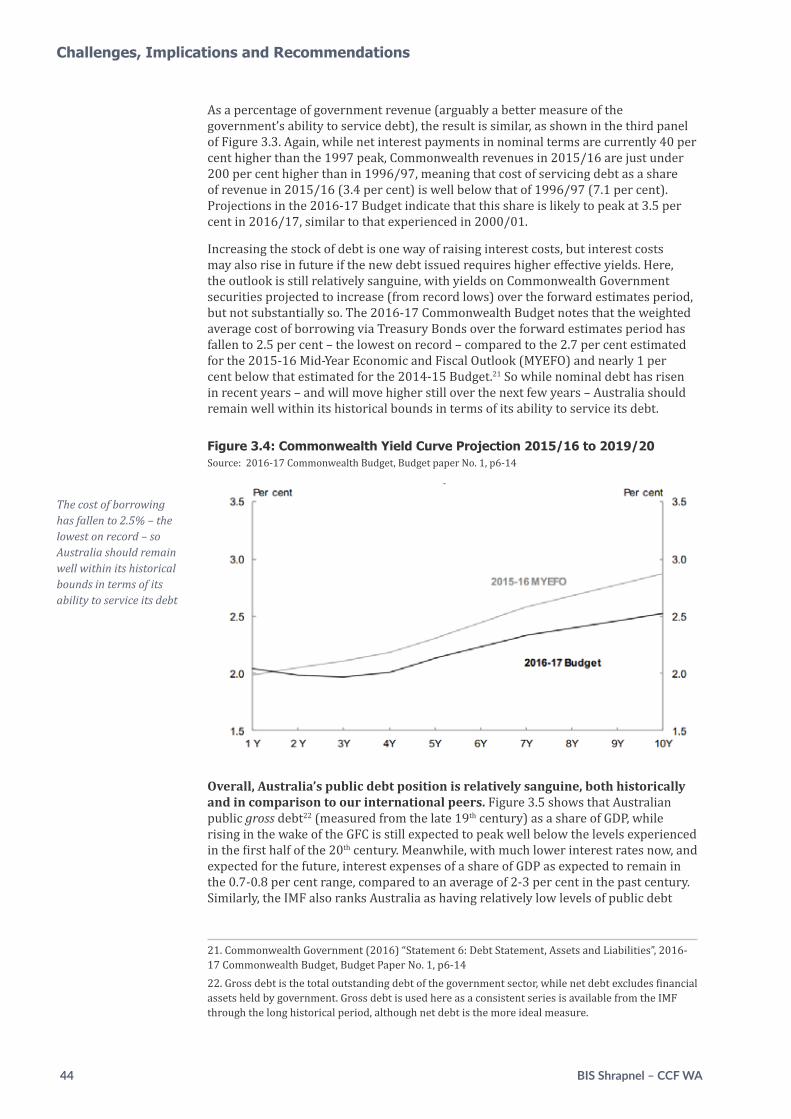
44 BIS Shrapnel – CCF WA
The cost of borrowing has fallen to 2.5% – the lowest on record – so Australia should remain well within its historical bounds in terms of its ability to service its debt
Challenges, Implications and Recommendations
As a percentage of government revenue (arguably a better measure of the government’s ability to service debt), the result is similar, as shown in the third panel of Figure 3.3. Again, while net interest payments in nominal terms are currently 40 per cent higher than the 1997 peak, Commonwealth revenues in 2015/16 are just under 200 per cent higher than in 1996/97, meaning that cost of servicing debt as a share of revenue in 2015/16 (3.4 per cent) is well below that of 1996/97 (7.1 per cent). Projections in the 2016-17 Budget indicate that this share is likely to peak at 3.5 per cent in 2016/17, similar to that experienced in 2000/01.
Increasing the stock of debt is one way of raising interest costs, but interest costs may also rise in future if the new debt issued requires higher effective yields. Here, the outlook is still relatively sanguine, with yields on Commonwealth Government securities projected to increase (from record lows) over the forward estimates period, but not substantially so. The 2016-17 Commonwealth Budget notes that the weighted average cost of borrowing via Treasury Bonds over the forward estimates period has fallen to 2.5 per cent – the lowest on record – compared to the 2.7 per cent estimated for the 2015-16 Mid-Year Economic and Fiscal Outlook (MYEFO) and nearly 1 per cent below that estimated for the 2014-15 Budget.21 So while nominal debt has risen in recent years – and will move higher still over the next few years – Australia should remain well within its historical bounds in terms of its ability to service its debt.
Figure 3.4: Commonwealth Yield Curve Projection 2015/16 to 2019/20Source: 2016-17 Commonwealth Budget, Budget paper No. 1, p6-14
Overall, Australia’s public debt position is relatively sanguine, both historically and in comparison to our international peers. Figure 3.5 shows that Australian public gross debt22 (measured from the late 19th century) as a share of GDP, while rising in the wake of the GFC is still expected to peak well below the levels experienced in the first half of the 20th century. Meanwhile, with much lower interest rates now, and expected for the future, interest expenses of a share of GDP as expected to remain in the 0.7-0.8 per cent range, compared to an average of 2-3 per cent in the past century. Similarly, the IMF also ranks Australia as having relatively low levels of public debt
21. Commonwealth Government (2016) “Statement 6: Debt Statement, Assets and Liabilities”, 2016-17 Commonwealth Budget, Budget Paper No. 1, p6-1422. Gross debt is the total outstanding debt of the government sector, while net debt excludes financial assets held by government. Gross debt is used here as a consistent series is available from the IMF through the long historical period, although net debt is the more ideal measure.

WA Infrastructure Report 2017: A construction economy in transition 45
Australian public gross debt as a share of GDP, while rising in the wake of the GFC, is still expected to peak well below the levels experienced in the first half of the 20th century
internationally, with G20 and comparable advanced economy (G7) debt generally three to four times higher than Australia as a share of GDP, with all experiencing rising debt levels in the wake of the GFC.23 Out of 91 countries with general government net debt statistics tracked by the IMF, Australia is 70th in the list of indebted countries. Amongst 28 advanced economies, the IMF ranking only places Denmark, Estonia, Finland, New Zealand, Norway and Sweden as having lower debt/GDP ratios than Australia.
Figure 3.5 Australian Public Sector Gross Debt as a Percentage of GDPSource: IMF Datamapper, IMF 2015 Fiscal Outlook
0
20
40
60
80
100
120
1880
1885
1890
1895
1900
1905
1910
1915
1920
1925
1930
1935
1940
1945
1950
1955
1960
1965
1970
1975
1980
1985
1990
1995
2000
2005
2010
2015
2020
f
Australia Gross Public Debt as Share of GDP (%): 1880 to 2020
At the Western Australian level, net debt is more of an issue. Here, net public debt has risen from $3.6 billion in 2007/08 to $27.8 billion in 2015/16, with the debt to GSP ratio rising from 2.3 per cent to 11.8 per cent during that time. Net interest costs on this debt have risen significantly during this period, from $761 million in 2007/08 to $1.7 billion in 2015/16.
As a share of revenue, interest payments on net public debt have risen from 3.9 per cent in 2007/08 to 6.3 per cent in 2015/16. This is high by Western Australia’s recent historical standards, and has seen the State Government miss its financial targets – such as maintaining a debt to net revenue ratio of under 55 per cent – and consequently lose its AAA credit rating. However, it is still not high by advanced economy standards, and the interest costs remain manageable given historically low interest rates.
Furthermore, the biggest driver of growth in the Western Australia debt/revenue ratio in recent years – the outright declines in government revenues – is expected to moderate in coming years as Western Australia regains some share of GST distributions through the Commonwealth Grants Commission (courtesy of the lagged impact of falling royalty revenues) coupled with stabilising commodity prices. Consequently, net debt as a share of revenue is projected to peak in 2017/18 before receding, according to the 2016-17 Western Australia State Budget.
23. International Monetary Fund 2016 “IMF Datamapper”, viewed 28th September 2016 http://www.imf.org/external/datamapper/index.php
46 BIS Shrapnel – CCF WA
Challenges, Implications and Recommendations
The Commonwealth Government could more than double its current infrastructure investment program without impinging on its credit rating
Figure 3.6 Public Net Debt as a Proportion of GDP (%): International ComparisonsSource: IMF Datamapper
-20
0
20
40
60
80
100
2007
2008
2009
2010
2011
2012
2013
2014
2015
2016
e
2017
f
2018
f
2019
f
2020
f
2021
f
Net Debt as a Percentage of GDP (%)
Australia Euro area G-20 Major advanced economies (G7)
3.5 Could public debt be used to fund Western Australian infrastructure?
The relatively low level of public debt in Australia, coupled with commitments to debt sustainability, can provide a route for Australian governments to meet infrastructure investment challenges in the medium to long term whilst boosting weak domestic demand in the short term. It is also one which can be utilised alongside other policies such as encouraging direct private investment, raising taxes to fund infrastructure, and asset recycling measures.
As outlined in the WA Infrastructure Report 2015, Australia is considered one of the world’s safest economies regarding its level of public debt and the fiscal space it has before debt becomes a more serious issue24. In a more recent research note, Morgan Stanley reckons that Australia still has a substantial buffer (around 5-6 per cent of GDP, equating to more than A$80 billion) before the Commonwealth Government is at more serious risk of losing its AAA credit rating.25 This means that the Commonwealth Government could more than double its current infrastructure investment program without impinging on its credit rating – the challenge being to ensure that the debt is used to build productive assets.
24. Moody’s Analytics (2014), viewed 28th September 2016, https://www.economy.com/dismal/tools/global-fiscal-space-tracker. This list also demonstrates that countries which are sovereign currency issuers (focused in the top of the list), and whose debt is denominated in their own currency, have more fiscal space then those that do not (focused in the bottom of the list). Certainly, Japan continues to issue further debt in it own currency despite reaching the theoretical debt limit in this model, whereas Greece cannot. This suggests that countries such as Australia may very likely have more fiscal space than estimated by this model.25. Blake, D. et al 2016 “Australia Macro+: Budget ’16 (Almost) Same as it ever was”, Morgan Stanley Research, May 4th p4. This buffer takes into account an even less optimistic outlook for Commonwealth revenue growth (and hence net debt) over the remainder of this decade.
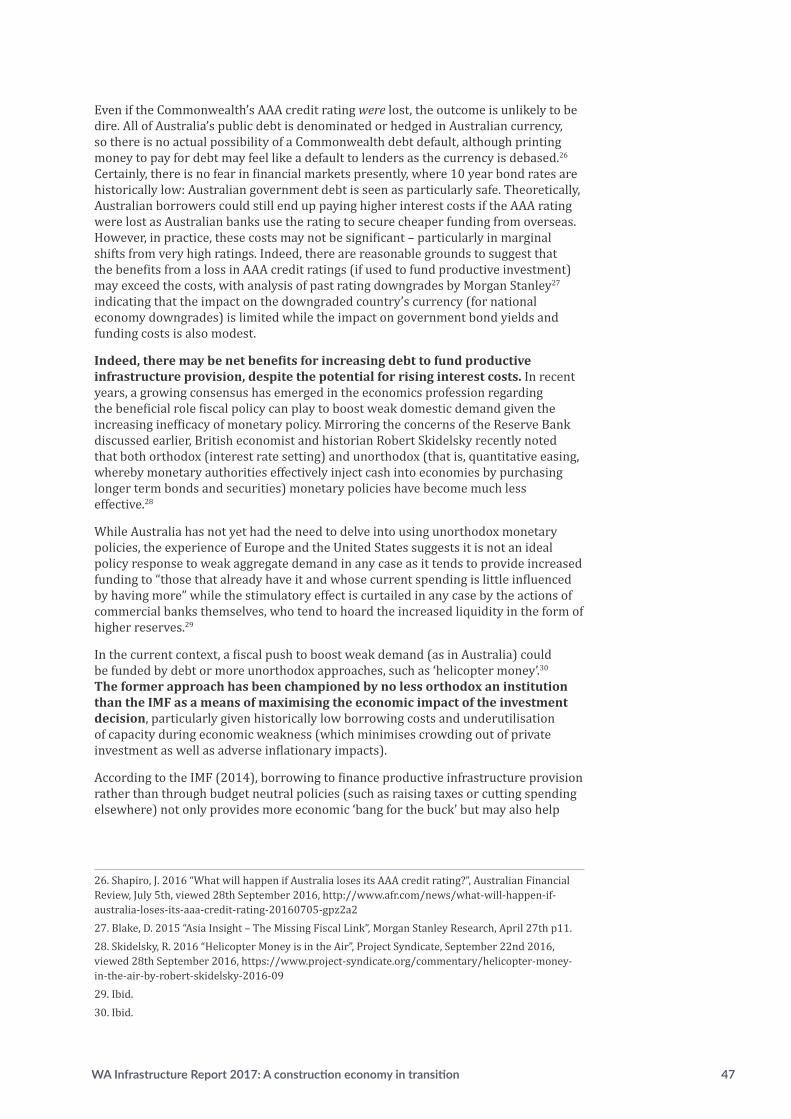
WA Infrastructure Report 2017: A construction economy in transition 47
Even if the Commonwealth’s AAA credit rating were lost, the outcome is unlikely to be dire. All of Australia’s public debt is denominated or hedged in Australian currency, so there is no actual possibility of a Commonwealth debt default, although printing money to pay for debt may feel like a default to lenders as the currency is debased.26 Certainly, there is no fear in financial markets presently, where 10 year bond rates are historically low: Australian government debt is seen as particularly safe. Theoretically, Australian borrowers could still end up paying higher interest costs if the AAA rating were lost as Australian banks use the rating to secure cheaper funding from overseas. However, in practice, these costs may not be significant – particularly in marginal shifts from very high ratings. Indeed, there are reasonable grounds to suggest that the benefits from a loss in AAA credit ratings (if used to fund productive investment) may exceed the costs, with analysis of past rating downgrades by Morgan Stanley27 indicating that the impact on the downgraded country’s currency (for national economy downgrades) is limited while the impact on government bond yields and funding costs is also modest.
Indeed, there may be net benefits for increasing debt to fund productive infrastructure provision, despite the potential for rising interest costs. In recent years, a growing consensus has emerged in the economics profession regarding the beneficial role fiscal policy can play to boost weak domestic demand given the increasing inefficacy of monetary policy. Mirroring the concerns of the Reserve Bank discussed earlier, British economist and historian Robert Skidelsky recently noted that both orthodox (interest rate setting) and unorthodox (that is, quantitative easing, whereby monetary authorities effectively inject cash into economies by purchasing longer term bonds and securities) monetary policies have become much less effective.28
While Australia has not yet had the need to delve into using unorthodox monetary policies, the experience of Europe and the United States suggests it is not an ideal policy response to weak aggregate demand in any case as it tends to provide increased funding to “those that already have it and whose current spending is little influenced by having more” while the stimulatory effect is curtailed in any case by the actions of commercial banks themselves, who tend to hoard the increased liquidity in the form of higher reserves.29
In the current context, a fiscal push to boost weak demand (as in Australia) could be funded by debt or more unorthodox approaches, such as ‘helicopter money’.30 The former approach has been championed by no less orthodox an institution than the IMF as a means of maximising the economic impact of the investment decision, particularly given historically low borrowing costs and underutilisation of capacity during economic weakness (which minimises crowding out of private investment as well as adverse inflationary impacts).
According to the IMF (2014), borrowing to finance productive infrastructure provision rather than through budget neutral policies (such as raising taxes or cutting spending elsewhere) not only provides more economic ‘bang for the buck’ but may also help
26. Shapiro, J. 2016 “What will happen if Australia loses its AAA credit rating?”, Australian Financial Review, July 5th, viewed 28th September 2016, http://www.afr.com/news/what-will-happen-if-australia-loses-its-aaa-credit-rating-20160705-gpz2a2 27. Blake, D. 2015 “Asia Insight – The Missing Fiscal Link”, Morgan Stanley Research, April 27th p11.28. Skidelsky, R. 2016 “Helicopter Money is in the Air”, Project Syndicate, September 22nd 2016, viewed 28th September 2016, https://www.project-syndicate.org/commentary/helicopter-money-in-the-air-by-robert-skidelsky-2016-09 29. Ibid.30. Ibid.
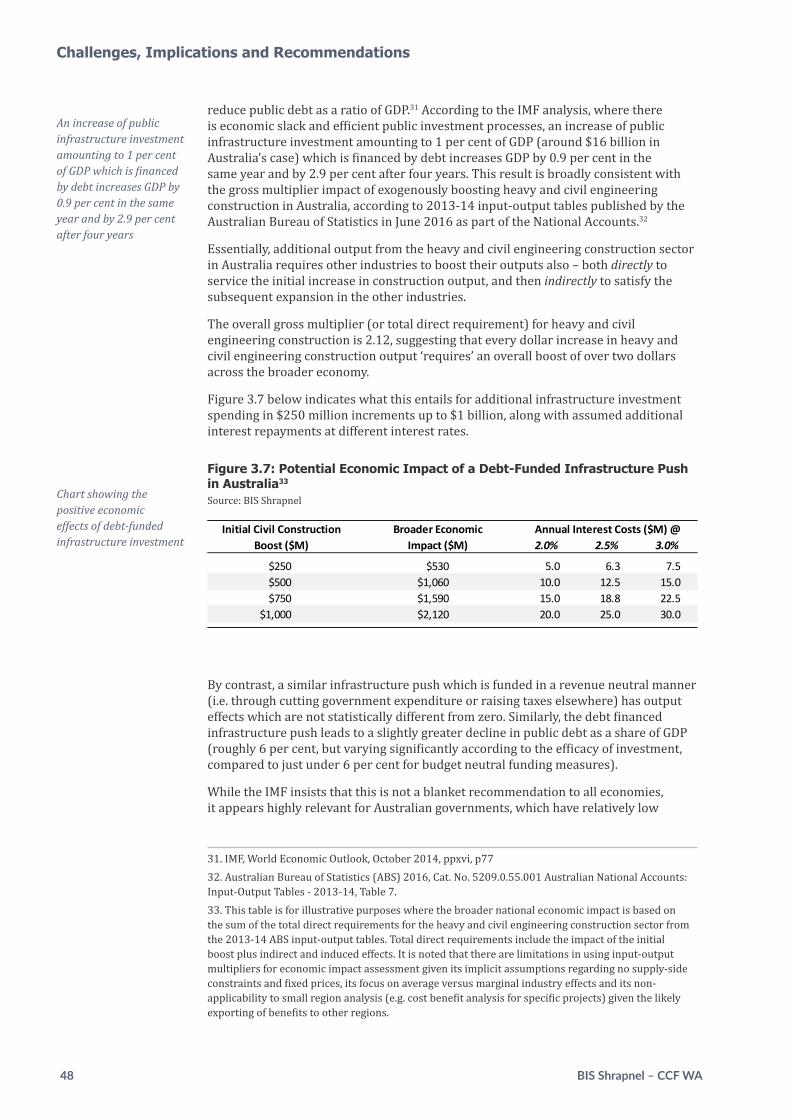
48 BIS Shrapnel – CCF WA
Challenges, Implications and Recommendations
reduce public debt as a ratio of GDP.31 According to the IMF analysis, where there is economic slack and efficient public investment processes, an increase of public infrastructure investment amounting to 1 per cent of GDP (around $16 billion in Australia’s case) which is financed by debt increases GDP by 0.9 per cent in the same year and by 2.9 per cent after four years. This result is broadly consistent with the gross multiplier impact of exogenously boosting heavy and civil engineering construction in Australia, according to 2013-14 input-output tables published by the Australian Bureau of Statistics in June 2016 as part of the National Accounts.32
Essentially, additional output from the heavy and civil engineering construction sector in Australia requires other industries to boost their outputs also – both directly to service the initial increase in construction output, and then indirectly to satisfy the subsequent expansion in the other industries.
The overall gross multiplier (or total direct requirement) for heavy and civil engineering construction is 2.12, suggesting that every dollar increase in heavy and civil engineering construction output ‘requires’ an overall boost of over two dollars across the broader economy.
Figure 3.7 below indicates what this entails for additional infrastructure investment spending in $250 million increments up to $1 billion, along with assumed additional interest repayments at different interest rates.
Figure 3.7: Potential Economic Impact of a Debt-Funded Infrastructure Push in Australia33
Source: BIS Shrapnel
Initial Civil Construction Broader Economic Annual Interest Costs ($M) @Boost ($M) Impact ($M) 2.0% 2.5% 3.0%
$250 $530 5.0 6.3 7.5$500 $1,060 10.0 12.5 15.0$750 $1,590 15.0 18.8 22.5
$1,000 $2,120 20.0 25.0 30.0
By contrast, a similar infrastructure push which is funded in a revenue neutral manner (i.e. through cutting government expenditure or raising taxes elsewhere) has output effects which are not statistically different from zero. Similarly, the debt financed infrastructure push leads to a slightly greater decline in public debt as a share of GDP (roughly 6 per cent, but varying significantly according to the efficacy of investment, compared to just under 6 per cent for budget neutral funding measures).
While the IMF insists that this is not a blanket recommendation to all economies, it appears highly relevant for Australian governments, which have relatively low
31. IMF, World Economic Outlook, October 2014, ppxvi, p7732. Australian Bureau of Statistics (ABS) 2016, Cat. No. 5209.0.55.001 Australian National Accounts: Input-Output Tables - 2013-14, Table 7. 33. This table is for illustrative purposes where the broader national economic impact is based on the sum of the total direct requirements for the heavy and civil engineering construction sector from the 2013-14 ABS input-output tables. Total direct requirements include the impact of the initial boost plus indirect and induced effects. It is noted that there are limitations in using input-output multipliers for economic impact assessment given its implicit assumptions regarding no supply-side constraints and fixed prices, its focus on average versus marginal industry effects and its non-applicability to small region analysis (e.g. cost benefit analysis for specific projects) given the likely exporting of benefits to other regions.
Chart showing the positive economic effects of debt-funded infrastructure investment
An increase of public infrastructure investment amounting to 1 per cent of GDP which is financed by debt increases GDP by 0.9 per cent in the same year and by 2.9 per cent after four years
WA Infrastructure Report 2017: A construction economy in transition 49
levels of debt compared to their global peers, economic slack and relatively well developed infrastructure plans that focus on productive investments. Indeed, in June 2015, following an IMF mission to Australia and the Asia-Pacific region, the IMF lamented Australia’s focus on budget discipline given the weakness of the economy as it transitioned away from resources-driven growth and the greatest terms of trade downgrade in over 50 years.
Unfortunately, while evidence of the economic benefits of increasing debt-funded infrastructure investment continues to accumulate, publicly funded infrastructure investment is only just starting to rise after many years of decline. Weak revenues and rising budget deficits have seen State Governments in Queensland and Western Australia postpone or cut infrastructure projects from their forward plans (as well as capping other expenditures), with debt funding politically difficult to champion (although arguably more could be done in terms of using other funding mechanisms such as capital recycling or direct private provision).
At the Commonwealth level, public infrastructure investment is finally ramping up following a period of decline. However, this recovery in activity is still much in line with the Infrastructure Investment Program (IIP) outlined in the earlier 2014-15 Commonwealth Budget – a highly positive contribution, but in the circumstances much more could be done. By contrast the 2015-16 and 2016-17 Commonwealth Budgets were almost completely silent on new infrastructure initiatives.34 While concerns over a lack of known productive infrastructure projects may be the root cause of the problem,35 it is also likely that borrowing to invest in infrastructure – despite its economic benefits – may still be a political challenge to a Commonwealth government which has targeted debt reduction as a matter of policy priority.36
Finally, while borrowing is the more orthodox approach in funding fiscal policy (including infrastructure), another mechanism gaining interest is that of direct money transfers or ‘helicopter money’, a term made famous by Milton Friedman in his 1969 collection of essays The Optimum Quantity of Money. Here, Friedman postulated the effect of a (seemingly) once off “helicopter drop of money from the sky” on spending and employment. In practice, this could simply involve instructing the central bank to credit citizens accounts or, in the context of public infrastructure funding, simply credit the Commonwealth’s central bank account. This is not quantitative easing as it not an asset swap (as when a central bank purchases a governments long term bonds) but rather a fiscal policy directive effectively akin to printing money, which does not increase national debt.
While gaining interest internationally as a way of stimulating economies in the wake of failed quantitative easing approaches amid high levels of public sector debt, helicopter drops are unlikely to be part of Australia’s infrastructure funding landscape in the near future unless the economy weakens substantially more than expected. The potential risks of helicopter money is inflation (particularly when government deficits persist when the economy is growing)37, but today’s proponents in what is known as Modern
34. Blake, D. et al (2016) “Australia Macro+ Budget ’16 (Almost Same as it ever was”, Morgan Stanley Research, May 4th 2016, notes that lack of new infrastructure commitments in the 2016-17 Budget to be the “key area of disappointment”, putting greater pressure on housing construction to support employment and possibly being a factor behind the Reserve Bank’s decision to cut interest rates early on Budget day.35. As intimated by Paul Fletcher, Minister for Urban Infrastructure, in Fletcher, P. “We’ll spend on major assets, but only where the sums add up”, Australian Financial Review, 7th September 2016. Here, there is direct criticism of opposition plans to increase infrastructure funding in the absence of rigorous cost benefit analysis – which suggests a need for more timely identification of productive projects than a criticism of debt-funded infrastructure spending per se.36. https://www.liberal.org.au/coalitions-policy-stronger-economy-and-balanced-budget 37. Krugman, P. (2011), “Deficits and the Printing Press (Somewhat Wonkish)”, The New York Times, 25th March 2011, viewed 28th September 2016.
Borrowing to invest in infrastructure – despite its economic benefits – may still be a political challenge to a Commonwealth government which has targeted debt reduction as a matter of policy priority
50 BIS Shrapnel – CCF WA
Challenges, Implications and Recommendations
Monetary Theory (MMT) insist that governments that issue their own currency (such as the Commonwealth Government) do have recourse to this approach in funding infrastructure, particularly when interest rates are near zero and the economy has excess capacity.
3.6 Conclusions and recommendations
The Western Australian economy remains in a difficult transition period characterised by sharply falling State Final Demand and employment. While mining production will continue to grow based on recent investment in new capacity, this phase of the resources cycle is less employment intensive than the investment phase and has weaker multiplier impacts on the rest of the economy through its related impacts on population growth, housing and non-mining business investment.
Falling investment and lower commodity prices (affecting incomes and royalties), combined with the lagged impact of Western Australia’s GST share determinations has decimated State Government revenues. This is particularly important for a state such as Western Australia which has maintained in its Budget targets for funding public expenditure (and specifically capital items such as infrastructure investment) through a share of cash surpluses. While the revenue contraction is temporary (and, in fact, will be reversed over the next four years as royalty and GST receipts recover), the downturn in investment is projected to see domestic demand in the Western Australia economy continue to contract until 2018/19, with deleterious consequences for local industries, incomes and employment.
While State Government debt has increased substantially as a result, the cost of servicing this debt has been ameliorated by historically low interest rates. At both the State and Commonwealth level, there is still much that can be done to boost domestic demand and productivity, with infrastructure investment a key plank in transitioning the mining boom economy back towards balanced growth.
If investment is focused on projects that make economic sense, there are significant benefits (as measured and recommended by the IMF as well as many other agencies and prominent economists) in taking advantage of low interest rates and economic slack and boosting weak domestic demand and employment through debt-funded productive infrastructure investment. Outside of debt funding, there are other positive approaches to infrastructure funding available, including setting up long term asset leases as well as considering direct private investment proposals (both of which are now benefiting New South Wales and Victorian infrastructure investment).
With these perspectives in mind, this Report makes the following recommendations:
A. Developing a long-term infrastructure program
Recommendation 1. Given the projected prolonged weakness in domestic demand and employment, the Western Australian State Government and the Commonwealth Government should immediately expand the scope of productivity-enhancing public infrastructure provision. This should focus on shovel-ready projects initially and then on maintaining a rolling, long term infrastructure investment program that provides industry confidence and certainty.
Recommendation 2. Western Australia should establish an independent infrastructure agency, as in other states, to undertake or review business cases on specific infrastructure initiatives and establish a pipeline of productive infrastructure projects in the State.
WA Infrastructure Report 2017: A construction economy in transition 51
Recommendation 3. Commonwealth and Western Australian State Governments engage with industry and infrastructure agencies to develop longer term (15 to 20 year) infrastructure plans, with bipartisan support, with a clear ranking of projects so they can be prioritised or deprioritised according to prevailing economic conditions.
Recommendation 4. Both short term and long term public investment programs should be based on maximising economic benefits through transparent cost benefit analysis (CBA). This, in turn, requires (i) the publication of CBAs supporting public investment decisions so they can be rigorously and independently tested, but also (ii) improvement in the quality of the data collected by the Australian Bureau of Statistics (ABS) which form key inputs to the CBA process, particularly surrounding the value of capital stock, investment, construction, construction costs and productivity.
B. Funding productive infrastructure
Recommendation 5. With interest rates at historical lows and excess capacity in the civil construction industry, further debt funding of productive infrastructure should be used as an effective means to address the infrastructure deficit.
Recommendation 6. Given the fiscal headroom of the Commonwealth Government, the vertical fiscal imbalance embedded in Commonwealth-State relations, and the relative benefits of using debt to fund productive infrastructure investment, the Commonwealth Government should guarantee the debt of any expanded infrastructure program by the Western Australia State Government to a defined maximum figure so long as those projects are shown to be productive through the transparent CBA process.
Recommendation 7. The Commonwealth Government should provide five-yearly pooled infrastructure funding to the States and reduce the use of project specific or tied (conditional) s96 grants (such as to the Perth Freight Link project) as outlined by the National Commission of Audit report in 2014.
Recommendation 8. The State Government should urgently consider long-term asset leases to fund infrastructure investment but only after rigorous analysis to demonstrate that the benefits outweigh the costs and that effective regulatory processes are in place.
Recommendation 9. The Commonwealth Government should reactivate its 15 per cent Asset Recycling Initiative to encourage State Governments to fund new productive infrastructure and which compensates for the loss of the future income stream of publicly held assets.
Recommendation 10. The State Government should develop policies for encouraging and assessing unsolicited infrastructure investment proposals from the private sector, as operating in other states such as Queensland, New South Wales and Victoria.
C. Boosting efficiency and reducing costs
Recommendation 11. To maximise efficiencies in public infrastructure provision and reduce costs, both the Commonwealth and State Governments should follow through with reforms to the public infrastructure procurement process, as outlined by the Productivity Commission’s review in 2014. This includes governments investing
52 BIS Shrapnel – CCF WA
more in initial designs; contributing to bid costs where innovation is genuinely in prospect; leaving more of the detailed planning and design to the preferred tenderer (rather than all bidders at the tender stage); packaging projects into contract sizes that foster broader competition and a sustainable contracting industry; and removing unnecessary, duplicative or otherwise inefficient approvals processes or regulations.
Recommendation 12. Western Australia should harmonise procurement policies and approaches across all levels of government, including the use of open (rather than closed) tenders, local content rules, and de-bundling large infrastructure projects to boost competition and the sustainability of the civil construction industry.
Recommendation 13. That Western Australia and Commonwealth Governments look to increase funding for infrastructure maintenance as a more cost effective way of sustaining the existing asset stock and reducing future requirements for costly asset replacement.
Recommendation 14. Both Commonwealth and State Governments should continue to make concerted efforts to eliminate structural deficits in their Budgets (which entail borrowing to fund recurrent expenditures across the economic cycle) through wholesale tax and expenditure reforms. This would be assisted, in turn, by improvements in the quality of Budget reporting to better isolate capital and recurrent expenditure items and the degree to which each are effectively funded through debt.
Challenges, Implications and Recommendations
WA Infrastructure Report 2017: A construction economy in transition 53
About CCF WAThe Civil Contractors Federation is the member-based body representing the Australian civil construction industry, with branches in each State and Territory and a National Office in Canberra. Nationally, we represent more than 1,500 civil contractors and a further 700 suppliers to industry. Our members are involved in a variety of projects and activities including the development and maintenance of civil or ‘horizontal’ infrastructure such as roads, bridges, railways, sewer, water and drainage pipelines, dams, wharves, and commercial and housing land development.
CCF WA actively represents the views of the Western Australian civil construction industry to Governments at all levels, promoting our vision of a vibrant, sustainable civil construction industry building world-class infrastructure. We advocate policies that reduce red tape, provide a strong, transparent pipeline of works and ensure a level playing field with fair opportunity for all contractors.
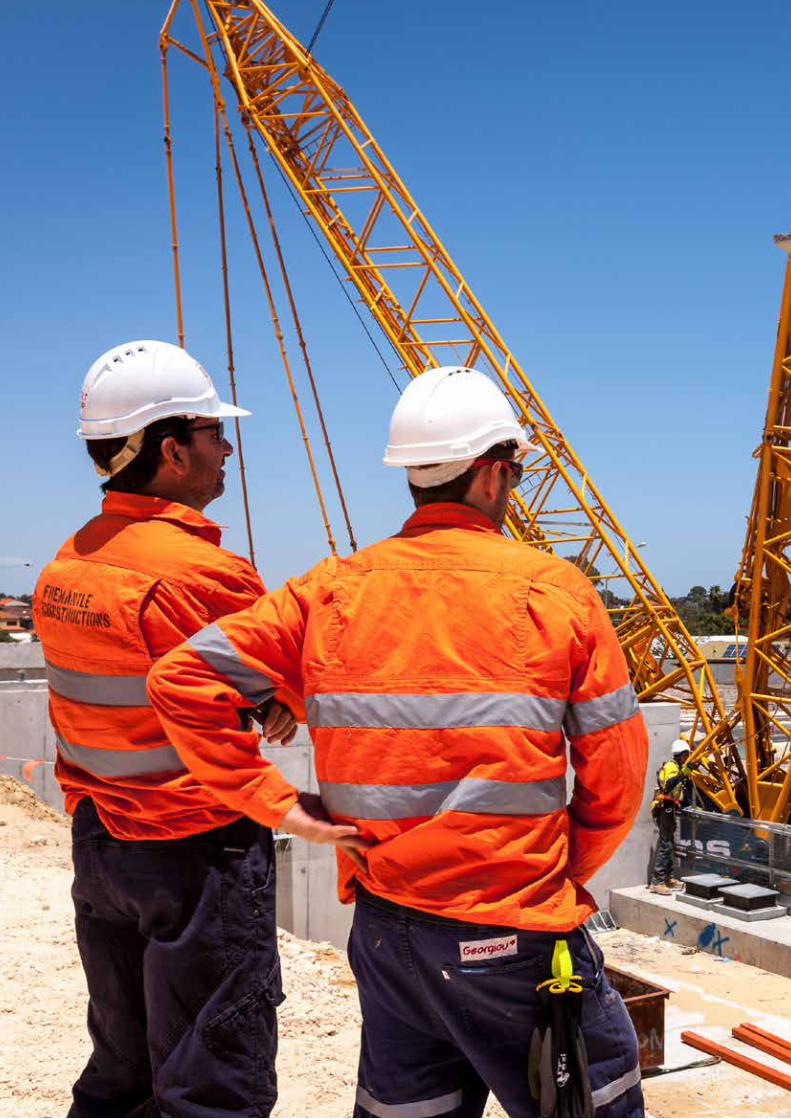
54 BIS Shrapnel – CCF WA
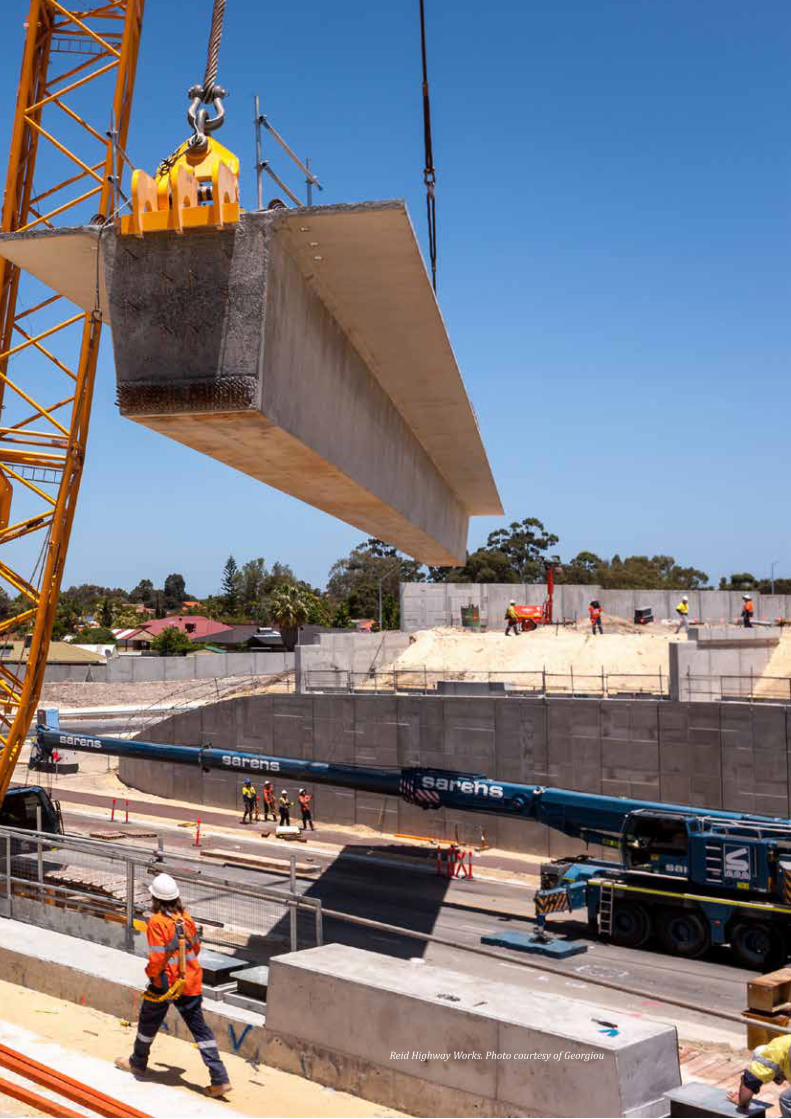
Reid Highway Works. Photo courtesy of Georgiou


![Lim Chin San Contractors Pte Ltd v LW Infrastructure …2011]_4_SLR_0455...Lim Chin San Contractors Pte Ltd v LW ... The legal consequence of time being set at ... 3 M & W 387 (folld)](https://img.pdfslide.net/doc/110x75/5b01c7e07f8b9a84338eaf44/lim-chin-san-contractors-pte-ltd-v-lw-infrastructure-20114slr0455lim.jpg)