Embed Size (px)
Citation preview
Clark County Homeless System
“The Continuum of Care of Homeless Services is a Crisis-Response system.”
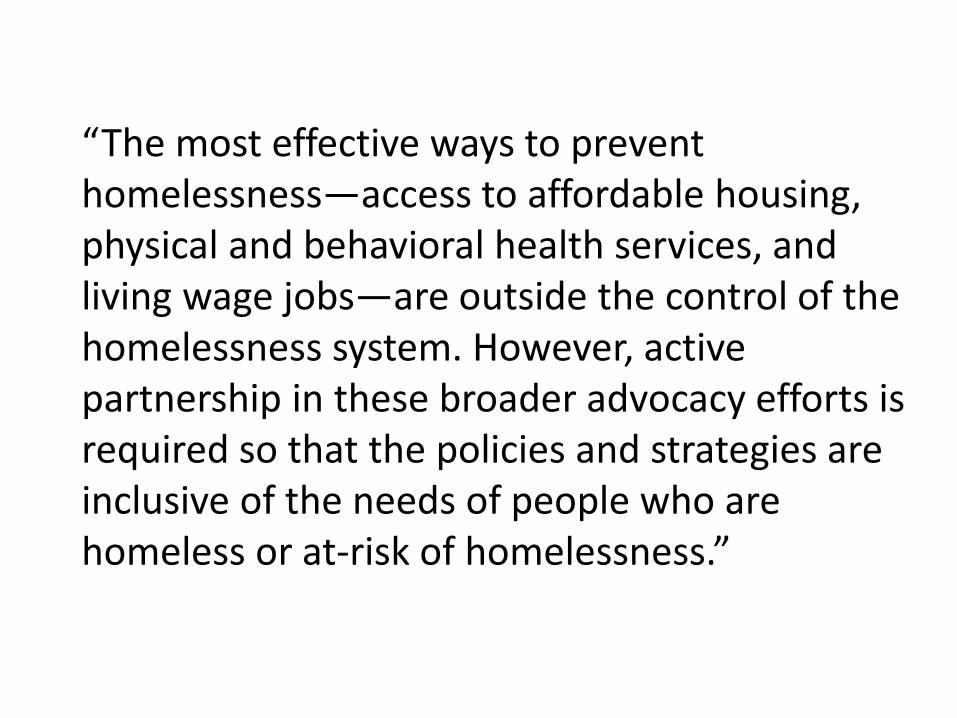
“The most effective ways to prevent homelessness—access to affordable housing, physical and behavioral health services, and living wage jobs—are outside the control of the homelessness system. However, active partnership in these broader advocacy efforts is required so that the policies and strategies are inclusive of the needs of people who are homeless or at-risk of homelessness.”
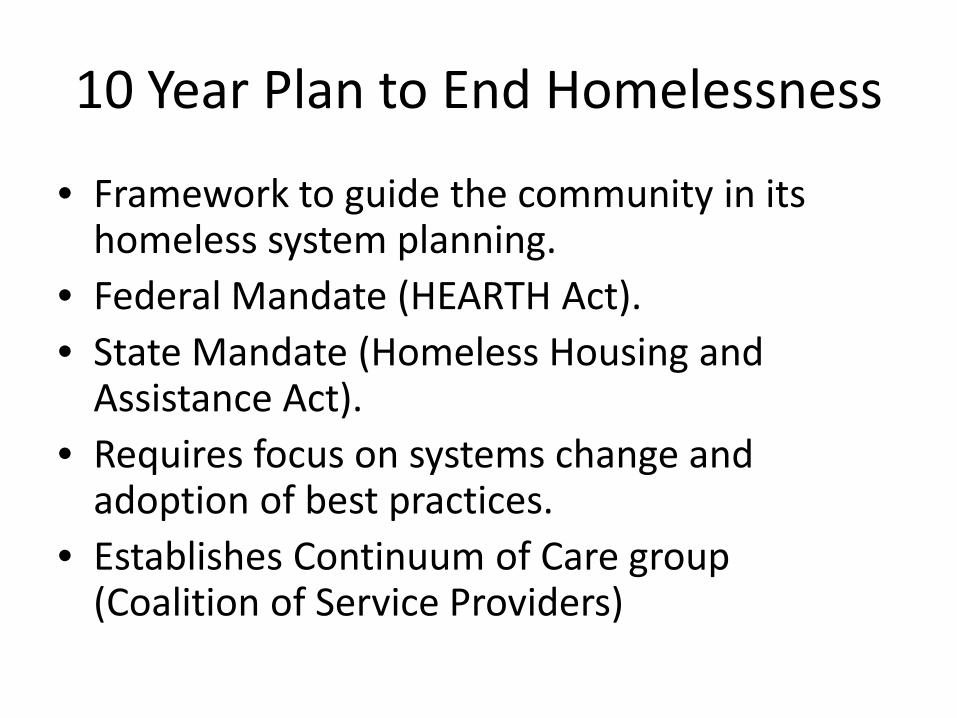
10 Year Plan to End Homelessness
• Framework to guide the community in its homeless system planning.
• Federal Mandate (HEARTH Act). • State Mandate (Homeless Housing and
Assistance Act). • Requires focus on systems change and
adoption of best practices. • Establishes Continuum of Care group
(Coalition of Service Providers)
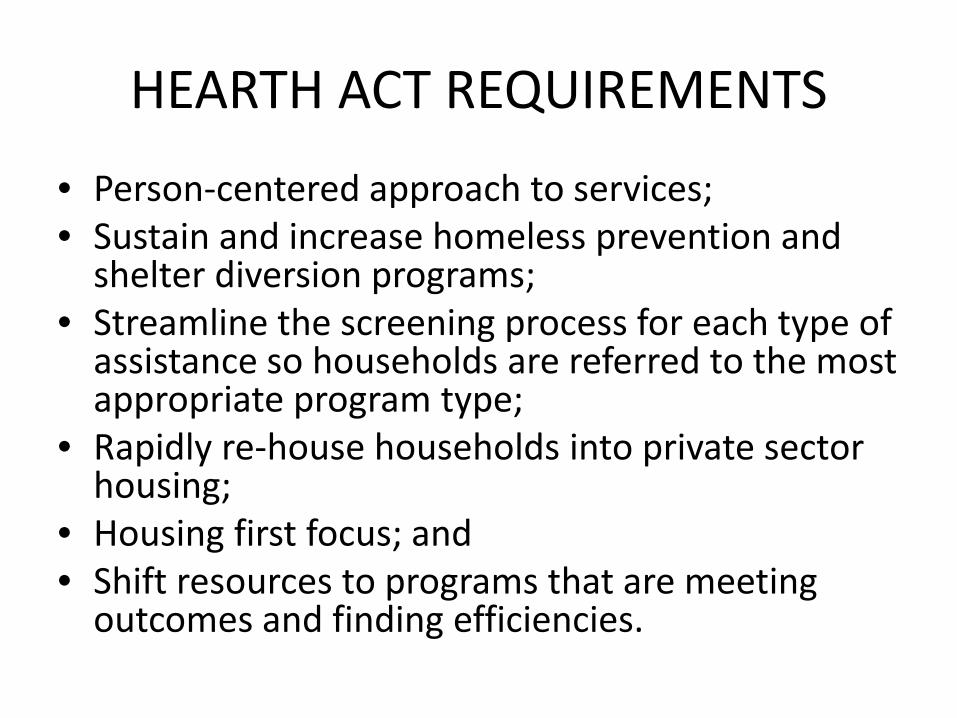
HEARTH ACT REQUIREMENTS
• Person-centered approach to services; • Sustain and increase homeless prevention and
shelter diversion programs; • Streamline the screening process for each type of
assistance so households are referred to the most appropriate program type;
• Rapidly re-house households into private sector housing;
• Housing first focus; and • Shift resources to programs that are meeting
outcomes and finding efficiencies.
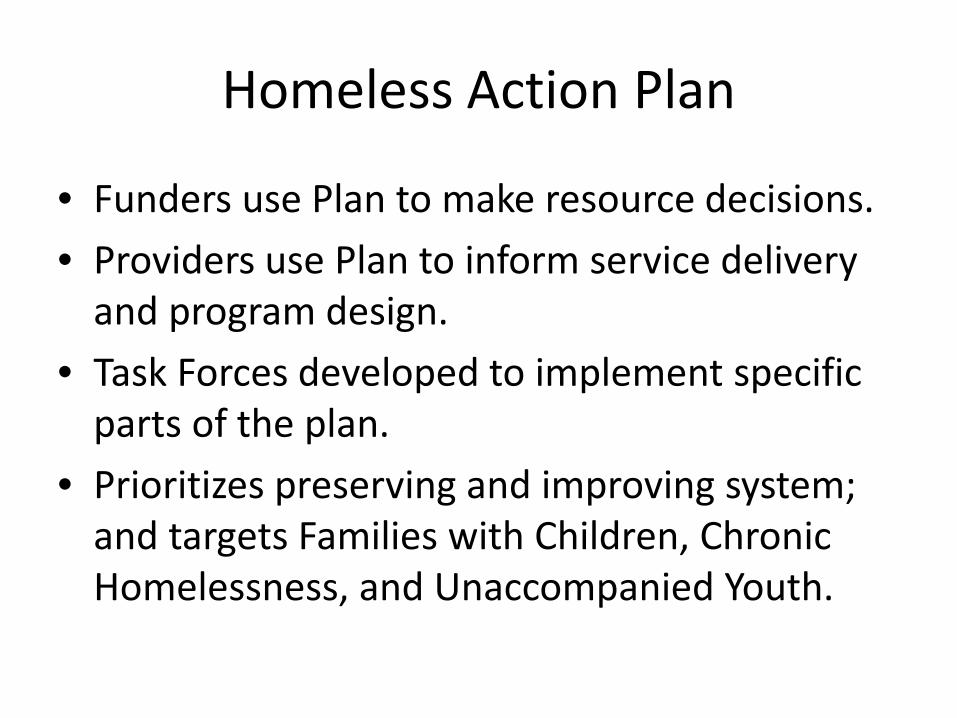
Homeless Action Plan
• Funders use Plan to make resource decisions. • Providers use Plan to inform service delivery
and program design. • Task Forces developed to implement specific
parts of the plan. • Prioritizes preserving and improving system;
and targets Families with Children, Chronic Homelessness, and Unaccompanied Youth.
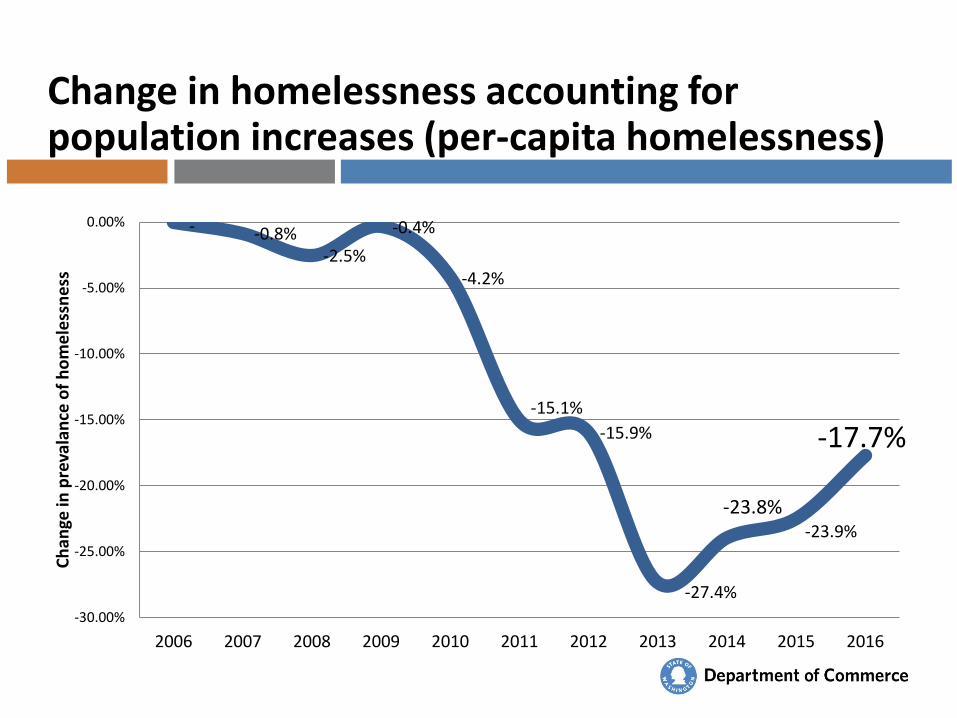
Change in homelessness accounting for population increases (per-capita homelessness)
- -0.8% -2.5%
-0.4%
-4.2%
-15.1% -15.9%
-27.4%
-23.8% -23.9%
-17.7%
-30.00%
-25.00%
-20.00%
-15.00%
-10.00%
-5.00%
0.00%
2006 2007 2008 2009 2010 2011 2012 2013 2014 2015 2016
Chan
ge in
pre
vala
nce
of h
omel
essn
ess
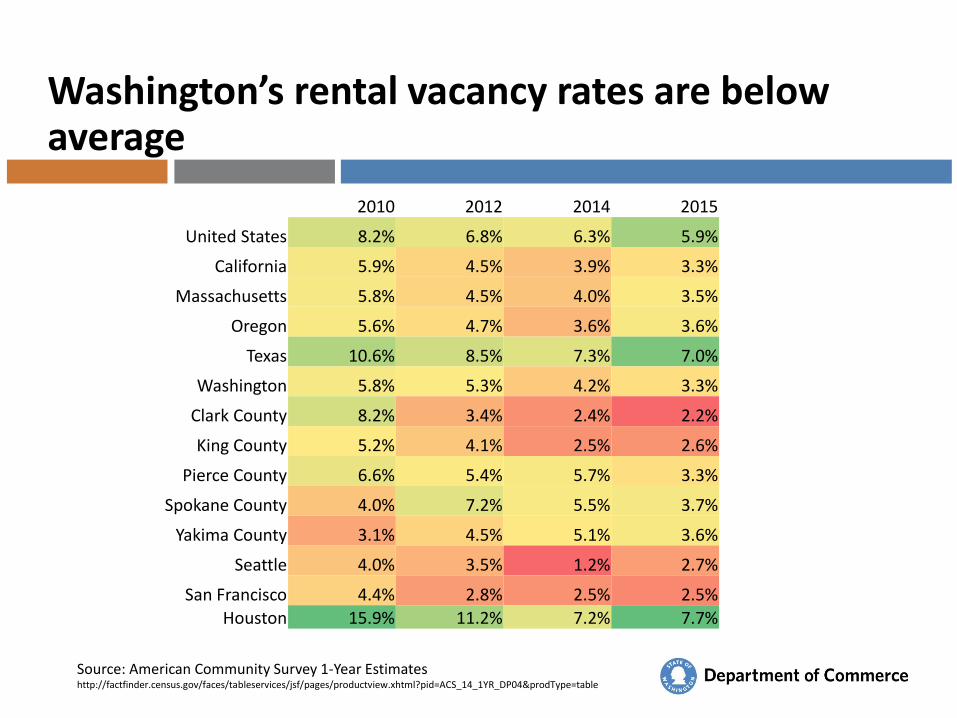
Washington’s rental vacancy rates are below average
Source: American Community Survey 1-Year Estimates http://factfinder.census.gov/faces/tableservices/jsf/pages/productview.xhtml?pid=ACS_14_1YR_DP04&prodType=table
2010 2012 2014 2015
United States 8.2% 6.8% 6.3% 5.9%
California 5.9% 4.5% 3.9% 3.3%
Massachusetts 5.8% 4.5% 4.0% 3.5%
Oregon 5.6% 4.7% 3.6% 3.6%
Texas 10.6% 8.5% 7.3% 7.0%
Washington 5.8% 5.3% 4.2% 3.3%
Clark County 8.2% 3.4% 2.4% 2.2%
King County 5.2% 4.1% 2.5% 2.6%
Pierce County 6.6% 5.4% 5.7% 3.3%
Spokane County 4.0% 7.2% 5.5% 3.7%
Yakima County 3.1% 4.5% 5.1% 3.6%
Seattle 4.0% 3.5% 1.2% 2.7%
San Francisco 4.4% 2.8% 2.5% 2.5% Houston 15.9% 11.2% 7.2% 7.7%
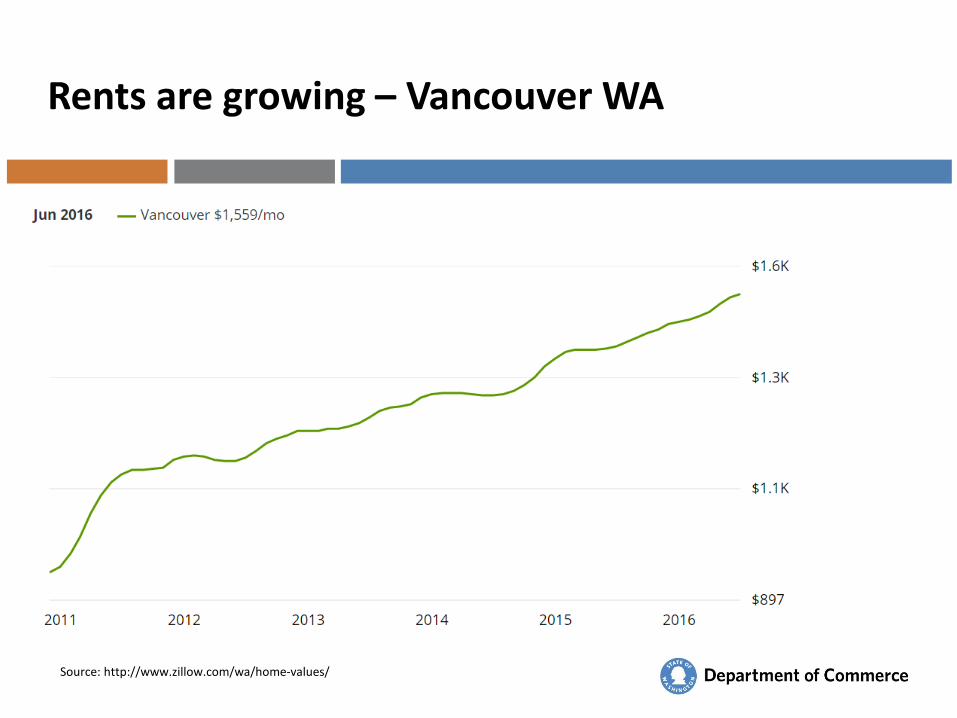
Rents are growing – Vancouver WA
Source: http://www.zillow.com/wa/home-values/
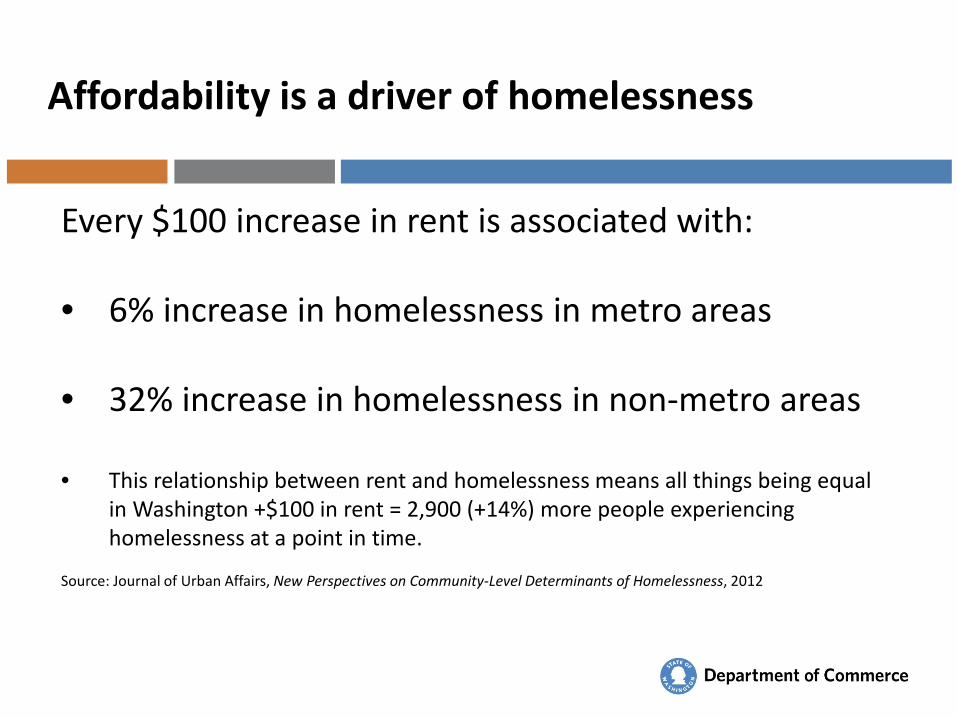
Affordability is a driver of homelessness
Every $100 increase in rent is associated with: • 6% increase in homelessness in metro areas
• 32% increase in homelessness in non-metro areas
• This relationship between rent and homelessness means all things being equal
in Washington +$100 in rent = 2,900 (+14%) more people experiencing homelessness at a point in time.
Source: Journal of Urban Affairs, New Perspectives on Community-Level Determinants of Homelessness, 2012
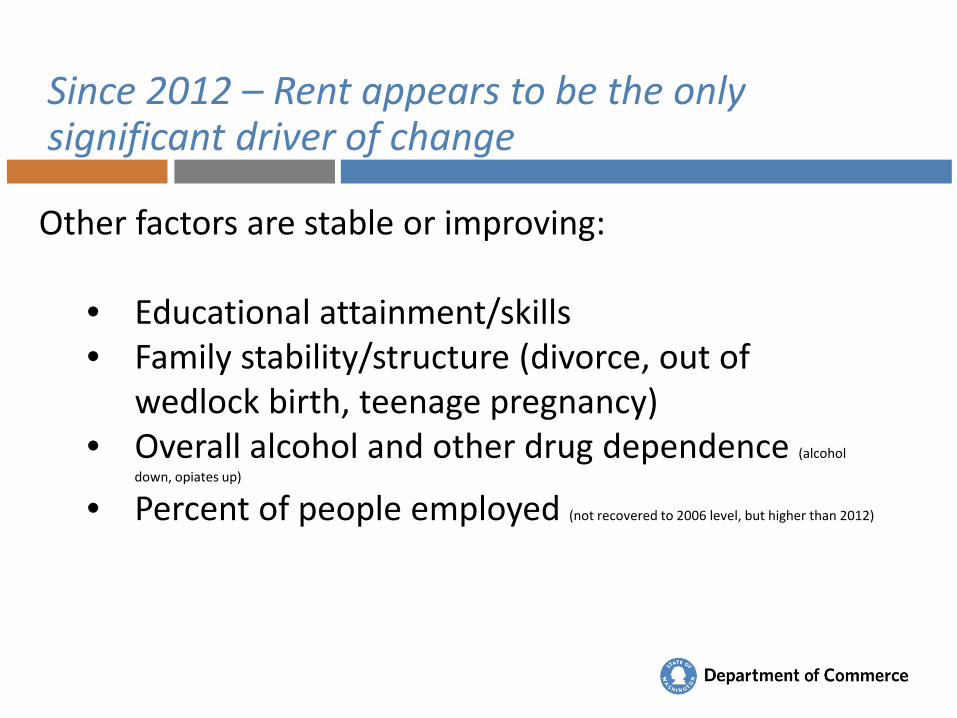
Since 2012 – Rent appears to be the only significant driver of change
Other factors are stable or improving:
• Educational attainment/skills • Family stability/structure (divorce, out of
wedlock birth, teenage pregnancy) • Overall alcohol and other drug dependence (alcohol
down, opiates up)
• Percent of people employed (not recovered to 2006 level, but higher than 2012)
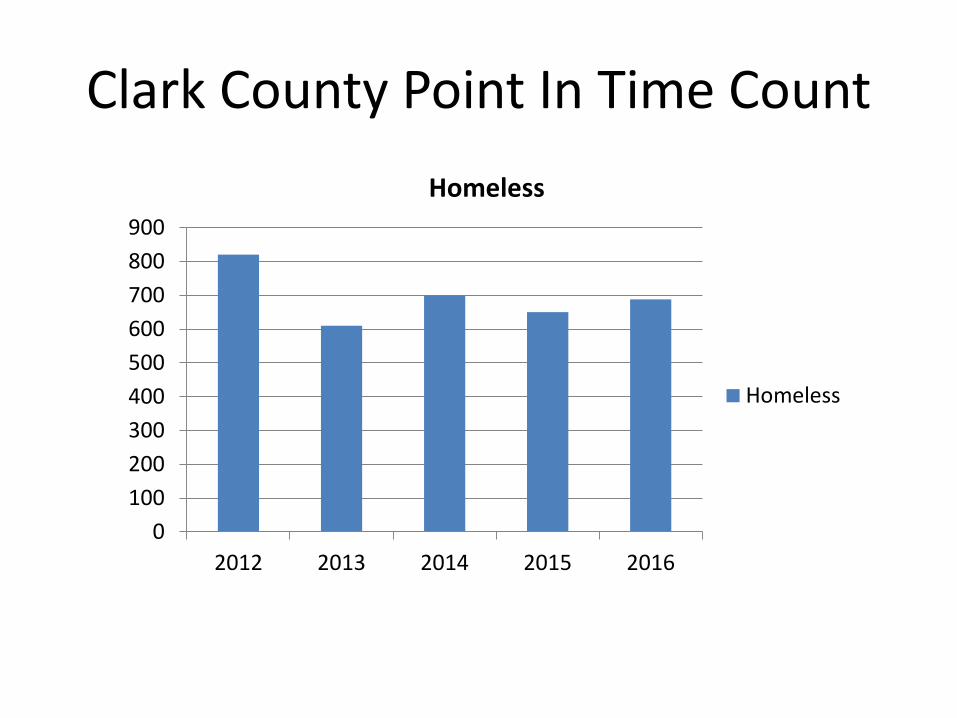
Clark County Point In Time Count
0100200300400500600700800900
2012 2013 2014 2015 2016
Homeless
Homeless
Housing Program Types Emergency Shelter Prevention Rapid Re-Housing Transitional Housing Permanent Supportive Housing
Emergency Shelters
- Share Homestead & Share Orchards Inn
- Share House
- YWCA Safe Choice DV Shelter
- Oak Grove & Oak Bridge Youth Shelters
- WHO
-WHAT
- Motel Vouchers
- Open House Ministries
- Private Maternity Homes
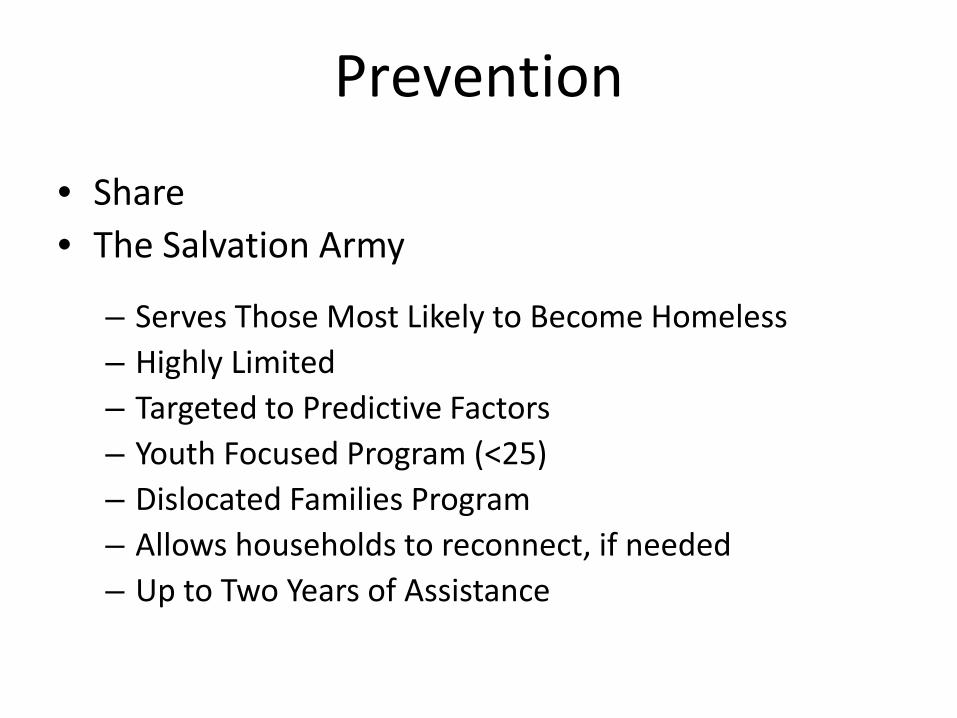
Prevention
• Share • The Salvation Army
– Serves Those Most Likely to Become Homeless – Highly Limited – Targeted to Predictive Factors – Youth Focused Program (<25) – Dislocated Families Program – Allows households to reconnect, if needed – Up to Two Years of Assistance
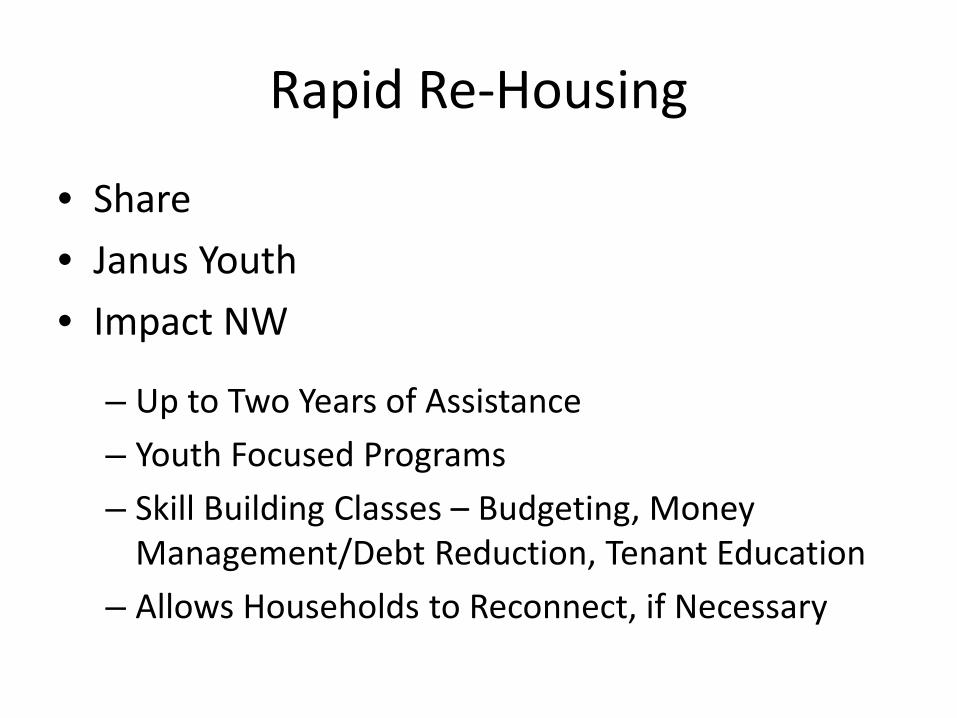
Rapid Re-Housing
• Share • Janus Youth • Impact NW
– Up to Two Years of Assistance – Youth Focused Programs – Skill Building Classes – Budgeting, Money
Management/Debt Reduction, Tenant Education – Allows Households to Reconnect, if Necessary
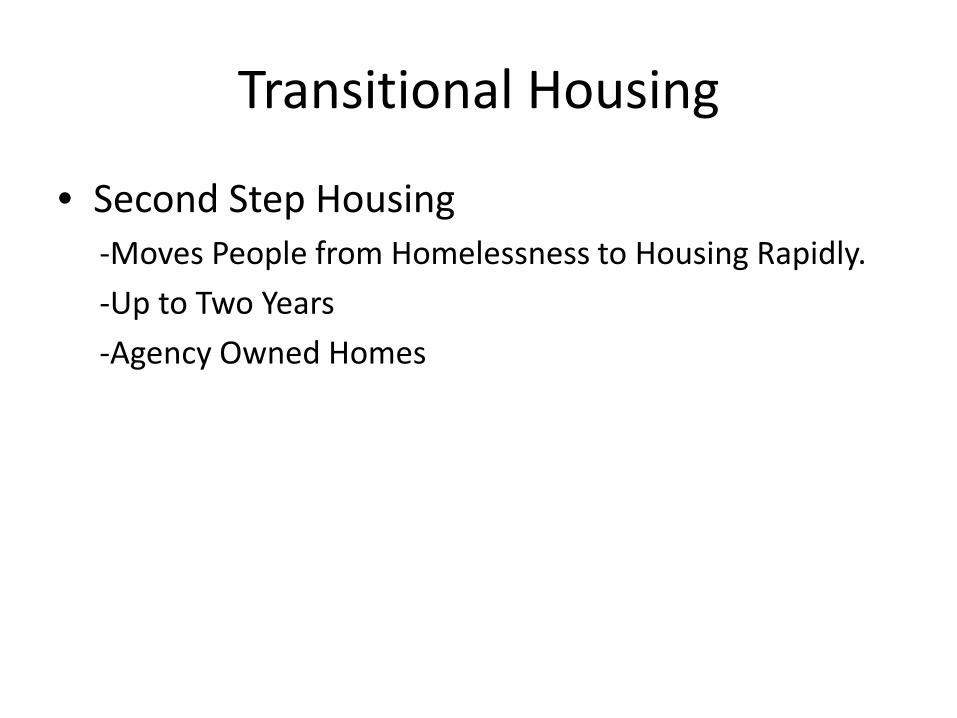
Transitional Housing
• Second Step Housing -Moves People from Homelessness to Housing Rapidly. -Up to Two Years -Agency Owned Homes
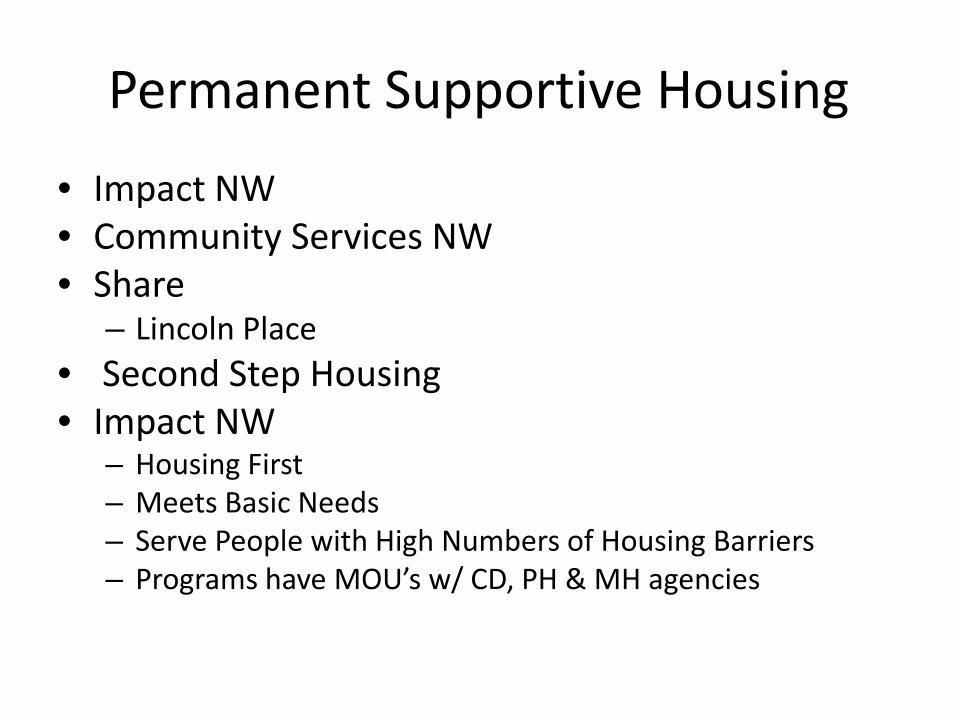
Permanent Supportive Housing
• Impact NW • Community Services NW • Share
– Lincoln Place • Second Step Housing • Impact NW
– Housing First – Meets Basic Needs – Serve People with High Numbers of Housing Barriers – Programs have MOU’s w/ CD, PH & MH agencies
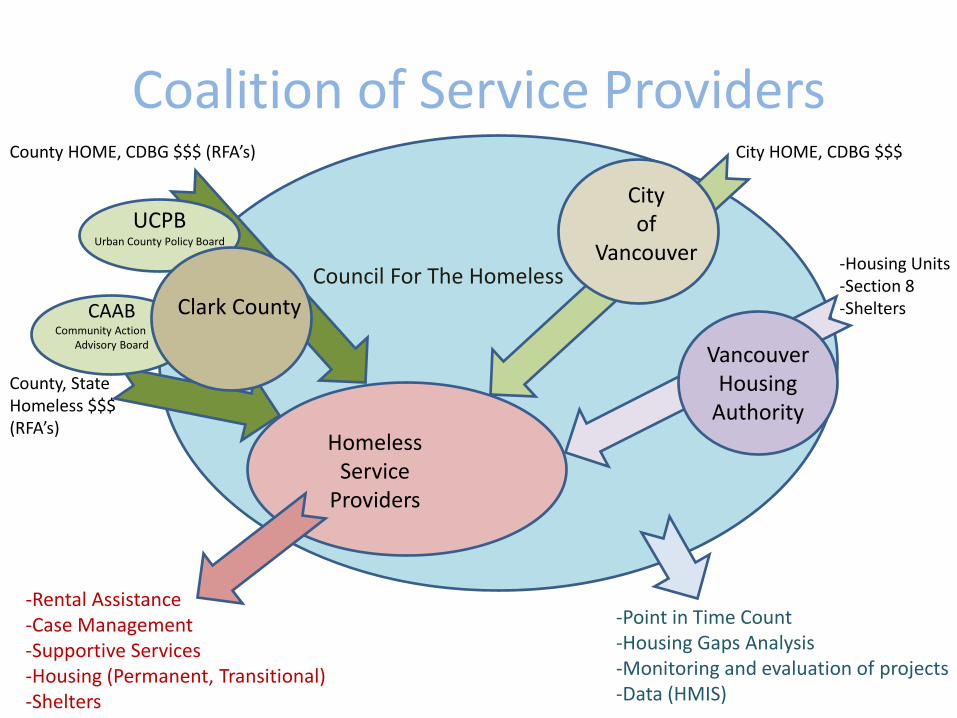
Coalition of Service Providers
City of
Vancouver
Vancouver Housing
Authority Homeless
Service Providers
UCPB Urban County Policy Board
CAAB Community Action n
Advisory Board
Clark County
County HOME, CDBG $$$ (RFA’s) City HOME, CDBG $$$
County, State Homeless $$$ (RFA’s)
-Housing Units -Section 8 -Shelters
Council For The Homeless
-Rental Assistance -Case Management -Supportive Services -Housing (Permanent, Transitional) -Shelters
-Point in Time Count -Housing Gaps Analysis -Monitoring and evaluation of projects -Data (HMIS)
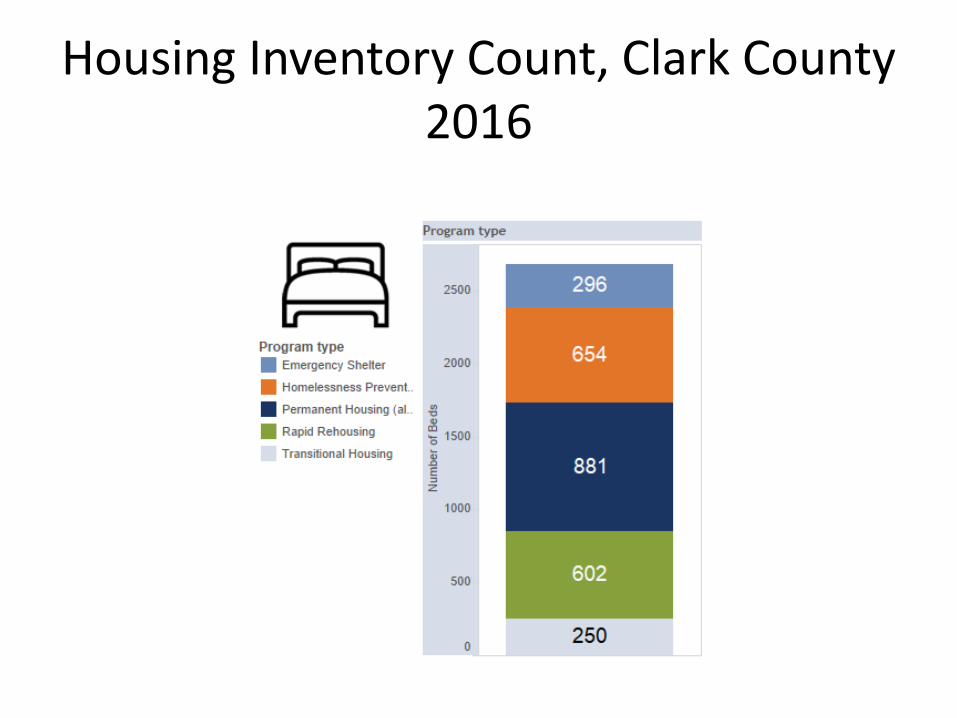
Housing Inventory Count, Clark County 2016
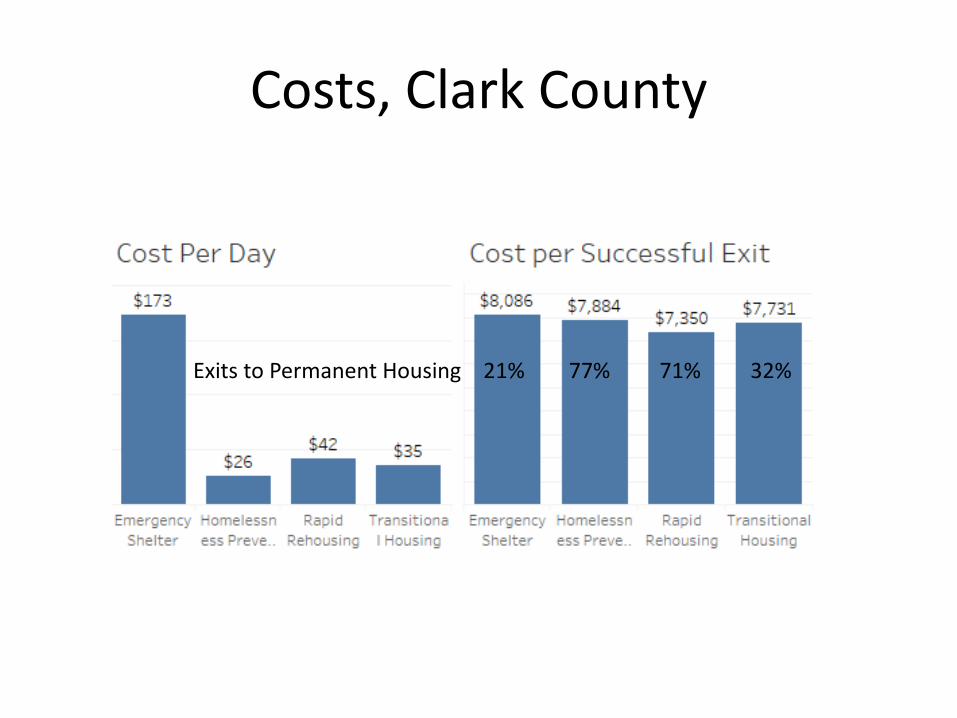
Costs, Clark County
Exits to Permanent Housing 21% 77% 71% 32%
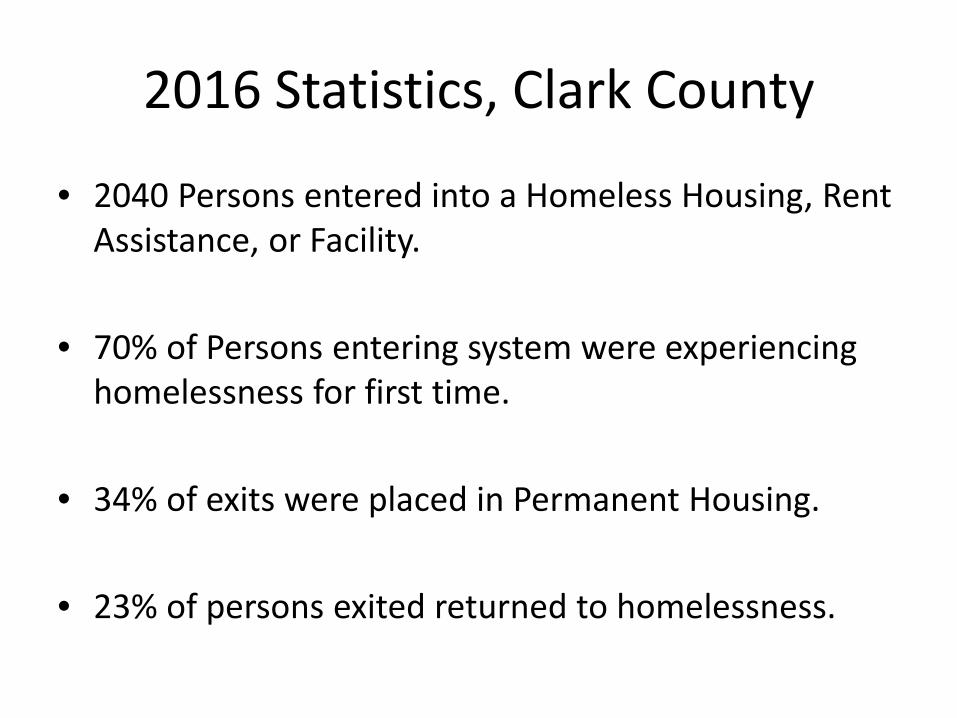
2016 Statistics, Clark County
• 2040 Persons entered into a Homeless Housing, Rent Assistance, or Facility.
• 70% of Persons entering system were experiencing
homelessness for first time. • 34% of exits were placed in Permanent Housing. • 23% of persons exited returned to homelessness.
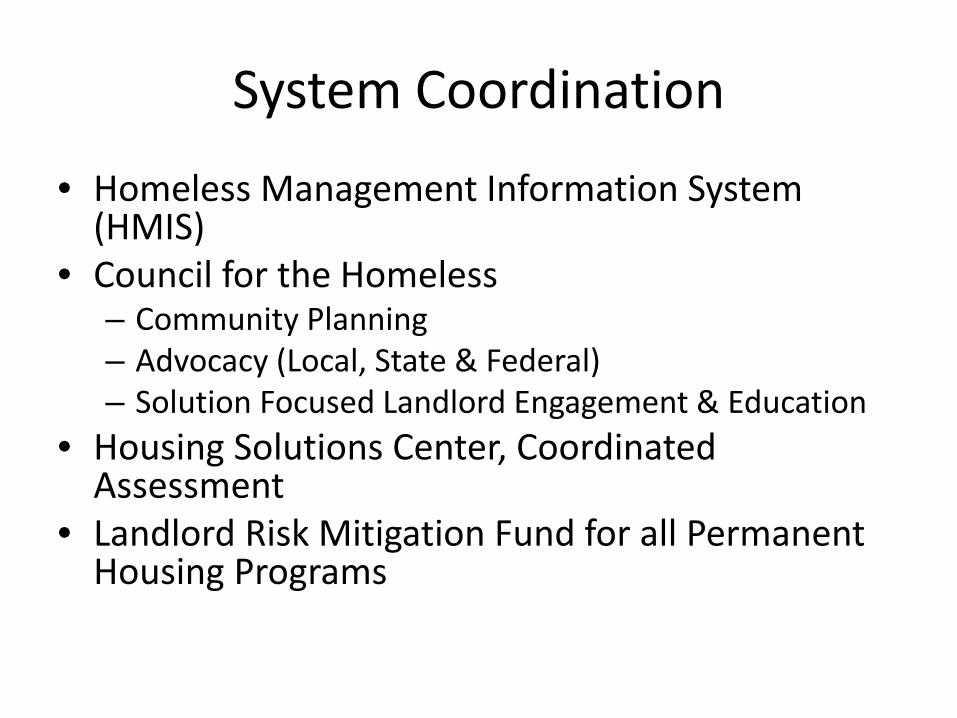
System Coordination
• Homeless Management Information System (HMIS)
• Council for the Homeless – Community Planning – Advocacy (Local, State & Federal) – Solution Focused Landlord Engagement & Education
• Housing Solutions Center, Coordinated Assessment
• Landlord Risk Mitigation Fund for all Permanent Housing Programs
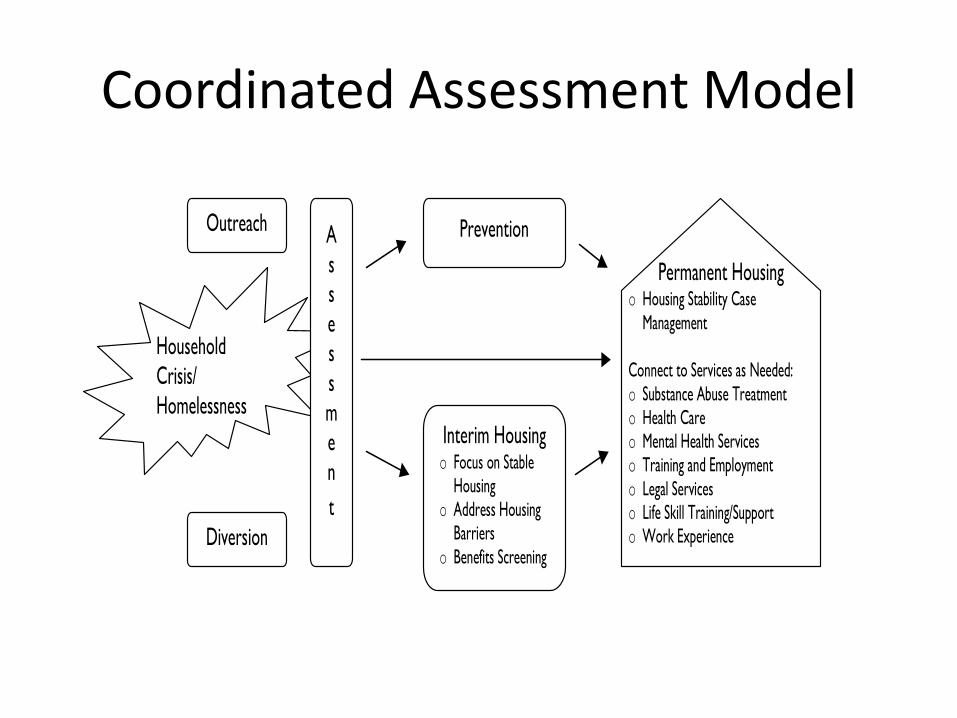
Coordinated Assessment Model
Prevention
Household Crisis/ Homelessness
Interim Housing o Focus on Stable
Housing o Address Housing
Barriers o Benefits Screening
Permanent Housing o Housing Stability Case
Management Connect to Services as Needed: o Substance Abuse Treatment o Health Care o Mental Health Services o Training and Employment o Legal Services o Life Skill Training/Support o Work Experience
A s s e s s m e n t
Diversion
Outreach
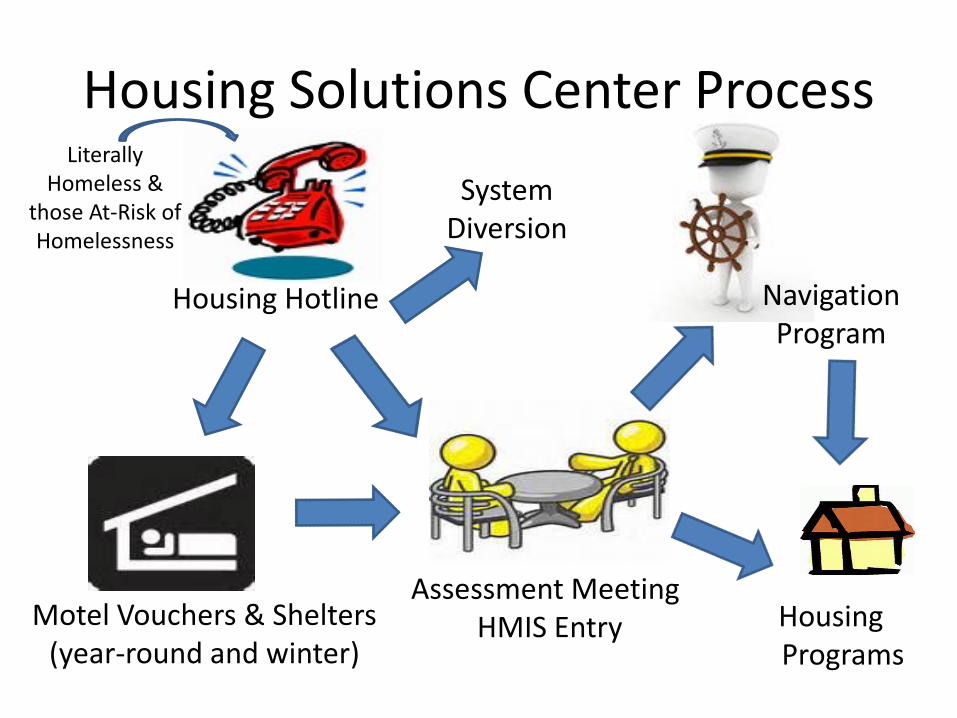
Housing Solutions Center Process
Motel Vouchers & Shelters (year-round and winter)
Housing Hotline
Assessment Meeting HMIS Entry
Navigation Program
Literally Homeless &
those At-Risk of Homelessness
Housing Programs
System Diversion
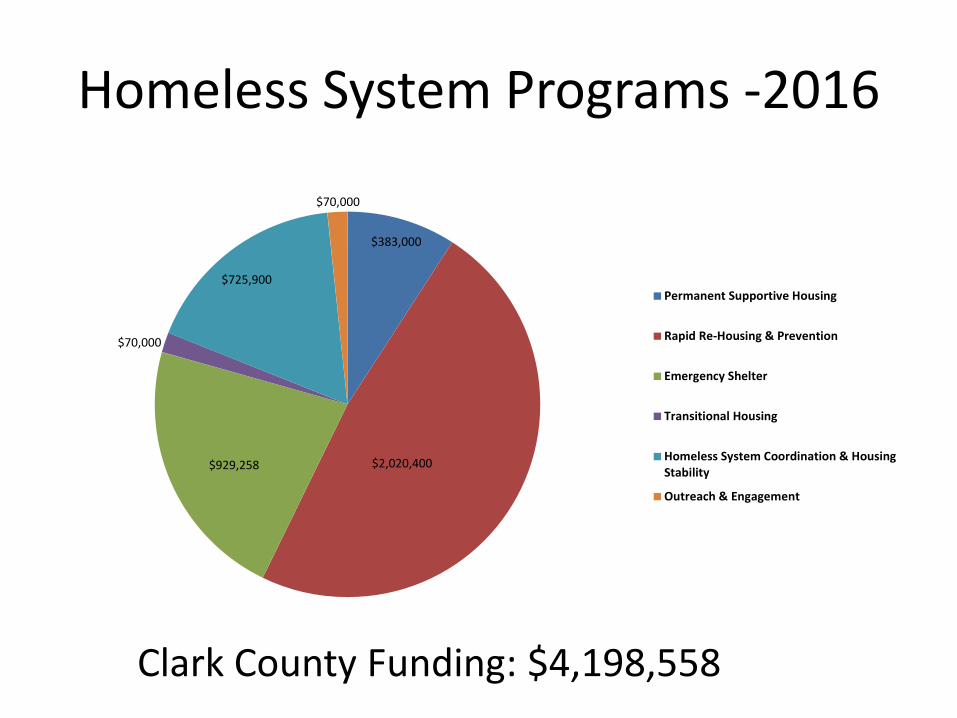
Homeless System Programs -2016
Clark County Funding: $4,198,558
$383,000
$2,020,400 $929,258
$70,000
$725,900
$70,000
Permanent Supportive Housing
Rapid Re-Housing & Prevention
Emergency Shelter
Transitional Housing
Homeless System Coordination & HousingStability
Outreach & Engagement
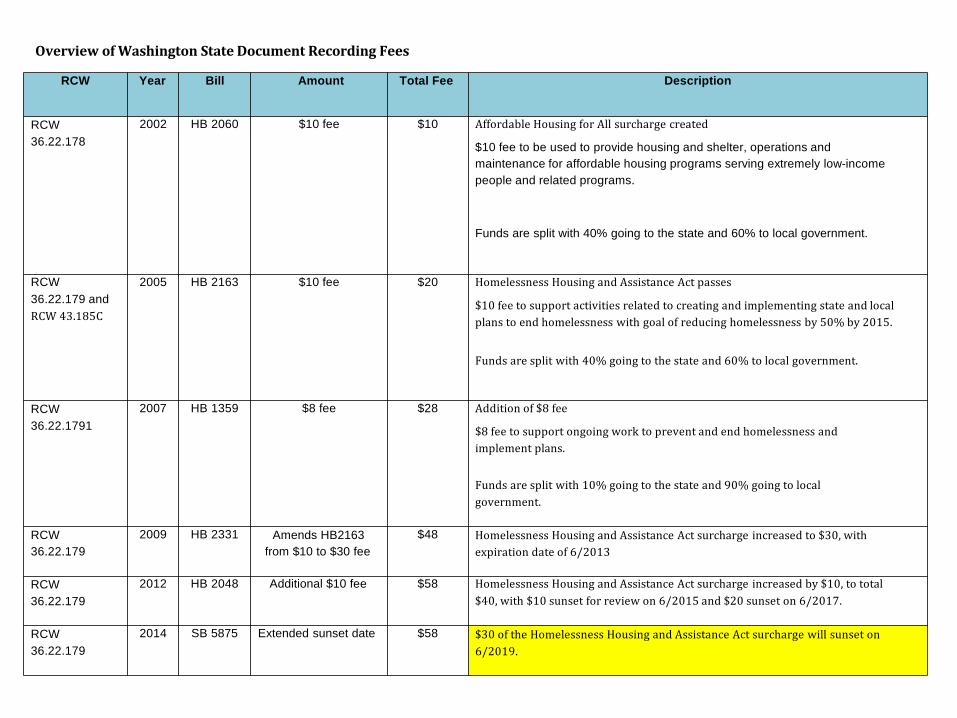
Overview of Washington State Document Recording Fees
RCW Year Bill Amount Total Fee Description
RCW 36.22.178
2002 HB 2060 $10 fee $10 Affordable Housing for All surcharge created
$10 fee to be used to provide housing and shelter, operations and maintenance for affordable housing programs serving extremely low-income people and related programs.
Funds are split with 40% going to the state and 60% to local government.
RCW 36.22.179 and RCW 43.185C
2005 HB 2163 $10 fee $20 Homelessness Housing and Assistance Act passes
$10 fee to support activities related to creating and implementing state and local plans to end homelessness with goal of reducing homelessness by 50% by 2015.
Funds are split with 40% going to the state and 60% to local government.
RCW 36.22.1791
2007 HB 1359 $8 fee $28 Addition of $8 fee
$8 fee to support ongoing work to prevent and end homelessness and implement plans.
Funds are split with 10% going to the state and 90% going to local government.
RCW 36.22.179
2009 HB 2331 Amends HB2163 from $10 to $30 fee
$48 Homelessness Housing and Assistance Act surcharge increased to $30, with expiration date of 6/2013
RCW 36.22.179
2012 HB 2048 Additional $10 fee $58 Homelessness Housing and Assistance Act surcharge increased by $10, to total $40, with $10 sunset for review on 6/2015 and $20 sunset on 6/2017.
RCW 36.22.179
2014 SB 5875 Extended sunset date $58 $30 of the Homelessness Housing and Assistance Act surcharge will sunset on 6/2019.
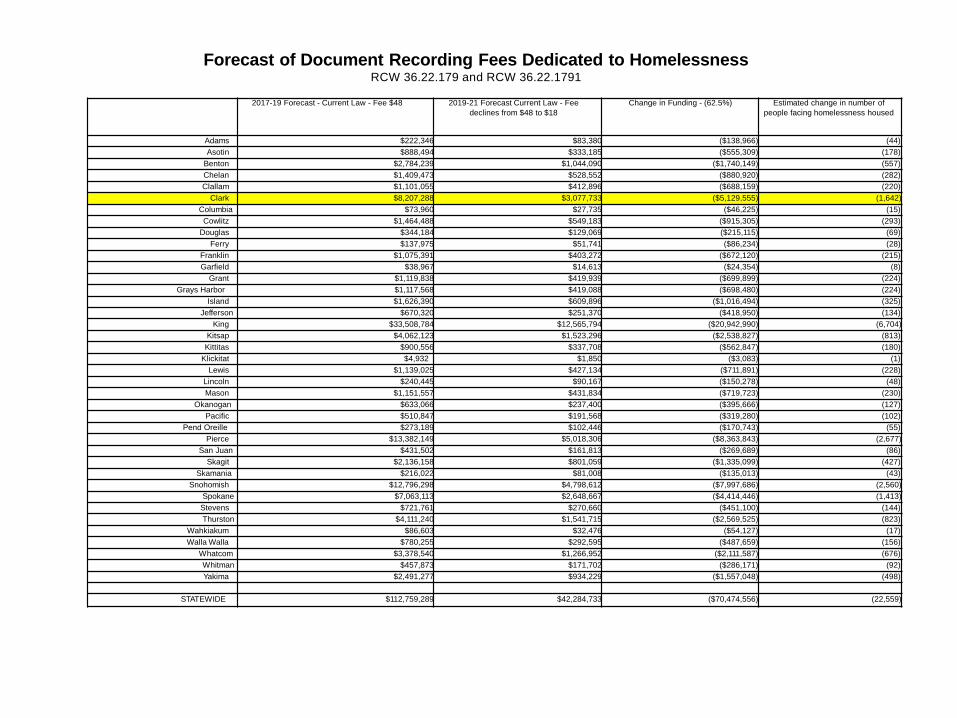
2017-19 Forecast - Current Law - Fee $48 2019-21 Forecast Current Law - Fee declines from $48 to $18
Change in Funding - (62.5%) Estimated change in number of people facing homelessness housed
Adams $222,346 $83,380 ($138,966) (44) Asotin $888,494 $333,185 ($555,309) (178)
Benton $2,784,239 $1,044,090 ($1,740,149) (557) Chelan $1,409,473 $528,552 ($880,920) (282) Clallam $1,101,055 $412,896 ($688,159) (220)
Clark $8,207,288 $3,077,733 ($5,129,555) (1,642) Columbia $73,960 $27,735 ($46,225) (15) Cowlitz $1,464,488 $549,183 ($915,305) (293)
Douglas $344,184 $129,069 ($215,115) (69) Ferry $137,975 $51,741 ($86,234) (28)
Franklin $1,075,391 $403,272 ($672,120) (215) Garfield $38,967 $14,613 ($24,354) (8)
Grant $1,119,838 $419,939 ($699,899) (224) Grays Harbor $1,117,568 $419,088 ($698,480) (224)
Island $1,626,390 $609,896 ($1,016,494) (325) Jefferson $670,320 $251,370 ($418,950) (134)
King $33,508,784 $12,565,794 ($20,942,990) (6,704) Kitsap $4,062,123 $1,523,296 ($2,538,827) (813) Kittitas $900,556 $337,708 ($562,847) (180)
Klickitat $4,932 $1,850 ($3,083) (1) Lewis $1,139,025 $427,134 ($711,891) (228)
Lincoln $240,445 $90,167 ($150,278) (48) Mason $1,151,557 $431,834 ($719,723) (230)
Okanogan $633,066 $237,400 ($395,666) (127) Pacific $510,847 $191,568 ($319,280) (102)
Pend Oreille $273,189 $102,446 ($170,743) (55) Pierce $13,382,149 $5,018,306 ($8,363,843) (2,677)
San Juan $431,502 $161,813 ($269,689) (86) Skagit $2,136,158 $801,059 ($1,335,099) (427)
Skamania $216,022 $81,008 ($135,013) (43) Snohomish $12,796,298 $4,798,612 ($7,997,686) (2,560)
Spokane $7,063,113 $2,648,667 ($4,414,446) (1,413) Stevens $721,761 $270,660 ($451,100) (144) Thurston $4,111,240 $1,541,715 ($2,569,525) (823)
Wahkiakum $86,603 $32,476 ($54,127) (17) Walla Walla $780,255 $292,595 ($487,659) (156)
Whatcom $3,378,540 $1,266,952 ($2,111,587) (676) Whitman $457,873 $171,702 ($286,171) (92) Yakima $2,491,277 $934,229 ($1,557,048) (498)
STATEWIDE $112,759,289 $42,284,733 ($70,474,556) (22,559)
Forecast of Document Recording Fees Dedicated to Homelessness RCW 36.22.179 and RCW 36.22.1791
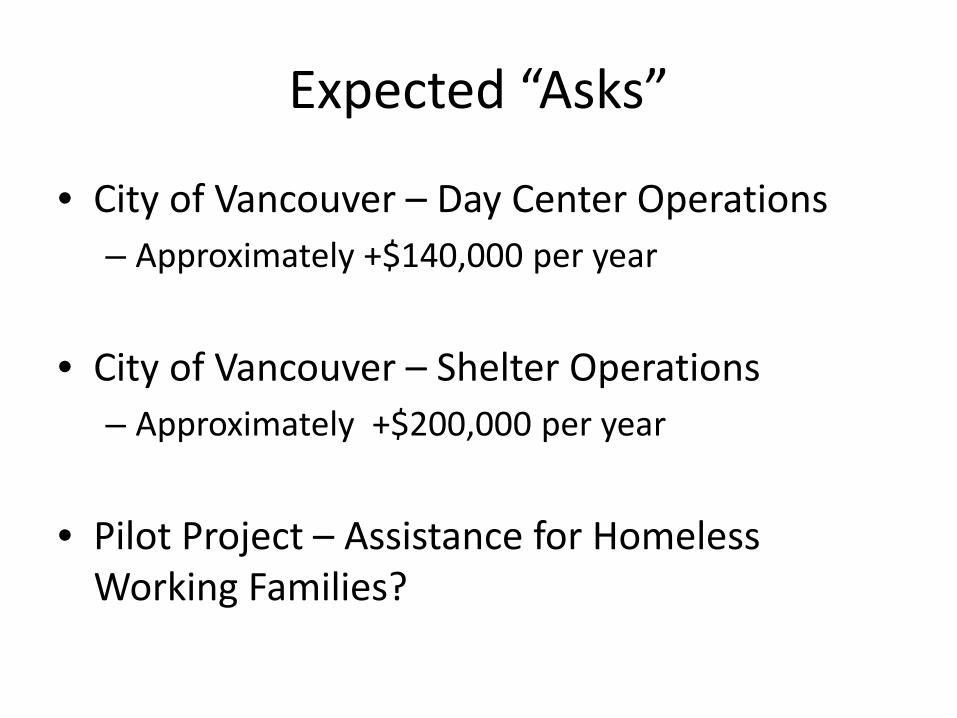
Expected “Asks”
• City of Vancouver – Day Center Operations – Approximately +$140,000 per year
• City of Vancouver – Shelter Operations – Approximately +$200,000 per year
• Pilot Project – Assistance for Homeless Working Families?