Embed Size (px)
Citation preview

Clarksons Platou Securities New York
April 6, 2016
Mark Mey, Executive Vice President and Chief Financial Officer
Legal Disclaimer
The statements described in this presentation that are not historical facts are forward-looking statements within the meaning of Section 27A of the Securities Act of 1933, as amended, and Section 21E of the Securities Exchange Act of 1934, as amended. These statements contain words such as "possible," "intend," "will," "if," "expect," or other similar expressions. Forward-looking statements are based on management’s current expectations and assumptions, and are subject to inherent uncertainties, risks and changes in circumstances that are difficult to predict. As a result, actual results could differ materially from those indicated in these forward-looking statements. Factors that could cause actual results to differ materially include, but are not limited to, statements involving prospects for the company, expected revenues, capital expenditures, costs and results of operations and contingencies and other factors discussed in the company's most recent Form 10-K for the year ended December 31, 2015 and in the company's other filings with the SEC, which are available free of charge on the SEC's website at www.sec.gov. Should one or more of these risks or uncertainties materialize, or should underlying assumptions prove incorrect, actual results may vary materially from those indicated. All subsequent written and oral forward-looking statements attributable to the company or to persons acting on our behalf are expressly qualified in their entirety by reference to these risks and uncertainties. You should not place undue reliance on forward-looking statements. Each forward-looking statement speaks only as of the date of the particular statement, and we undertake no obligation to publicly update or revise any forward-looking statements to reflect events or circumstances that occur, or which we become aware of, after the date hereof, except as otherwise may be required by law. Adjusted earnings is a non-GAAP financial measure and the reconciliation to the most comparative GAAP measure is displayed in quantitative schedules on the company’s website at www.deepwater.com.
This presentation is being issued pursuant to and in accordance with Rule 135 under the Securities Act of 1933, as amended. This presentation does not constitute an offer to sell, or a solicitation of an offer to buy, any securities, and it does not constitute an offering prospectus within the meaning of article 652a or article 1156 of the Swiss Code of Obligations. Investors must rely on their own evaluation of Transocean Ltd. and its securities, including the merits and risks involved. Nothing contained herein is, or shall be relied on as, a promise or representation as to the future performance of Transocean Ltd.
2
$0
$20
$40
$60
$80
$100
$120
$140
Jul-14 Oct-14 Jan-15 Apr-15 Jul-15 Oct-15 Jan-16
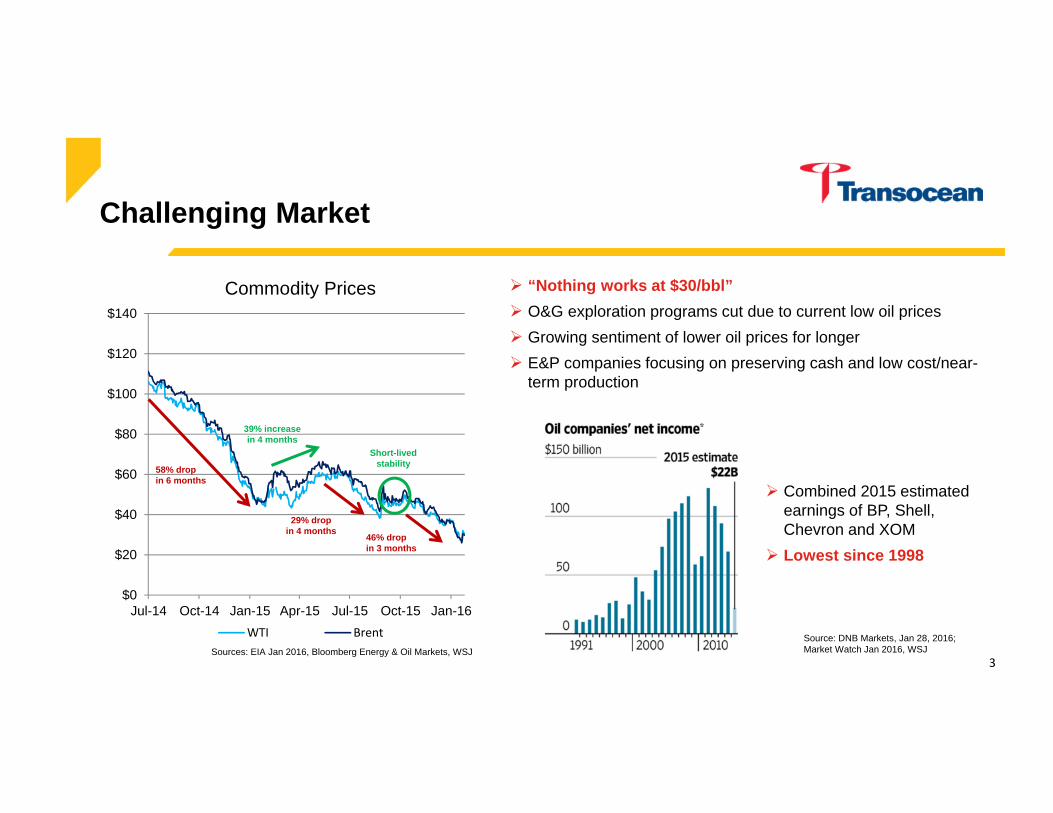
Commodity Prices
WTI Brent
“Nothing works at $30/bbl” O&G exploration programs cut due to current low oil prices Growing sentiment of lower oil prices for longer E&P companies focusing on preserving cash and low cost/near-
term production
58% dropin 6 months
39% increasein 4 months
29% dropin 4 months
Sources: EIA Jan 2016, Bloomberg Energy & Oil Markets, WSJ
Short-lived stability
46% dropin 3 months
Challenging Market
Combined 2015 estimated earnings of BP, Shell, Chevron and XOM
Lowest since 1998
Source: DNB Markets, Jan 28, 2016; Market Watch Jan 2016, WSJ
3
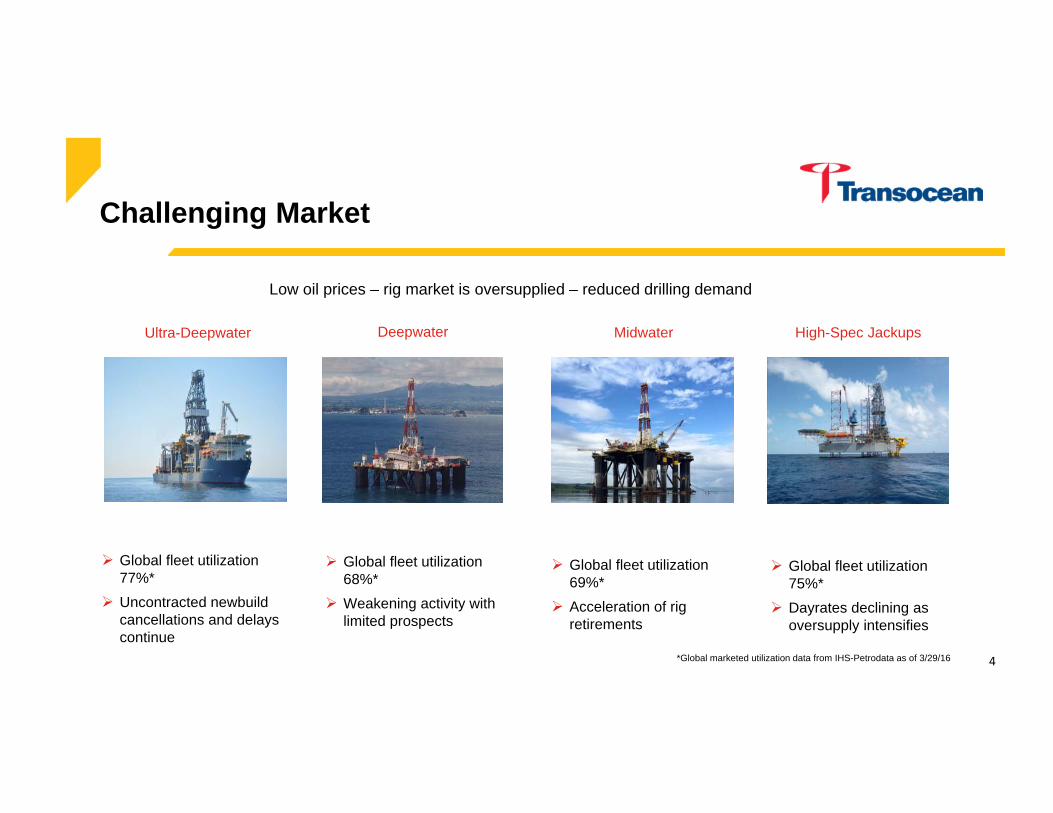
Low oil prices – rig market is oversupplied – reduced drilling demand
Challenging Market
Ultra-Deepwater
Global fleet utilization 77%*
Uncontracted newbuild cancellations and delays continue
Deepwater
Global fleet utilization 68%*
Weakening activity with limited prospects
Midwater
Global fleet utilization 69%*
Acceleration of rig retirements
High-Spec Jackups
Global fleet utilization 75%*
Dayrates declining as oversupply intensifies
*Global marketed utilization data from IHS-Petrodata as of 3/29/16 4
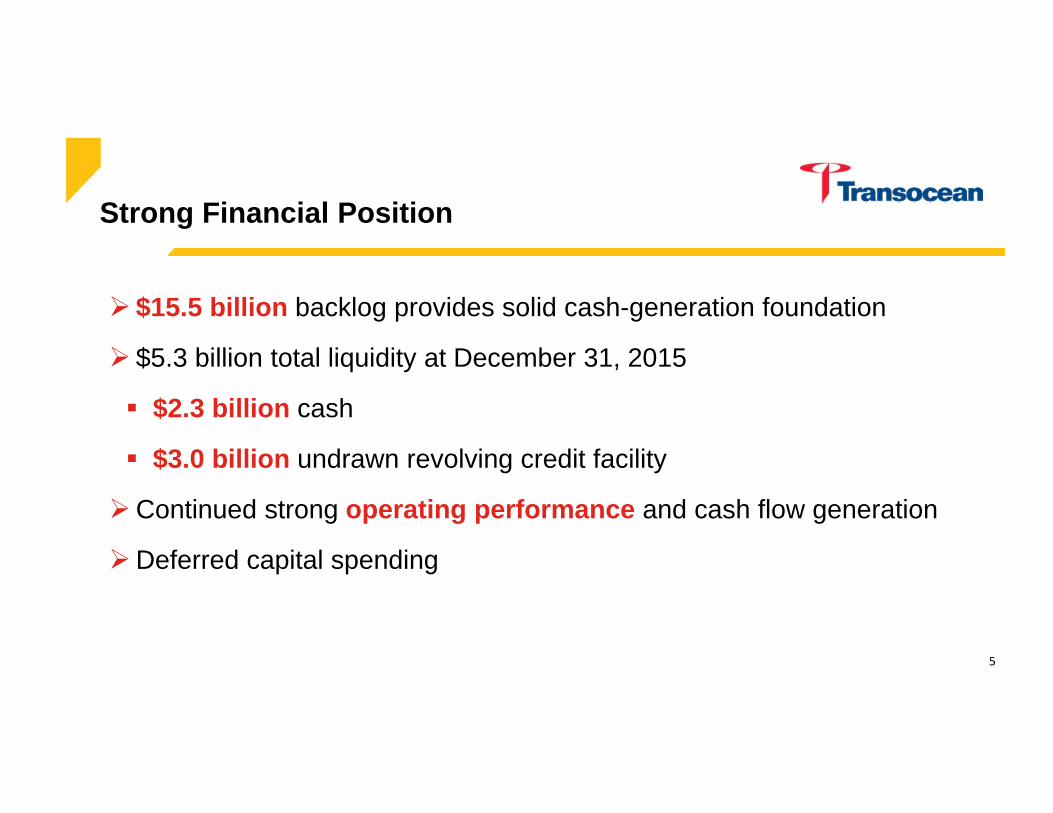
Strong Financial Position
$15.5 billion backlog provides solid cash-generation foundation
$5.3 billion total liquidity at December 31, 2015
$2.3 billion cash
$3.0 billion undrawn revolving credit facility
Continued strong operating performance and cash flow generation
Deferred capital spending
5
0.3 0.1 0.1
0.4
0.1 0.1
0.4
0.3 0.10.1
2.3
2.1
1.7
1.4
6.0
0.4
0.0
1.0
2.0
3.0
4.0
5.0
6.0
7.0
2016 2017 2018 2019 2020-28
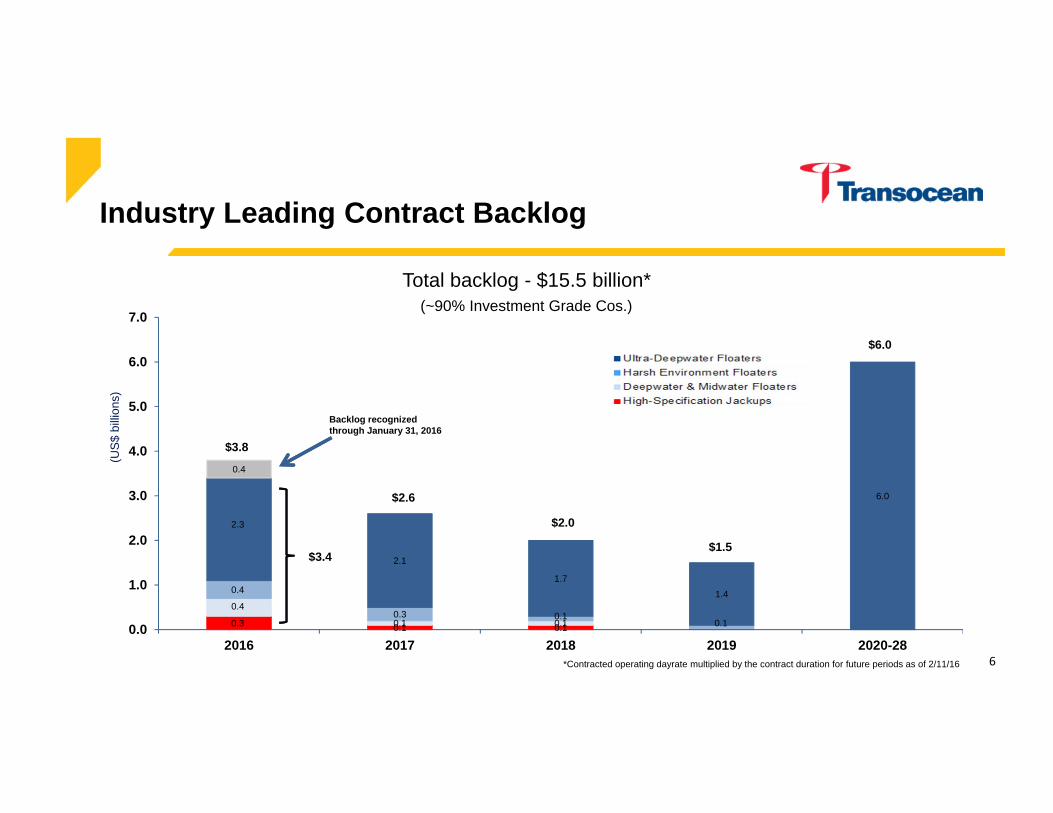
Industry Leading Contract Backlog
*Contracted operating dayrate multiplied by the contract duration for future periods as of 2/11/16
Backlog recognized through January 31, 2016
$3.4
$3.8
(US$
billi
ons)
6
Total backlog - $15.5 billion*
$2.6
$2.0
$1.5
$6.0
(~90% Investment Grade Cos.)
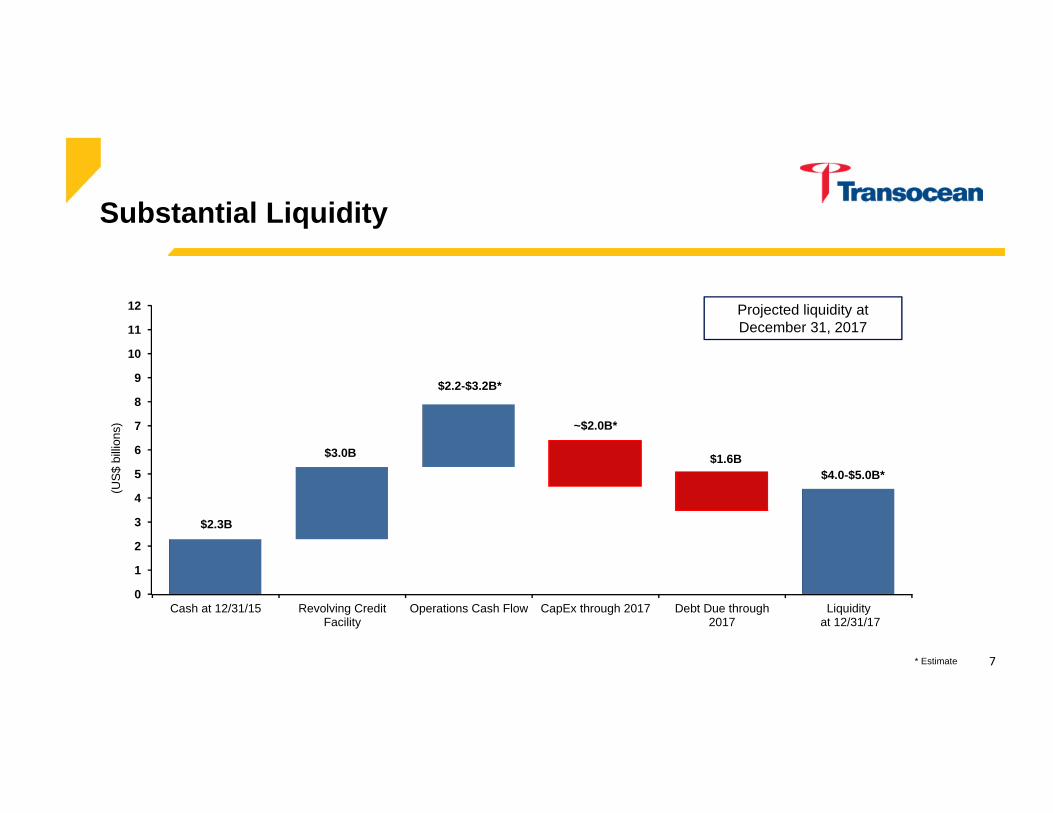
Substantial Liquidity
0
1
2
3
4
5
6
7
8
9
10
11
12
Cash at 12/31/15 Revolving CreditFacility
Operations Cash Flow CapEx through 2017 Debt Due through2017
Liquidity at 12/31/17
(US$
billi
ons)
$2.3B
Projected liquidity at December 31, 2017
* Estimate
$3.0B
$2.2-$3.2B*
~$2.0B*
$1.6B$4.0-$5.0B*
7
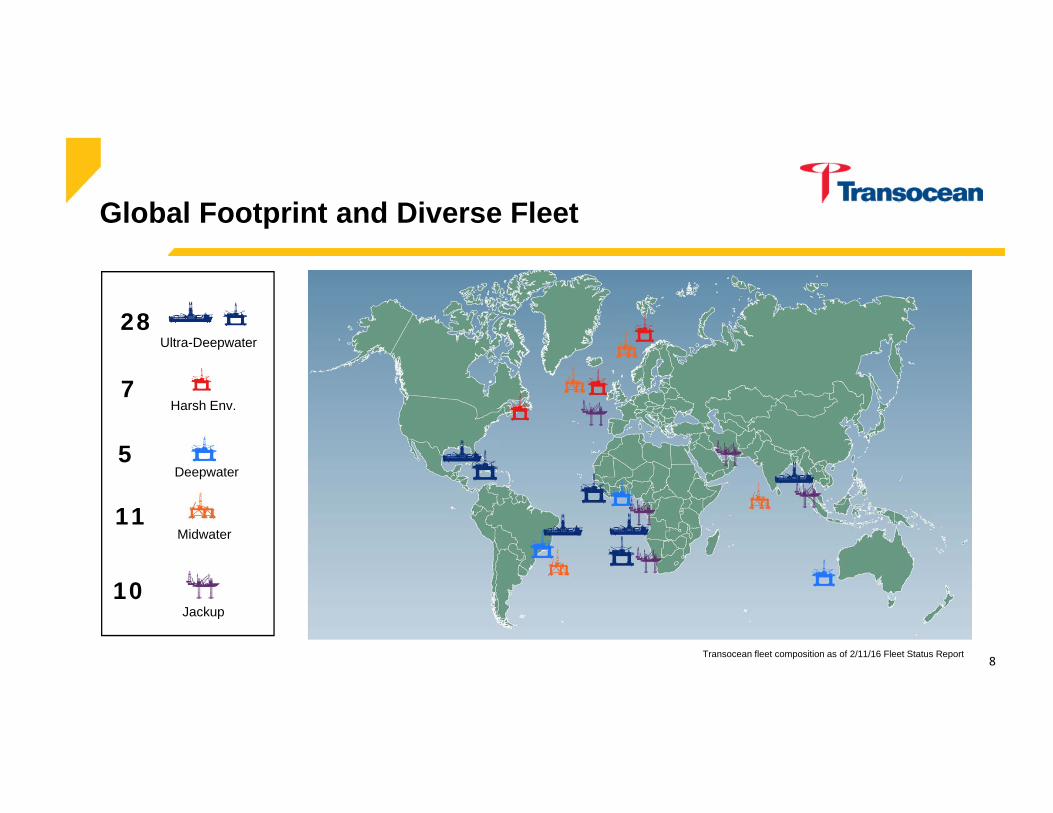
Global Footprint and Diverse Fleet
Ultra-Deepwater
Harsh Env.
Deepwater
Midwater
Jackup
28
7
11
10
Transocean fleet composition as of 2/11/16 Fleet Status Report
5
8
Extensive Customer Network
9
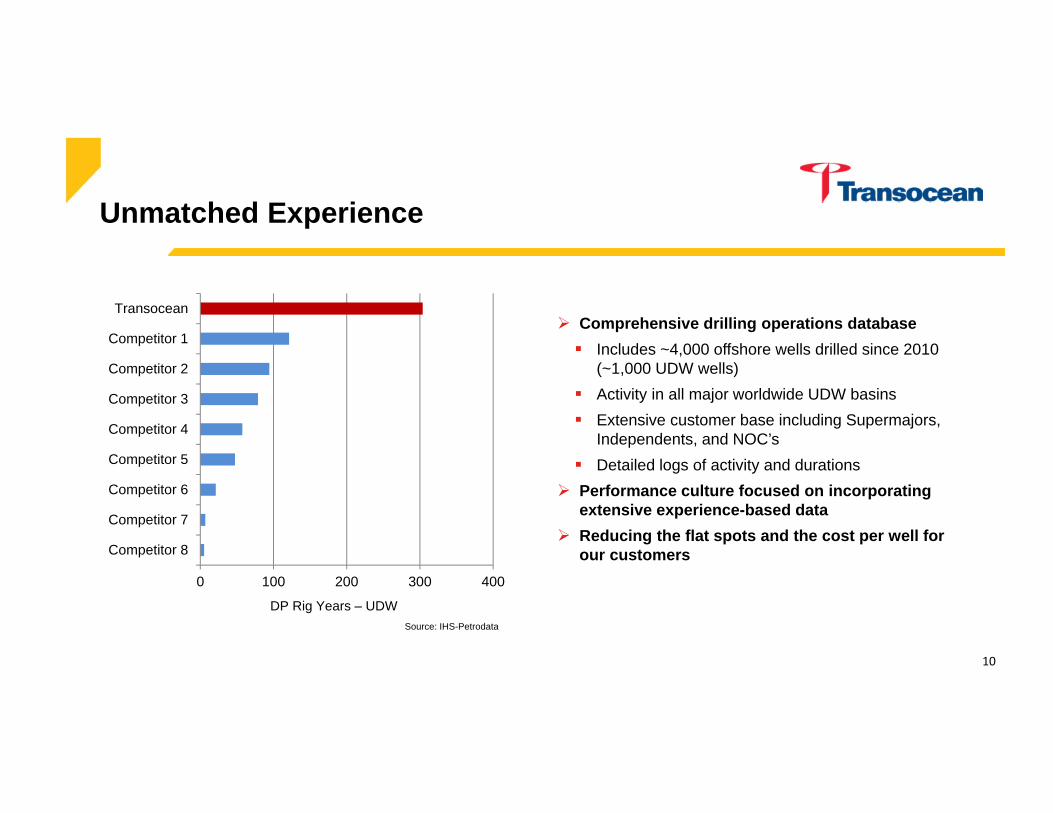
Unmatched Experience
Comprehensive drilling operations database Includes ~4,000 offshore wells drilled since 2010
(~1,000 UDW wells) Activity in all major worldwide UDW basins Extensive customer base including Supermajors,
Independents, and NOC’s Detailed logs of activity and durations
Performance culture focused on incorporating extensive experience-based data
Reducing the flat spots and the cost per well for our customers
Source: IHS-Petrodata
10
0 100 200 300 400
Competitor 8
Competitor 7
Competitor 6
Competitor 5
Competitor 4
Competitor 3
Competitor 2
Competitor 1
Transocean
DP Rig Years – UDW

Using Crew Data to Improve Drilling PerformanceEfficiency Tracking and Analysis
<Rig Name> <Report Date Range><Well Name>
Tripping In (Ft/Hr)
Group Type Feet Hours Ft / Hr
B-3 62,073.00 20.50 3,028
C-3 37,694.00 15.50 2,432
E-3 56,066.00 21.00 2,670
F-3 7,752.00 3.00 2,584
Tripping Out (Ft/Hr)
Group Type Feet Hours Ft / Hr
B-3 25,713.00 8.50 3,025
C-3 72,293.00 25.00 2,892
E-3 44,592.00 16.00 2,787
F-3 38,662.00 13.50 2,864
Tripping performance running speeds in ft/hr for the rig during the time period. Use GMS data
Efficiency Tracking and Analysis<Rig Name> <Report Date Range><Well Name>
Operations breakdown for the reporting time period – day/week/month/well. Only GMS data required for this report. Can include additional activity breakdown – i.e. Code 6 – Trip in – Trip out
2 ‐ Drill Actual 55
3 ‐ Reaming 1.5
5 ‐ Condition Mud and Circulate
11.5
6 ‐ Trips 39.5
9 ‐ Cut Off Drilling Line
3.5
12 ‐ Run Casing and Cement
8
15 ‐ Test BOP 1
11
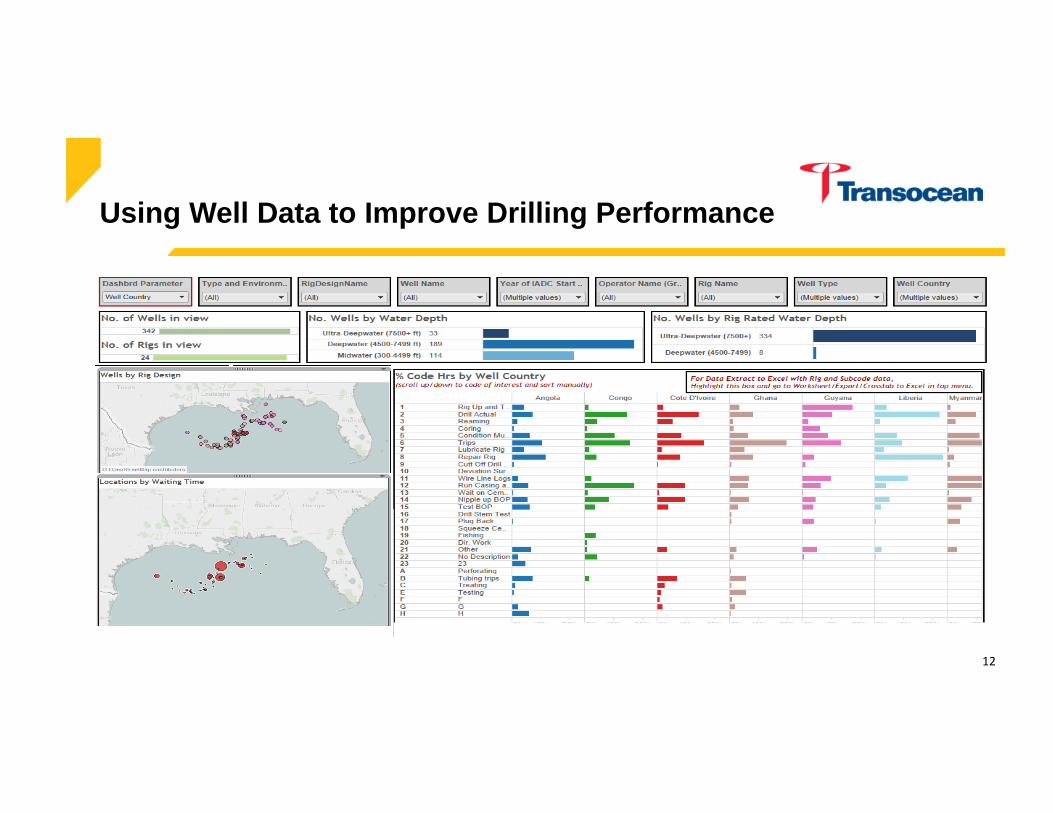
Using Well Data to Improve Drilling Performance
12
13
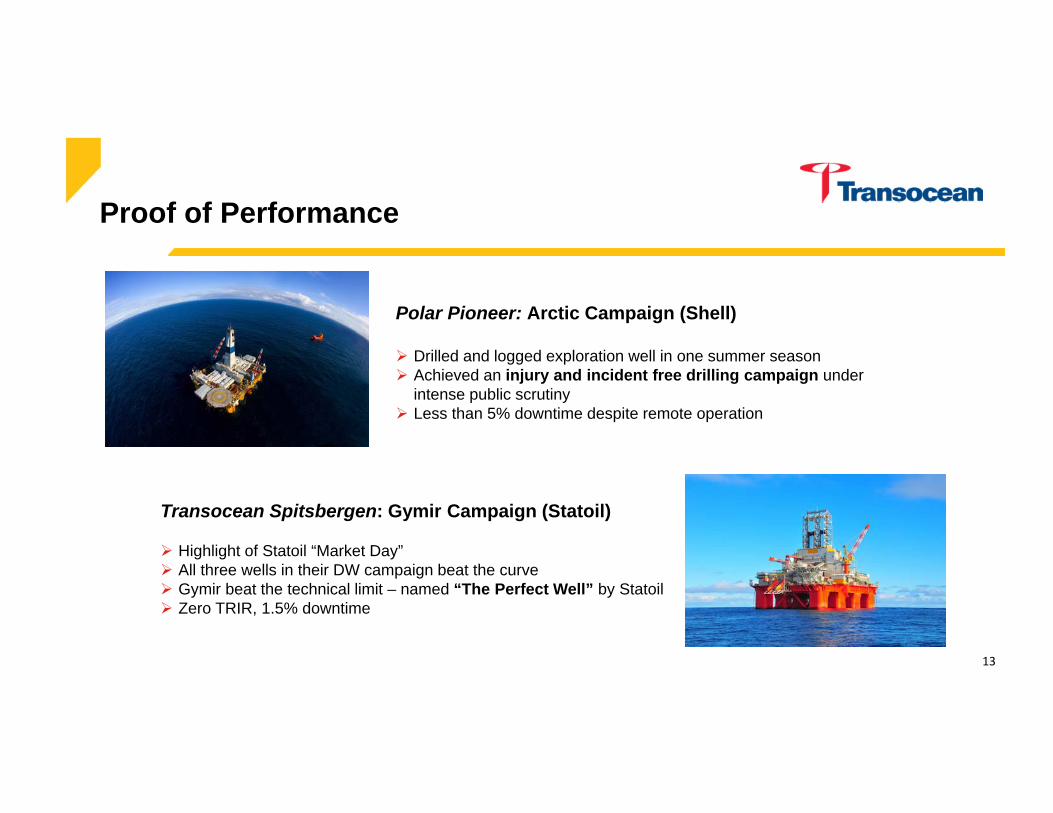
Proof of Performance
Polar Pioneer: Arctic Campaign (Shell)
Drilled and logged exploration well in one summer season Achieved an injury and incident free drilling campaign under
intense public scrutiny Less than 5% downtime despite remote operation
Transocean Spitsbergen: Gymir Campaign (Statoil)
Highlight of Statoil “Market Day” All three wells in their DW campaign beat the curve Gymir beat the technical limit – named “The Perfect Well” by Statoil Zero TRIR, 1.5% downtime
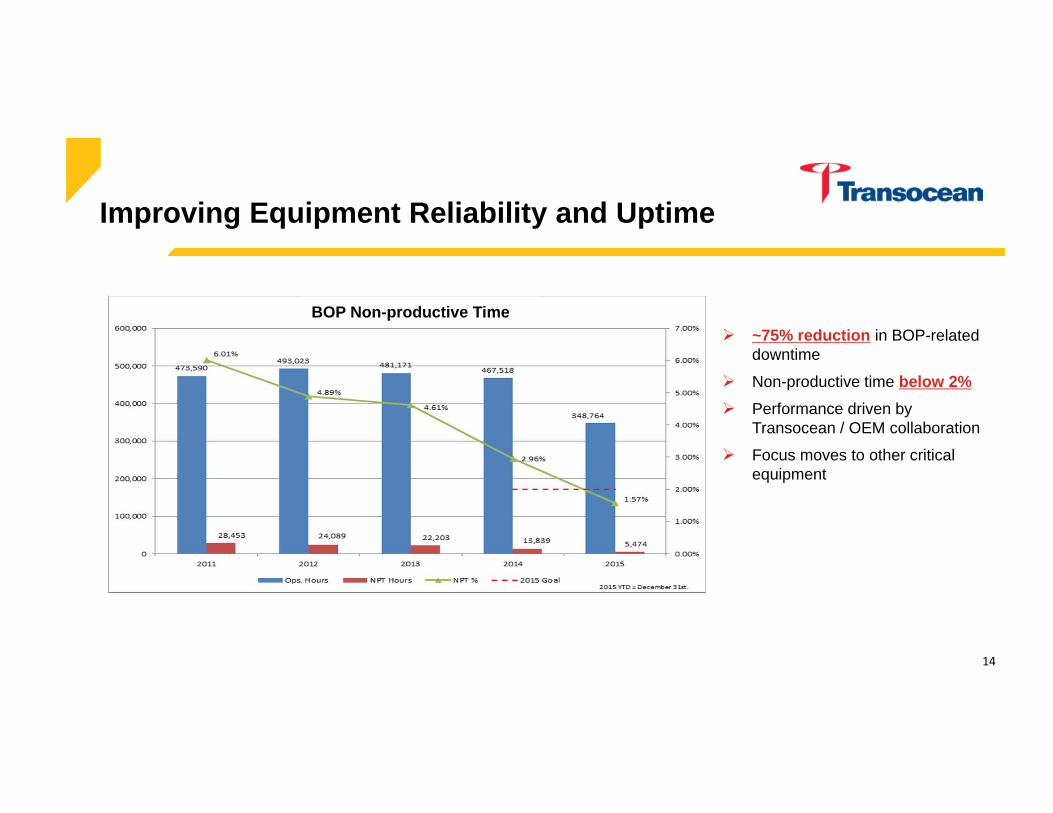
~75% reduction in BOP-related downtime
Non-productive time below 2% Performance driven by
Transocean / OEM collaboration
Focus moves to other critical equipment
Improving Equipment Reliability and Uptime
14
BOP Non-productive Time
Proof of Performance
70%
75%
80%
85%
90%
95%
100%
1Q14 2Q14 3Q14 4Q14 1Q15 2Q15 3Q15 4Q15
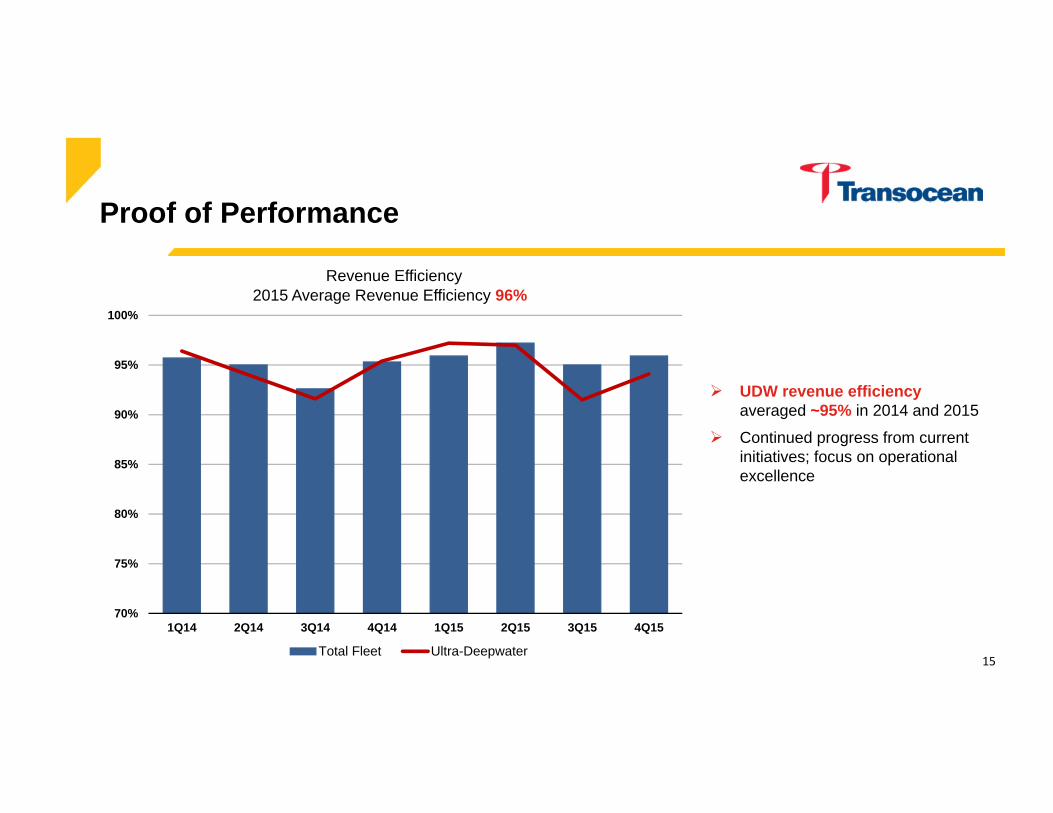
Revenue Efficiency
Total Fleet Ultra-Deepwater
2015 Average Revenue Efficiency 96%
15
UDW revenue efficiency averaged ~95% in 2014 and 2015
Continued progress from current initiatives; focus on operational excellence
0
500
1000
1500
2000
2500
3000
0 5 10 15 20 25 30 35
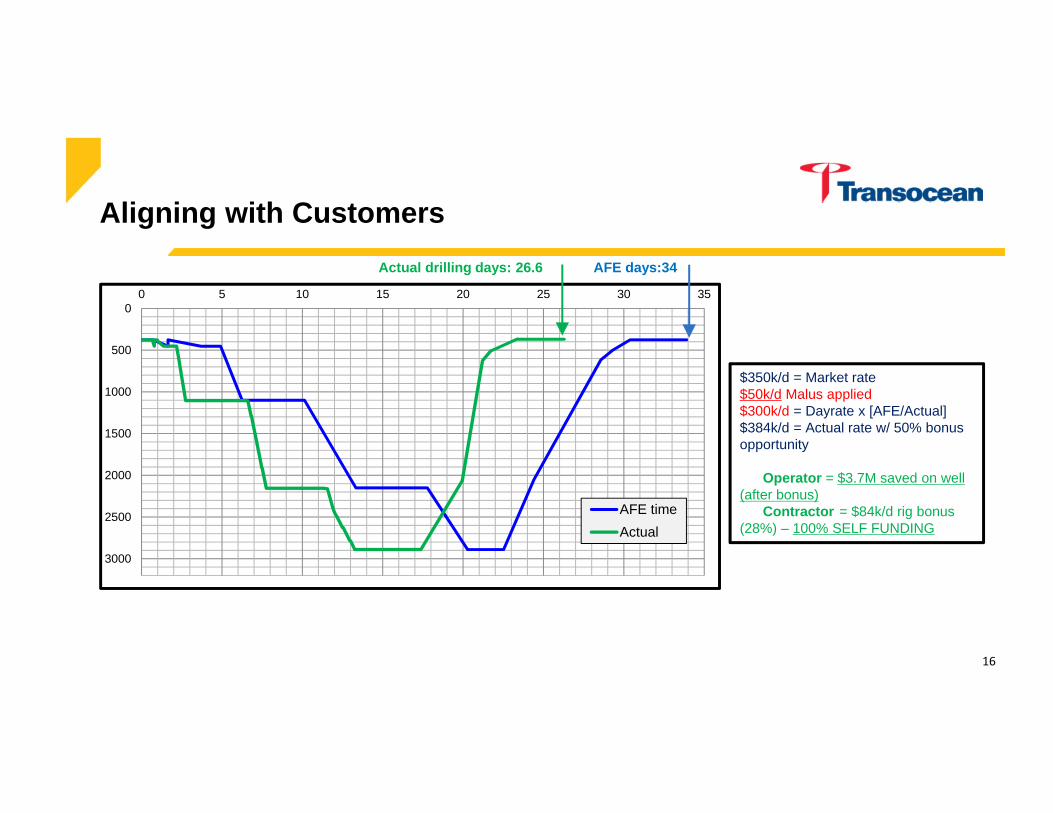
AFE timeActual
AFE days:34Actual drilling days: 26.6
$350k/d = Market rate$50k/d Malus applied$300k/d = Dayrate x [AFE/Actual] $384k/d = Actual rate w/ 50% bonus opportunity
Operator = $3.7M saved on well (after bonus)
Contractor = $84k/d rig bonus (28%) – 100% SELF FUNDING
Aligning with Customers
16
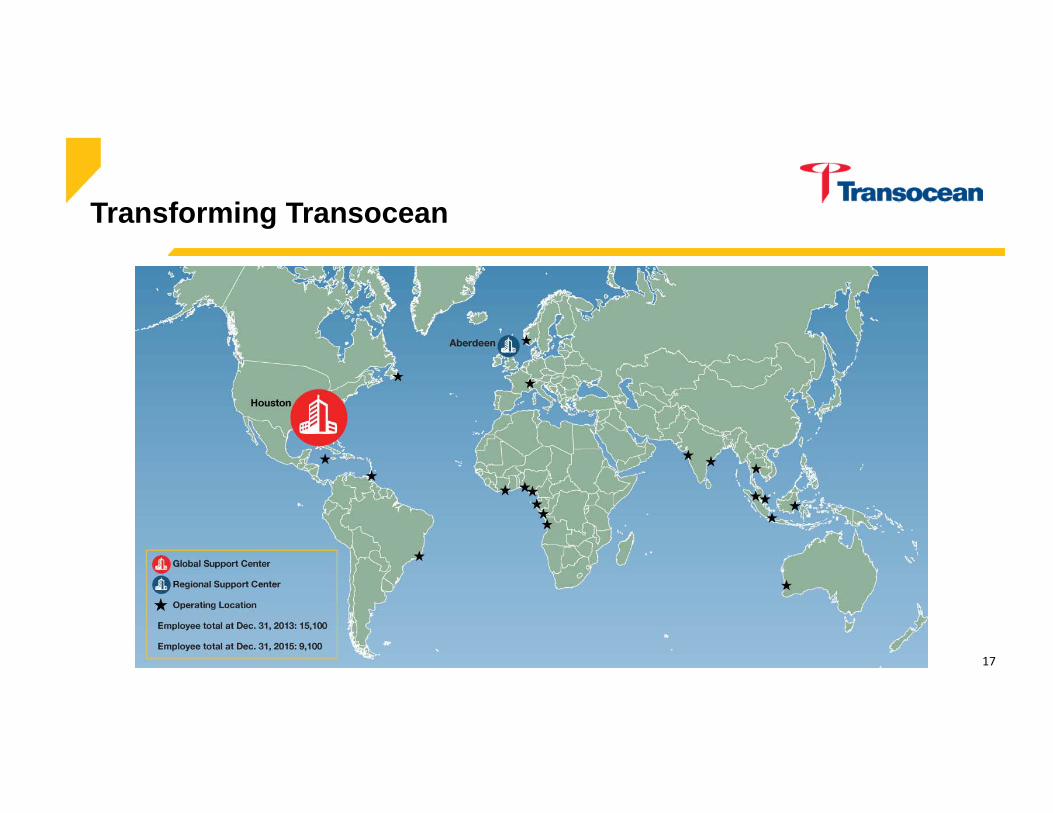
Transforming Transocean
17

Riser Inspection and Repair Costs: Reduced 25% per joint from 2014
18
Implementing Innovative Cost-Saving Solutions
Rig Out of Service Time and Cost: Reduced 60% from 2013
DP Stacking Costs: Reduced to <$20k/day/rig
Proof of Performance
10%
20%
30%
40%
50%
60%
70%
0
600
1,200
1,800
2,400
3,000
1Q14 2Q14 3Q14 4Q14 1Q15 2Q15 3Q15 4Q15
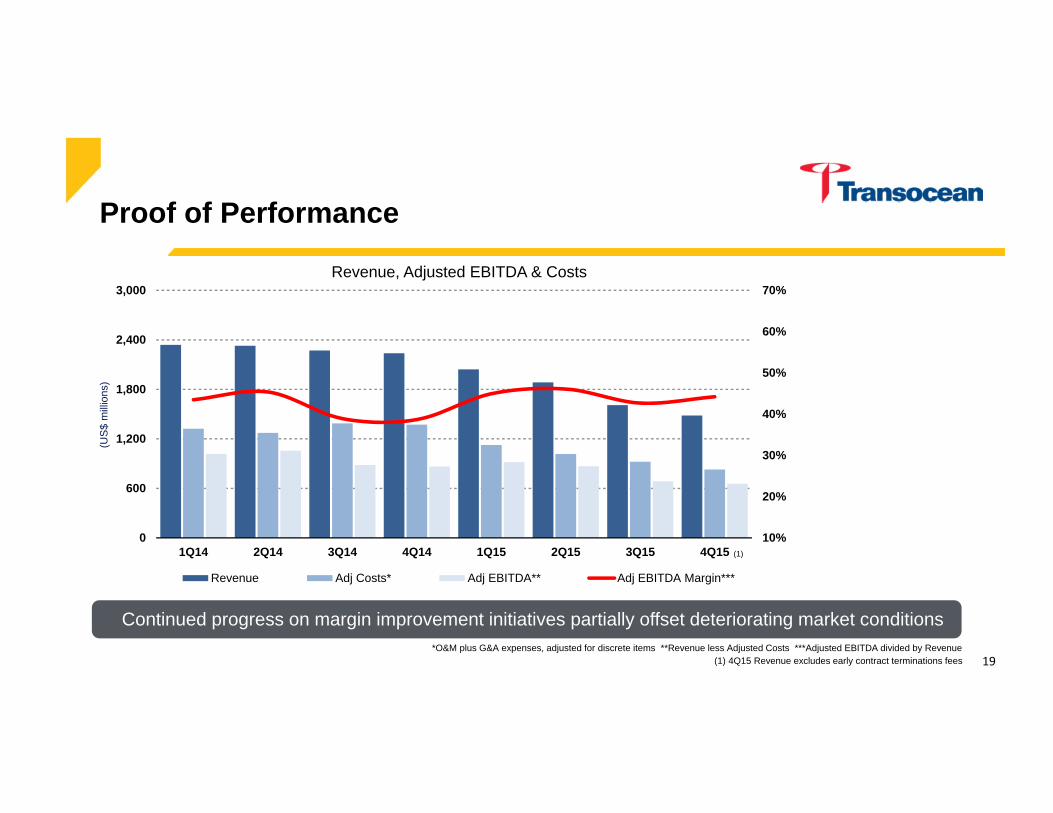
Revenue, Adjusted EBITDA & Costs
Revenue Adj Costs* Adj EBITDA** Adj EBITDA Margin***
Continued progress on margin improvement initiatives partially offset deteriorating market conditions*O&M plus G&A expenses, adjusted for discrete items **Revenue less Adjusted Costs ***Adjusted EBITDA divided by Revenue
(US
$ m
illio
ns)
19
(1)
(1) 4Q15 Revenue excludes early contract terminations fees
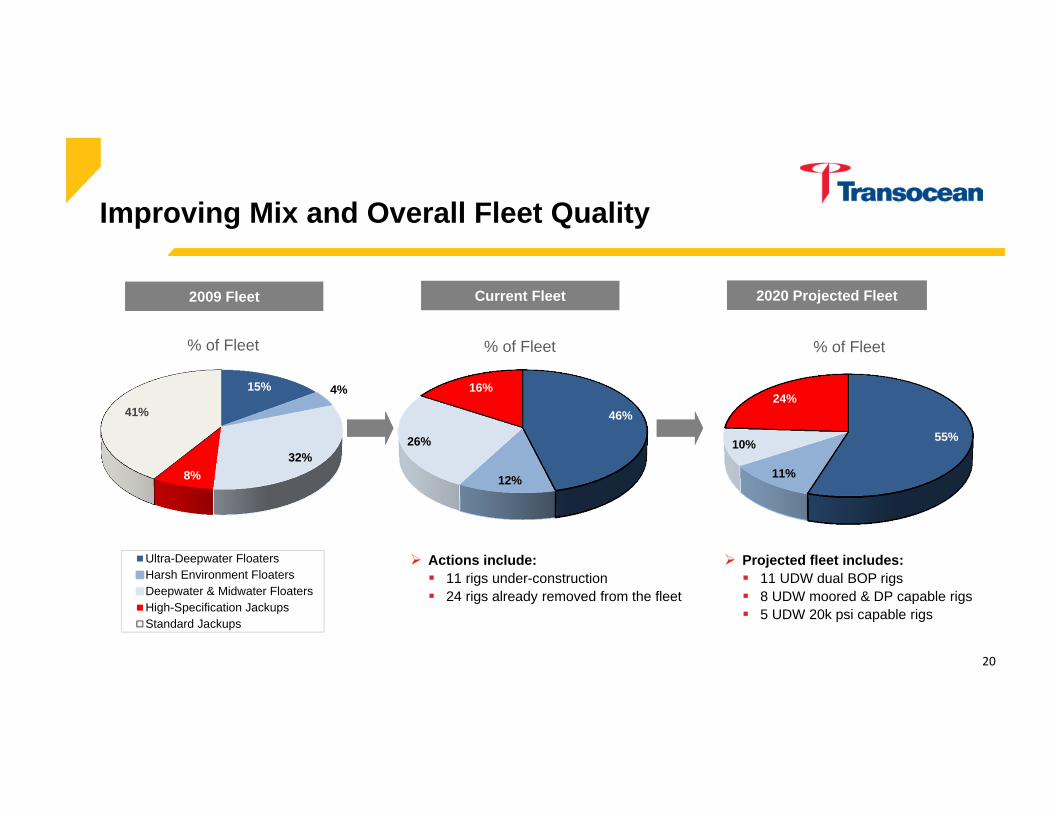
Projected fleet includes: 11 UDW dual BOP rigs 8 UDW moored & DP capable rigs 5 UDW 20k psi capable rigs
15% 4%
32%8%
41%
% of Fleet
Ultra-Deepwater FloatersHarsh Environment FloatersDeepwater & Midwater FloatersHigh-Specification JackupsStandard Jackups
46%
12%
26%
16%
% of Fleet
55%
11%
10%
24%
% of Fleet
2020 Projected Fleet2020 Projected FleetCurrent FleetCurrent Fleet
Improving Mix and Overall Fleet Quality
2009 Fleet2009 Fleet
20
Actions include: 11 rigs under-construction 24 rigs already removed from the fleet
The Path Forward
Transocean will: Actively manage capital structure and liquidity Deliver the safest, most efficient drilling services Continue to focus on producing strong operating results through:
o Strengthening customer relationshipso Delivering best-in-class uptime and revenue efficiencyo Streamlining every element of the business High grade and reposition the worldwide fleet for the industry recovery
Transocean will build upon its position as the industry’s leading offshore driller
21

Clarksons Platou Securities New York
April 6, 2016
Mark Mey, Executive Vice President and Chief Financial Officer