Embed Size (px)
Citation preview
8/12/2019 Class Voting 13 May
http://slidepdf.com/reader/full/class-voting-13-may 1/55
May 13, 2013
Class Voting in Latin America
Mariano Torcal, Scott Mainwaring, and Nicolás M. Somma*
Class voting has been an issue of long-standing interest to sociologists and political
scientists (Alford 1963; Bartolini 2000; Clark et al. 1993; Clark and Lipset 1991 and 2001;
Evans 1999a; Evans et al. 1991 and 1999; Franklin 1992; Heath et al. 1985; Hout et al. 1993
and 1995; Kelley et al. 1985; Knutsen 2004 and 2005; Manza and Brooks 1999; Nieuwbeerta
1995 and 2001; Nieuwbeerta and Ultee 1999; Weakliem 1989). With the resurgence of the
Latin American left since the election of Hugo Chávez in 1998 and subsequent victories by
Rafael Correa in Ecuador (2006) and Evo Morales in Bolivia (2005), interest in this old subject
has rekindled. Yet oddly, and in stark contrast to the situation in Western Europe, there are few
published cross-national studies of class voting in Latin America. The existing broad, regional-
scope assessments about class politics in Latin America have predominantly aroused from
historical-comparative research (Dix 1989; Collier and Collier 1991; Coppedge 1998; Roberts
2002) concluding that class voting in the region has been historically weak compared to
Western Europe (Torcal and Mainwaring 2003b).
In this paper, we confirm this conclusion from preceding studies using a broad
comparative perspective with the LAPOP survey data. Additionally, we show that
despite this generally weak class voting, there are significant cross-national differences.
These national differences do not correspond to the classic sociological or socio-
economic structural explanations that linked social structure to class voting. We offer
some tentative alternative explanations about cross-national differences in class voting.
These explanations are connected with institutional factors (mostly with the
institutionalization of the party system) and political agency. This last one, as we expect
*
Please do not share or distribute this preliminary version of this paper beyond participants in the Vanderbilt conference. Krystin Krause and María Victoria De Negri
provided excellent research assistance.
1
8/12/2019 Class Voting 13 May
http://slidepdf.com/reader/full/class-voting-13-may 2/55
to show in further versions, tends to be much more unstable not producing the
anchoring effect that class might have in many other democracies in Western Europe.
We do not fully prove these alternative explanations, but at we hope to supply some
preliminary evidence of their plausibility.
The analysis is based on the 2006 and 2008 LAPOP surveys. We use two
distinct independent variables to measure class. One is an index of household wealth,
and the other is the class categories created by Erikson and Goldthorpe (1992), which
have been used by most of the comparative literature in class voting in Western Europe
and the US. We also use two different dependent variables, presidential voting and
legislative voting, which do not prove to be very different when it comes to class
voting, except in the more institutional party system of Chile.
The theoretical framework
a) The weak importance of class voting in Latin America
The conventional wisdom has received support in case studies that have revealed
either the lack of or very weak associations between class and electoral preferences. For
instance, in a study of Venezuela, Lupu (2010) found that only in the 1998 election did
Chávez garner a disproportionate support from poor voters. In subsequent elections he
attracted large numbers of middle-class voters. Likewise, in a study of the 1988
presidential election in Mexico, Dominguez and McCann (1995) found that class and
vote intention was significantly associated only once. Upper-class professionals were
less likely to vote for center-left candidate Cuauhtémoc Cárdenas than middle class
individuals. The remaining contrasts between class and vote intention, as well as those
between education and vote intention, were not significant. The same can be said about
other cases such as Brazil where Singer (2009: 85) showed that in the 2002 presidential
2
8/12/2019 Class Voting 13 May
http://slidepdf.com/reader/full/class-voting-13-may 3/55
election the vote for Lula - the Worker’s Party candidate - “was not especially
associated with any social strata in particular.” Torcal and Mainwaring (2003b)
concluded that in the 1990s, Latin American voters were “not strongly anchored to
parties through the traditional social cleavages [including class] that Lipset and Rokkan
(1967) emphasized (…) They do not engage in class voting”
The conventional view, however, has not gone unchallenged. Comparative-
historical researchers, while acknowledging the weakness of Latin American class
politics when compared to Western Europe, have nonetheless suggested that some
countries (such as Chile and Uruguay) developed stronger class cleavages than the rest
(Dix 1989). Some quantitative studies discovered strong associations between class and
vote. For instance, in a longitudinal study of Venezuela, Heath (2009a:189) found that
although the bivariate association between class and vote declined between 1960 and
1995, it got stronger from the late 1990s until 2005 – that is, the first half of the Chávez
era. Heath (2009b) confirmed that support for Chávez was much higher among the
working class than among the middle class. In a study of Mexico, Klesner (2008) shows
cross-tabulations from survey data from 2000 and 1997 according to which PRI voters
are less educated and earn lower incomes than PAN voters. Consistent with this, he
finds that the PRI does better in municipios with low literacy levels while the PAN does
so in more educated ones.
The absence of class voting has also been disputed with the Argentine case.
Cataife (2011) found that in the Argentinean legislative election of 2009 those with
more education and higher income (measured with a proxy) voted more for the Unión
Cívica Radical while those with lower education and income leaned to the Partido
Justicialista led by Cristina Fernández de Kirchner. This is aligned with a traditional
class-voting hypothesis for Argentina – that the popular classes prefer Peronist
3
8/12/2019 Class Voting 13 May
http://slidepdf.com/reader/full/class-voting-13-may 4/55
candidates while the better off lean to the Radicals (see Canton and Jorrat 2002 for
similar results regarding presidential elections in the 1990s). This claim was supported
by Lupu and Stokes’s (2009) study of the class cleavage in Argentine presidential and
congressional elections from1912 to 2003. Applying ecological inference methods to
census and official electoral data, they revealed that from 1946 onwards “class divisions
expressed themselves in the party system, with the Radical Party becoming the party of
the middle class and Peronism the party of the descamisados (shirtless ones) and the
poor” (Lupu and Stokes 2009:78).
Using ecological (district) data for Lima, Peru, Cameron (1991) found strong
and significant bivariate associations between social structure and voting patterns. In
both presidential and municipal elections between 1978 and 1989, leftist parties did
better in districts with higher percentages of manual and informal workers, while
rightist parties were favored where employers and white-collar employees abounded.
Several studies concur that in the 2006 election Brazilian president Lula was
disproportionately favored by the vote of the poor, which were attracted by the higher
standards of living that resulted from targeted social programs and minimum wage
increases (Singer 2009; Hunter and Power 2007; Zucco 2006). Finally, there has been a
substantial debate on the extent of class voting in Chile, with studies reaching different
conclusions (Torcal and Mainwaring 2003a; Valenzuela, Scully and Somma 2007;
Scully 1992).
These studies have followed disparate approaches to estimate the effect of class voting,
using different operationalizations or different dependent variables from case to case. Most
focus on only one country. Additionally, the surveys they use do not follow uniform sampling
methods or resort to common questionnaires. For instance, there are many ways of measuring
social class, and each may yield different results when it comes to study class voting (Handlin
4
8/12/2019 Class Voting 13 May
http://slidepdf.com/reader/full/class-voting-13-may 5/55
2013). With few exceptions (Torcal and Mainwaring 2003b), these studies have not replicated
the standard class variables proposed by Erikson and Goldthorpe.
In this chapter we combine the geographical breadth of many comparative-historical
studies of class politics, which refer to the region as a whole, with the methodological
advantages of single-country studies, which are able to disentangle the influence of class
variables on voting behavior. We provide an assessment of class voting in 17 Latin American
countries using comparable survey data collected in 2006 (and occasionally in 2008) (and in the
future 2012) as well as uniform measures and models. To the best of our knowledge only
Torcal and Mainwaring (2003b) undertook a similar endeavor for Latin America. Nonetheless,
they studied only seven countries and used a single measure of class. By studying most Latin
American countries and including two different measures of stratification (household wealth
and the Erikson-Goldthorpe class variable) we hope to obtain more robust and comprehensive
conclusions.
This paper attempts to offer a preliminary comparative comprehensive
estimation of class voting in the region, trying to replicate with some important
adaptations the analysis of the class voting literature in the advanced industrial
democracies.
The effect of party electoral supply to explain cross-national differences
Although class voting in Latin America seems to be lower than in Western Europe
(Torcal and Mainwaring 2003b), there may be interesting variations across countries and over
time. This paper deals with cross-national variations in class voting. The comparative literature
beyond Latin America has been divided between authors who emphasize the political
construction of class voting (Chhibber and Torcal 1997; Esping-Andersen 1985; Przeworski
and Sprague 1986; Sartori 1969; Hout et al. 2001; Torcal and Mainwaring 2003a) and those
5
8/12/2019 Class Voting 13 May
http://slidepdf.com/reader/full/class-voting-13-may 6/55
who focus on structural and cultural bases of class voting (Inglehart 1984, 1990; Lipset 1964,
1981, 2001; Clark and Lipset 1991; Franklin 1992; Nieuwbeerta and Ultee 1999). The first
approach seems to have become dominant (Knutsen, 2010).
This top-down hypothesis about the formation of class voting in Western
Europe has two alternative approaches. The first one emphasizes both the political and
structural aspects of class voting to explain cross-national differences, arguing that class
voting was stronger in countries with a larger blue collar work force fostered by the
existence of a stronger welfare state, and indirectly by a longer and stable democratic
history. In other words, class voting is a long historical process that goes hand in hand
with the institutionalization of party systems in Western Europe.
This approach has been used to explain also the general absence of class voting
in Latin America. Specialists in the region consider that the cross-national differences
about class voting are the result from both historical political conditions related with the
relatively weak labor unions and leftist (socialist or communist) parties, extensive
clientelistic ties between political elites and the masses – which delay working-class
consciousness -, and the relevance of populist parties based on multi-class alliances –
which dilute working-class appeals. Weak class voting may have been also reinforced
by the market reforms implemented during the last three decades in the region, which
were associated with public sector downsizing as well as the expansion of informal,
precarious, and flexible labor markets.
But what about cross-national time variations in class voting in the region?
There is a complementary explanation, formulated mostly as a result of the increasing
presence of leftist incumbent governments in the region, which emphasizes the role of
political agency as a more active and recent promoter of class voting. For instance
Heath (2009b) attributes the polarization of the class cleavage in Venezuela to the
6
8/12/2019 Class Voting 13 May
http://slidepdf.com/reader/full/class-voting-13-may 7/55
leadership and charisma of Chávez rather than to changes in the social structure or the
demands of the working class. Hence it is a story about changes in the “political
supply.” Handlin (2012) agrees that there was a recent increase of class voting in
Venezuela, but links it to the implementation of social programs that mobilized the poor
and strengthened their attachments to the incumbent United Socialist Party. In the same
line, some studies that tracked changes across time with quantitative data suggest that
class voting may come and go as a result of changes in the political supply. Stokes and
Lupu (2009) found that in Argentina, periods of economic crises and sociopolitical
upheavals temporarily eroded the traditional alignments between voters and parties,
increasing middle-class support for Peronists as well as lower-class support for
Radicals. Along similar lines, Cameron (1991: 298) notes that the Peruvian APRA lost
working-class support after the emergence of the United Left, but recovered it after
1985 when Alan Garcia took the lead of the party. Finally, according to Zucco (2006)
the social bases of the Brazilian Workers Party changed notably between 1994 and
2006, adopting the working-class profile that Lula was seeking for since its beginnings.
Some of these studies use aggregated units (such as regions or districts), leaving
unanswered the question about how individuals from different classes vote.1 These
studies are also missing a much comprehensive comparative study of class voting in the
region to be able at least to grasp the plausibility of this discussion and hypothesis. This
is the second goal of this paper.
Dependent and independent variables
We use two different dependent variables: presidential and legislative vote. The
presidency is where the power is, and it is the primary focal point of elections throughout Latin
1
Another line of studies has resorted to the surveys of Latin American political elites carried out by theUniversidad de Salamanca under the direction of Manuel Alcántara (see e. g. Lupu and Carnes 2012). In
this chapter, we are concerned with the political behavior of the masses rather than elites.
7
8/12/2019 Class Voting 13 May
http://slidepdf.com/reader/full/class-voting-13-may 8/55
America. It is also worth analyzing legislative voting because legislatures in Latin America
have important powers and because legislative voting might be, for a slice of the electorate, a
clearer expression of “sincere” voting. Because presidential elections ultimately have only one
winning candidate, politicians engage in strategic interparty coordination to form electoral
alliances in presidential elections. As a result, many citizens might not be able to vote for their
first choice party in presidential elections. Moreover, strategic voters do not want to waste their
presidential vote, so they might cast their ballot for their second most preferred candidate.
We primarily use the 2006 wave of the Latin American Public Opinion Project
(LAPOP) survey to assess class voting. For legislative voting in Argentina, Bolivia, and Brazil,
we use the 2008 wave of LAPOP because data were not available for 2006.
In the multinomial models presented below, the party (for legislative voting) or
candidate (for presidential voting) located most to the right among parties that obtained more
than 10% of the valid preferences among survey respondents is the reference category. We
determined the most conservative party or candidate by the mean ideological self-placement of
voters who supported that party or candidate.
Our primary independent variable is the class of the respondent. We constructed
this variable in two different ways, both of which have some advantages over the other.
Our first measure is based on household wealth, including items such as plumbing,
computers, land line phones, cell phones, and automobiles. The 2006 LAPOP enables
us to measure household wealth for almost every respondent. Household wealth-based
measures are commonly used as an indicator of class (Handlin 2013).
Second, we use a measure intended to roughly approximate the Erikson-
Goldthorpe (1992) class schema. It has been frequently employed in the literature on
class voting in Western Europe (Evans 1992; Evans 1999: 8-11; Clark 2001: 19-20) but
is almost absent in studies on voting patterns in Latin America (exceptions are Torcal
8
8/12/2019 Class Voting 13 May
http://slidepdf.com/reader/full/class-voting-13-may 9/55
and Mainwaring 2003a, Torcal and Mainwaring 2003b, and Heath 2009a).2 In contrast
to wealth-based measures, the Erikson-Goldthorpe schema is based on individuals’
position in production processes. Individuals’ political preferences (including their vote
choice) are formed not only in relation to their income or household wealth, but also as
a result of their work experiences and relationships. Historically, unionized blue collar
workers were more likely to form and support leftist parties than small owners who had
the same income and living standards. The latter were at least stereotypically inclined to
be conservative. Likewise, individuals employed in the informal sector in contemporary
Latin America were presumably historically less likely to support leftist parties than
poor members of the working class.
Measuring Household Wealth
First, we provide estimates of class voting based on a measure of household
wealth. We estimated household wealth using a principal component analysis of ten
household assets listed in the AmericasBarometer surveys, as described by Córdova
(2009). The principal component analysis used dichotomous variables to indicate
whether or not a household contains any of the following material goods or assets: a
television, a refrigerator, a landline telephone, a cellular phone, one vehicle, two
vehicles, three vehicles, a washing machine, a microwave oven, indoor plumbing, an
indoor bathroom, or a computer. As Córdova (2009) explains, formally, the wealth
index for household I is the linear combination,
yi = α 1(
x1 − x1
s1) +α 2(
x2 − x2
s2
) + ...+α k ( xk − xk
sk )
where and sk are the mean and standard deviation of the asset x k and α is the weight
for each variable xk for the first principal component. By definition, the first principal
2 For studies that resort to discrete class categories based on occupational measures, see
Dominguez and McCann (1995), and Canton and Jorrat (2002).
9
8/12/2019 Class Voting 13 May
http://slidepdf.com/reader/full/class-voting-13-may 10/55
component across households or individuals has a mean of zero and a variance of λ,
which corresponds to the largest eigenvalue of the correlation matrix of x. The first
principal component y yields a wealth index that assigns a larger weight to assets that
vary the most across households so that an asset found in all households is given a
weight of zero (McKenzie 2005). The first principle component or wealth index can
take positive as well as negative values (Córdova 2009: 3). We modified Córdova’s
household wealth measure slightly because we did not use weights to differentiate
between urban and rural areas. For our purpose, if a household does not have indoor
plumbing, a refrigerator, an indoor bathroom, a television, or the other household goods
mentioned above, it does not matter if it is in an urban or rural area; we still regard it is
poor.
We use household wealth rather than income for several reasons.3 First, the
question on income was not commensurable across countries in the 2006 survey. It
would be difficult to compare class voting across countries without a measure of class
that was directly comparable across countries. Second, a measure of wealth based on
household goods is more stable than one based on income. A middle class person could
leave the labor market for a short time without experiencing a pronounced decline in
household wealth (Booth and Seligson 2009: 115-116). Thus, the income measure could
be misleading (i.e., have poor validity). Third, wealth based on household goods
correctly codes relatively well-off retired individuals, whereas an income question
might record these individuals as having very low or no income. Again, the validity of
the measure based on household goods should be higher. Fourth, misreporting is
probably much higher on income than on household wealth (Handlin 2013: 150-151).
3
For an excellent recent discussion of the advantages and disadvantages of differentconceptualizations and operationalizations of “class,” see Handlin 2013. We draw on
his discussion of the advantages of using household wealth rather than reported income.
10
8/12/2019 Class Voting 13 May
http://slidepdf.com/reader/full/class-voting-13-may 11/55
Fifth, if we used income, we would need to adjust for size of household. A certain
household income could be more than adequate for one person but put a household of
seven below the poverty line. A measure based on household wealth is much less
vulnerable to this problem. Finally, there were fewer missing cases for household
wealth (only five out of 28,216 respondents compared to 3613 missing observations for
the family income question). We excluded Panama because of some problems in the
household wealth data in 2006.
The classic hypothesis in some class voting literature – i. e. the rich vote for the
right and the poor for the left (Lipset 1960: 234)4--is supported if we obtain negative
and significant associations between household wealth and the dependent variable.
For both household wealth and our other measure of class, we employ simple
models with three demographic variables as controls in addition to our primary variable
of interest (household wealth or class): population size where the respondent lives
(metropolitan area and large cities =1; medium cities, small cities, and rural = 0), 5 sex
(male=1, female=2), and age. Without these control variables, we could get biased
results. If, for example, a high percentage of skilled workers were men and if men voted
disproportionately for the left, what might in a univariate analysis appear to be class
voting could in fact be gender voting. In most countries, rural areas vote
4 Lipset (1960: 234) wrote that “More than anything else, the party struggle is a conflict
among classes, and the most impressive single fact about political party support is that
in virtually every economically developed country the lower-income groups vote
mainly for parties of the left, while the higher income groups vote mainly for parties of
the right.”5 This dichotomous variable parsimoniously captures the relationship between
population size and the ideology of the presidential candidate for whom respondents
voted. Respondents from country capitals and large cities voted for more leftist
presidents than respondents from smaller localities. Contrary to our ex-ante
expectations, respondents of medium cities were slightly more conservative in
presidential voting than respondents of small cities and rural areas. These differences
were not statistically significant, so rather than using the five discrete categories for population size that appeared in the original survey, we created the dichotomous
variable.
11
8/12/2019 Class Voting 13 May
http://slidepdf.com/reader/full/class-voting-13-may 12/55
disproportionately for conservative parties, and they are also on average considerably
poorer than large cities. Therefore, if we did not control for large city residence, it might
appear that wealthy households voted for the left, when in fact what is going on is that
big cities vote more for the left in many countries.
We do not include questions about political or social attitudes or behavior
because doing so could dampen the effects of class on voting. Class could work through
political and social attitudes and behavior and indirectly affect voting preference. We
are interested in the combined direct and indirect effects of class.
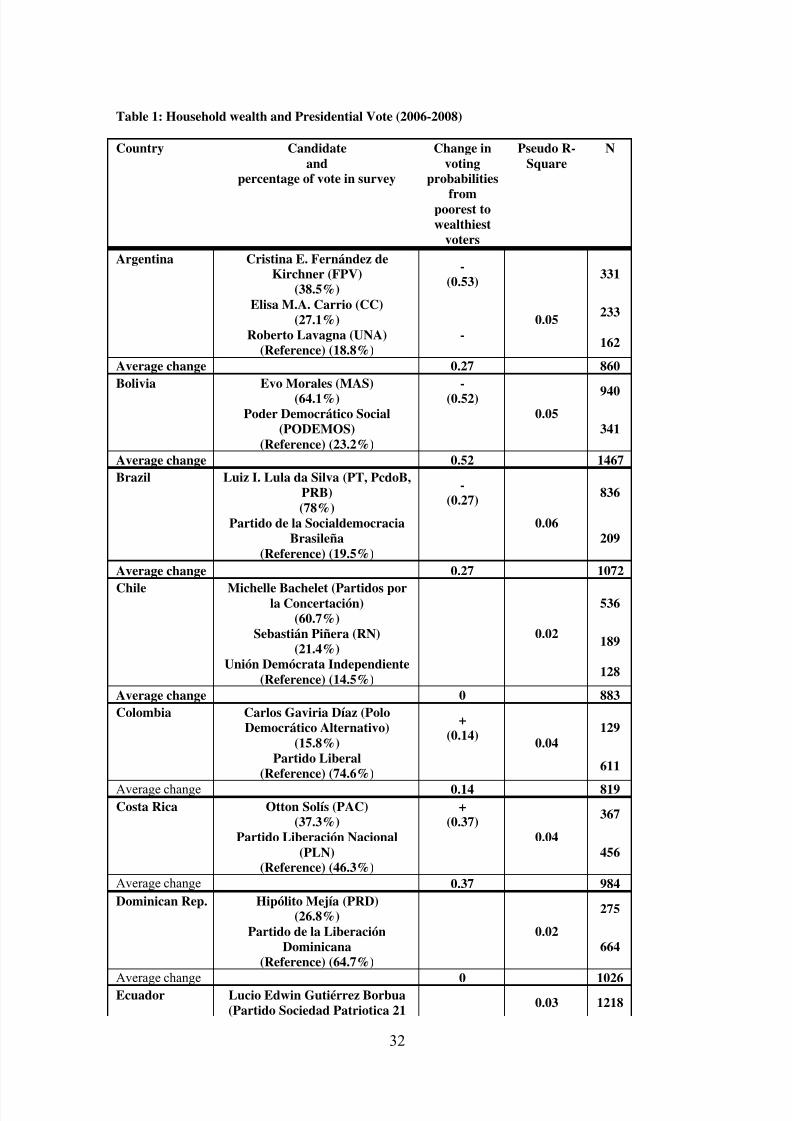
Household Wealth and Presidential Vote
We carried out a multinomial logistic model in each country using LAPOP
2006. The dependent variable is categorical, and indicates the candidate for whom
respondents voted for in the last presidential election (variable vb3_06 in the dataset).
We removed from the models respondents who did not answer the question, did not
know for whom they voted, or stated that they did not vote. We used robust standard
errors in all models. The number of valid observations ranges from a minimum of 582
(Paraguay) to a maximum of 2016 (Ecuador).
Table 1 shows the statistically significant (p<.10) results. Although we included
all candidates in the regressions, to save space and focus attention on the most
important results, we list only the candidates who obtained at least 10% of the valid
vote according to survey responses.
The number in the “Change in probabilities” column is based on a simulation. It
shows the percentage change in the probability that a very wealthy respondent
compared to a very poor respondent (as we shift from the lowest to the highest value for
household wealth in a given country) would vote for a given candidate as opposed to
12
8/12/2019 Class Voting 13 May
http://slidepdf.com/reader/full/class-voting-13-may 13/55
the conservative reference candidate. A positive value indicates that controlling for age,
sex, and residence in a large city, wealthier voters were more likely than poor voters to
prefer the more progressive candidate. A negative value shows that wealthy individuals
are less likely than poor voters to support the more progressive of the two candidates.
For Argentina, for example, the wealthiest voters were a whopping 53% less likely than
the poorest to vote for Cristina Fernández de Kirchner rather than Roberto Lavagna. 6
Conversely, in the competition between Lavagna and Elisa Carrio, household wealth
had no impact on voting.
Table 1 here
In the simulations, the control variables are held constant at their mean values
for a given country. In addition to Fernández de Kirchner, three other leftist and center-
left candidates won great support from poor voters. In Bolivia, poor voters
overwhelmingly preferred Evo Morales to Jorge Quiroga; they voted 52% more than the
wealthiest respondents for Morales. In Brazil, the poorest voted 27% more than the
wealthy for Lula. In Peru, the poorest voted 38% more than the wealthiest for Ollanta
Humala. In addition, Hugo Chávez (-4%), center-left candidate Alvaro Colom in
Guatemala (-7%), and center-left candidate Cuauhtémoc Cárdenas in Mexico (-5%)
fared somewhat better among the poorest than the wealthiest voters.
But this result is far from consistent across all countries. Most notably, in El
Salvador, in the competition with ARENA’s candidate Antonio Saca, the old
Communist Party leader and FMLN candidate Schafik Handal won 24% more among
the wealthiest voters than he did among the poorest. Given the very strong connections
between business groups and ARENA, and given the revolutionary and largely rural
genesis of the FMLN, this result is deeply surprising. In the competition with the most
6 Throughout this chapter, all simulations include the effects of the three control
variables held constant at a given country’s means.
13
8/12/2019 Class Voting 13 May
http://slidepdf.com/reader/full/class-voting-13-may 14/55
conservative candidate, Daniel Ortega in Nicaragua, Michelle Bachelet in Chile, and
Tabaré Vázquez in Uruguay did no better among the poorest voters than among the
wealthiest.
The row for “average change” provides a crude summary of how powerful class
voting based on household wealth was in different countries. It is simply the average of
the statistically significant change in probabilities (the difference between how the
wealthiest and poorest voted). Non-significant coefficients count as 0 change in
probabilities. Based on data from a single year, Bolivia (-52%), Costa Rica (+37%),
Argentina (-27%), Brazil (-27%), El Salvador (+24%), and Peru (-23%) had strong class
voting in presidential elections. In Bolivia, Argentina, Brazil, and Peru, class voting
occurred along the lines Lipset (1960) predicted: the poor were more likely than the
wealthy to support the more progressive candidate. In Costa Rica and El Salvador, the
opposite pattern prevailed. There was no class voting in Chile, Ecuador, and Honduras.
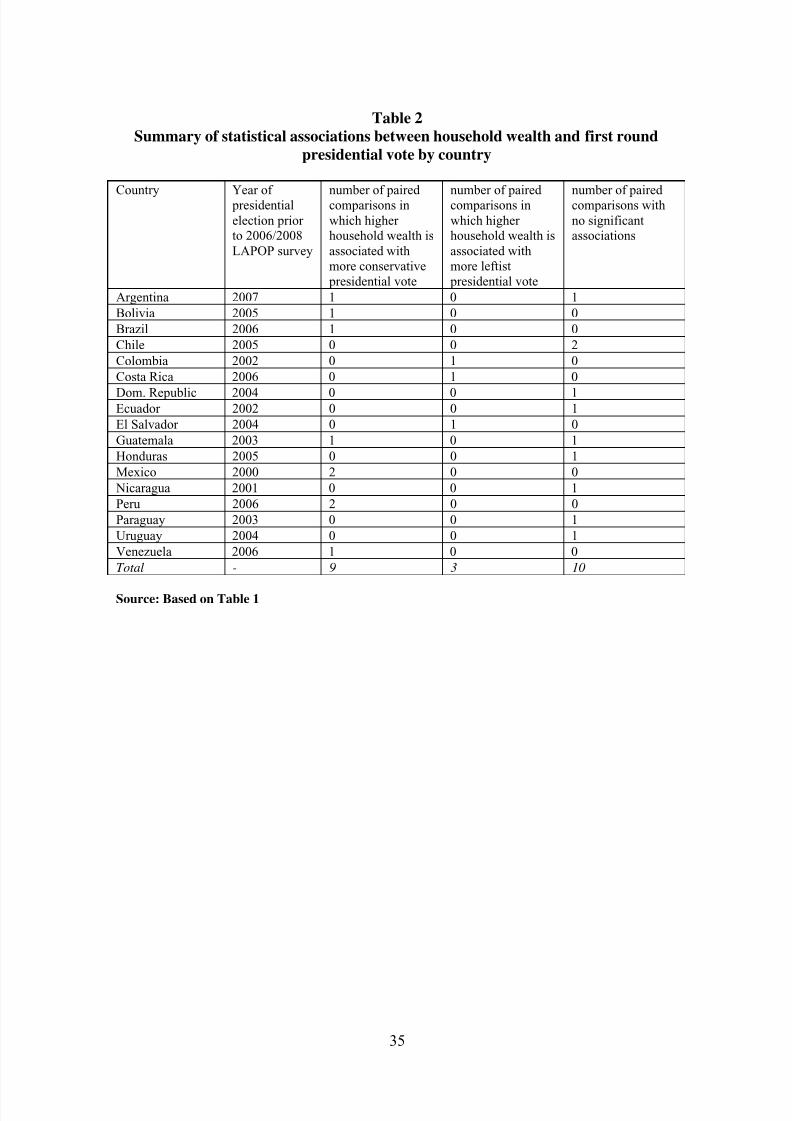
Table 2 shows how often there is a negative association between higher
household wealth and leftist presidential voting, as Lipset’s classic hypothesis suggests.
We computed the percentage of significant negative associations between household
and vote in all paired comparisons between major presidential candidates. We also
verified the number of “wrong” associations (with positive numbers in Table 1 above)
and of insignificant associations. These three figures for each of the countries are shown
in Table 2. For instance, Mexico provides two comparisons of voter groups (Fox’s
voters vs. Cárdenas’s, and Fox’s voters vs. Labastida’s). In both comparisons, wealthier
voters were more likely than poor voters to support Fox.
Table 2 here
In nine of the twenty-two comparisons, poor voters were more likely than
wealthy voters to prefer the less conservative candidates, consistent with Lipset’s
14
8/12/2019 Class Voting 13 May
http://slidepdf.com/reader/full/class-voting-13-may 15/55
(1960) hypothesis. Conversely, in three paired comparisons, wealthy voters preferred
candidates to the left of the most conservative candidate. One of these was the very
puzzling case of more support among poor than wealthy voters for the conservative
candidate Antonio Saca (ARENA) over Schafik Handal of the leftist FMLN. The other
two involved centrist or center-left candidates whose primary base of support was the
urban middle class: Ottón Solis of the Citizens’ Action Party in Costa Rica and Carlos
Gaviria, who finished a distant second to Alvaro Uribe in Colombia’s 2006 presidential
election. Both campaigned more on civic than class issues.
In ten of the 22 paired comparisons of candidates, household wealth had no
statistically significant influence on the vote. It is not infrequent in Latin America that
relatively wealthier respondents prefer leftist candidates while the poorer respondents
prefer rightist ones. Urban educated middle classes often prefer progressive candidates,
while conservative candidates and parties have sometimes made significant inroads in
the lower classes (e. g. the PRI in Mexico and Fernando Collor de Melo, the winning
presidential candidate in Brazil in 1989; also recall that Brooks and Manza 1999
documented a shift from traditional class voting to this new type of class voting in the
US during the 1960s, and that Lipset (1960: 87-126) wrote long ago about working
class authoritarianism).
Among the candidates listed in Table 1, three had unequivocal profiles as radical
leftists: Evo Morales, who won the Bolivian election in 2005; Hugo Chávez, who was
the president in Venezuela; and Ollanta Humala in Peru. 7 If, as we hypothesized briefly
above, class voting emerges from strong class signals and conflicts created by
campaigns, political styles, and policies, class voting should be strong in these cases.
7 Levitsky and Roberts (2011) and Weyland et al. (2010) view Morales, Chávez, and
Rafael Correa as the leading expressions of the radical left. Humala unambiguouslysituated himself in this camp in the 2006 presidential campaign before switching to a
much more moderate platform in his victorious 2011 election.
15
8/12/2019 Class Voting 13 May
http://slidepdf.com/reader/full/class-voting-13-may 16/55
The data strongly confirm this hypothesis for two of these three candidates. Morales (-
52%) and Ollanta (-38%) fared vastly better among the poorest voters than among the
wealthiest. For Chávez (-4%), the difference was far less profound but nevertheless
statistically significant.
Household Wealth and Congressional Voting
In some countries of Latin America, legislative vote results diverge dramatically
from presidential results,8 and, as noted above, the former might give sharper insight
into “sincere” voter preferences. Hence, we analyze class voting (first by household
income) in congressional elections. The data in this section come from the 2006
LAPOP. The specific survey question is “For which party did you vote for deputy in the
last elections.” This question was not asked in Argentina, Bolivia, Brazil, the
Dominican Republic, Honduras, or Paraguay, so we do not include them in the analysis.
For Venezuela, there were relatively few respondents for the reference category, making
it impossible to estimate the model.
Table 3 presents the results. Models have the same control variables (sex, age,
and residence in large cities) as in Table 1. Again, the models include all parties but we
report results only of parties that won at least 10% of the vote among respondents who
said they voted for a deputy.
Table 3 here
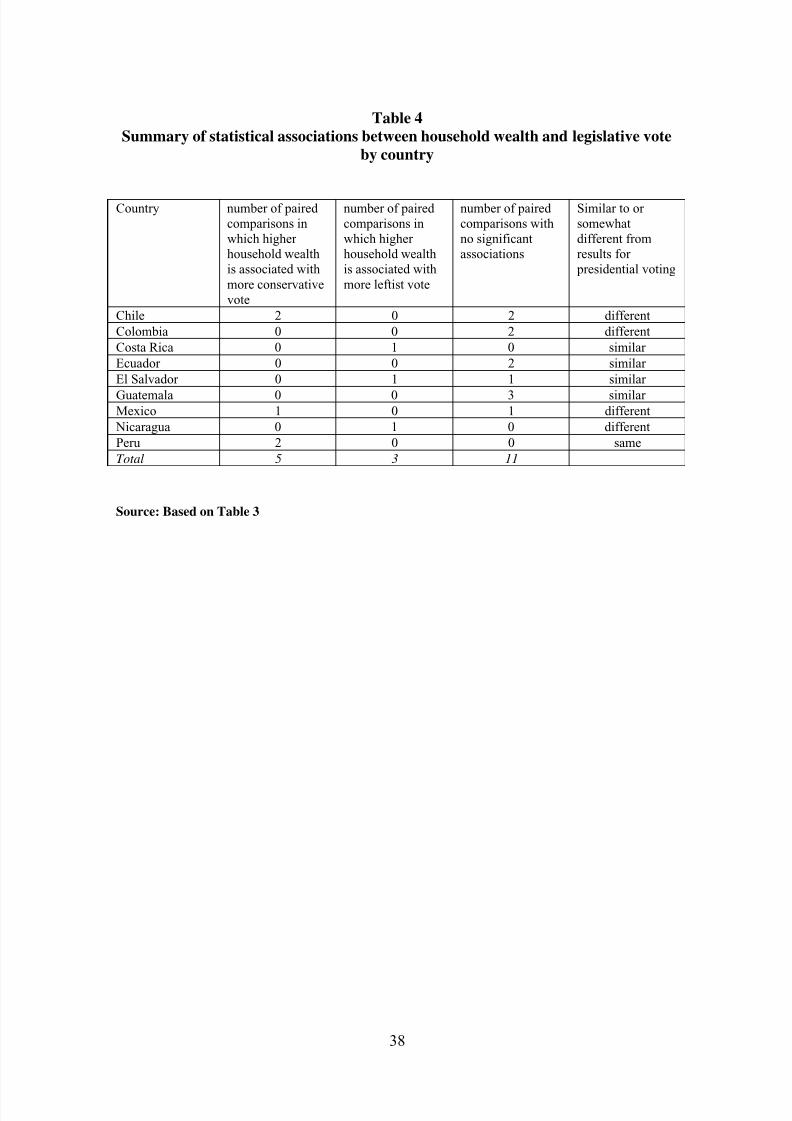
Table 4 synthetically summarizes the results of Table 3. Summarized in this
gross way, class voting in the direction hypothesized by Lipset is weaker in legislative
than presidential voting. In only five paired comparisons were poorer voters more
8 In Brazil, for example, in 2010, the PT and PSDB combined for 80% of the first round
presidential vote compared to 27% of the vote for the Chamber of Deputies. Theeffective number of candidates in the 2010 presidential election was 2.75. The effective
number of parties (in votes) for the Chamber of Deputies was four times higher, 11.2.
16
8/12/2019 Class Voting 13 May
http://slidepdf.com/reader/full/class-voting-13-may 17/55
inclined than wealthier voters to choose the more left of the two parties. (The number
for presidential voting was nine paired comparisons.) In three comparisons, wealthier
voters were more likely than the poor to support the more progressive options. Nine
cases were statistically insignificant.
Table 4 here
Only a few of the differences between poor and wealthy voters follow a
stereotypical story of poor people voting in large proportions for leftist parties. In Chile,
wealthy voters were less likely than poor voters to choose the center-left Socialists over
the right wing UDI (-8%), and the gap between wealthy and poor voters was even
greater for the centrist Christian Democrats (-23%) in legislative elections. This pattern
is a contrast to the null results in presidential voting.
In Peru, consistent with our findings for the presidential election, poorer voters
were considerably more likely than wealthier voters to prefer the party label captured by
Ollanta Humala, the UPP, to the conservative Unidad Nacional (-16%). However, the
difference in the wealth profile of UPP voters was much more pronounced in the
presidential election (-38% versus -16%), suggesting that poor voters were drawn to the
charismatic figure of Humala without voting en masse for the UPP’s deputies.
Unfortunately, for purposes of testing our hypothesis that radical left candidates and
parties should be especially likely to induce class voting, the Peruvian case, which
supports this hypothesis, is the only one that has data for legislative voting.
In Mexico, consistent with past work on this issue, wealthy voters were far less
likely than poor voters (-29%) to support the PRI over the PAN. This finding is
consistent with a hypothesis that poor voters would prefer the more leftist of two
parties, and it is also consistent (and even more powerful than) our above finding for the
Mexican presidential election. By 2000, the PRI was a center-right party, so this is not a
17
8/12/2019 Class Voting 13 May
http://slidepdf.com/reader/full/class-voting-13-may 18/55
stereotypical case in which the poor voted for the left. Interestingly, the household
wealth profile of the center-left PRD did not differ from that of the PAN.
Three cases are statistically significant, but wealthier voters supported the more
leftist of the two paired parties. Consistent with our finding for the 2004 presidential
election, the most surprising statistically significant result is that in El Salvador
wealthier voters reported that they were more likely than poor voters (+27%) to support
the leftist FMLN over the conservative ARENA. Consistent with the findings for
presidential elections, in Costa Rica, wealthier voters were much more likely (+31%)
than poor voters to prefer the center-left Citizen Action Party over the centrist National
Liberation Party. Finally, in Nicaragua, wealthier voters were relatively more likely
than poor voters (+10%) to choose leftist Daniel Ortega over the conservative
candidate. Given the hostile relationship between business groups and the FSLN when
it governed from 1979 to 1990, this finding is very surprising.
The final column of Table 4 provides a crude summary measure of whether the
pattern of class voting in legislative and presidential elections was largely similar or
somewhat different in each country. We scored a country as somewhat different if 1) for
any pair of parties, the household wealth variable was significant with one dependent
variable but not with the other; or 2) overall (as opposed to any specific pair of parties)
there was no statistically significant class voting for one kind of election but there was
for the other.9
Overall, there was a high level of consistency between presidential and
legislative results. In four of the nine countries, there were minor differences in class
9 In principle, we would also have coded a country as somewhat different if a paired
comparison was significant in both kinds of elections but with opposite changes in
probabilities (that is, the wealthier were more likely than the poor to vote for Party X’s presidential candidate, but less likely than the poor to vote for Party X’s deputies). Not
surprisingly, there were no such cases.
18
8/12/2019 Class Voting 13 May
http://slidepdf.com/reader/full/class-voting-13-may 19/55
voting between presidential and legislative voting. In Chile and Nicaragua, there was no
class voting in the presidential election, but there was in legislative voting. In Colombia,
the opposite was true. In Mexico, in the competition between the PRD and PAN, the
wealthiest voters were 5% less likely than the poorest to choose the center-left
presidential candidate, Cuauhtémoc Cárdenas, over the PAN, but the household wealth
variable did not differentiate PRD and PAN candidates for deputy. In the other five
countries, the results were highly similar for presidential and congressional voting.
Class: Erikson and Goldthorpe’s Schema
The Erikson and Goldthorpe (1992) schema begins with employment status, i.e.,
the distinction between self-employed, employers, and employees. Two individuals
with the same occupation are usually parts of different classes in the Erikson and
Goldthorpe schema if their employment statuses are different. For example, a self-
employed accountant belongs to the petty bourgeoisie while an accountant who is an
employee for a firm is usually routine nonmanual. LAPOP 2006 provides employment
status for both those active in the labor force and those unemployed (variable OCUP1A
in the original questionnaire, and ocup1a in the pooled dataset).
The second and final consideration in the Erikson-Goldthorpe schema is an individual’s
occupation. They developed a fine-grained occupational coding that has been used in many
surveys in Western Europe. Accordingly, we used the question about the respondent’s
occupation (variable OCUP1 in the original questionnaire and ocup1_06 in the pooled dataset)
as the second step in coding respondents’ class. 10
10
Unfortunately the occupation and employment status variables were not asked in thesurveys of Brazil, Bolivia and Ecuador. This forced us to discard these countries from the
analysis since it is impossible to approximate the Erikson and Goldthorpe schema for them.
19
8/12/2019 Class Voting 13 May
http://slidepdf.com/reader/full/class-voting-13-may 20/55
Unfortunately for our purposes, the 2006 LAPOP questionnaire does not allow for such
fine-grained distinctions; it had only eleven occupational categories compared to the ISCO88
and ISCO08 international five digit categories often used in the comparative surveys in
Western Europe that have followed Erikson and Goldthorpe. LAPOP’s categories are not
detailed enough on the occupation question to accurately code all respondents based just on
employment status and occupation. For this reason, we depart from Erikson-Goldthorpe and
use questions on education (variable ED in the questionnaire and ed in the dataset) and
household wealth to help build some class categories.
Using education and household wealth is essential to approximate Erikson-
Goldthorpe with LAPOP’s questions, and it is also consistent with their spirit. For
example, the service class is with few exceptions well educated and well off.
We began with the version of the Erikson-Goldthorpe schema with five class
categories. The service class (large owners, professionals, administrators, managers,
and high level supervisors) is the most privileged in terms of economic position. The
petty bourgeoisie includes small owners, farmers, and self-employed workers in
primary production. The routine non-manual class includes non-manual workers in
administration and commerce and sales personnel. The final two classes are skilled and
unskilled workers.
The Erikson and Goldthorpe schema was developed with the advanced
industrial democracies in mind. Using this schema for coding class in Latin American
countries requires some adjustments because of the deep cross-regional differences in
class structure. For the Latin American cases, we added a sixth class category that is not
part of the Erikson-Goldthorpe schema: the marginal (or poor) self-employed. This
category is essential for understanding class in Latin America. The poor self-employed
informal sector category constitutes a sizable part of most Latin American societies. It
20
8/12/2019 Class Voting 13 May
http://slidepdf.com/reader/full/class-voting-13-may 21/55
is much larger and much poorer in most of Latin America than anywhere in Western
Europe. These six class categories, which are based on objective positions in the class
structure, differ from categories based on subjective (self-reported) class, income, or
household wealth.
Appendix 1 provides details of how we classified survey respondents into class
categories based on the LAPOP 2006 survey. Following Erikson and Goldthorpe, we first
divided respondents by employment status into four groups: 1) employees 2) employers; 3)
self-employed; and 4) unpaid workers. 11 The second step was to examine each LAPOP
occupational category (the first column). Where employment status and occupation did not
suffice to code class, Appendix 1 indicates how we used education and/or household wealth to
determine class.
For example, without using education and household wealth, we had no way to decide
whether owners (employment status) who were managers or technicians should be classified as
petty bourgeoisie or service class. Among these groups (and several others), we coded
individuals who had at least fifteen years of education and were in the top 20% of the
household wealth measure for the region as a whole and were in the top 20% of the household
wealth measure for their own country as service class.12 The education and household wealth
11 The category of unpaid workers does not exist as a separate category in Erikson and
Goldthore’s schema. Trabajador no remunerado o sin pago in the mother
questionnaire. There are only 80 cases in this category (less than 1% of the variable).12 Like Handlin (2013: 153-155), we used separate education and household wealth
measures rather than combining them because the service class is both (with few
exceptions) well educated and relatively well-off. A very high score for household
wealth should not compensate for low education (again, with few exceptions). We used
both a regional and country-specific measure of wealth because wealth is both absolute
(i.e., assessed by international standards) and relative (i.e., country-specific). An
individual who is in the upper echelon of the middle class in Bolivia (and hence might
be service class) would not be as comparatively well off, and hence might not be service
class, in the United States; this is why we needed a measure that considers country-
specific conditions. On the other hand, social scientists customarily think of wealth withsome reference to cross-national standards. In very poor societies, a lower percentage
should be categorized as service class.
21
8/12/2019 Class Voting 13 May
http://slidepdf.com/reader/full/class-voting-13-may 22/55
thresholds are lenient separately for determining who should be categorized as service class,
but jointly they create a reasonable threshold. We coded owners who were managers or
technicians who had less than fifteen years of education or were in the bottom 80% of
household wealth for the region as a whole or for their country as petty bourgeoisie.
We also used household wealth to determine which self-employed individuals should be
categorized as “poor self-employed;” we included only those in the bottom 50% of household
wealth for the region as a whole. Unfortunately, LAPOP does not provide information on
occupation or employment status for the heads of households for students, retired, and
housewives, so we could not include those categories.
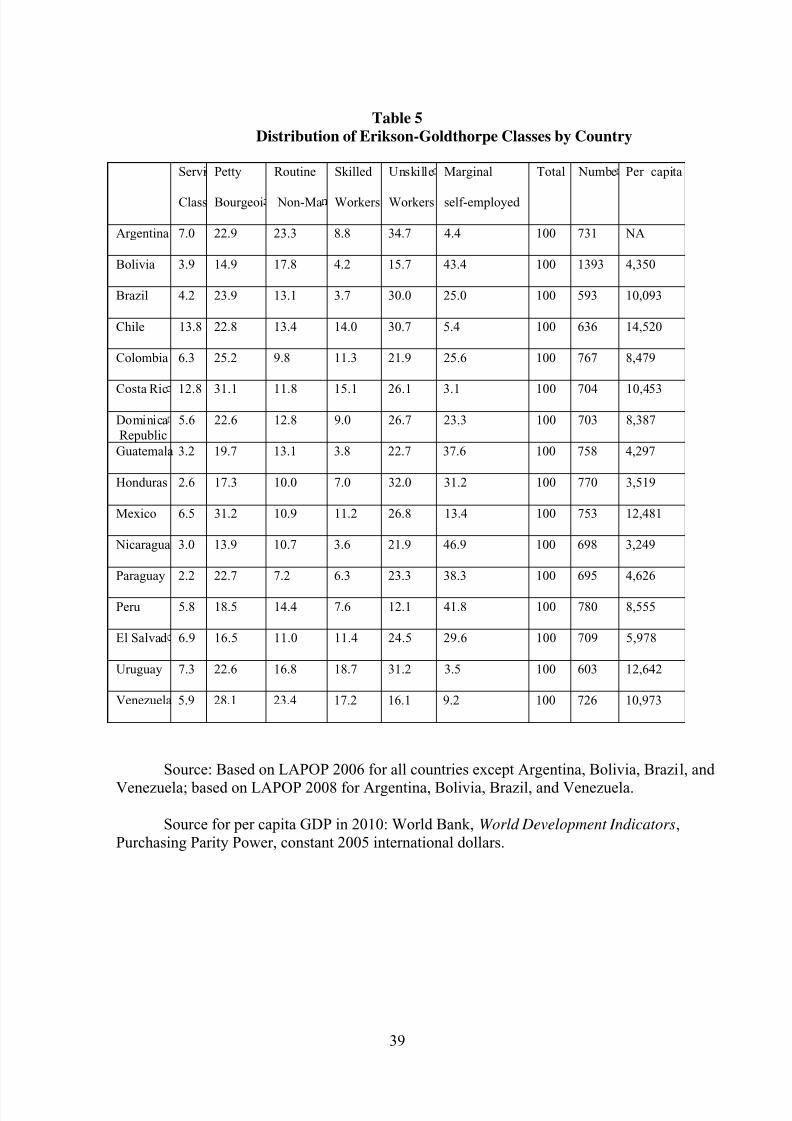
Table 5 shows the breakdown into six classes in the twelve countries included in our
analysis. The stark cross-national differences in class composition conform closely to what one
would expect on the basis of differences in level of development. The service class is much
larger in the more developed countries (Uruguay, Chile, Costa Rica, Mexico) than in the poor
countries (Nicaragua, Paraguay, Honduras, Guatemala). The bivariate correlation between the
size of the service class and per capita GDP is very high at .75.
Table 5 here
Conversely, the marginal self-employed class is substantially larger in the poor
countries. The bivariate correlation between the size of the marginal self-employed class and
per capita GDP is impressive at -.86.
The size of the skilled working class should be and is higher in the more developed
countries. The bivariate correlation between the size of the skilled working class and per capita
GDP is again high at .73. The distribution of classes by country lends strong credibility to the
validity of the coding.
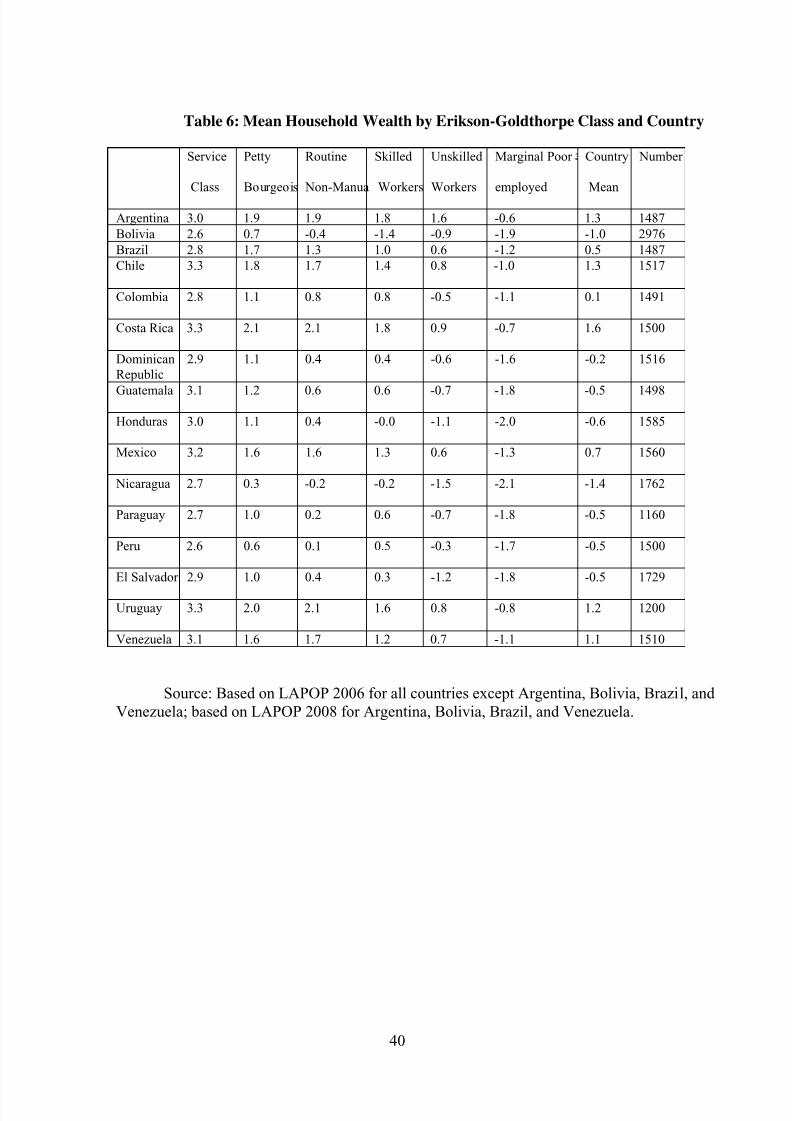
Table 6 shows the mean household wealth of the six classes in the sixteen countries.
The service class should consistently be the wealthiest, and it is by a large margin in all
22
8/12/2019 Class Voting 13 May
http://slidepdf.com/reader/full/class-voting-13-may 23/55
countries. The measure of mean country household wealth correlates very strongly (.90) with
per capita GDP. Cross-national differences in the mean household wealth of the service class
are relatively minor, reflecting the fact that all Latin American countries have an affluent upper
strata. Not surprisingly, skilled and unskilled workers fare much better in the wealthier
countries. The correlation between per capita GDP and mean household wealth of unskilled
workers is remarkably high at .91. The country means and the number of observations in Table
2 include individuals who were not categorized by class.
Table 6 here
Erikson-Goldthorpe Class Voting
These six class variables are dummy variables in the statistical analysis. The reference
class category in all comparisons is the petty bourgeoisie, traditionally seen as a class with
conservative political predilections.
Table 7 shows the results for presidential candidates for whom at least 10% of survey
respondents voted according to the survey. Table 8 shows the results for legislative voting.
Again, to save space, we do not show results for the control variables and show only the
statistically significant results.
Tables 7 and 8 here
A negative sign in Table 7 or 8 indicates that a given class was disproportionately
favorable to the more conservative (i.e., the reference) candidate or party, and a positive sign
means that the class voted disproportionately for the less conservative candidate or party. The
number shows the change in the likelihood that a given class would vote for one candidate over
another, relative to voting among the petty bourgeoisie. For example, in Argentina, in Table 7,
controlling for age, sex, and large city residence, unskilled workers were 1% more likely than
the petty bourgeoisie to vote for Cristina Fernández rather than Roberto Lavagna, among
23
8/12/2019 Class Voting 13 May
http://slidepdf.com/reader/full/class-voting-13-may 24/55
unskilled workers and petty bourgeois who voted for one of these two candidates. In Bolivia,
two classes displayed a strong class vote against or in favor of Evo Morales. The service class
voted strongly (27% more in absolute terms) compared to the petty bourgeoisie for center-right
candidate Jorge Quiroga. Conversely, compared to the petty bourgeoisie, unskilled workers
tilted heavily toward Morales; 19% more unskilled workers voted for Morales compared to his
vote among the petty bourgeoisie (again, among unskilled workers and petty bourgeoisie who
voted for one of these two candidates).
In all countries but Chile, the results for legislative elections are very similar to those for
presidential elections (Table 7). In Chile, in legislative elections, unskilled workers and the
marginal self-employed voted more than the petty bourgeoisie for the three core parties of the
Concertación: the Christian Democrats, the Socialists, and the Party for Democracy.
For class analysis, the comparison of the working class (skilled workers, unskilled
workers, and marginal-self employed) is more politically relevant than the comparison between
the petty bourgeoisie and the service class or routine non-manual. As a simple way of
synthesizing Tables 7 and 8, Table 9 shows the percentage of statistically significant
comparisons between skilled workers, unskilled workers, or the marginal self-employed, on the
one hand, and the petty bourgeoisie, on the other. For example, in Table 7, for Argentina there
are six paired comparisons between skilled workers, unskilled workers, or the marginal self-
employed and the petty bourgeoisie. Only one of the six (17%) is statistically significant. The
final column adds the statistically significant coefficients (as an absolute value) for each
country and divides by the number of cells for that country in Table 7, and multiples by 100%.
The result is an easy-to-interpret preliminary summary measure of the strength of class voting.
For example, for Nicaragua, we took the only significant value (17%) in Table 7 in the three
working class comparisons (skilled workers, unskilled workers, and marginal self-employed)
and divided by three to derive the 5.7% figure in Table 9.
24
8/12/2019 Class Voting 13 May
http://slidepdf.com/reader/full/class-voting-13-may 25/55
Table 9 here
Countries with strong class voting are the exception rather than the norm. Using the
Erikson-Goldthorpe schema, class voting in presidential elections was weak in Argentina,
Costa Rica, the Dominican Republic, El Salvador, Honduras, Mexico, Paraguay, Uruguay, and
Venezuela.
Table 9 again registers sharp cross-country variance. Class voting in presidential
elections was strongest in Guatemala, Peru, Bolivia, Nicaragua, and Brazil. Two of the three
countries with competitive radical leftist candidates, Bolivia (with Evo Morales) and Peru (with
Ollanta Humala) had strong class voting in presidential elections. Peru also had the highest
score for the legislative vote (for Bolivia, there is no data). We believe this is not by chance. In
their discourse and sometimes in their practice, radical leftist presidents emphasize solidarity
with the poor and economic redistribution, and they often criticize the wealthy as enemies of
the nation (Hawkins 2010). Class issues have been front stage of the national political scenes in
these countries.13 We hypothesize that strong class polarization provoked by presidents and
highly competitive presidential candidates is favorable to strong class voting. In contrast, class
voting was weak for the presidency in Venezuela.
There was some class voting in legislative elections in all of these countries except
Costa Rica and El Salvador, where there was none. Peru, Chile, and Guatemala had the highest
scores for class voting in legislative elections.
Assessing Lipset’s Hypothesis with the Erikson-Goldthorpe Variable
To what degree do the Latin American cases circa 2006 support Lipset’s hypothesis that
the poor vote for the left and the wealthy for the right? Table 10 synthetically summarizes the
results of Table 7 (presidential voting) and Table 8 (legislative voting) according to class
13 On characteristics of the radical left and its differences in relation to the moderate
left, see Levitsky and Roberts (2011); Weyland et al. (2010).
25
8/12/2019 Class Voting 13 May
http://slidepdf.com/reader/full/class-voting-13-may 26/55
patterns (rather than by country). The second (presidential) and fifth (legislative) columns show
the consistency with Lipset’s hypothesis for each of the five classes other than the petty
bourgeoisie. Each major presidential candidate other than the most conservative candidate
counts as one case. The final column shows the number of statistically insignificant cases.
Table 10 here
Three findings stand out. First, the statistically significant results are overwhelmingly
consistent with Lipset’s hypothesis. For presidential voting, twenty-one of the twenty-five
statistically significant results are consistent with his theoretical expectations. For legislative
voting, all sixteen statistically significant results are consistent with his hypothesis. Overall,
then, 37 of 41 statistically significant results support Lipset.
The four exceptions are not terribly disruptive of Lipset’s claim. In two paired
comparisons, the service class voted more progressively than the petty bourgeoisie. The other
two exceptions involved campaigns with blurred ideological messages. One was the
competition between two conservative candidates (Joaquín Lavín of the UDI and Sebastián
Piñera of Renovación Nacional in Chile) among skilled workers in Chile. The other was the
competition among unskilled workers between center-right populist candidate Alvaro Uribe
and centrist Carlos Gaviria in Colombia. Unskilled workers were more likely than the petty
bourgeoisie to support Uribe.
Second, although the statistically significant results support Lipset’s hypothesis, the
solid majority of cells (76% for presidential voting and 80% for legislative voting) are not
significant. To some degree, the prevalence of non-statistical results stems from relatively small
numbers of individuals in each class—but as we saw earlier, even with the much larger number
of individuals for household wealth, class is often not a powerful factor in determining vote.
Thus, the results largely support the idea that class voting in Latin America is not strong, with
the caveat that it varies greatly by country.
26
8/12/2019 Class Voting 13 May
http://slidepdf.com/reader/full/class-voting-13-may 27/55
Third, unskilled workers and the marginal self-employed engaged in far more class
voting than other classes. These two categories occupy the bottom of the wealth hierarchy in
Latin America. The marginal self-employed have historically been known for obstacles to
collective action and political mobilization. In contemporary Latin America, however, several
leftist and center-left presidential candidates have successfully appealed to this sector. President
Lula in Brazil (-12%), center-left candidate Alvaro Colom in Guatemala (-13%), center-left
candidate Cuauhtémoc Cárdenas in Mexico (-4%), and leftist candidate Ollanta Humala in Peru
(-16%) did well among the marginal self-employed. In light of some older literatures about
their low levels of politicization and their difficulties of engaging in collective action, it is
striking that the marginal self-employed along with unskilled workers engaged in far more
class voting in legislative elections than other classes. Likewise, a handful of leftist and center-
left candidates successfully mobilized the vote of unskilled workers: Evo Morales in Bolivia (-
19%), Alvaro Colom in Guatemala (-2%), Cuauhtémoc Cárdenas in Mexico (-3%), Daniel
Ortega in Nicaragua (-17%), and Ollanta Humala in Peru (-3%). Only in Bolivia and
Nicaragua, however, was there a large difference in how leftist and center-left candidates fared
among unskilled workers compared to the petty bourgeoisie.
This pattern of leftist and center-left electoral success among unskilled workers and the
marginal self-employed was far from uniform. For example, Michelle Bachelet in Chile,
Schafik Handal in El Salvador, Tabaré Vázquez in Uruguay, and Hugo Chávez in Venezuela
did not fare statistically better among unskilled workers or the marginal self-employed than
among the petty bourgeoisie.
Results in legislative voting were very similar. Several leftist and center-left parties
have done disproportionately well among unskilled workers and/or the marginal self-employed.
Examples include the Socialists and the PPD in Chile; the PRD in Mexico; and Humala’s 2006
party, the Union for Peru (Unión por el Peru) in Peru.
27
8/12/2019 Class Voting 13 May
http://slidepdf.com/reader/full/class-voting-13-may 28/55
Table 10 shows very weak class voting by routine non-manual workers and—
surprisingly—skilled workers.
Consistency between Household Wealth and Erikson-Goldthorpe Measures of
Class
How consistent are the results between the two different measures of class? For
presidential voting, the results are very similar in ten countries. In Bolivia and Peru, there was
strong class voting with both measures of class. The results are also consistent for Brazil, Chile,
Colombia, Guatemala, Honduras, Paraguay, and Uruguay.
In Nicaragua, the household wealth measure shows no difference between Daniel
Ortega of the leftist FSLN and the Enrique Bolaños of the conservative PLC. With the Erikson-
Goldthorpe measure of class, compared to his results among the petty bourgeoisie, Ortega did
better than Bolaños in the service class, non-manual routine, and unskilled workers. Because
the three classes in which Ortega enjoyed comparative success ranged from the wealthiest in
Nicaragua (the service class) to the poor (unskilled workers, see Table 7), this finding for the
Erikson-Goldthorpe variable is consistent with the null finding for household wealth, but it
presents a more differentiated picture.
In Mexico, results were very similar in the competition between the PAN and the PRD,
but somewhat different in the competition between the PAN and the PRI. The Erikson-
Goldthorpe measure does not show any class voting between the PRI and the PAN, whereas
with household wealth, the most affluent voters were less likely than the poor (-17%) to favor
the PRI over the PAN.
In three countries, the two measures of class suggest different pictures. In Argentina, the
most affluent voters were much less likely (-53%) than the poorest to favor Cristina Fernández
rather than Roberto Lavagna. The Erikson-Goldthorpe measure detected only weak class voting
28
8/12/2019 Class Voting 13 May
http://slidepdf.com/reader/full/class-voting-13-may 29/55
among unskilled workers. In Costa Rica, affluent voters favored Ottón Solis (+37%) more than
poor voters did, but the Erikson-Goldthorpe measure shows no class voting. In El Salvador,
affluent voters supported the FMLN candidate (+24%) more than the poorest voters; again, the
Erikson-Goldthorpe measure shows no class voting.
For legislative elections, most results are again similar with the two measures of class.
For Colombia, Guatemala, Mexico, Nicaragua, and Peru, the results are strikingly similar
across both measures. For three of the four Chilean parties (not counting the reference party),
they are also similar: the Socialists, the Christian Democrats, and National Renovation. For the
Party of Democracy (PPD), the results differ some across the two measures. The PPD has the
same household wealth profile as the UDI, but with the Erikson-Goldthorpe schema, the PPD
does comparatively better than the UDI among unskilled workers and the marginal self-
employed.
Costa Rica is the outlier. As was also true in presidential voting, the two measures of
class yield different results. The wealthier voters were much more likely (+31%) than the poor
to vote for the Citizen Action Party, but the Erikson-Goldthorpe variable did not show class
voting.
How can we square the results in the three countries with important differences in
presidential voting and the one with important differences in congressional voting? We are
confident that both sets of results are correct, and we do not have an immediate answer for why
the differences are so striking. The samples are different; the Erikson-Goldthorpe variable
includes only individuals who are in the labor force. Also, the theoretical constructs are
different. The N with the household wealth measure is much higher because the Erikson-
Goldthorpe measure entails dividing respondents into six different classes. The larger N
reduces standard errors and makes it more likely to obtain a statistically significant result.
Finally, the continuous nature of the house wealth variable might make it more likely to detect
29
8/12/2019 Class Voting 13 May
http://slidepdf.com/reader/full/class-voting-13-may 30/55
differences among classes.
Change Over Time
We need to write this section
Conclusions
We need to write the conclusions. For lack of time, here we present a few bullet points.
1. Overall, class voting in Latin America is fairly modest.
2. The magnitude of class voting varies greatly by country.
3. Bolivia and Peru are the only countries that by both measures of class had strong
class voting in the 2006/08 LAPOP. They were two of the three countries with strong radical
leftist presidential candidates. Radical left candidates and presidents constantly emphasize class
issues, and as a result, the probability of sharper class divisions in elections increases.
Nevertheless, modest class voting in Venezuela shows that this tendency is not inexorable.
4. The magnitude of class voting varies greatly by class in the Erikson-Goldthorpe
schema. Unskilled workers and the marginal self-employed engaged in far more class voting
than other classes. It is not surprising that voting patterns among the service class did not
diverge markedly from those of the petty bourgeoisie. It is, however, notable that the voting
patterns of skilled workers were similar to those of the petty bourgeoisie, diverging in only four
of the thirty-seven cases (combining the presidential and legislative vote) in Table 10.
5. To the degree that there is class voting in Latin America, it is almost always
consistent with Lipset’s hypothesis. But contra Lipset’s hypothesis, strong class voting is not
the norm in most countries.
6. It is difficult to explain differences in class voting among Latin American cases based
on structural variables such as the level of poverty, the level of inequality, or the level of
development. In the 1990s, class voting was strongest in Chile and Uruguay, two of the most
30
8/12/2019 Class Voting 13 May
http://slidepdf.com/reader/full/class-voting-13-may 31/55
developed countries in the region (Torcal and Mainwaring 2003b). Circa 2006, it was strongest
in one poor country (Bolivia) and one middle income country (Peru), and it was weak in
Uruguay and modest in Chile.
31
8/12/2019 Class Voting 13 May
http://slidepdf.com/reader/full/class-voting-13-may 32/55
Table 1: Household wealth and Presidential Vote (2006-2008)
Country Candidate
andpercentage of vote in survey
Change in
votingprobabilities
frompoorest towealthiest
voters
Pseudo R-
Square
N
Argentina Cristina E. Fernández deKirchner (FPV)
(38.5%)
-
(0.53)
0.05
331
Elisa M.A. Carrio (CC)(27.1%)
233
Roberto Lavagna (UNA)(Reference) (18.8%)
-162
Average change 0.27 860
Bolivia Evo Morales (MAS)(64.1%)
-(0.52)
0.05
940
Poder Democrático Social(PODEMOS)
(Reference) (23.2%)
341
Average change 0.52 1467
Brazil Luiz I. Lula da Silva (PT, PcdoB,PRB)
(78%)
-(0.27)
0.06
836
Partido de la SocialdemocraciaBrasileña
(Reference) (19.5%)
209
Average change 0.27 1072
Chile Michelle Bachelet (Partidos porla Concertación)
(60.7%)0.02
536
Sebastián Piñera (RN)(21.4%)
189
Unión Demócrata Independiente
(Reference) (14.5%)128
Average change 0 883
Colombia Carlos Gaviria Díaz (PoloDemocrático Alternativo)
(15.8%)
+
(0.14)0.04
129
Partido Liberal(Reference) (74.6%)
611
Average change 0.14 819Costa Rica Otton Solís (PAC)
(37.3%)+
(0.37)0.04
367
Partido Liberación Nacional
(PLN)(Reference) (46.3%)
456
Average change 0.37 984
Dominican Rep. Hipólito Mejía (PRD)(26.8%)
0.02
275
Partido de la LiberaciónDominicana
(Reference) (64.7%)664
Average change 0 1026Ecuador Lucio Edwin Gutiérrez Borbua
(Partido Sociedad Patriotica 210.03 1218
32
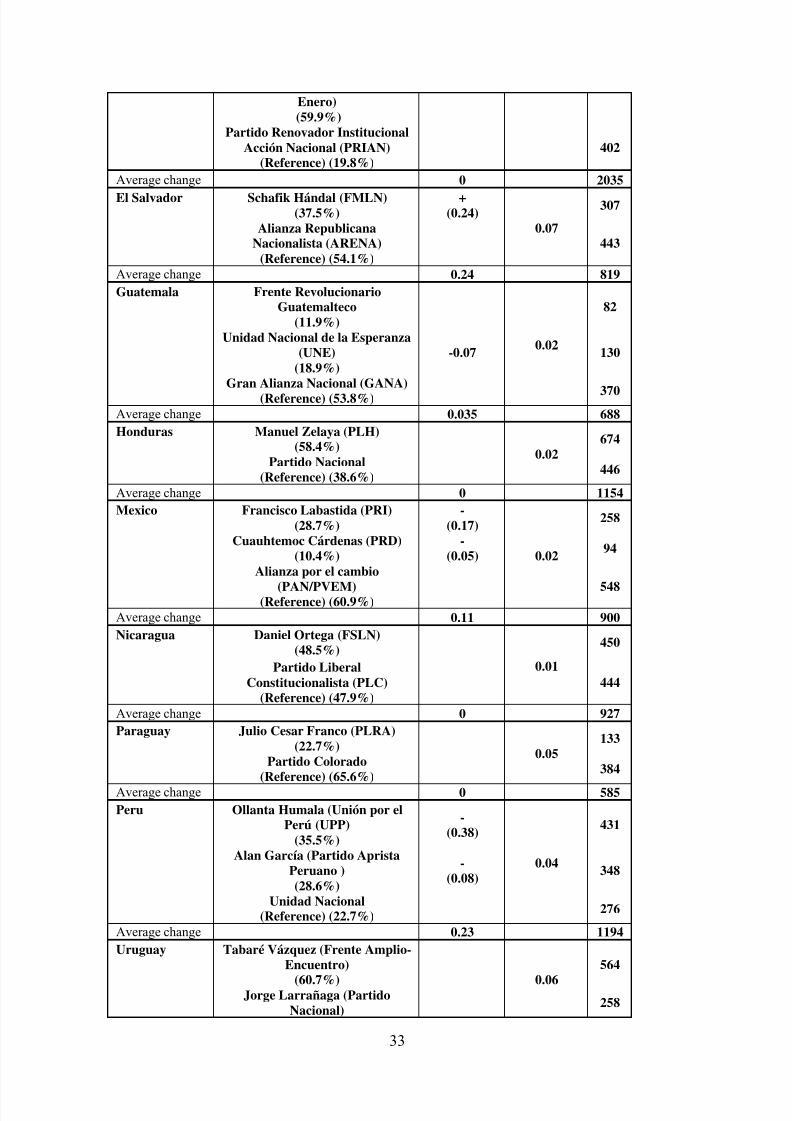
8/12/2019 Class Voting 13 May
http://slidepdf.com/reader/full/class-voting-13-may 33/55
Enero)
(59.9%)Partido Renovador Institucional
Acción Nacional (PRIAN)(Reference) (19.8%)
402
Average change 0 2035
El Salvador Schafik Hándal (FMLN)(37.5%)
+(0.24)
0.07
307
Alianza RepublicanaNacionalista (ARENA)
(Reference) (54.1%)
443
Average change 0.24 819
Guatemala Frente RevolucionarioGuatemalteco
(11.9%)
0.02
82
Unidad Nacional de la Esperanza(UNE)
(18.9%)
-0.07 130
Gran Alianza Nacional (GANA)(Reference) (53.8%) 370
Average change 0.035 688
Honduras Manuel Zelaya (PLH)(58.4%)
0.02674
Partido Nacional(Reference) (38.6%)
446
Average change 0 1154
Mexico Francisco Labastida (PRI)
(28.7%)
-
(0.17)
0.02
258
Cuauhtemoc Cárdenas (PRD)(10.4%)
-(0.05)
94
Alianza por el cambio
(PAN/PVEM)(Reference) (60.9%)
548
Average change 0.11 900
Nicaragua Daniel Ortega (FSLN)(48.5%)
0.01
450
Partido Liberal
Constitucionalista (PLC)(Reference) (47.9%)
444
Average change 0 927
Paraguay Julio Cesar Franco (PLRA)
(22.7%)0.05
133
Partido Colorado(Reference) (65.6%)
384
Average change 0 585
Peru Ollanta Humala (Unión por elPerú (UPP)
(35.5%)
-(0.38)
0.04
431
Alan García (Partido ApristaPeruano )
(28.6%)
-(0.08)
348
Unidad Nacional(Reference) (22.7%)
276
Average change 0.23 1194
Uruguay Tabaré Vázquez (Frente Amplio-Encuentro)
(60.7%) 0.06
564
Jorge Larrañaga (PartidoNacional)
258
33
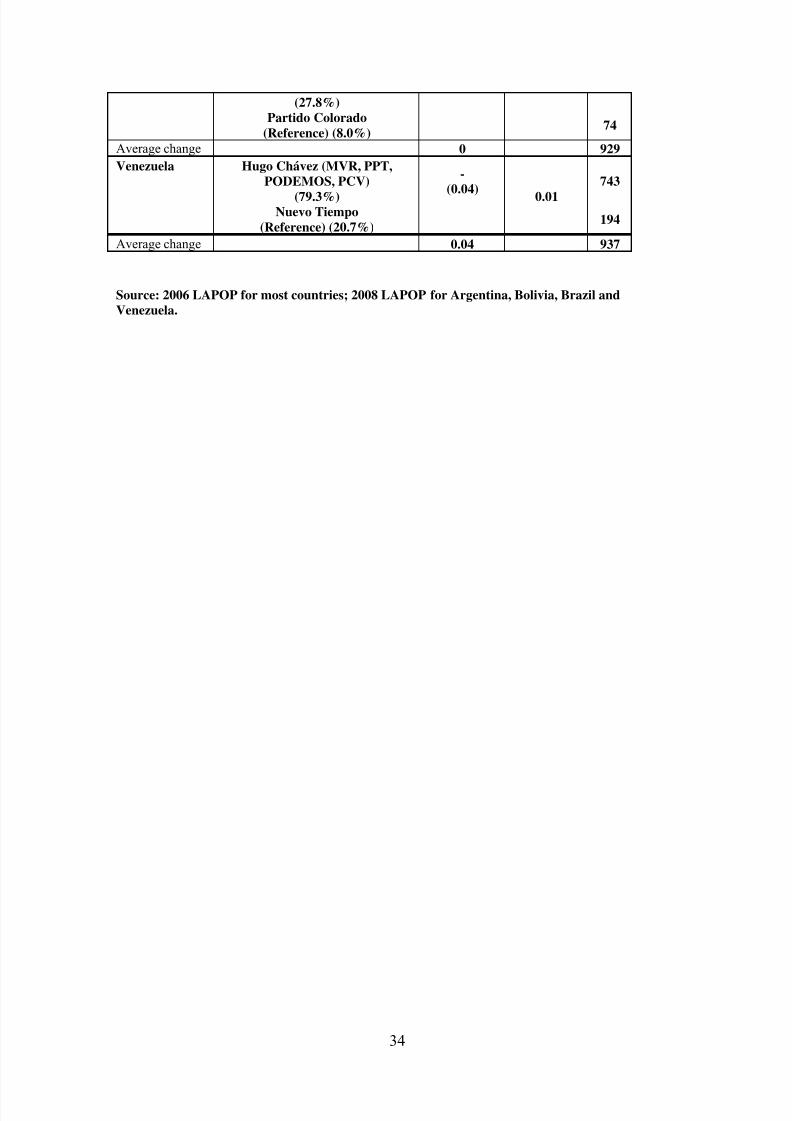
8/12/2019 Class Voting 13 May
http://slidepdf.com/reader/full/class-voting-13-may 34/55
(27.8%)Partido Colorado
(Reference) (8.0%)74
Average change 0 929
Venezuela Hugo Chávez (MVR, PPT,PODEMOS, PCV)
(79.3%)
-(0.04)
0.01
743
Nuevo Tiempo
(Reference) (20.7%)194
Average change 0.04 937
Source: 2006 LAPOP for most countries; 2008 LAPOP for Argentina, Bolivia, Brazil andVenezuela.
34
8/12/2019 Class Voting 13 May
http://slidepdf.com/reader/full/class-voting-13-may 35/55
Table 2Summary of statistical associations between household wealth and first round
presidential vote by country
Country Year of presidential
election priorto 2006/2008
LAPOP survey
number of pairedcomparisons in
which higherhousehold wealth is
associated with
more conservative
presidential vote
number of pairedcomparisons in
which higherhousehold wealth is
associated with
more leftist
presidential vote
number of pairedcomparisons with
no significantassociations
Argentina 2007 1 0 1
Bolivia 2005 1 0 0
Brazil 2006 1 0 0
Chile 2005 0 0 2
Colombia 2002 0 1 0
Costa Rica 2006 0 1 0
Dom. Republic 2004 0 0 1Ecuador 2002 0 0 1
El Salvador 2004 0 1 0
Guatemala 2003 1 0 1
Honduras 2005 0 0 1
Mexico 2000 2 0 0
Nicaragua 2001 0 0 1
Peru 2006 2 0 0
Paraguay 2003 0 0 1
Uruguay 2004 0 0 1
Venezuela 2006 1 0 0
Total - 9 3 10
Source: Based on Table 1
35

8/12/2019 Class Voting 13 May
http://slidepdf.com/reader/full/class-voting-13-may 36/55
Table 3: Household wealth and Legislative Voting in Latin America (2006-2008)
Countries Political partyand
percentage of vote
Change invoting
probabilitiesfrom poorest
to wealthiestvoters
PseudoR-
Square
N
Chile Partido Socialista(22.0%)
-0.08
0.01
Partido por la Democracia(20.1%)
Partido Demócrata Cristiano
(19.8%)
-
0.23Renovación Nacional
(18.9%)UDI (reference)
Average change 0.08 582
Colombia Polo Democrático Independiente(11.3%)
Partido de la U(24%)
Partido Liberal (reference)
Average change 0 513
Costa Rica PAC(31.8%)
+0.31
PLN (reference)
Average change 0.31 916
El Salvador FMLN(45.1%)
+0.27
0.06
ARENA (reference)
Average change 0.27 834Ecuador Partido Social Cristiano
(20.7%)0.04Partido Sociedad Patriotica 21 de
Enero(25.4%)
Izquierda Democrática(12.1%)
Partido Renovador Institucional
Acción Nacional (PRIAN)(reference)
Average change 0 1490
Guatemala Frente Republicano
Guatemalteco(13.8%)
0.03Unidad Nacional de la Esperanza
(UNE)(17.2%)
Partido Avanzada Nacional
(14.7%)
Gran Alianza Nacional (GANA)(reference)
Average change 0 470
Mexico PRI
(40.4%)
-
0.290.03
PRD(18.0%)PAN (reference)
36
8/12/2019 Class Voting 13 May
http://slidepdf.com/reader/full/class-voting-13-may 37/55
Average change 0.15 687
Nicaragua FSLN(55.1%)
+0.10
0.02Partido LiberalConstitucionalista (PLC)
(reference)
Average change 0.10 744Peru Unión por el Perú (UPP)
(19.7%)-
(0.16)
0.05
Partido Aprista Peruano(APRA)
(26.9%)
-(0.03)
Alianza por el Futuro(12.4%)
Unidad Nacional (reference)
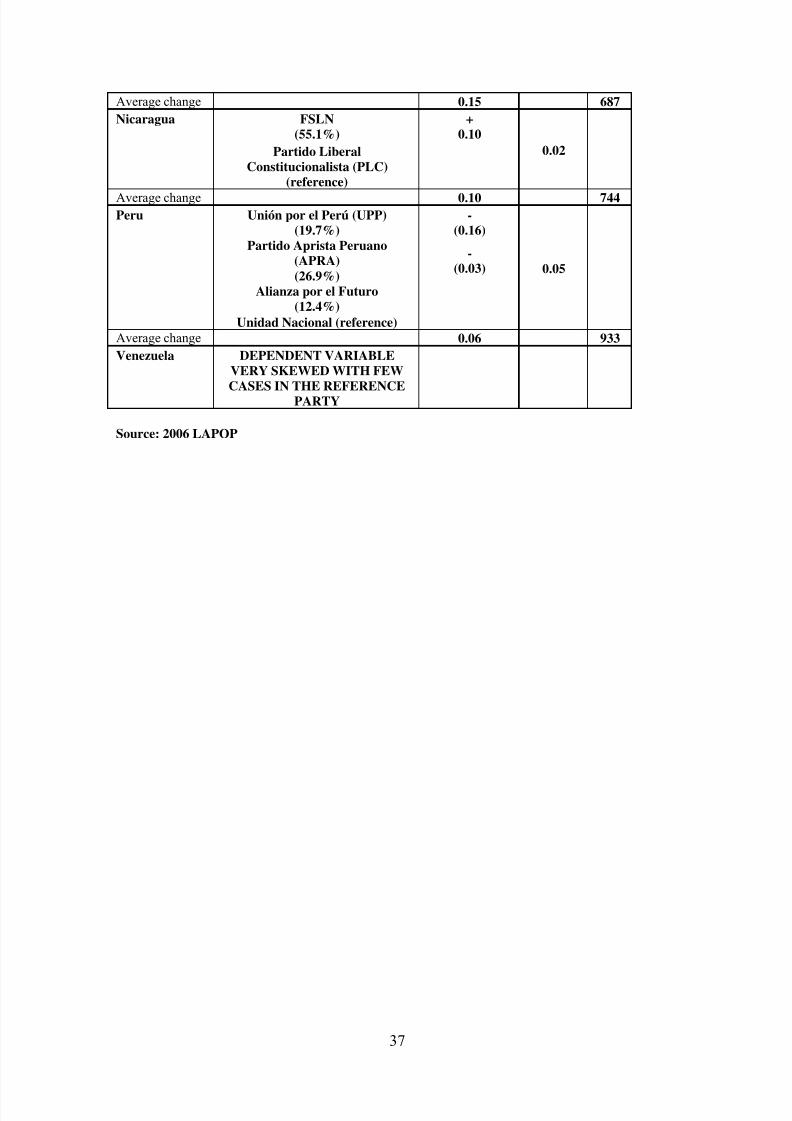
Average change 0.06 933
Venezuela DEPENDENT VARIABLEVERY SKEWED WITH FEWCASES IN THE REFERENCE
PARTY
Source: 2006 LAPOP
37
8/12/2019 Class Voting 13 May
http://slidepdf.com/reader/full/class-voting-13-may 38/55
Table 4Summary of statistical associations between household wealth and legislative vote
by country
Country number of paired
comparisons in
which higher
household wealth
is associated with
more conservative
vote
number of paired
comparisons in
which higher
household wealth
is associated with
more leftist vote
number of paired
comparisons with
no significant
associations
Similar to or
somewhat
different from
results for
presidential voting
Chile 2 0 2 different
Colombia 0 0 2 different
Costa Rica 0 1 0 similar
Ecuador 0 0 2 similar
El Salvador 0 1 1 similar
Guatemala 0 0 3 similarMexico 1 0 1 different
Nicaragua 0 1 0 different
Peru 2 0 0 same
Total 5 3 11
Source: Based on Table 3
38
8/12/2019 Class Voting 13 May
http://slidepdf.com/reader/full/class-voting-13-may 39/55
Table 5Distribution of Erikson-Goldthorpe Classes by Country
Servi
Class
Petty
Bourgeoi
Routine
Non-Ma
Skilled
Workers
Unskille
Workers
Marginal
self-employed
Total Numbe Per capita
Argentina 7.0 22.9 23.3 8.8 34.7 4.4 100 731 NA
Bolivia 3.9 14.9 17.8 4.2 15.7 43.4 100 1393 4,350
Brazil 4.2 23.9 13.1 3.7 30.0 25.0 100 593 10,093
Chile 13.8 22.8 13.4 14.0 30.7 5.4 100 636 14,520
Colombia 6.3 25.2 9.8 11.3 21.9 25.6 100 767 8,479
Costa Ric 12.8 31.1 11.8 15.1 26.1 3.1 100 704 10,453
Dominica
Republic
5.6 22.6 12.8 9.0 26.7 23.3 100 703 8,387
Guatemala 3.2 19.7 13.1 3.8 22.7 37.6 100 758 4,297
Honduras 2.6 17.3 10.0 7.0 32.0 31.2 100 770 3,519
Mexico 6.5 31.2 10.9 11.2 26.8 13.4 100 753 12,481
Nicaragua 3.0 13.9 10.7 3.6 21.9 46.9 100 698 3,249
Paraguay 2.2 22.7 7.2 6.3 23.3 38.3 100 695 4,626
Peru 5.8 18.5 14.4 7.6 12.1 41.8 100 780 8,555
El Salvad 6.9 16.5 11.0 11.4 24.5 29.6 100 709 5,978
Uruguay 7.3 22.6 16.8 18.7 31.2 3.5 100 603 12,642
Venezuela 5.9 28.1 23.4 17.2 16.1 9.2 100 726 10,973
Source: Based on LAPOP 2006 for all countries except Argentina, Bolivia, Brazil, and
Venezuela; based on LAPOP 2008 for Argentina, Bolivia, Brazil, and Venezuela.
Source for per capita GDP in 2010: World Bank, World Development Indicators,
Purchasing Parity Power, constant 2005 international dollars.
39
8/12/2019 Class Voting 13 May
http://slidepdf.com/reader/full/class-voting-13-may 40/55
Table 6: Mean Household Wealth by Erikson-Goldthorpe Class and Country
Service
Class
Petty
Bourgeois
Routine
Non-Manua
Skilled
Workers
Unskilled
Workers
Marginal Poor
employed
Country
Mean
Number
Argentina 3.0 1.9 1.9 1.8 1.6 -0.6 1.3 1487
Bolivia 2.6 0.7 -0.4 -1.4 -0.9 -1.9 -1.0 2976
Brazil 2.8 1.7 1.3 1.0 0.6 -1.2 0.5 1487
Chile 3.3 1.8 1.7 1.4 0.8 -1.0 1.3 1517
Colombia 2.8 1.1 0.8 0.8 -0.5 -1.1 0.1 1491
Costa Rica 3.3 2.1 2.1 1.8 0.9 -0.7 1.6 1500
Dominican
Republic
2.9 1.1 0.4 0.4 -0.6 -1.6 -0.2 1516
Guatemala 3.1 1.2 0.6 0.6 -0.7 -1.8 -0.5 1498
Honduras 3.0 1.1 0.4 -0.0 -1.1 -2.0 -0.6 1585
Mexico 3.2 1.6 1.6 1.3 0.6 -1.3 0.7 1560
Nicaragua 2.7 0.3 -0.2 -0.2 -1.5 -2.1 -1.4 1762
Paraguay 2.7 1.0 0.2 0.6 -0.7 -1.8 -0.5 1160
Peru 2.6 0.6 0.1 0.5 -0.3 -1.7 -0.5 1500
El Salvador 2.9 1.0 0.4 0.3 -1.2 -1.8 -0.5 1729
Uruguay 3.3 2.0 2.1 1.6 0.8 -0.8 1.2 1200
Venezuela 3.1 1.6 1.7 1.2 0.7 -1.1 1.1 1510
Source: Based on LAPOP 2006 for all countries except Argentina, Bolivia, Brazil, and
Venezuela; based on LAPOP 2008 for Argentina, Bolivia, Brazil, and Venezuela.
40
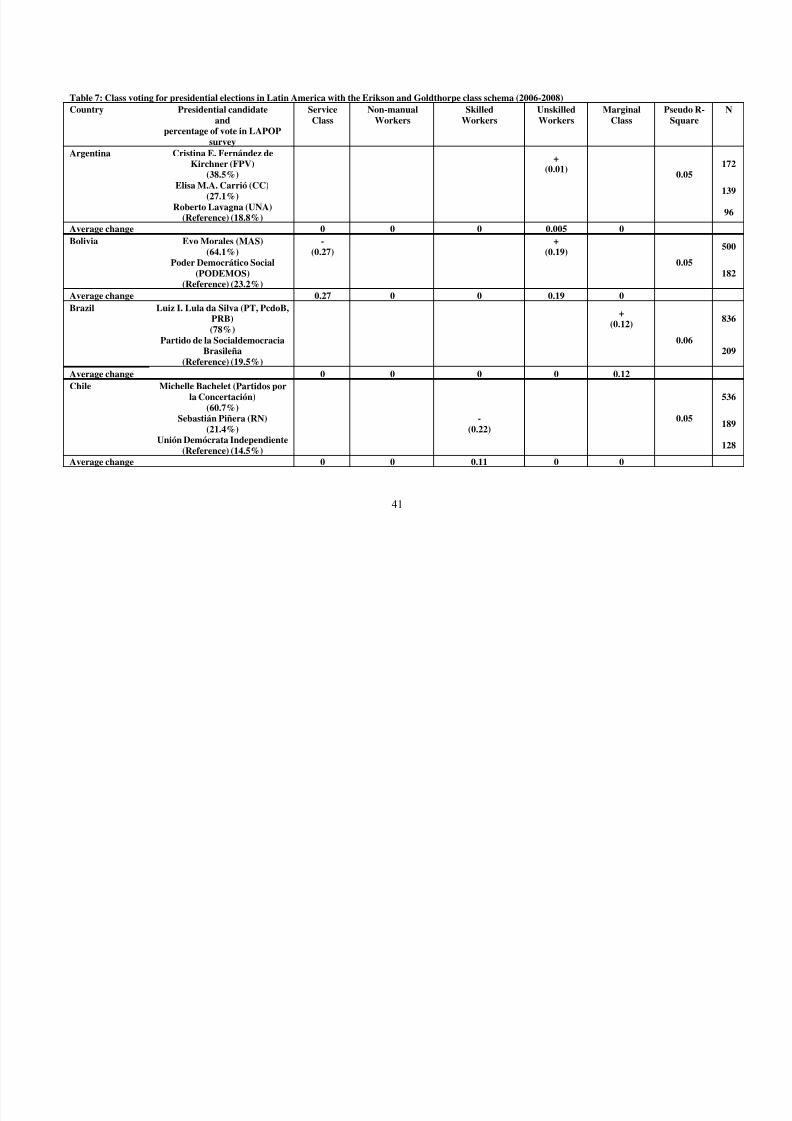
8/12/2019 Class Voting 13 May
http://slidepdf.com/reader/full/class-voting-13-may 41/55
Table 7: Class voting for presidential elections in Latin America with the Erikson and Goldthorpe class schema (2006-2008)
Country Presidential candidateand
percentage of vote in LAPOPsurvey
ServiceClass
Non-manualWorkers
SkilledWorkers
UnskilledWorkers
MarginalClass
Pseudo R-Square
N
Argentina Cristina E. Fernández deKirchner (FPV)
(38.5%)
+(0.01)
0.05172
Elisa M.A. Carrió (CC)
(27.1%)139
Roberto Lavagna (UNA)(Reference) (18.8%)
96
Average change 0 0 0 0.005 0
Bolivia Evo Morales (MAS)(64.1%)
-(0.27)
+(0.19)
0.05
500
Poder Democrático Social(PODEMOS)
(Reference) (23.2%)182
Average change 0.27 0 0 0.19 0
Brazil Luiz I. Lula da Silva (PT, PcdoB,PRB)(78%)
+(0.12)
0.06
836
Partido de la SocialdemocraciaBrasileña
(Reference) (19.5%)209
Average change 0 0 0 0 0.12
Chile Michelle Bachelet (Partidos porla Concertación)
(60.7%)0.05
536
Sebastián Piñera (RN)(21.4%)
-(0.22)
189
Unión Demócrata Independiente(Reference) (14.5%)
128
Average change 0 0 0.11 0 0
41
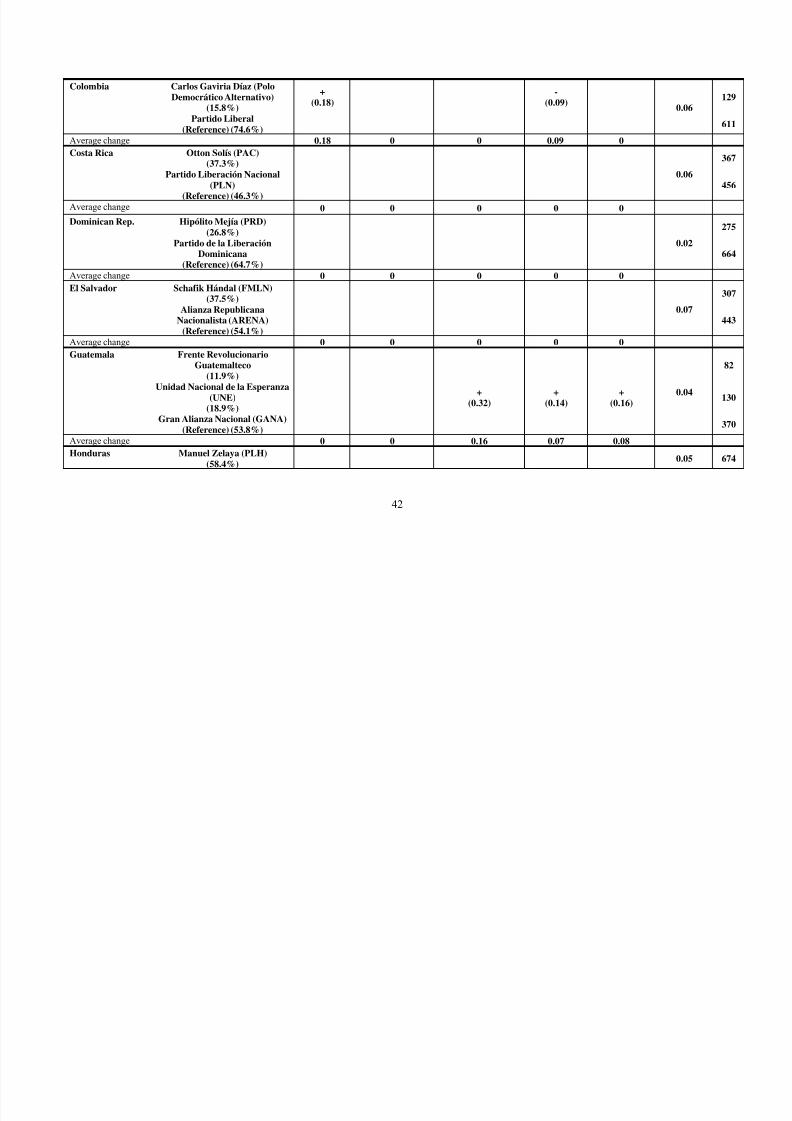
8/12/2019 Class Voting 13 May
http://slidepdf.com/reader/full/class-voting-13-may 42/55
Colombia Carlos Gaviria Díaz (PoloDemocrático Alternativo)
(15.8%)
+(0.18)
-(0.09)
0.06129
Partido Liberal(Reference) (74.6%)
611
Average change 0.18 0 0 0.09 0
Costa Rica Otton Solís (PAC)(37.3%)
0.06
367
Partido Liberación Nacional(PLN)
(Reference) (46.3%)
456
Average change 0 0 0 0 0
Dominican Rep. Hipólito Mejía (PRD)(26.8%)
0.02
275
Partido de la LiberaciónDominicana
(Reference) (64.7%)664
Average change 0 0 0 0 0
El Salvador Schafik Hándal (FMLN)(37.5%)
0.07
307
Alianza RepublicanaNacionalista (ARENA)
(Reference) (54.1%)443
Average change 0 0 0 0 0
Guatemala Frente RevolucionarioGuatemalteco
(11.9%)
0.04
82
Unidad Nacional de la Esperanza(UNE)
(18.9%)
+(0.32)
+(0.14)
+(0.16)
130
Gran Alianza Nacional (GANA)(Reference) (53.8%)
370
Average change 0 0 0.16 0.07 0.08
Honduras Manuel Zelaya (PLH)(58.4%)
0.05 674
42
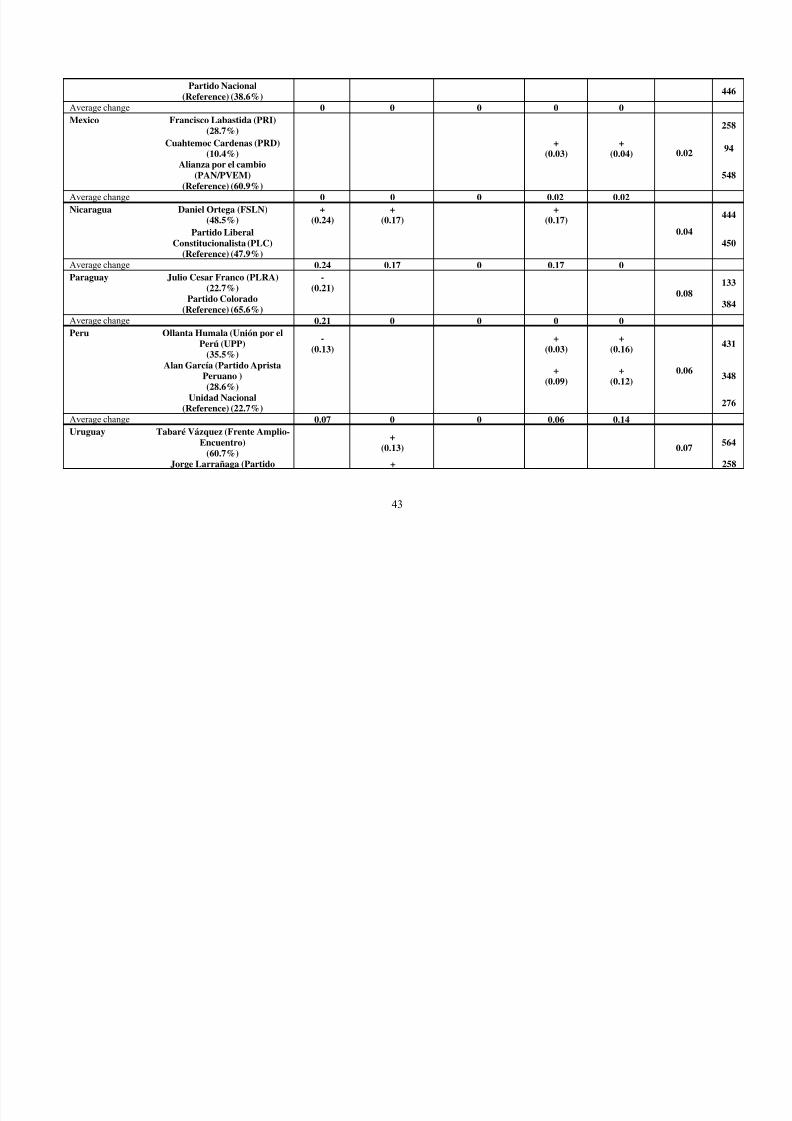
8/12/2019 Class Voting 13 May
http://slidepdf.com/reader/full/class-voting-13-may 43/55
Partido Nacional(Reference) (38.6%)
446
Average change 0 0 0 0 0
Mexico Francisco Labastida (PRI)(28.7%)
0.02
258
Cuahtemoc Cardenas (PRD)(10.4%)
+(0.03)
+(0.04)
94
Alianza por el cambio(PAN/PVEM)
(Reference) (60.9%)548
Average change 0 0 0 0.02 0.02Nicaragua Daniel Ortega (FSLN)
(48.5%)+
(0.24)+
(0.17)+
(0.17)
0.04
444
Partido LiberalConstitucionalista (PLC)
(Reference) (47.9%)450
Average change 0.24 0.17 0 0.17 0
Paraguay Julio Cesar Franco (PLRA)(22.7%)
-(0.21)
0.08133
Partido Colorado(Reference) (65.6%)
384
Average change 0.21 0 0 0 0
Peru Ollanta Humala (Unión por elPerú (UPP)
(35.5%)
-(0.13)
+(0.03)
+(0.16)
0.06
431
Alan García (Partido ApristaPeruano )(28.6%)
+(0.09)
+(0.12)
348
Unidad Nacional(Reference) (22.7%)
276
Average change 0.07 0 0 0.06 0.14
Uruguay Tabaré Vázquez (Frente Amplio-Encuentro)
(60.7%)
+(0.13) 0.07
564
Jorge Larrañaga (Partido + 258
43
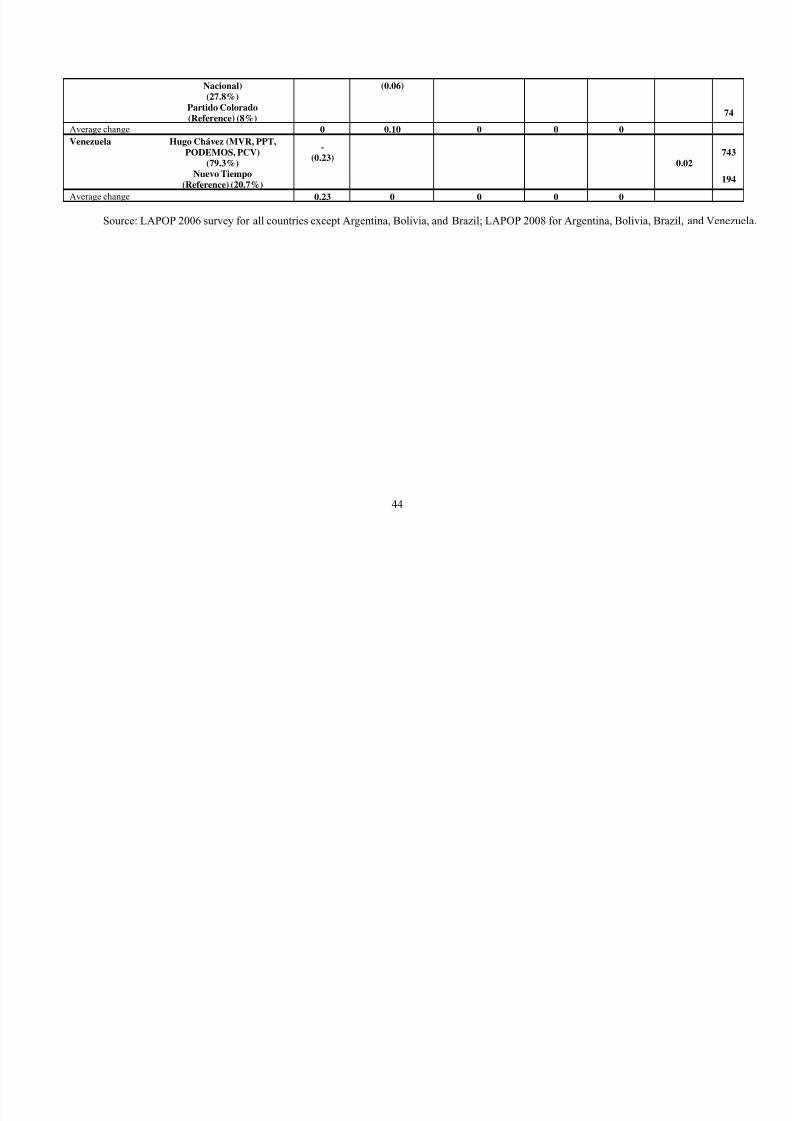
8/12/2019 Class Voting 13 May
http://slidepdf.com/reader/full/class-voting-13-may 44/55
Nacional)(27.8%)
(0.06)
Partido Colorado(Reference) (8%)
74
Average change 0 0.10 0 0 0
Venezuela Hugo Chávez (MVR, PPT,PODEMOS, PCV)
(79.3%)
-(0.23)
0.02743
Nuevo Tiempo(Reference) (20.7%)
194
Average change 0.23 0 0 0 0
Source: LAPOP 2006 survey for all countries except Argentina, Bolivia, and Brazil; LAPOP 2008 for Argentina, Bolivia, Brazil, and Venezuela.
44
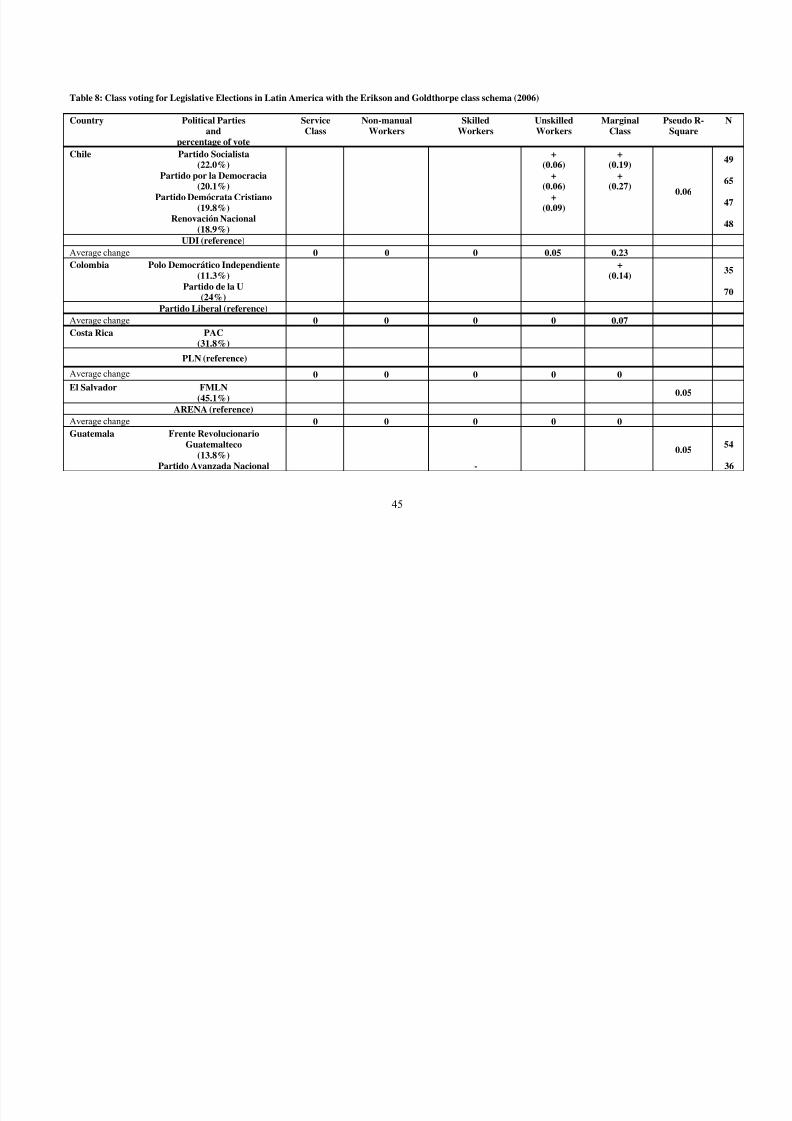
8/12/2019 Class Voting 13 May
http://slidepdf.com/reader/full/class-voting-13-may 45/55
Table 8: Class voting for Legislative Elections in Latin America with the Erikson and Goldthorpe class schema (2006)
Country Political Partiesand
percentage of vote
ServiceClass
Non-manualWorkers
SkilledWorkers
UnskilledWorkers
MarginalClass
Pseudo R-Square
N
Chile Partido Socialista(22.0%)
+(0.06)
+(0.19)
0.06
49
Partido por la Democracia(20.1%)
+(0.06)
+(0.27)
65
Partido Demócrata Cristiano(19.8%)
+(0.09)
47
Renovación Nacional(18.9%)
48
UDI (reference)
Average change 0 0 0 0.05 0.23
Colombia Polo Democrático Independiente(11.3%)
+(0.14)
35
Partido de la U(24%)
70
Partido Liberal (reference)
Average change 0 0 0 0 0.07
Costa Rica PAC(31.8%)
PLN (reference)
Average change 0 0 0 0 0
El Salvador FMLN(45.1%) 0.05
ARENA (reference)
Average change 0 0 0 0 0
Guatemala Frente RevolucionarioGuatemalteco
(13.8%)0.05
54
Partido Avanzada Nacional - 36
45
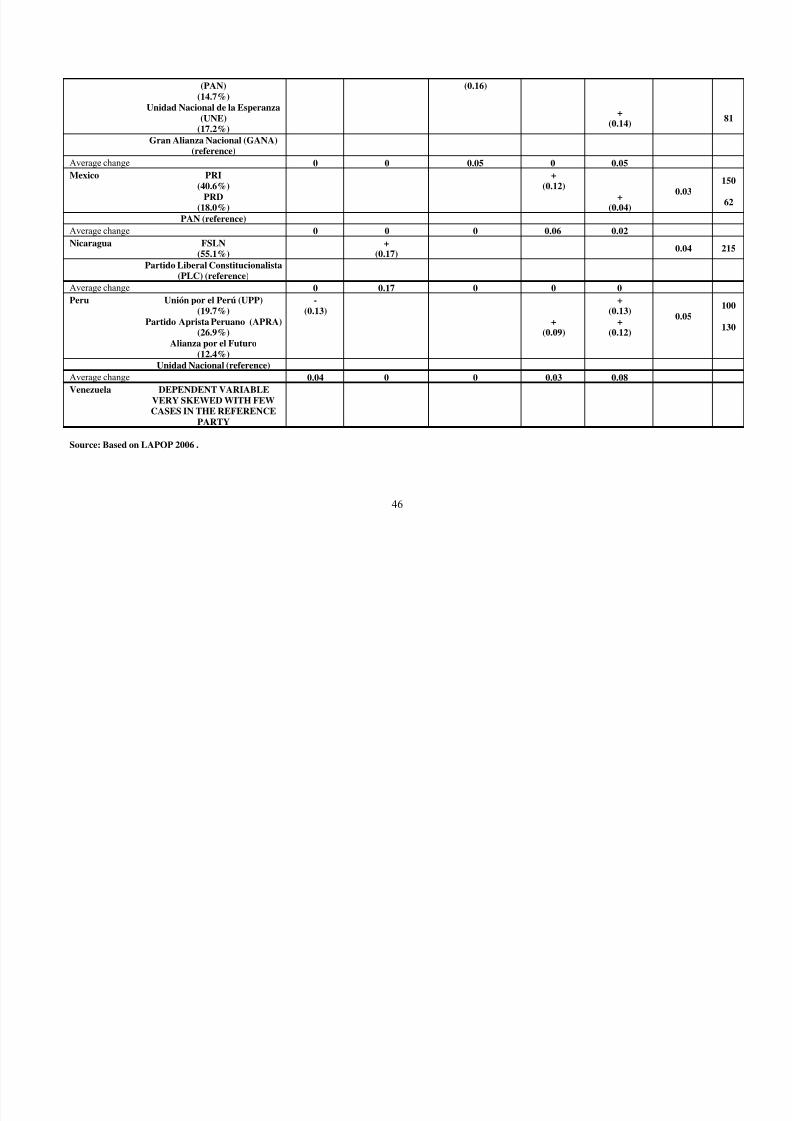
8/12/2019 Class Voting 13 May
http://slidepdf.com/reader/full/class-voting-13-may 46/55
(PAN)(14.7%)
(0.16)
Unidad Nacional de la Esperanza(UNE)
(17.2%)
+(0.14)
81
Gran Alianza Nacional (GANA)(reference)
Average change 0 0 0.05 0 0.05
Mexico PRI(40.6%)
+(0.12)
0.03
150
PRD(18.0%)
+(0.04)
62
PAN (reference)
Average change 0 0 0 0.06 0.02
Nicaragua FSLN(55.1%)
+(0.17)
0.04 215
Partido Liberal Constitucionalista(PLC) (reference)
Average change 0 0.17 0 0 0
Peru Unión por el Perú (UPP)(19.7%)
-(0.13)
+(0.13)
0.05100
Partido Aprista Peruano (APRA)(26.9%)
+(0.09)
+(0.12)
130
Alianza por el Futuro(12.4%)
Unidad Nacional (reference)
Average change 0.04 0 0 0.03 0.08
Venezuela DEPENDENT VARIABLEVERY SKEWED WITH FEWCASES IN THE REFERENCE
PARTY
Source: Based on LAPOP 2006 .
46
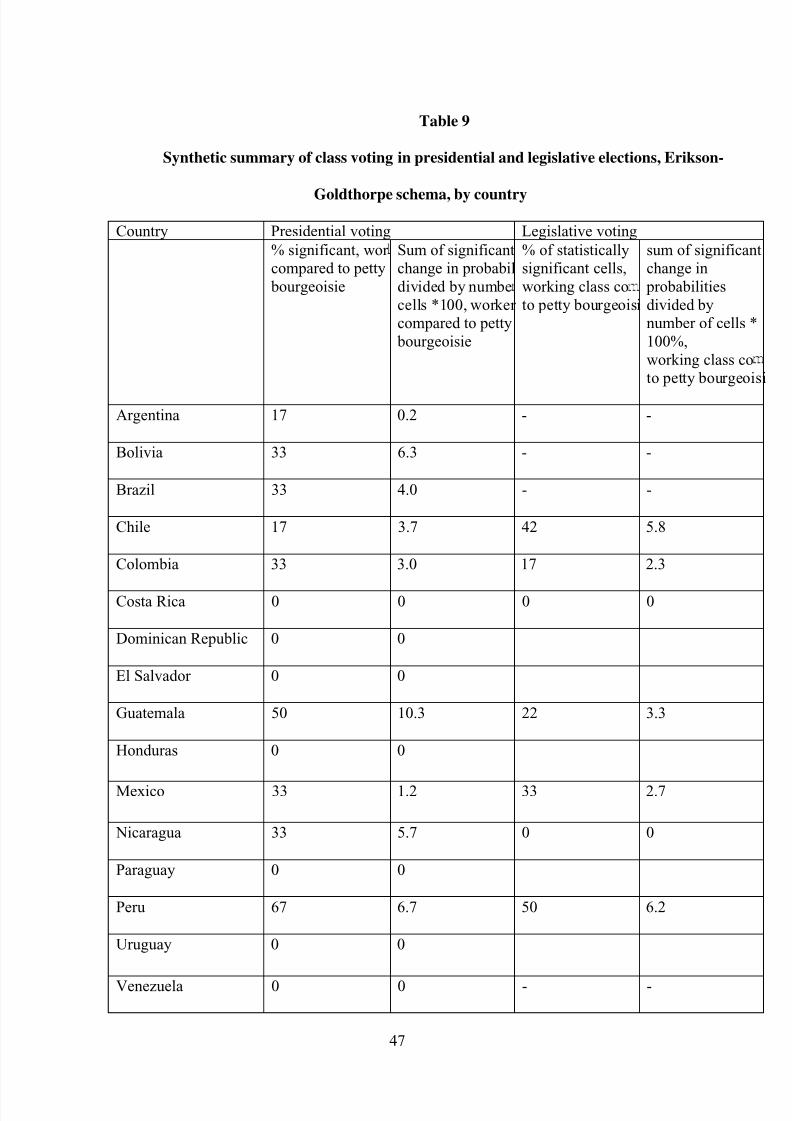
8/12/2019 Class Voting 13 May
http://slidepdf.com/reader/full/class-voting-13-may 47/55
Table 9
Synthetic summary of class voting in presidential and legislative elections, Erikson-
Goldthorpe schema, by country
Country Presidential voting Legislative voting
% significant, wor
compared to petty
bourgeoisie
Sum of significant
change in probabil
divided by numbe
cells *100, worker
compared to petty
bourgeoisie
% of statistically
significant cells,
working class co
to petty bourgeoisi
sum of significant
change in
probabilities
divided by
number of cells *
100%,
working class co
to petty bourgeoisi
Argentina 17 0.2 - -
Bolivia 33 6.3 - -
Brazil 33 4.0 - -
Chile 17 3.7 42 5.8
Colombia 33 3.0 17 2.3
Costa Rica 0 0 0 0
Dominican Republic 0 0
El Salvador 0 0
Guatemala 50 10.3 22 3.3
Honduras 0 0
Mexico 33 1.2 33 2.7
Nicaragua 33 5.7 0 0
Paraguay 0 0
Peru 67 6.7 50 6.2
Uruguay 0 0
Venezuela 0 0 - -
47
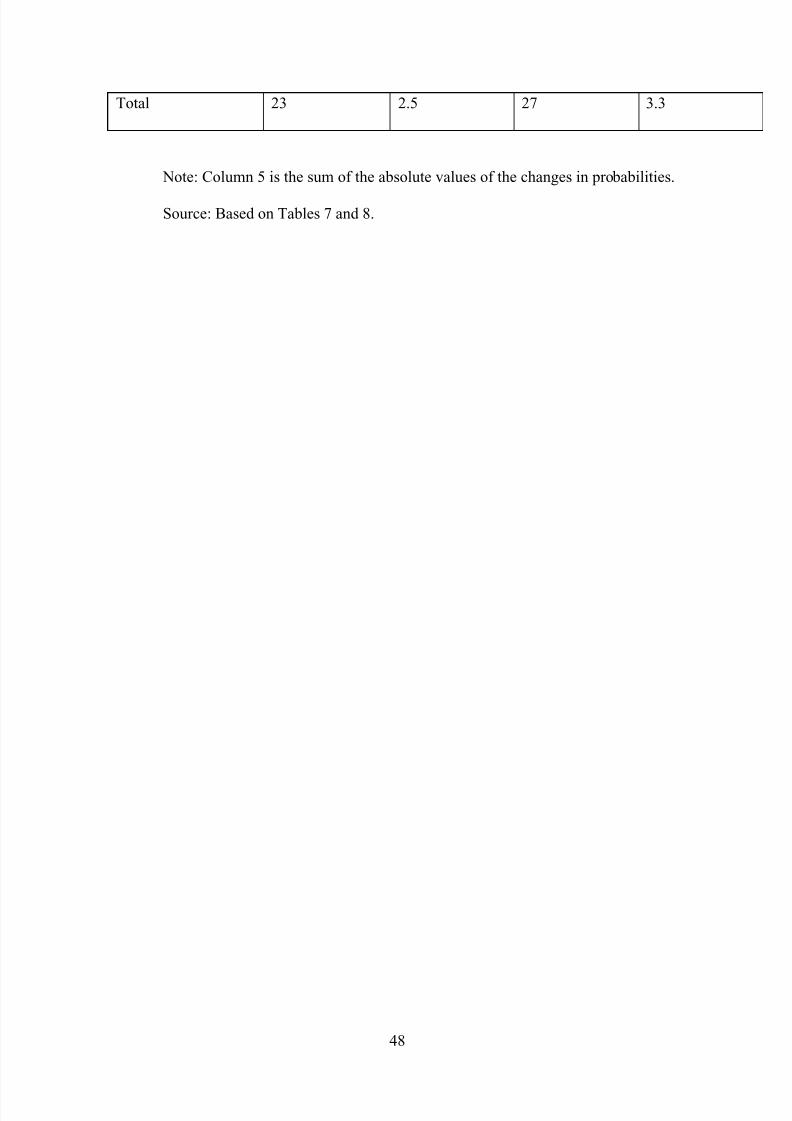
8/12/2019 Class Voting 13 May
http://slidepdf.com/reader/full/class-voting-13-may 48/55
Total 23 2.5 27 3.3
Note: Column 5 is the sum of the absolute values of the changes in probabilities.
Source: Based on Tables 7 and 8.
48
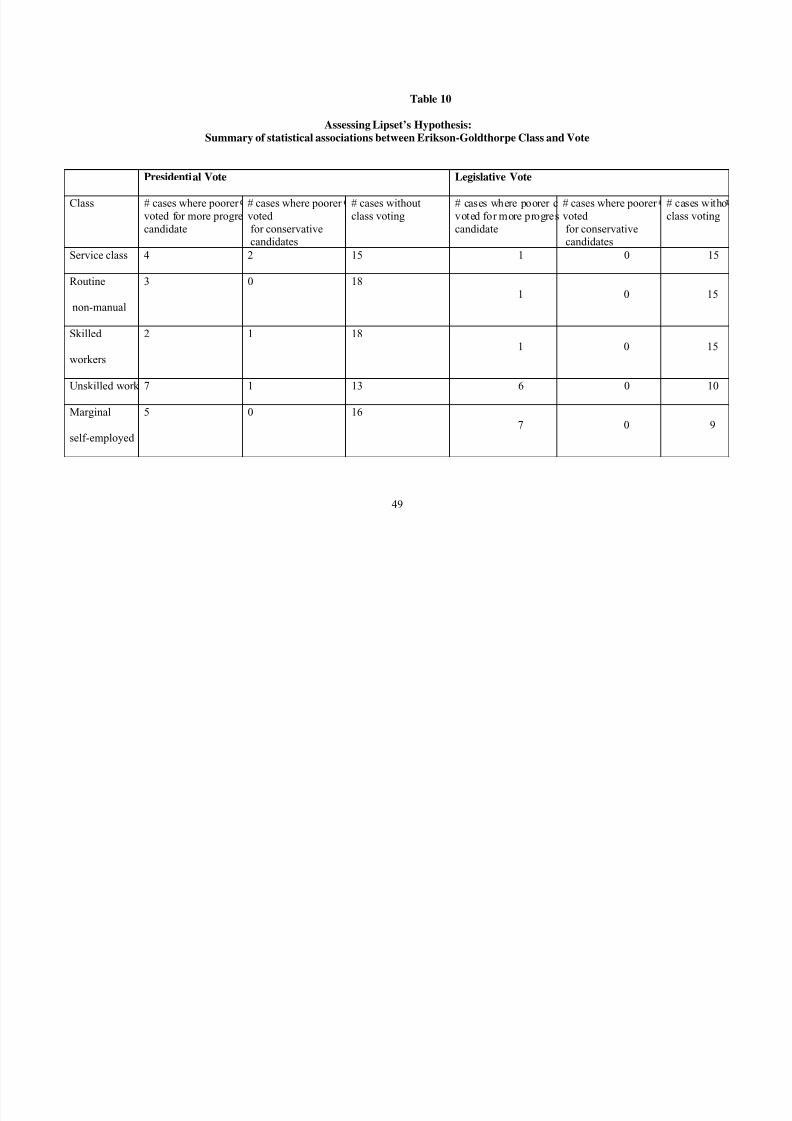
8/12/2019 Class Voting 13 May
http://slidepdf.com/reader/full/class-voting-13-may 49/55
Table 10
Assessing Lipset’s Hypothesis:Summary of statistical associations between Erikson-Goldthorpe Class and Vote
Presidential Vote Legislative Vote
Class # cases where poorer
voted for more progre
candidate
# cases where poorer
voted
for conservativecandidates
# cases without
class voting
# cases where poorer c
voted for more progres
candidate
# cases where poorer
voted
for conservativecandidates
# cases witho
class voting
Service class 4 2 15 1 0 15
Routine
non-manual
3 0 18
1 0 15
Skilled
workers
2 1 18
1 0 15
Unskilled work 7 1 13 6 0 10
Marginal
self-employed
5 0 16
7 0 9
49
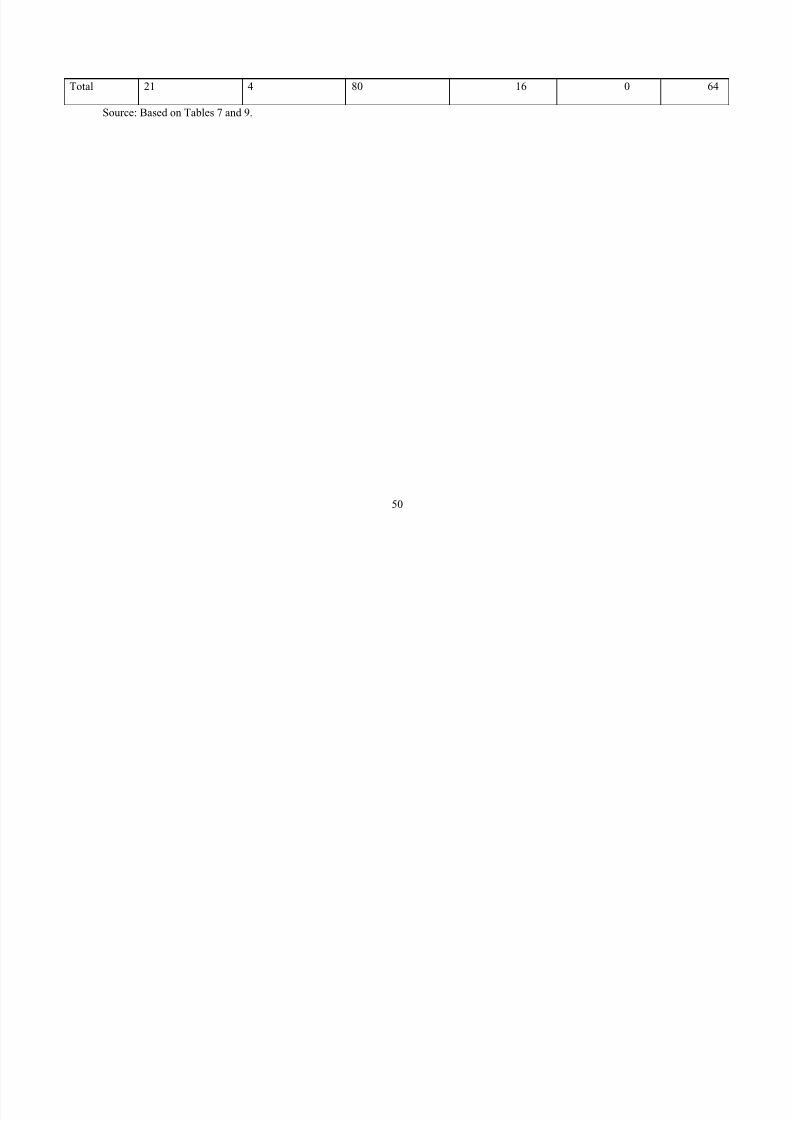
8/12/2019 Class Voting 13 May
http://slidepdf.com/reader/full/class-voting-13-may 50/55
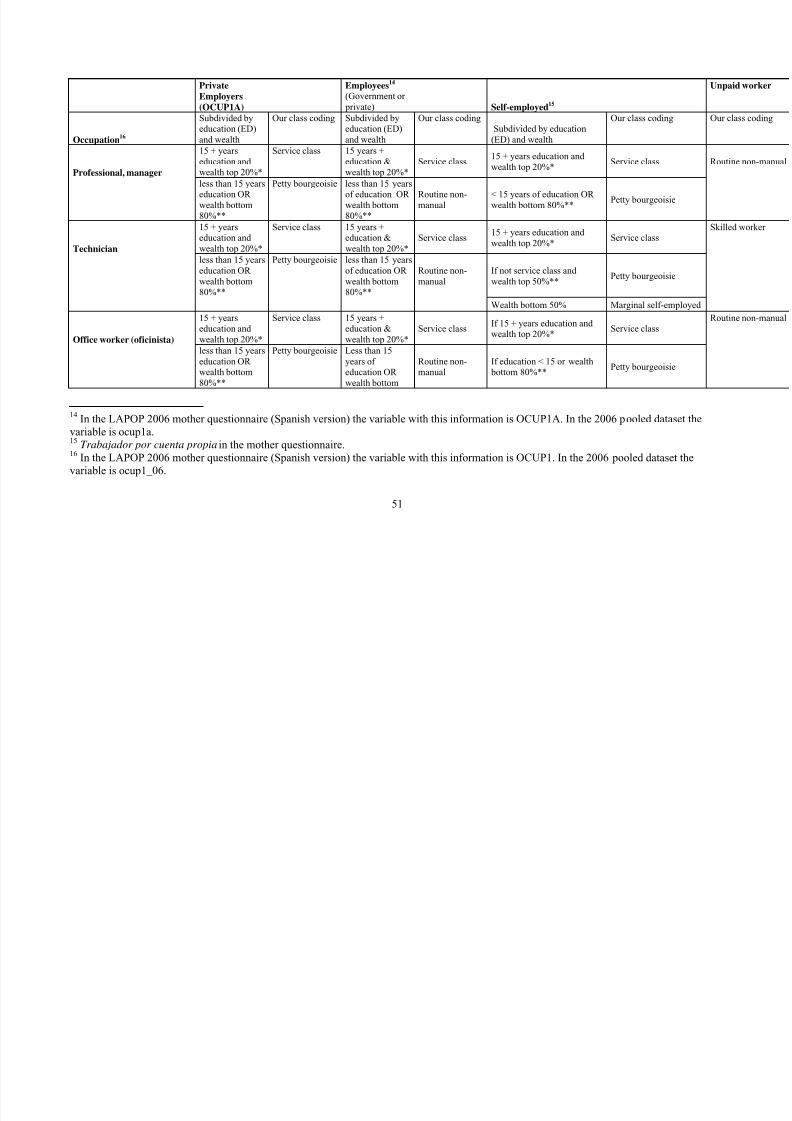
8/12/2019 Class Voting 13 May
http://slidepdf.com/reader/full/class-voting-13-may 51/55
PrivateEmployers(OCUP1A)
Employees14
(Government or
private) Self-employed15
Unpaid worker
Occupation16
Subdivided byeducation (ED)
and wealth
Our class coding Subdivided byeducation (ED)
and wealth
Our class codingSubdivided by education
(ED) and wealth
Our class coding Our class coding
Professional, manager
15 + years
education andwealth top 20%*
Service class 15 years +
education &wealth top 20%*
Service class15 + years education and
wealth top 20%*Service class Routine non-manual
less than 15 years
education ORwealth bottom80%**
Petty bourgeoisie less than 15 years
of education ORwealth bottom80%**
Routine non-manual
< 15 years of education ORwealth bottom 80%**
Petty bourgeoisie
Technician
15 + yearseducation and
wealth top 20%*
Service class 15 years +education &
wealth top 20%*
Service class15 + years education and
wealth top 20%*Service class
Skilled worker
less than 15 years
education OR
wealth bottom80%**
Petty bourgeoisie less than 15 years
of education OR
wealth bottom80%**
Routine non-
manual
If not service class and
wealth top 50%**Petty bourgeoisie
Wealth bottom 50% Marginal self-employed
Office worker (oficinista)
15 + yearseducation and
wealth top 20%*
Service class 15 years +education &
wealth top 20%*
Service classIf 15 + years education andwealth top 20%*
Service classRoutine non-manual
less than 15 years
education ORwealth bottom
80%**
Petty bourgeoisie Less than 15
years ofeducation OR
wealth bottom
Routine non-manual
If education < 15 or wealth bottom 80%**
Petty bourgeoisie
14 In the LAPOP 2006 mother questionnaire (Spanish version) the variable with this information is OCUP1A. In the 2006 pooled dataset the
variable is ocup1a.15
Trabajador por cuenta propia in the mother questionnaire.16
In the LAPOP 2006 mother questionnaire (Spanish version) the variable with this information is OCUP1. In the 2006 pooled dataset the
variable is ocup1_06.
51
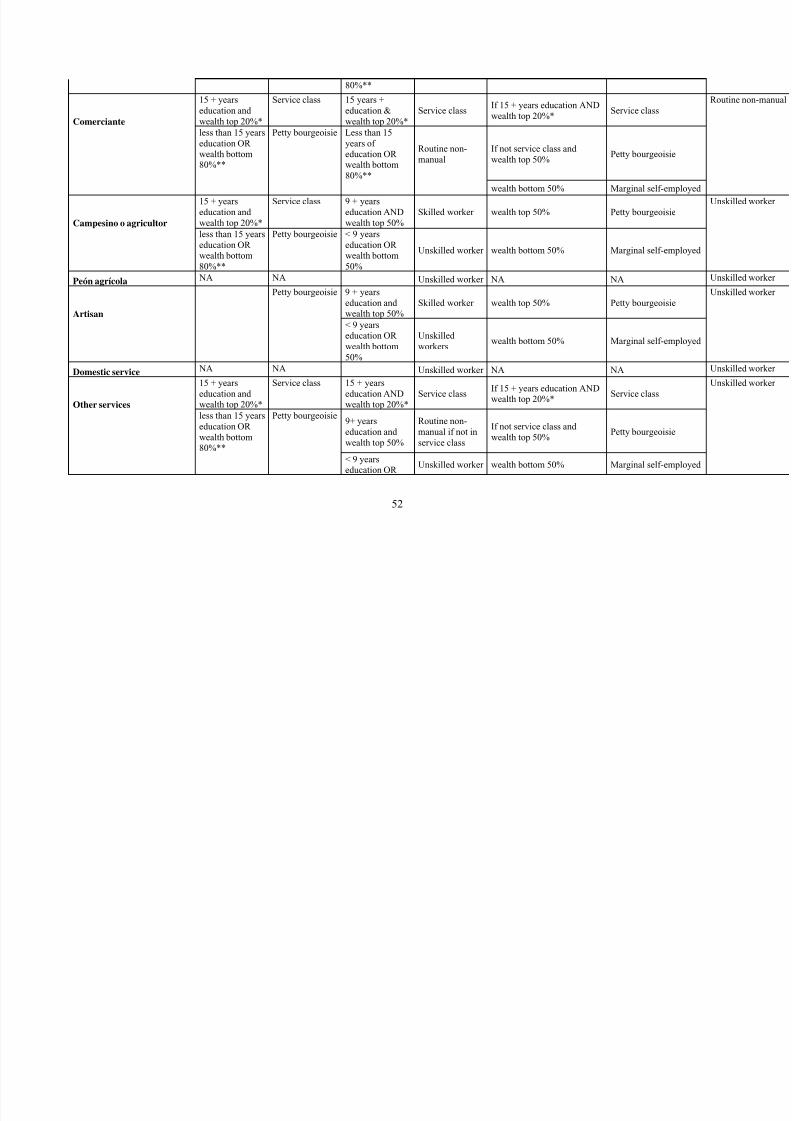
8/12/2019 Class Voting 13 May
http://slidepdf.com/reader/full/class-voting-13-may 52/55
80%**
Comerciante
15 + years
education and
wealth top 20%*
Service class 15 years +
education &
wealth top 20%*
Service classIf 15 + years education AND
wealth top 20%*Service class
Routine non-manual
less than 15 years
education ORwealth bottom80%**
Petty bourgeoisie Less than 15
years ofeducation ORwealth bottom
80%**
Routine non-
manual
If not service class and
wealth top 50%Petty bourgeoisie
wealth bottom 50% Marginal self-employed
Campesino o agricultor
15 + years
education and
wealth top 20%*
Service class 9 + years
education AND
wealth top 50%
Skilled worker wealth top 50% Petty bourgeoisie
Unskilled worker
less than 15 years
education ORwealth bottom
80%**
Petty bourgeoisie < 9 years
education ORwealth bottom
50%
Unskilled worker wealth bottom 50% Marginal self-employed
Peón agrícola NA NA Unskilled worker NA NA Unskilled worker
Artisan
Petty bourgeoisie 9 + years
education andwealth top 50%
Skilled worker wealth top 50% Petty bourgeoisie
Unskilled worker
< 9 yearseducation OR
wealth bottom
50%
Unskilled
workerswealth bottom 50% Marginal self-employed
Domestic service NA NA Unskilled worker NA NA Unskilled worker
Other services
15 + years
education andwealth top 20%*
Service class 15 + years
education ANDwealth top 20%*
Service class If 15 + years education ANDwealth top 20%* Service class
Unskilled worker
less than 15 years
education OR
wealth bottom80%**
Petty bourgeoisie9+ years
education and
wealth top 50%
Routine non-
manual if not in
service class
If not service class and
wealth top 50%Petty bourgeoisie
< 9 yearseducation OR
Unskilled worker wealth bottom 50% Marginal self-employed
52
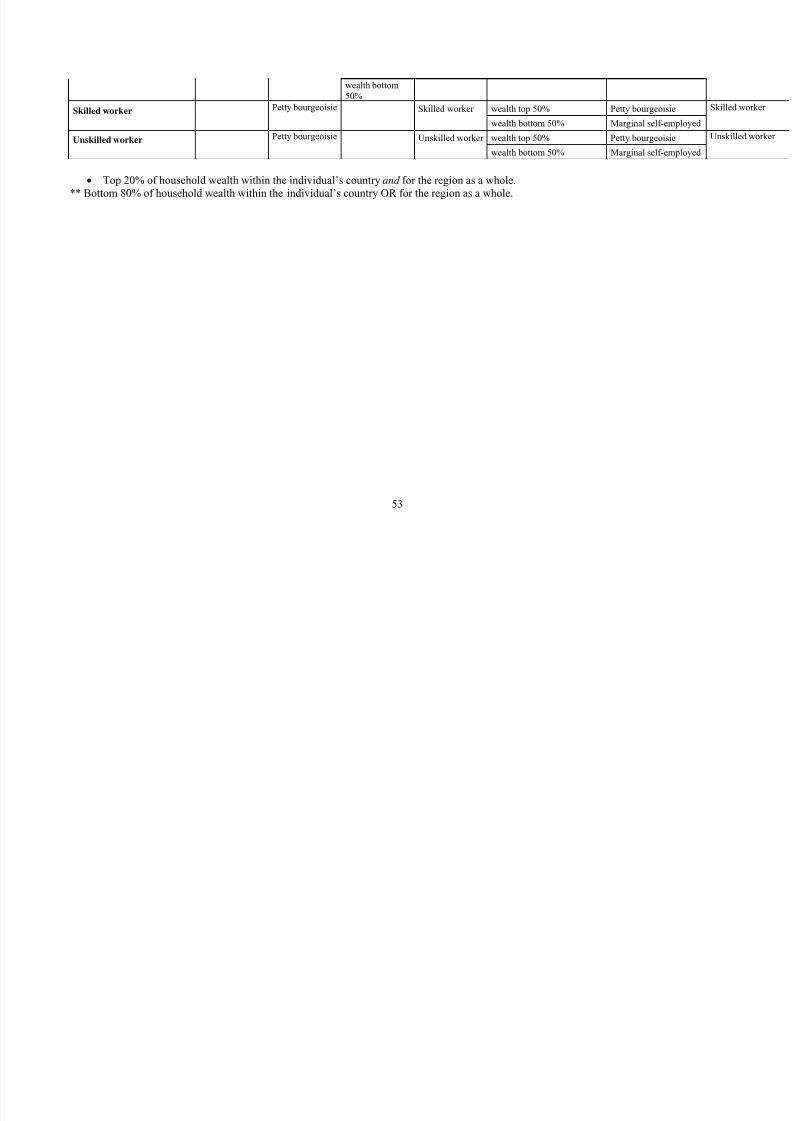
8/12/2019 Class Voting 13 May
http://slidepdf.com/reader/full/class-voting-13-may 53/55
wealth bottom
50%
Skilled worker Petty bourgeoisie Skilled worker wealth top 50% Petty bourgeoisie Skilled worker
wealth bottom 50% Marginal self-employed
Unskilled worker Petty bourgeoisie Unskilled worker wealth top 50% Petty bourgeoisie Unskilled worker
wealth bottom 50% Marginal self-employed
• Top 20% of household wealth within the individual’s country and for the region as a whole.
** Bottom 80% of household wealth within the individual’s country OR for the region as a whole.
53
8/12/2019 Class Voting 13 May
http://slidepdf.com/reader/full/class-voting-13-may 54/55
References
Booth, John A., and Mitchell A. Seligson. 2009. The Legitimacy Puzzle in Latin America:
Political Support and Democracy in Eight Nations. New York: Cambridge University
Press.
Cameron, Maxwell A. «Political Parties and the Worker-Employer Cleavage: The Impact ofthe Informal Sector on Voting in Lima, Peru». Bulletin of Latin American Research 10,
n.o 3 (1991): 293-313.
Canton, Darío, y Jorge Raúl Jorrat. «Economic Evaluations, Partisanship, and Social Bases
of Presidential Voting in Argentina, 1995 and 1999». International Journal of Public
Opinion Research 14, n.o 4 (2002): 413-427.
Carnes, Nicholas and Noam Lupu. 2012. “Rethinking the comparative perspective on class
and representation: evidence from Latin America”. Work in progress downloaded from
http://www.noamlupu.com/research.html
Cataife, Guido. «An Integrated Model of Vote Choice in Argentina, 2009». Latin American
Politics and Society 53, n.o 3 (2011): 115–140.
Clark, Terry N. 2001. “The Debate Over “Are Social Classes Dying?" In Terry NicholsClark and Seymour Martin Lipset, eds., The Breakdown of Class Politics: A Debate on
Post-Industrial Stratification, pp. 273-319. Washington DC: The Woodrow Wilson
Center Press/Johns Hopkins University Press.
Collier, Ruth Berins, y David Collier. Shaping The Political Arena. 1.a ed. University of
Notre Dame Press, 2002.
Coppedge, Michael. "The evolution of Latin American party systems." Politics, society, and
democracy: Latin America (1998): 171-206.
Córdova, Abby. (2009). Methodological note: measuring relative wealth using household
asset indicators. LAPOP Insights Series No. I0806 .
Dix, Robert H. «Cleavage Structures and Party Systems in Latin America». Comparative
Politics 22, n.o 1 (1989): 23-37.
Domínguez, Jorge I., y James A. McCann. «Shaping Mexico’s Electoral Arena: The
Construction of Partisan Cleavages in the 1988 and 1991 National Elections». The
American Political Science Review 89, n.o 1 (1995): 34-48.
Erikson, Robert and John H. Goldthorpe. 1992. The Constant Flux: A Study of Class
Mobility in Industrial Societies. Oxford: Clarendon.
Evans, Geoffrey. 1992. “Testing the Validity of the Goldthorpe Class Schema.” European
Sociological Review 8: 211-232.
____________. 1999. “Class Voting: From Premature Obituary to Reasoned Appraisal.” In
Geoffrey Evans, ed., The End of Class Politics? Class Voting in Comparative Context ,
pp. 1-20. Oxford: Oxford University Press.Handlin, Samuel. «Social Protection and the Politicization of Class Cleavages During Latin
America’s Left Turn». Comparative Political Studies (2012).
Handlin, Samuel. «Survey Research and Social Class in Venezuela: Evaluating Alternative
Measures and Their Impact on Assessments of Class Voting». Latin American Politics
and Society 55, 1(2013): 141–167.Heath, Oliver. «Explaining the Rise of Class Politics in Venezuela». Bulletin of Latin
American Research 28, 2 (2009a): 185–203.
Heath, Oliver. «Economic crisis, party system change, and the dynamics of class voting in
Venezuela, 1973–2003». Electoral Studies 28, 3: 467-479 (2009b).
Hunter, Wendy and Timothy J. Power. «Rewarding Lula: Executive Power, Social Policy,
and the Brazilian Elections of 2006». Latin American Politics and Society 49 1(2007):1–30.
54
8/12/2019 Class Voting 13 May
http://slidepdf.com/reader/full/class-voting-13-may 55/55
Kitschelt, H., Hawkins, K. A., Luna, J. P., Rosas, G., & Zechmeister, E. J. (2010). Latin
American party systems. Cambridge University Press.
Klesner, Joseph L. «Electoral Competition and the New Party System in Mexico». Latin
American Politics and Society 47:2 (2005): 103-142.
Levitsky, Steven and Kenneth M. Roberts, eds. 2011. The Resurgence of the Latin American
Left . Baltimore: Johns Hopkins University Press.Lipset, Seymour Martin. 1960. Political Man: The Social Bases of Politics. Garden City,
NY: Doubleday and Co.
Lupu, Noam. «Who Votes for chavismo?: Class Voting in Hugo Chávez’s Venezuela». Latin
American Research Review 45, n.o 1 (2010): 7-32.
Lupu, Noam, y Susan C. Stokes. «The Social Bases of Political Parties in Argentina, 1912–
2003». Latin American Research Review 44, n.o 1 (2009): 58-87.
Mainwaring, Scott, and Timothy R. Scully. Building democratic institutions: Party systems
in Latin America. Stanford University Press, 1995.
Roberts, Kenneth M. «Social Inequalities Without Class Cleavages in Latin America’s
Neoliberal Era». Studies in Comparative International Development 36, n.o 4 (2002): 3-
33.Roberts, Kenneth M., y Moisés Arce. «Neoliberalism and Lower-Class Voting Behavior in
Peru». Comparative Political Studies 31, 2 (1998): 217-246.
Scully, Timothy. Rethinking the Center: Party Politics in Nineteenth-And Twentieth-Century
Chile. Stanford University Press, 1992.
Singer, André. “Raízes Sociais e Ideológicas do Lulismo”. Novos Estudos 85. November
2009:83-102.
Torcal, Mariano, and Scott Mainwaring. «The Political Recrafting of Social Bases of Party
Competition: Chile, 1973–95». British Journal of Political Science 33, n.o 01 (2003a):
55-84.
Torcal, Mariano and Scott Mainwaring. “Individual level anchoring of the vote and party
system stability: Latin America and Western Europe”. Working Paper 17/2003,
Departamento de Ciencia Política y Relaciones Internacionales, Facultad de Derecho,
Universidad Autónoma de Madrid (2003b).
Valenzuela, J. Samuel, Timothy R. Scully, y Nicolás Somma. «The Enduring Presence of
Religion in Chilean Ideological Positionings and Voter Options». Comparative Politics
40, n.o 1 (2007): 1-20..
Zucco, Cesar. «The President’s ‘New’ Constituency: Lula and the Pragmatic Vote in Brazil’s
2006 Presidential Elections». Journal of Latin American Studies 40, n.o 01 (2008): 29-
49.


![Chapter 2 Review Name: Class Pd. Chapter 2 Weighted Voting ... · Chapter 2 Weighted Voting Systems: ... In the weighted voting system [q: 30, 29, 16, 8, 3, 1] a two-thirds majority](https://img.pdfslide.net/doc/110x75/5abfcb967f8b9aa15e8e7214/chapter-2-review-name-class-pd-chapter-2-weighted-voting-2-weighted-voting.jpg)