Embed Size (px)
Citation preview

Energy Problems; Energy Policy; Energy Efficiency gy y
Classes without QuizzesClasses without Quizzes
J SJames SweeneyStanford University
Director, Precourt Institute for Energy EfficiencyProfessor, Management Science and Engineering
1

Three Public Policy Drivers for Energy Policy
• Environmental ProtectionGl b l Cli t Ch
Energy Policy
• Global Climate Change
• Securityy• Oil/International vulnerability• Vulnerability of infrastructure to terrorism, natural
disaster or human errordisaster, or human error
• Economics (Public policy and private sector issues)P i f l t i it li t l• Prices of electricity, gasoline, natural gas
• Price volatility: oil, natural gas, wholesale electricity• Management for energy efficiency can be very
2
profitable

Environmental
3

Fossil fuels account for• 98% of the US carbon dioxide net• 98% of the US carbon dioxide net
releases into the atmosphere
• 82% of the releases of greenhouse gases measured on a carbongases, measured on a carbon equivalent basis.
4

U.S. CO2 Emissions 2005
600
equi
vale
nt
Natural Gas
400
500
year
Car
bon Petroleum
Coal
Trucks
Air
300
tonn
es p
er y Trucks
Buses
100
200
Mill
ions
of t
LDVs
0
100
Residential Commercial Industrial Transportation Electricity
5
Source: U.S. EPA Inventory of Greenhouse Gas Emissions, April 2007
Residential Commercial Industrial Transportation Electricity Generation

U.S. CO2 Emissions 2005
600
equi
vale
nt
Through ElectricityNatural Gas
400
500
ear
Car
bon
e
PetroleumCoal Air
300
400
onne
s pe
r ye Trucks Buses
200
Mill
ions
of t
o
DV
0
100M LDVs
6
Source: U.S. EPA Inventory of Greenhouse Gas Emissions, April 2007
Residential Commercial Industrial Transportation

Energy Security Issues
7

• Production of oil concentrated into unstable• Production of oil concentrated into unstable areas of the world
• Sudden supply reductions can sharply increaseSudden supply reductions can sharply increase oil price– Short run demand elasticity aboutShort run demand elasticity about
- 0.1 to - 0.2– Percentage price increase will be 5 to 10Percentage price increase will be 5 to 10
times the percentage supply reduction• Sudden oil price increases can lead toSudden oil price increases can lead to
worldwide recession• Petroleum revenues fund terrorist activities
8

World Oil Use (84.7 Million Barrels Per Day): 2006Crude Oil, Natural Gas Plant Liquids, and Other Liquids
North America29%
Asia & Oceania29%
Central & South America
Africa4%
7%
Eurasia
Middle East7%
9
Europe19%
Eurasia5%

World Oil Production (84.5 Million Barrels Per Day): 2007Crude Oil, Natural Gas Plant Liquids, and Other Liquids
North America17%
Asia & Oceania10%
17%
Africa13%
Central & South America
9%
Europe6%
Eurasia15%
Middle East30%
10
15%

Oil and Gas Reserves, Billion Barrels Oil Equivalent
Saudi Aramco (Saudi Arabia) 302 ExxonMobil 23National Iranian Oil Co 302 Pertamina (Indonesia) 22Gazprom (Russia) 198 Lukoil (Russia) 21Gazprom (Russia) 198 Lukoil (Russia) 21Iraqi National Oil Co 136 BP 19Qatar Petroleum 133 Pemex (Mexico) 19( )Kuwait Petroleum Co 109 PetroChina 19Petroleos de Venezuela 105 Shell 16Ad (Ab Dh bi) 80 Y k (R i ) 13Adnoc (Abu Dhabi) 80 Yukos (Russia) 13Nigerian Natnl Petroleum Co 41 Chevron 12Sonatrach (Algeria) 38 Petrobras (Brazil) 12( g ) ( )Libya NOC 31 Total (France) 11Rosneft (Russia) 28 Surgutneftgas (Russia) 9P t (M l i ) 26Petronas (Malaysia) 26
State Owned/Controlling Interest. Private Sector Owned

Energy - Economic Issues
12

Crude Oil prices• Crude Oil prices are currently high
• Prices on futures markets suggest that crude oil prices are most likely to further increase
• World demand continues to grow• Development of China and increase in the number of
passenger cars• India is likely to follow
• Expectation that conventional oil supply may peak soon
• Incentives for dominant suppliers to limit investment in new ppproduction capacity so as to keep prices
• Incentives for dominant suppliers to keep future prices
13
pp p puncertain so as to limit competitive investments

Crude Oil Futures Prices: As of Eight DatesAs of Jan 16 2007 As of May 23 2007A f S t 14 2007 A fJ 10 2008
$135$140$145$150
As of Sept 14, 2007 As ofJan 10, 2008As of May 7 2008 As of May 22, 2008As of June 20, 2008 As of Oct 10 2008
$110$115$120$125$130$135
$85$90$95
$100$105$110
$60$65$70$75$80$85
$50$55$60
Jan-2
Jul-20
Jan-2
Jul-2 0
Jan-2
Jul-2 0
Jan-2
Jul-2 0
Jan-2
Jul-2 0
Jan-2
Jul-2 0
Dec-2
Jul-20
Dec-2
Jun-2
Dec- 2
Jun-2
Dec- 2
Jun-2
Dec- 2007
007
008
008
009
009
010
010
011
011
012
012
2012
013
2013
014
2014
015
2015
016
2016
Delivery Date

Energy Efficiency:
Economically Efficient R d ti i E UReductions in Energy Use
Intensityy
15

US Energy Consumption By Fuel
45
40 40 40
35
40
45
23 2322 2223 2425
30 20052006
Qua
ds)
15
202007
sum
ptio
n (Q
8.1
2.7 3.2
0.3 0.06 0.18
8.2
2.9 3.4
0.3 0.07 0.26
8.4
2.53.6
0.3 0.08 0.32
5
10
Con
s
0.06 0 80.070.080
Petrole
um Coal
Natural
Gas
Nuclea
rHyd
roelec
tric
Biomas
s
Geothe
rmal
Solar/P
V
Wind
16Source: EIA, Annual Energy ReviewN Hy G
Fuel

Energy Efficiency Compared to CO Free Energy SupplyCO2-Free Energy Supply
• A 30% reduction in all energy intensity implies that 25 5 quads of fossil fuels are not used that 25.5 quads of fossil fuels are not used, reducing CO2 emissions by 25.5%
• A 60-fold increase in wind plus solar can displace about 25 quads of fossil fuels.
• A factor of five increase in nuclear power can displace 30 quads of fossil fuels.displace 30 quads of fossil fuels.
• 1 billion tons per year of celluosic conversion of
17
biomass can displace 5 quads of gasoline.

U.S. Energy Use by Sectors: 200745
40
Through Electricity
Renewables
Natural Gas
30
35 Petroleum
Nuclear
Coal
20
25
drillion Btu
15
20
Qua
5
10
18
0
Residential Commercial Industrial Transportation Electric

Decreased Energy Use
Increased E i
Reduced Economic Economic
EfficiencyEconomicEfficiency
19Increased Energy Use

Decreased Energy Use
Energy EfficiencyI ffi i t E Energy Efficiency Improvement
Inefficient Energy Saving Increased
EconomicEconomicEfficiency
Economically EfficientEconomically Efficient Energy IntensificationWaste
20

Decreased Energy Use“Smart” Regional Land
Energy AuditsPlug-In
Hybrids
LED General
“Smart Buildings” Controls
Compact
LED Traffic Lights
Gasoline
Optimized Building Construction
gDevelopment
Reformed CAFE Standards
Halt SUV Sales
Hybrids (Now)
Plug-In Hybrids
Lighting (Future)
Controls
LED Task Compact Fluorescent Penetration Energy
Cost Labeling
Gasoline Rationing
Construction
Overly Strict Building
Efficient AC-DC Converters
y(Future)Lighting
(Now)Old appliance replacement
Appliance Efficiency Standards
Congestion Pricing
Building Standards
Pigouvian Energy Tax
Converters
Hybrid Gas-Electric Vehicles
Behavioral Change:Program ThermostatLights, Tire pressure,Driving Patterns
Personal Computer Penetration
Increased EconomicEfficiencyMany Rapid
Transit S t
LED General
Internet Growth
g
Increased commercial space
Incan-descent
SystemsAirline Deregulation
High Definition
Lighting (Now)
Economic development
Gasoline Price Controls
descent Lighting
High Definition TV Accessible
Business Travel

22

Source: McKinsey & Co.

Why Do Negative Cost Options Continue ?Continue ?
24

Market Failures and Market Barriers
Market failures Market barriers Unpriced costs and Low priority of energy
benefits issuesDistortionary regulatory
and fiscal policiesIncomplete markets for
energy efficiencyand fiscal policies energy efficiency
Misplaced incentives Capital market barriersI ffi i t d i t (C iti Skill )Insufficient and inaccurate
information (Cognitive Skills)
Source: Brown, Marilyn. 2001. “Market failures and barriers as a basis for clean energy policies.” Energy Policy
25
gy p gy y

Market Failures• Externalities of Energy Use ( “Unpriced costs and benefits”)
Global Climate Change• Global Climate Change• Risks of Energy Price Shocks• Limitations on our Foreign Policy Options
T f T d I t (P i “E t liti ”)• Terms of Trade Impacts (Pecuniary “Externalities”)• Automobile risk shifting by purchase of heavy vehicles
• Pricing Below Marginal CostN ti diff ti t d El t i it P i i• Non-time-differentiated Electricity Pricing
• Information Asymmetry/ Agency Problems• Consumer Product Marketing• New Building Construction
• Suboptimal Technology Options• Incomplete capture of intellectual property• Sub-optimal technology directions, due to externalities
• Non-Convexities • Learning By Doing Technology Spillovers
26
• “Chicken and Egg” Problems

Split Incentives: Market Penetration of Energy Efficiency Measures in Owner-Occupied and Rental Housing in California (CEC 2004)
8090
(%) Owner occupied
Rental
4050607080
etra
tion
( Rental
10203040
arke
t pen
0
d walls
d attic
ndows
mostat
lamps
rhea
dsM
a
Insulated w
Insulated
uble pane w
indmmab
le therm
t fluores
cent la
flow showerh
27
DoubPro
gramCompac
t f
Low-fl

Market Barriers• Low Priority of Energy Issues
– Generally means that energy costs are so small that it is not worth the effort to try to optimize
• Incomplete markets for energy efficiencyp gy y– Discrete nature of commodities offered for sale– Information problems when offering energy efficiency
services• Capital market barriers
– Simply a recognition of opportunity cost of capital investmentsinvestments
• Cognitive issues– Probably very important for residential, small
commercial and individual transportation decisionscommercial, and individual transportation decisions
28

Market Barriers Example• Cognitive issues: automobile purchase
– Automobile purchase decisions• First cost biasFirst cost bias
– Automobile design decisions• Understand first cost bias• Don’t design optimally efficient cars• Don’t design optimally efficient cars
– Consumers don’t have option to choose optimally efficient cars because they are not offered for saleM k t t i ilib i– Market stays in equilibrium
• Cognitive issues: programmable thermostats– 2004 study. Only 20% of Americans own programmable
thermostats. Of those, 70% don’t use programmable features because they're too complicated.
29
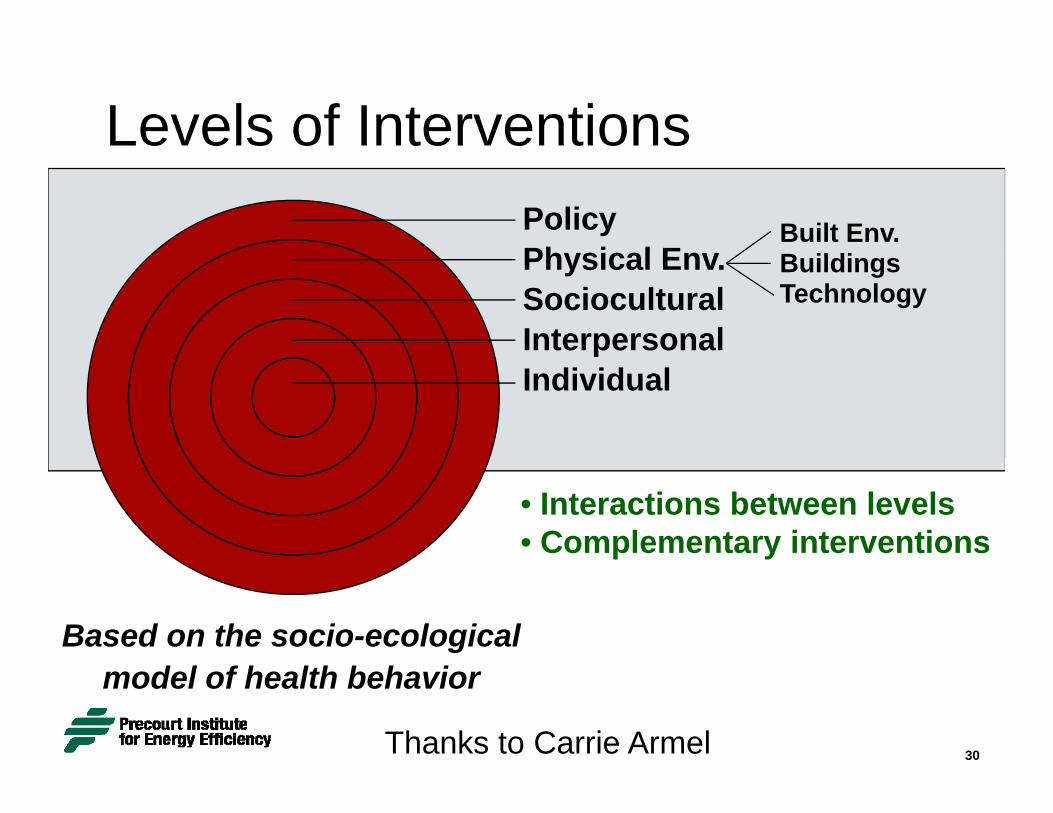
Levels of InterventionsPolicyPh sical En
Built Env.Physical Env.SocioculturalInterpersonal
BuildingsTechnology
pIndividual
• Interactions between levels• Complementary interventions
Based on the socio-ecological
30
model of health behavior
Thanks to Carrie Armel
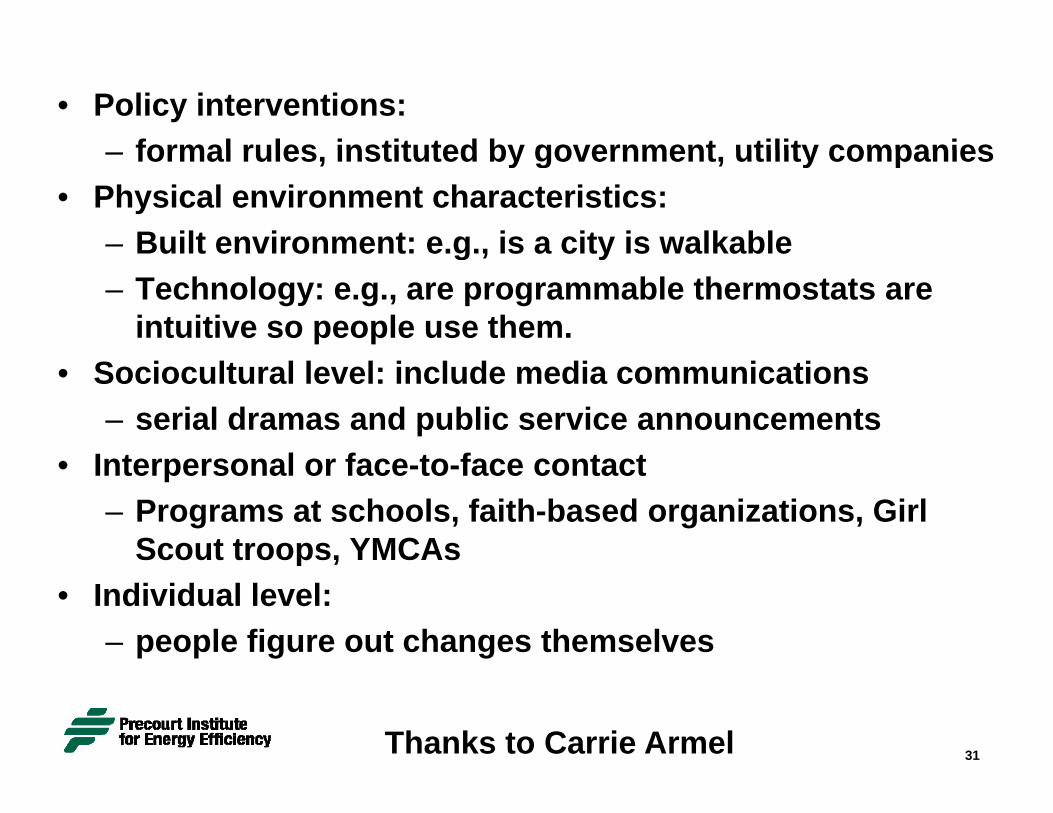
• Policy interventions: formal rules instituted by government utility companies– formal rules, instituted by government, utility companies
• Physical environment characteristics: – Built environment: e.g., is a city is walkableBuilt environment: e.g., is a city is walkable– Technology: e.g., are programmable thermostats are
intuitive so people use them.• Sociocultural level: include media communications
– serial dramas and public service announcementsI t l f t f t t• Interpersonal or face-to-face contact– Programs at schools, faith-based organizations, Girl
Scout troops, YMCAsp ,• Individual level:
– people figure out changes themselves
31Thanks to Carrie Armel

Example: Lighting for Residential and g g
Commercial Use
32

Commercial Building Energy Uses
Space CoolingOtherCooling Load Driven by Ligh(42% of Cooling Load)
Electronics
Cooking(42% of Cooling Load)
LightingV til ti
Electronics
W t H ti
Ventilation
S H tiRefrigeration
Water Heating
Heating Assistance from Lighting( % f S )
33Source: 2006 Buildings Energy Data Book
Space Heating (23% of Space Heating Load)
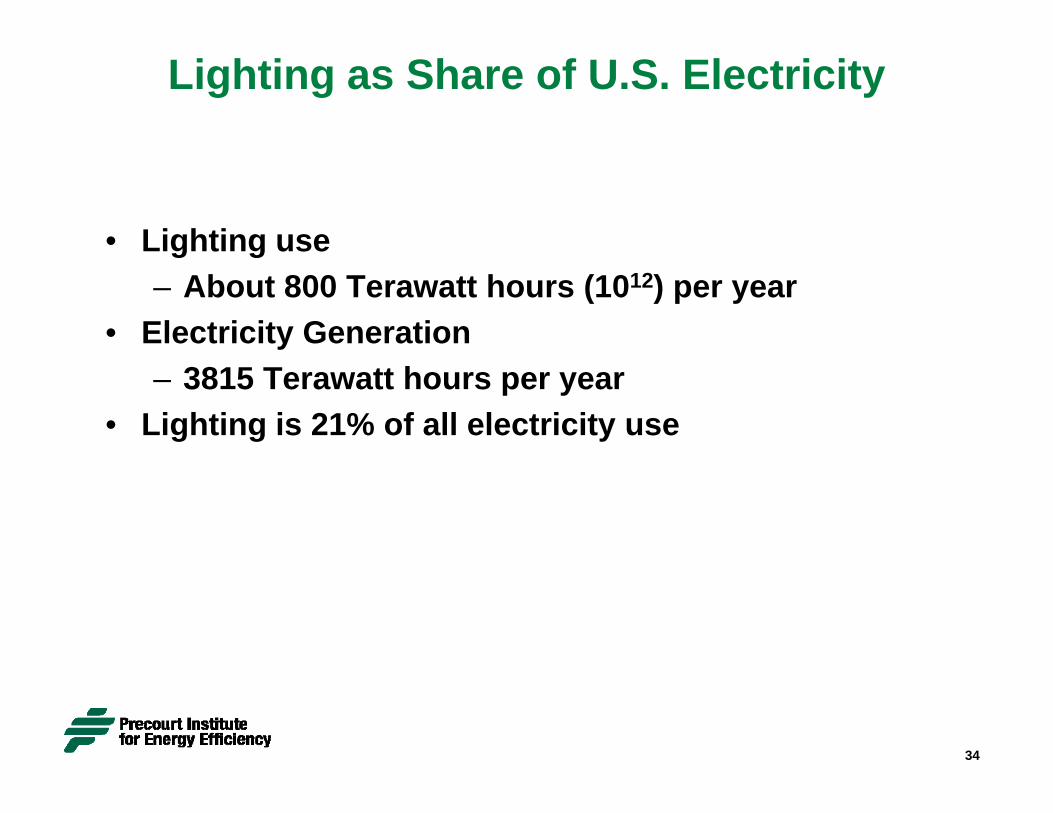
Lighting as Share of U.S. Electricity
• Lighting useg g– About 800 Terawatt hours (1012) per year
• Electricity Generation– 3815 Terawatt hours per year
• Lighting is 21% of all electricity use
34

35
From “U.S. Lighting Market Characterization”prepared for DOE EERE by Navigant Consulting, 2002

36
From “U.S. Lighting Market Characterization”, prepared for DOE EERE by Navigant Consulting, 2002

LEDs Efficacy Increases by 30% Per Year
140
1602002 DOE Roadmap
LED Standard Chip
100
120
er W
att LED - Standard Chip
LED - Power Chip
80
100
Lum
en p
e
40
60
ffic
acy
/ L
20
40
Ef
01998 2000 2002 2004 2006 2008 2010 2012

Energy Implications of 100% LEDs @ 120 Lm/wt System Efficacy
400
450
Current Mix
300
350
400 Current MixAll LED @ 120 lm/wt
200
250
300
Whr
/yr
150
200TW
50
100
0Commercial Residential Industrial Outdoor

The Precourt Institutefor Energy Efficiencygy y
39

Precourt Institute
A h d l i i tit t t St f d• A research and analysis institute at Stanford• Established in October 2006• Initial funding by Jay Precourt• Initial funding by Jay Precourt• Mission
– To improve opportunities for and implementation of p pp penergy efficient technologies, systems, and practices, with an emphasis on economically attractive deploymentdeployment
– Focus on the wise use of energy– Energy efficiency: economically efficient reductionsEnergy efficiency: economically efficient reductions
in energy use (or energy intensity)
40


PIEE Research Matrix
Sectors
Methods B ildings Transpor Electricit Ind str AppliancesMethods Buildings Transpor-tation
Electricity Industry Appliances
Engineering
Modeling
SystemsSystems
Behavior
Policy
42
Current Emphasis Anticipated Additions
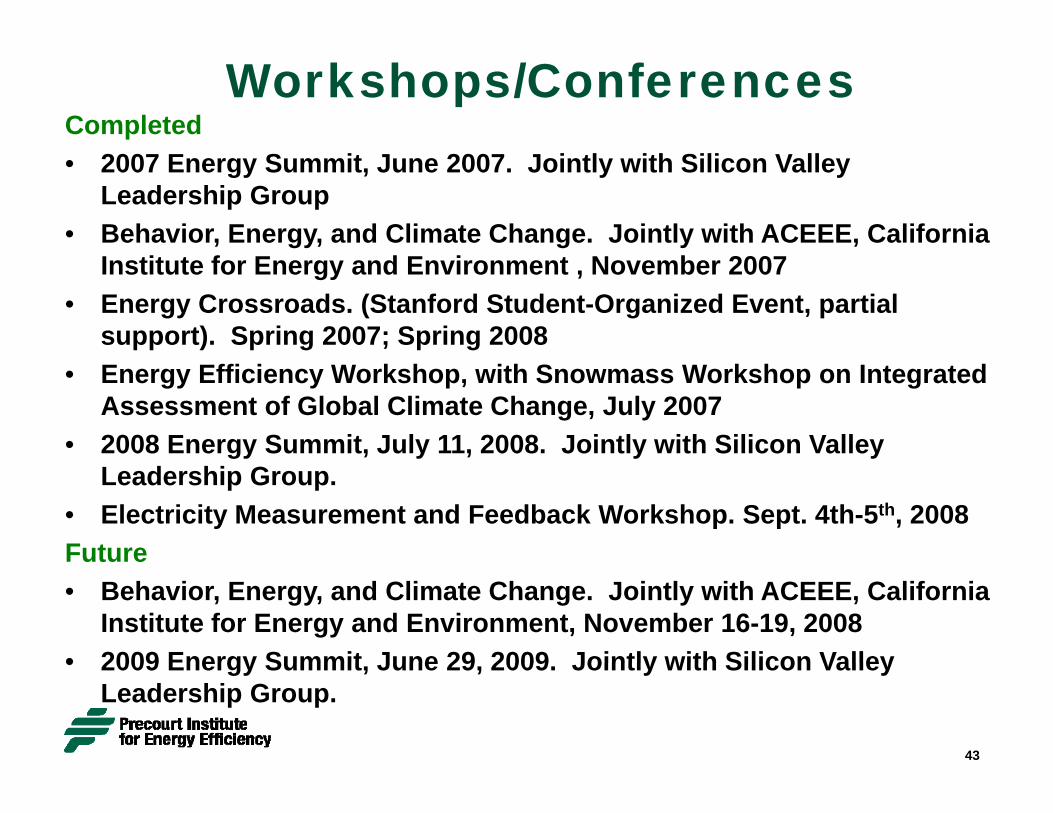
Workshops/ConferencesCompleted• 2007 Energy Summit, June 2007. Jointly with Silicon Valley
Leadership Group• Behavior, Energy, and Climate Change. Jointly with ACEEE, California
Institute for Energy and Environment , November 2007• Energy Crossroads. (Stanford Student-Organized Event, partial
support). Spring 2007; Spring 2008• Energy Efficiency Workshop, with Snowmass Workshop on Integrated
Assessment of Global Climate Change, July 2007• 2008 Energy Summit, July 11, 2008. Jointly with Silicon Valley gy y y y
Leadership Group. • Electricity Measurement and Feedback Workshop. Sept. 4th-5th, 2008FutureFuture• Behavior, Energy, and Climate Change. Jointly with ACEEE, California
Institute for Energy and Environment, November 16-19, 2008• 2009 Energy Summit June 29 2009 Jointly with Silicon Valley
43
• 2009 Energy Summit, June 29, 2009. Jointly with Silicon Valley Leadership Group.

Precourt Institute for Energy EfficiencyEnergy Efficiency
http://piee.stanford.edu
44


![Mozambique PEEC[1]](https://img.pdfslide.net/doc/110x75/5571fdc4497959916999e379/mozambique-peec1.jpg)