Embed Size (px)
Citation preview

1
Classification and Treatment of Angle
Class II Subdivision Malocclusions
Sara E. Cassidy
A thesis
submitted in partial fulfillment of the
requirements for the degree of
Masters of Science in Dentistry
University of Washington
2013
Committee:
Greg Huang, Chair
David Turpin
Douglas Ramsay
Program Authorized to Offer Degree:
Orthodontics

2

3
©Copyright 2013
Sara E. Cassidy

4

5
TABLE OF CONTENTS
Page List of Figures…………………………………………………………………..............6 List of Tables………………………………………………………………………..….7
1. Introduction
Introduction and Statement of the Problem……………………………………...……10
List of Objectives…….………………………………………………………….....….10
2. Methods
Sample……………………………...………………………………………….............11
Inclusion and Exclusion Criteria……….……………………………………………...11
Apparatus and Procedures……………………………………………………………..11
Statistical Analysis…………………………………………………………………….13
3. Results………………..………………………………………………………………..14
4. Discussion………………..……………………………………………………………17
5. Conclusions…………………………………………………………………………….20
6. References ……….……………………………………………….……………………21

6
LIST OF FIGURES
Figure Number Page
1. Case Selection……………………………………………………………23
2. Molar Targets…………………………………………………………….24
3. Treatment Trends…………………………………………………………25

7
LIST OF TABLES
Table Number Page
I. Demographics……………………………………………………….…….26
II. Treatments…………………………………………………………………27
III. Overall Treatment Results…………………………………………………28
IV.Initial and Final PAR and Treatment Time………………………….…….29

8
ACKNOWLEDGMENTS
The author wishes to express sincere gratitude to The University of
Washington Department of Orthodontics for providing her an excellent
education and research opportunity, and to the Chair of her research committee,
Dr. Greg J. Huang who gave an immeasurable amount of his time and expertise.

9
DEDICATION
to my dear husband, Ryan and mother, Dorothy

10
1. INTRODUCTION:
Patients with Class II subdivision malocclusions have long been a treatment challenge for
clinicians1-2. Treating asymmetric malocclusions is inherently more difficult than treating
symmetric malocclusions, as symmetry in one or both arches needs to be re-established, usually
with asymmetric extractions, mechanics, or surgery. For example, Class II subdivisions that are
due to maxillary dental asymmetries might be addressed with asymmetric extractions.
Similarly, Class II subdivisions due to mandibular skeletal asymmetry might be ideally
corrected with asymmetric mandibular advancements3. However, this option is often not
accepted by patients, causing orthodontists to then employ other asymmetric options, such as
Class II elastics, extractions, extraoral traction, orthodontic distalizers, TAD’s, and fixed
functional appliances4.
At the University of Washington graduate orthodontic clinic, there are more than 20
attending faculty, trained at graduate programs from around the country. The approaches they
employ to address Class II subdivisions are diverse, reflecting a variety of philosophies and
temporal trends. This investigation of Class II subdivision malocclusions provided interesting
insights into treatment options and outcomes. Treatment objectives included:
1. Categorize the main types of Class II subdivision malocclusions that were encountered in
the University clinic from 1995 to 2011
2. Investigate the different treatment strategies employed at the University of Washington
3. Compare outcomes of differing treatment methodologies, including midline and molar
correction, as well as overall occlusal outcomes
4. Evaluate final lower incisor angulation, based upon different treatment strategies

11
2. METHODS:
This retrospective study was approved by the Institutional Review Board at the
University of Washington. The consecutively chosen sample of orthodontic records was selected
from the retention files of the Orthodontic Department at the University of Washington, spanning
the years 1995 to 2011. For patients from January 1995 to December 2008, it was possible to
identify potential subjects by searching the retention files housed in the graduate clinic. The
retention files provide a summary of each patient’s diagnosis, treatment plan and final outcomes.
After 2008, the retention files were not systematically collected. Therefore, initial models of all
consecutively finished cases from 2008 to 2011 were evaluated to identify potential cases.
The inclusion criteria were defined as patients treated at the UW Orthodontic Graduate
Clinic with a Class II subdivision malocclusion whose initial and final records included complete
chart notes, intra and extra-oral photographs, study models and cephalometric radiographs.
Patients with syndromes or cleft lip and palate were excluded. Categorization as a Class II
subdivision required at least a half cusp difference between the right and left sides. For example,
a full cusp Class II relationship on the right side and a half cusp Class II relationship on the left
side would qualify.
After selecting the eligible cases, all identifiers on study casts were masked. Initial
maxillary midline position was determined by evaluating patient photographs, and then this
evaluation was cross-referenced with diagnostic notes in the chart. Mandibular midlines were
related to the maxillary and facial midlines by assessing photographs and study casts. Again,
these evaluations were cross-referenced with chart notes. A determination on mandibular
skeletal asymmetry was also performed using facial photographs and chart notes. In a small
number of patients, posterior-anterior cephalometric radiographs were also available. Final
12
midline assessments were obtained in the same fashion, although chart notes were often not
available for cross-reference. Dental midlines that were within 1 mm to either side of the facial
midline were considered to be symmetric with the face.
In a random and blinded fashion, two calibrated examiners independently scored all
initial study casts for PAR, and, starting one week later, measured the final casts. PAR scores
used in data analysis represented an average of each examiner’s score. For PAR cases in which
the examiners disagreed by more than 5 points, each examiner measured the casts again. If
scores still differed by more than 5 points, the examiners met and a consensus score was
obtained.
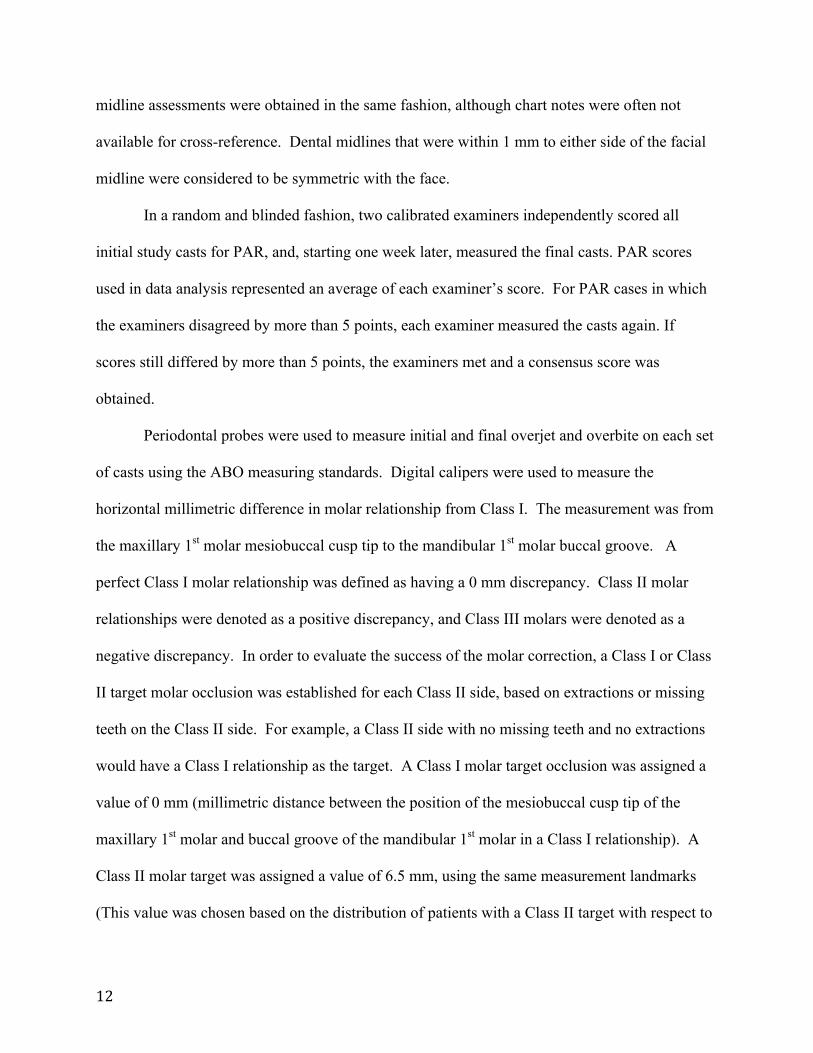
Periodontal probes were used to measure initial and final overjet and overbite on each set
of casts using the ABO measuring standards. Digital calipers were used to measure the
horizontal millimetric difference in molar relationship from Class I. The measurement was from
the maxillary 1st molar mesiobuccal cusp tip to the mandibular 1st molar buccal groove. A
perfect Class I molar relationship was defined as having a 0 mm discrepancy. Class II molar
relationships were denoted as a positive discrepancy, and Class III molars were denoted as a
negative discrepancy. In order to evaluate the success of the molar correction, a Class I or Class
II target molar occlusion was established for each Class II side, based on extractions or missing
teeth on the Class II side. For example, a Class II side with no missing teeth and no extractions
would have a Class I relationship as the target. A Class I molar target occlusion was assigned a
value of 0 mm (millimetric distance between the position of the mesiobuccal cusp tip of the
maxillary 1st molar and buccal groove of the mandibular 1st molar in a Class I relationship). A
Class II molar target was assigned a value of 6.5 mm, using the same measurement landmarks
(This value was chosen based on the distribution of patients with a Class II target with respect to

13
the average distance Class II molars are typically displaced ~6.5 mm.) Molar targets were
considered acceptable if they were within 1 mm of the established millimetric values (0 mm for
Class I, and 6.5 mm for Class II)
Initial and final cephalometric radiographs were hand traced, and the following
measurements were obtained: maxillary central incisors to NA in mm and degrees, mandibular
central incisors to NB in mm and degrees, and mandibular central incisors to MP5. All PAR,
cephalometric, and midline measurements were performed prior to the examiner’s knowledge of
the patient’s treatment. Each chart was thoroughly examined to abstract information on the
previously stated research parameters, i.e. gender, date and age at bond and debond, all
treatments rendered. Details of the treatment included: extractions, headgear, fixed functional
appliances, elastic use, other auxiliary appliances, and surgery recommended or completed.
Statistical analysis
Means and proportions were calculated for parameters of interest. Means were compared
using analysis of variance and t-tests. Proportions were compared using the Chi-square test or
the Fisher’s exact test. Results were regarded as significant at p < 0.05.
The intraclass correlation coefficient (ICC) was used to determine inter-rater reliability
for the PAR measurements. Based upon 20 randomly selected pairs of measurements, the ICC
was 0.781 indicating acceptable inter-rater reliability. For key outcomes, 10 subjects were
selected randomly for re-measurement at least one month apart. Dahlberg’s formula was used to
calculate intra-rater reliability for midline assessment, lower incisor to mandibular plane
angulation, and molar class measurement.

14
The intra-rater reliability for midline deviations, lower incisor to mandibular plane
angulation, and molar correction were 0.19 mm, 1.23 degrees and .06 mm, respectively.
3. RESULTS:
From 1995 to 2008, 218 potential subjects were identified from the retention files (Figure
1). Another 34 potential subjects were identified from assessing models from 2008 - 2011.
Sixty-two cases were excluded, as charts could not be located. Another 57 subjects were
excluded due to failure to meet the subdivision inclusion criterion. Another 23 subjects were lost
due to incomplete records. This left a total of 110 subjects, or 44% of those initially identified
for potential inclusion.
Subjects were then placed into groups based on similarities in their midline relationships,
and the etiology of their asymmetries. Specifically, Group 1 was composed of subjects whose
maxillary and mandibular midlines were coincident with the facial midline. Twenty-seven
subjects met this criterion (Fig 1). The etiology of the asymmetry in Group 1 was determined to
be primarily dental in origin. Group 2 was composed of subjects whose maxillary midlines
deviated to one side of the facial midline by more than 1 mm, but whose mandibular midlines
were coincident with the facial midline. Sixteen subjects fell into this category, and their
etiology was also determined to be primarily dental in origin. Finally, Group 3 was composed of
subjects whose maxillary midlines were coincident with the facial midlines, but whose
mandibular midlines were more than 1 mm off from the facial midline. Fifty-five subjects fell
into this category, and the majority of these subjects were judged to have some degree of skeletal

15
mandibular asymmetry based on chin point deviation. However, 9 subjects in Group 3 were
noted to have posterior cross-bites, and potential lateral shifts. To summarize, even though all
subjects had Class II subdivision molar relationships, they presented with the following midline
relationships:
GROUP 1 – maxillary and mandibular midlines on with facial midline
GROUP 2 – maxillary midline off from facial midline
GROUP 3 – mandibular midline off from facial midline
There were an additional 12 subjects who fell into other midline categories, such as
midlines both deviated to the same or opposite sides. These subjects were excluded from further
analysis due to their small numbers.
At baseline, the 3 main groups had no significant differences in gender distribution, age
at banding/bonding, incisor proclination, Peer Assessment Rating (PAR) score, or overbite
(Table 1). Not surprisingly, the 2 groups that were created based upon non-coincident midlines
exhibited significant differences for their midline measurements (Table 1). Group 3 also had
about 1 mm of additional overjet at the start of treatment.
Subjects were treated with a variety of strategies, such as extractions, headgear, elastics,
fixed functionals, and surgery. The number of patients who underwent these various therapies
was also recorded (Table 2). Extractions were recorded as being asymmetric or symmetric. It
was interesting that the majority of subjects in all three groups were treated without extractions.
In 69 of the 98 patients, Class I molar was the goal for the Class II malocclusion. Of
these 69 subjects, we found that 48 (70%) finished within 1 mm of the Class I target. One
subject displayed overcorrection to super Class I relationship, and 20 subjects fell short of
complete correction, finishing with end-on molars (Fig 2a). When the objective was to maintain
16
a Class II molar relationship, 19 of 27 subjects (70%) were within 1 mm of the 6.5 mm target.
The remaining subjects completed treatment with a Class I tendency (2 subjects), or with a Super
Class II relationship (6 subjects) (Fig 2b). (Please note that 2 patients who underwent surgery
had a -6.5mm Class III molar relationship target)
When each group’s success in reaching their molar targets was examined, it was found
that Group 1 (Midlines On) reached their Class I target 78% (14/19) of the time, and reached
their Class II target 75% (6/8) of the time. Group 2 (Mx Midline Off) had a 64% (7/11) success
rate in reaching their Class I target, and 60% success rate in reaching their Class II target. Group
3 (Mn Midline Off), the biggest group, had 59% (23/39) reaching their Class I target, and 57%
(8/14) reaching their Class II target, and 2 subjects had surgery with a Class III molar target.
Final midlines were then evaluated (Table 3). In Group 1 (Midlines On), the midlines
remained coincident at the end of treatment. In Group 2 (Mx Midline Off), the maxillary midline
finished on average 0.6 mm away from the ideal midline position. When Group 3 was evaluated,
(Mn Midline Off), difficulty was noted in achieving the correction, averaging a 1.0 mm deviation
from the ideal midline position at the end of treatment. This mandibular midline difference was
significantly different than the other 2 groups at the end of treatment. To summarize, midline
correction, especially in the mandibular arch, was often not always achieved.
In each of the 3 groups, initial PAR scores were higher in subjects who were treated with
extractions than those who were treated without extractions, primarily due to the influence of
crowding on selection of a treatment plan (Table 4). Although not statistically significant for all
groups, extraction treatment also seemed to be associated with slightly longer treatment times
(Table 4). The cases treated surgically tended to have unusually long treatment times due to

17
extenuating circumstances. In the end, regardless of extraction status, final PAR scores were
similar, indicating both extraction and non-extraction cases reached a similar finish (Table 4).
When a Class I molar was the target for the Class II side, lower incisor proclination was
significantly greater (103.5 degrees), compared to Class II molars that were targeted to remain
with a Class II relationship (99.7 degrees). Additionally, lower incisors proclined significantly
more when fixed functional appliances were used (105.9 degrees), compared to elastics only
(101.8 degrees).
Treatment trends at UW were evaluated in 5-year increments from 1995-2011. The
extraction rate decreased from over 50% to around 30% over the period of the study (Fig 3).
Headgear also decreased from about 35% to 18%. Elastic use as the only auxiliary appliance to
address the Class II relationship almost doubled, from 20% to 38%. Surprisingly, surgery
decreased (from 10% to 0%), and fixed functional appliances increased from 0% to about 15%.
4. DISCUSSION:
Of the Class II subdivision subjects we studied, half of the asymmetries were due to
mandibular dental midline displacement. Many of these subjects were judged to have a skeletal
etiology, as their chins were deviated towards the Class II side. Additionally, mandibular
surgery was listed as an option for the majority of these patients. This finding is consistent with
Sanders et al.6, who stated that the primary contributing factor responsible for a Class II
subdivision malocclusion is a deficient mandible, due to either reduced ramus height or
mandibular length, on the Class II side. However, other studies have reported that the main
factor contributing to the asymmetric anteroposterior relationships in Class II subdivision
malocclusions is the dentoalveolar component2,7,8. Janson et al.9 reported that in approximately

18
61% of Class II subdivision malocclusions, the mandibular midline was the midline
noncoincident with the face. This finding is similar to our 50% value for asymmetry due to
mandibular midline deviation.
A Class I molar relationship was the treatment goal in the majority of the subjects in this
study, regardless of the subdivision etiology. Interestingly, even when multiple treatment
strategies are employed in an attempt to achieve Class I molars bilaterally, we are only able to
reach this goal 64% of the time (vs. 63% for Cl II target success). Group 1 (Midlines On) and
Group 2 (Mx Midline Off) showed a greater ability to reach their molar targets than Group 3
(Mn Midline Off), who reached their targets only about half of the time. This may be due to the
tendency for Group 3 asymmetries to be skeletal in origin, which would be more difficult to
correct than those due to a dental etiology. Also, our success in achieving Class I molar
relationship can be highly dependent on the patient’s level of compliance10-12. If maintaining a
Class II relationship is a viable option, perhaps it should be considered more often. Janson et al10
reported in one of his studies that treatment plans that maintained the anteroposterior relationship
of the posterior segments resulted in better correction of the malocclusion. Maintaining the
current molar relationship usually required less patient compliance with extraoral appliances or
intermaxillary elastics. It also appeared to result in reduced lower incisor proclination, as well as
less Class II mechanics.
Of the 98 subjects, mandibular asymmetric advancement surgery was recommended as a
treatment option for 30 of these patients. Twenty-nine of these were in Group 3 (Mn Midline
Off). Only 4 of those 30 patients chose to correct their asymmetry with orthognathic surgery.
(The 2 patients undergoing surgery in Group 2 both had maxillary LeFort procedures.) Even if
surgery is an appropriate treatment solution to correct the skeletal asymmetry3, it seems patients

19
often do not view their malocclusions or facial asymmetries severe enough to undergo the
associated risks and expense. In fact, it appears that the rate of orthognathic surgery in the UW
graduate clinic has decreased over the past 15 years for these patients.
When planning treatment, it is often assumed that dental midlines can be predictably
aligned with facial midline. As a result of this study, the investigators discovered that midline
correction was challenging, and often incomplete. Should more asymmetric extraction plans be
employed for our patients? Janson and colleagues10 reported a greater improvement of the initial
interdental midline deviation and a tendency for a better treatment outcome when Class II
subdivision patients are treated with asymmetric extraction of 3 premolars, compared with
extraction of 4 premolars. Interestingly, in Group 2, which represented subjects with maxillary
midline deviation and a maxillary dental asymmetry, less than half of the subjects were treated
with extractions at all (Table. 2). When considering Janson’s claim and the logistics of aligning
a deviated maxillary midline, it seems that extraction treatment plans could aid in better midline
correction. However, in the absence of crowding, 3 or 4 premolar extraction plans might not be
desirable options due to facial profile considerations.
It was not surprising to find that treatment time tended to increase with extractions. This
study agrees with Fink and Smith13, who also found the number of extracted premolars has a
direct relationship to treatment time, with treatment time increasing by 0.9 months for each
extracted premolar. These results are also similar to those of Alger14, who found extraction cases
to average 4.6 months longer than non-extraction cases.
In this study of varying groups and treatment strategies, it was found that the final PAR
scores were comparable. This would indicate that orthodontists are relatively successful in

20
correcting all types of Class II subdivisions. It would be interesting to know if similar results
would be seen if ABO measurement standards were used.
The resulting effect that treatment strategies had on lower incisor angulation were not
surprising, with Class I targets and fixed functionals leading to more proclination15. Although
there was no adjustment for extractions, interproximal reduction, or elastic use, the groups that
were compared did have similar initial mandibular incisor proclination, averaging about 96
degrees.
It would be interesting to investigate the long-term stability of these Class II subdivision
treatment modalities in the future. For example, are asymmetries corrected with extractions
more stable than those corrected with elastics or functional appliances?
There were limitations in this study. Because it was retrospective, we depended on the
accuracy and availability of the orthodontic records. Assessment of the etiology of the
asymmetry was based on photographs, chart notes, casts, and only in some instances, were P-A
cephs available. More subjects in Groups 1 and 2 would have provided increased power to
evaluate various outcomes. Many patients received a combination of treatment approaches and
therefore, it is difficult to draw strong conclusions about any one particular component of
treatment. Also, practitioners recommended treatments that they felt were most appropriate for
their patients, and the patients had some role in the acceptance of the final treatment plan.
Strengths of the study include the consecutive sampling, the inclusion of many practitioners, and
the blinded assessment of the outcomes.
5. CONCLUSIONS:
Based upon the results of this study, we conclude the following:

21
1. Half of the Class II subdivision cases treated at the University of Washington from 1995-
2011 presented with mandibular asymmetry. About 25% presented with maxillary and
mandibular midlines coincident with the face, and were due to a maxillary dental
asymmetry. Another 15% presented with maxillary midlines deviated from facial, and
were also due to a maxillary dental asymmetry.
2. The treatment strategies employed at the University of Washington show trends toward
less surgery, extractions, and headgear, and trends toward more fixed functional use.
3. Complete correction of midlines is not always achieved, especially in the case of
mandibular skeletal asymmetry.
4. Final PAR scores were comparable, regardless of the origin of the asymmetry or
extractions status.
5. Lower incisor proclination was increased when fixed functional appliances were used, as
well as when a Class I molar relationship was the target for the Class II side.
6. REFERNCES: 1. Turpin DL. Correcting the Class II subdivision malocclusion. Am J Orthod Dentofacial Orthop. 2005 Nov;128(5):555-6.
2. Alavi D.G., E.A. BeGole and B.J. Schneider, Facial and dental arch asymmetries in Class II subdivision malocclusion, Am J Orthod Dentofacial Orthop 93 (1988), pp. 38–46.
3. Janson M, Janson G, Sant’Ana E., Simao TM, and M.R. de Freitas. An orthodontic-surgical approach to Class II subdivision malocclusion treatment. J Appl Oral Sci. 2009;17(3):266-73.
4. Smith SS, Alexander RG. Orthodontic correction of a Class II Division 1 subdivision right open bite malocclusion in an adolescent patient with a cervical pull face-bow headgear. Am J Orthod Dentofacial Orthop. 1999 Jul;116(1):60-5.
5. Little R.M. Roentgenographic Cephalometry an Individualized Learning Program University

22
of Washington Analysis; 1977; 1-101
6. Sanders DA, Rigali PH, Neace WP, Uribe F, Nanda R. Skeletal and dental asymmetries in Class II subdivision malocclusions using cone-beam computed tomography. Am J Orthod Dentofacial Orthop. 2010 Nov;138(5):542.e1-20
7. Rose JM, Sadowsky C, Begole EA, Moles R. Mandibular skeletal and dental asymmetry in Class II subdivision malocclusions. Am J Orthod Dentofacial Orthop 1994;105:489-95.
8. Janson G.R., A. Metaxas, D.G. Woodside, M.R. de Freitas and A. Pinzan, Three-dimensional evaluation of skeletal and dental asymmetries in Class II subdivision malocclusions, Am J Orthod Dentofacial Orthop 2001, pp. 406–418.
9. Janson G, de Lima KJ, Woodside DG, Metaxas A, de Freitas MR, Henriques JF. Class II subdivision malocclusion types and evaluation of their asymmetries. Am J Orthod Dentofacial Orthop. 2007 Jan;131(1):57-66.
10. Janson G, Dainesi EA, Henriques JF, de Freitas MR, de Lima KJ. Class II subdivision treatment success rate with symmetric and asymmetric extraction protocols. Am J Orthod Dentofacial Orthop. 2003 Sep;124(3):257-64;
11. Burstone CJ. Diagnosis and treatment planning of patients with asymmetries. Semin Orthod. 1998 Sep;4(3):153-64.
12. Lewis D. The deviated midlines. Am J Orthod 1976;70:601-16.
13. Fink DF, Smith RJ. The duration of orthodontic treatment. Am J Orthod Dentofacial Orthop 1992;102:45-51.
14. Alger DW. Appointment frequency versus treatment time. AM J Orthod Dentofacial Orthop 1998;94:436-9 15. Reddy P, Kharbanda OP, Duggal R, Parkash H. Skeletal and dental changes with nonextraction Begg mechanotherapy in patients with Class II Division 1 malocclusion. Am J Orthod Dentofacial Orthop 2000;118:641-48.

23
Figure 1: Case Selection 62 Charts not found 57 Not true subdivision 23 Incomplete records
252 potential subdivision subjects identified
190
133
110 subdivision subjects with complete records
Group 1
27 subjects Midlines On with facial
Group 2
16 subjects MX Midline Off from facial
Group 3
55 subjects Mn Midline Off from facial
12 subjects excluded due to other midline relationships

24
Figure 2: Molar targets and final molar occlusion (96* Subjects) *2 subjects omitted with Class III final molar target
2a. Class II Side with Class I Target
2b. Class II Side with Class II Target
0
10
20
30
40
-‐4 -‐3 -‐2 -‐1 0 1 2 3 4
Num
ber of Subjects
mm from MB Cusp of Mx 1st Molar to Buccal Groove of Mn 1st Molar more
0
5
10
15
20
4 5 6 7 8 9
Num
ber of Subjects
mm from MB Cusp of Mx 1st Molar to Buccal Groove of Mn 1st Molar

25
Figure 3. Trends in treatment over time

26
Table I: Initial Characteristics
I
Total Sam
ple (n=98) Group 1 (n=27) Group 2 (n=16) Group 3 (n=55)
Variables Fem
ale Gender, n (%) 53 (54)
16 (59) 10 (63) 28 (51) 0.70 Initial age (y-‐m
) m
edian (mean) 13-‐2 (18-‐9) 13-‐9 (17-‐3) 15-‐3 (20-‐8) 14-‐11 (19-‐7) 0.57
mean SD m
ean SD mean SD m
ean SD p-‐value Maxilla to M
x incisors M
x1.NA (degrees)
20.6 8.1 18.8 7.9 21.2 7.9 21.3 8.7 0.39 M
x1-‐NA (m
m)
5.3 2.6 5.7 2.8 4.3 2.3 5.3 2.5 0.069 Mandible to M
n Incisors M
n1.NB (degrees)
25.9 7.6 26.6 5.2 28.4 7.7 24.8 8.8 0.27 M
n1.NB (m
m)
6.0 2.8 5.8 2.4 7.0 2.7 5.8 2.9 0.38 M
n1.MP (degrees) 96.2 8.0 95.9 6.1 98.1 8.1 95.9 8.7
0.75 Mx m
idline deviation (from
facial midline) 0.6 0.9 0.2 1.0 2.3 1.0 0.3 1.0 <0.001
Mn m
idline deviation (from
facial midline) 1.4 1.1 0.6 1.1 0.4 1.1 2.3 1.1 <0.001
Class II side (m
m from
Class I)* 3.6 1.3 3.4 1.3 3.7 1.2 3.6 1.3 0.76 Class I side (m
m from
Class I)* 0.2 0.9 0.2 1.1 0.1 0.5 0.0 0.9 0.67 Initial overjet
5.2 2.2 4.3 2.1 4.8 2.3 5.7 2.2 0.016
Initial overbite
4.6 1.9 4.4 2.2 3.9 2.2 4.9 1.7 0.10 Initial PAR score
28.1 10.4 25.2 10.0 28.7 10.0 29.3 9.0 0.26 Extraction Rate %
41% 48%
38% 35%
0.74 Group 1 = M
idlines On Group 2 = M
axillary Midline Off
Group 3= Mandibular M
idline Off *These values indicate the position of the m
esiobuccal cusp of the maxillary 1
st molar relative to the buccal groove of the m
andibular 1st m
olar

27

28
Table III Final Characteristics
Total Sam
ple (n=98) Group 1 (n=27) Group 2 (n=16) Group 3 (n=55)
Variables mean SD m
ean SD mean SD m
ean SD P Treatm
ent time (m
onths) 29.7 13.3 27.8 11.2 35.5 16.7 29.0 13.1 0.17 Maxilla to M
x incisors M
x1.NA (degrees)
24.2 7.0 23.2 5.1 26.5 6.7 24.1 7.8 0.34
Mx1-‐N
A (mm)
5.3 2.2 5.1 1.8 5.8 1.7 5.2 2.6 0.60
Mandible to M
n Incisors M
n1.NB (degrees)
31.9 5.6 32.9 5.9 31.5 5.6 31.6 5.6 0.58
Mn1.N
B (mm)
7.1 2.3 7.3 2.3 7.7 2.1 6.9 2.4 0.44
Mn1.M
P (degrees) 102.3 7.4 102.7 7.8 100.4 6.0 102.6 7.6 0.55
Mx m
idline deviation from
facial midline 0.2 0.6
0.2 0.5 0.6 0.7 0.2 0.5 0.07 Mn m
idline deviation from
facial midline 0.7 0.9
0.3 0.6 0.2 0.4 1.0 1.0 0.0001
Final overjet
3.1 1.1 2.9 0.8 3.2 0.6 3.1 1.3
0.48 Final overbite 2.5 0.9 2.4 0.6 2.5 0.8 2.5 1.1 0.84 Final PAR score
6.9 5.5 6.4 5.4 6.0 5.3 7.4 5.7 0.61 Group 1 = Both M
idlines On Group 2 = M
axillary Midline Off
Group 3= Mandibular M
idline Off

29
Table IV: Initial and Final PAR and Treatment Tim
es
GROUP 1 (n=27) GR
OUP 2 (n=16) GR
OUP 3 (n=55)
Ext (13) N
on-‐Ext (14) Ext (5) Non-‐Ext (9) Surgery (2) Ext (18) N
on-‐Ext (33) Surgery (4)
Variables mean SD m
ean SD P mean SD m
ean SD mean SD m
ean SD mean SD m
ean SD P Tx tim
e (months) 31.3 12.5 25.3 10.0 0.18 32.0 8.5 29.3 12.1 68.8 9.1 32.0 9.6 25.0 9.0 50.4 29.1 0.008 *
Initial PAR score 29.4 11.2 21.3 7.7 0.026 * 32.6 10.6 27.4 9.8 16.3 12.4 32.5 9.9 26.6 8.6 39.0 13.5 0.008* Final PAR score 6.7 3.9 6.1 6.3 0.74 5.0 6.3 6.8 6.5 7.2 6.0 7.1 3.9 7.7 6.5 5.1 3.4 0.48 Group 1 = Both M
idlines On Group 2 = M
axillary Midline Off
Group 3= Mandibular M
idline Off * Significant difference betw
een extraction vs.. non-‐extraction