Embed Size (px)
Citation preview
International Research Journal of Engineering and Technology (IRJET) e-ISSN: 2395 -0056
Volume: 02 Issue: 05 | Aug-2015 www.irjet.net p-ISSN: 2395-0072
© 2015, IRJET ISO 9001:2008 Certified Journal Page 125
Classification of Thyroid Nodules in Ultrasound Images using kNN and
Decision Tree
Gayana H B1, Nanda S2
1 IV Sem, M.Tech, Biomedical Signal processing & Instrumentation, SJCE, Mysuru, Karnataka, India 2 Assistant Professor, Department of IT, SJCE, Mysuru, Karnataka, India
---------------------------------------------------------------------***---------------------------------------------------------------------Abstract - Thyroid nodules are abnormal growth which can be solid or cystic lumps within the thyroid glands. Differentiating between benign and malignant thyroid nodules is important for providing appropriate treatment where ultrasound imaging plays an important role. In digital image processing techniques, the characterization of the thyroid tissue offers the texture description using the ultrasound images. This paper presents the characterization and classification of thyroid nodules in ultrasound images. It includes extraction of two sets of features based on GLCM and Gabor filters. The performance of the classifiers was evaluated with the accuracy, sensitivity and specificity.
Key Words: Ultrasound Thyroid Images, Thyroid
Nodule, GLCM, Gabor Filter, kNN, Decision Tree
1. INTRODUCTION Thyroid nodules are commonly found in regions where there is less supply of iodine in unselected adults between the age of 18-65 years are reported [1]. Ultrasound is a one of the widely used medical imaging techniques, providing substantial clues in differential diagnosis having an advantage of non-invasiveness, low cost and short acquisition time [2]. Echogeneity, texture and shape are the useful features of the US images usually correlated with the pathology of the thyroid nodules [3]. Assessment of the calcification patterns in ultrasound thyroid nodules is carried out by Lu et. al [4] based on GLCM and gabor filter, the textural features based on local binary patterns are extracted by Liu et. al [5] to classify benign and malignant thyroid nodules using SVM. Multiple feature extraction process proposed by Chen et. al [6] included statistical moments, geometrical moments and textural moments which are extracted from region of interest [ROI]. Literature also reveals the application of kNN [7-8] & Decision Tree [9-10] for the classification of thyroid nodules.
2. DATASET
Dataset of ultrasound thyroid images includes 28 benign and 15 malignant nodules of different patients which are DICOM in nature. These images are set of B-mode images obtained from Philips HD11XE, 3-12MHz frequency, and are provided by JSS hospital, Mysuru. These images are labeled by the expert radiologist.
3. METHODOLOGY Characterization and classification of thyroid nodules involve
feature extraction and classification. The steps followed for implementation are shown in Fig-1. Gray level co-occurrence matrix (GLCM) and Gabor filter based features are used for texture characterization which helps in differentiating malignant thyroid nodule from benign nodule using k-nearest neighbor (kNN) and decision tree (DT) classifiers. Performance of the classifiers is evaluated using accuracy, sensitivity & specificity.
Fig -1: Flow diagram for thyroid nodule characterization
and classification
3.1 Feature Extraction Feature extraction is a method of capturing visual content of an image to ease the classification process. In this paper two different sets of features are extracted using GLCM
International Research Journal of Engineering and Technology (IRJET) e-ISSN: 2395 -0056
Volume: 02 Issue: 05 | Aug-2015 www.irjet.net p-ISSN: 2395-0072
© 2015, IRJET ISO 9001:2008 Certified Journal Page 126
and Gabor filters. These features are computed with the help of statistical approach. 3.1.1 Gray level Coocurrence Matrix (GLCM) Gray Level Coocurrence Matrix is a matrix where the number of rows and columns is equal to the number of quantized gray levels. The second order statistical probability values for changes between gray level i and j at a particular displacement distance (d) and (θ) [11]. The texture-content information is specified by the relative frequency C(i,j), represents the number of occurrence of gray levels i and j within, at a certain (d,θ) pair. The measure of probability is given by
Pro = (1)
Where p(i.j) is defined as
p(i,j) = (2)
The sum in the denominator represents the total number of gray level pairs within the window and C(i,j) represents the number of occurrences of gray levels i and j within the window. Eight different features [3] are used to quantitatively evaluate the textural characteristics of the thyroid nodules. 3.1.1.1 Autocorrelation Autocorrelation is a measure of the linear dependency of gray levels on those of neighboring pixels or specified points which indicates local gray-level dependency on the texture image.
Correlation= (3)
3.1.1.2 Variance Variance refers to the gray level variability of the pixel pairs and is a measurement of heterogeneity.
Variance=
(4)
3.1.1.3 Cluster Prominence It is a measure of asymmetry.
Pr= (5)
3.1.1.4 Cluster Shade Cluster shade is a measure of the skewness of the matrix.
Shade= (6)
Where (7)
(8)
(9)
(10)
x and are the mean and and are the standard
deviation.
3.1.2 Gabor Filter Features Gabor filter was first introduced by Dennis Gabor [12-13], a linear filter whose impulse response is defined by a sinusoidal plane wave modulated by a Gaussian function. Due to its optimal localization properties both in spatial and frequency domain, sharper boundaries can be detected.
Gabor function is given by
(11)
(12)
(13)
Where - scaling parameters of the filter describing
the neighborhood of a pixel where weighted summation takes place, W – central frequency of the complex
sinusoidal and - orientation of the normal to
the parallel strips of the Gabor function. Set of descriptors are computed from the feature vector which is constructed with the absolute values of the response as components namely mean and energy. 3.2. Classification Features which are obtained from GLCM and Gabor Filter are applied directly to k-Nearest Neighbor and Decision tree classifiers to categorize the benign and malignant thyroid nodules. 3.2.1 k- Nearest Neighbor (kNN) Classification in k-Nearest Neighbor takes place by locating the nearest space and labeling the unknown instance with the same class label as that of the known neighbor. Based on the known value of k, label is assigned among the k training samples nearest to that unknown data. Euclidean distance is the one of commonly used distance measures used to find the k-nearest neighbor and is given by
International Research Journal of Engineering and Technology (IRJET) e-ISSN: 2395 -0056
Volume: 02 Issue: 05 | Aug-2015 www.irjet.net p-ISSN: 2395-0072
© 2015, IRJET ISO 9001:2008 Certified Journal Page 127
(14)
The minimum distance between the training and test samples gives best classification of the test samples.
3.2.2 Decision Tree (DT) Decision Tree provides understandable and interpretable information regarding the predictive ability of the classification. Origin of measure and measure structure is the main criteria for splitting the tree. A binary criterion is used in the classification process, where value 0 is assigned when the tree recognizes benign attribute and 1 when the tree recognizes malignant attribute. Tree recursively selects the best attribute to split the data and expands the leaf nodes of the tree until the stopping criterion is met. 3.2.3 Performance Evaluation Evaluation of the proposed thyroid nodule classification method is carried out by calculating the performance in terms of true positive (TP), false positive (FP), true negative (TN) and false negative (FN) metrics. TP is defined as the number of benign nodules correctly detected in the ultrasound images; FP is defined as the number of benign nodules detected as malignant; TN is defined as the number malignant nodules correctly detected; and FN is defined as the number of malignant nodules detected as benign nodules by the system. By using these metrics we can obtain more meaningful performance measures like sensitivity, specificity and accuracy values as mentioned below.
Sensitivity = (15)
Specificity = (16)
Accuracy = (17)
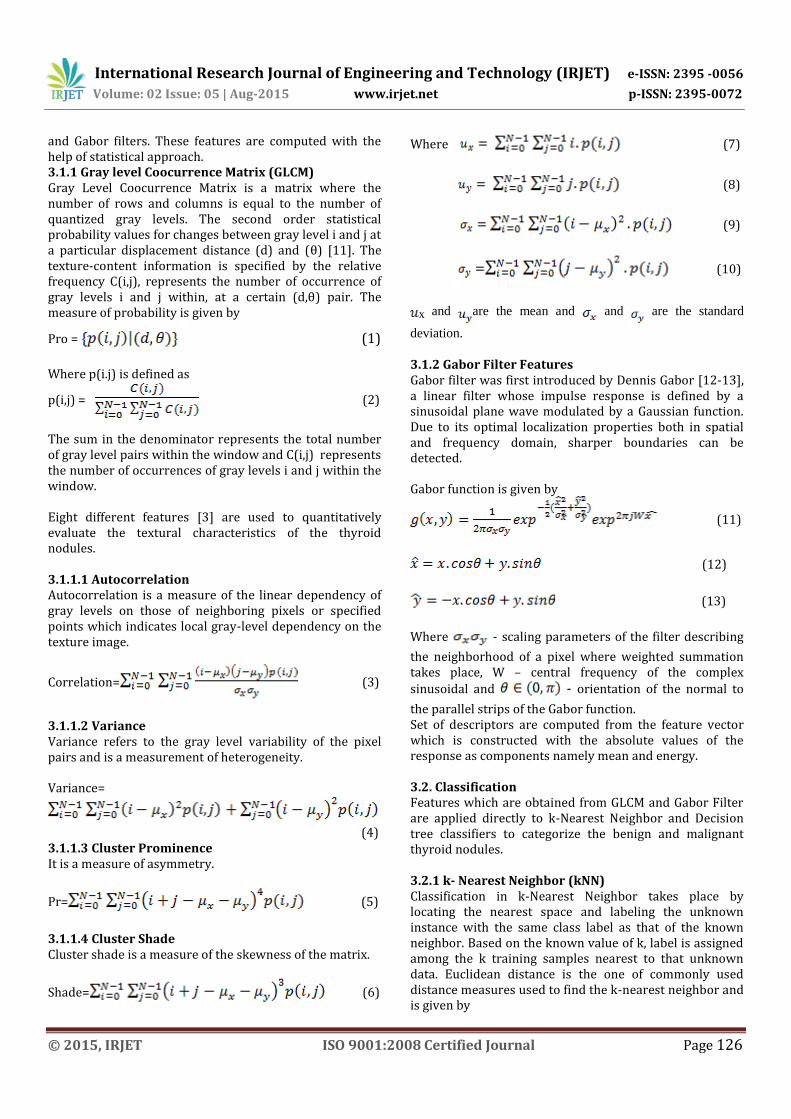
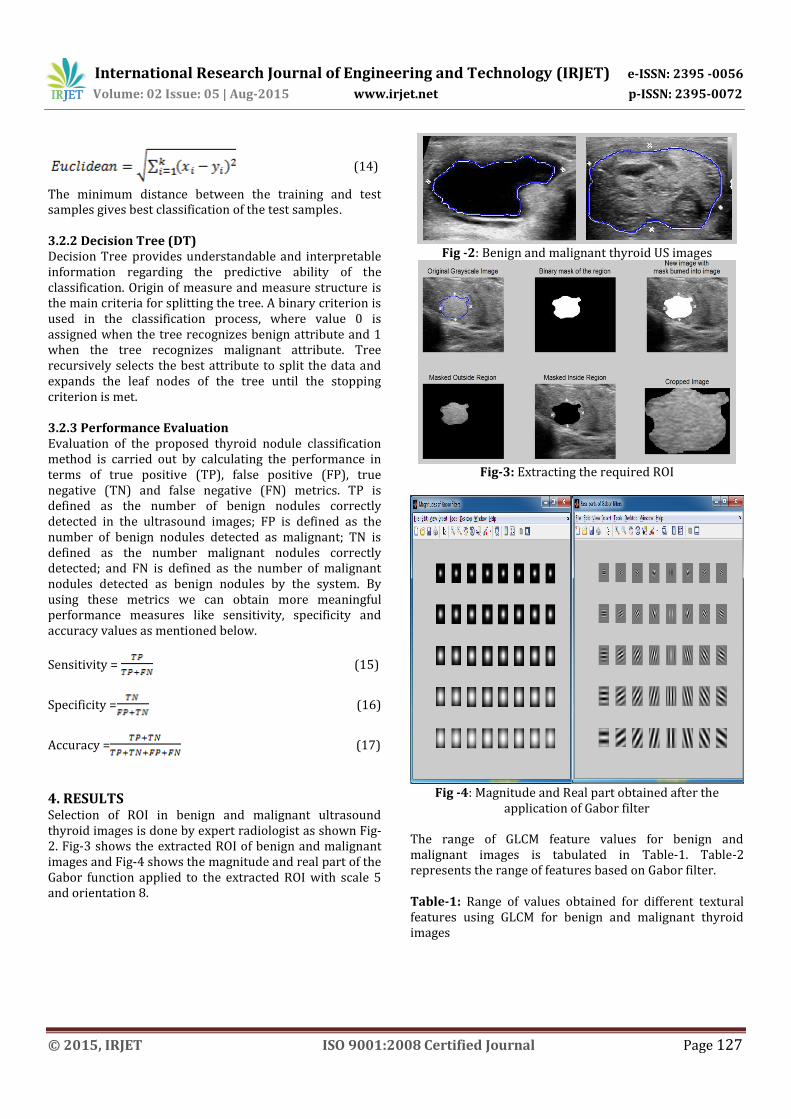
4. RESULTS Selection of ROI in benign and malignant ultrasound thyroid images is done by expert radiologist as shown Fig-2. Fig-3 shows the extracted ROI of benign and malignant images and Fig-4 shows the magnitude and real part of the Gabor function applied to the extracted ROI with scale 5 and orientation 8.
Fig -2: Benign and malignant thyroid US images
Fig-3: Extracting the required ROI
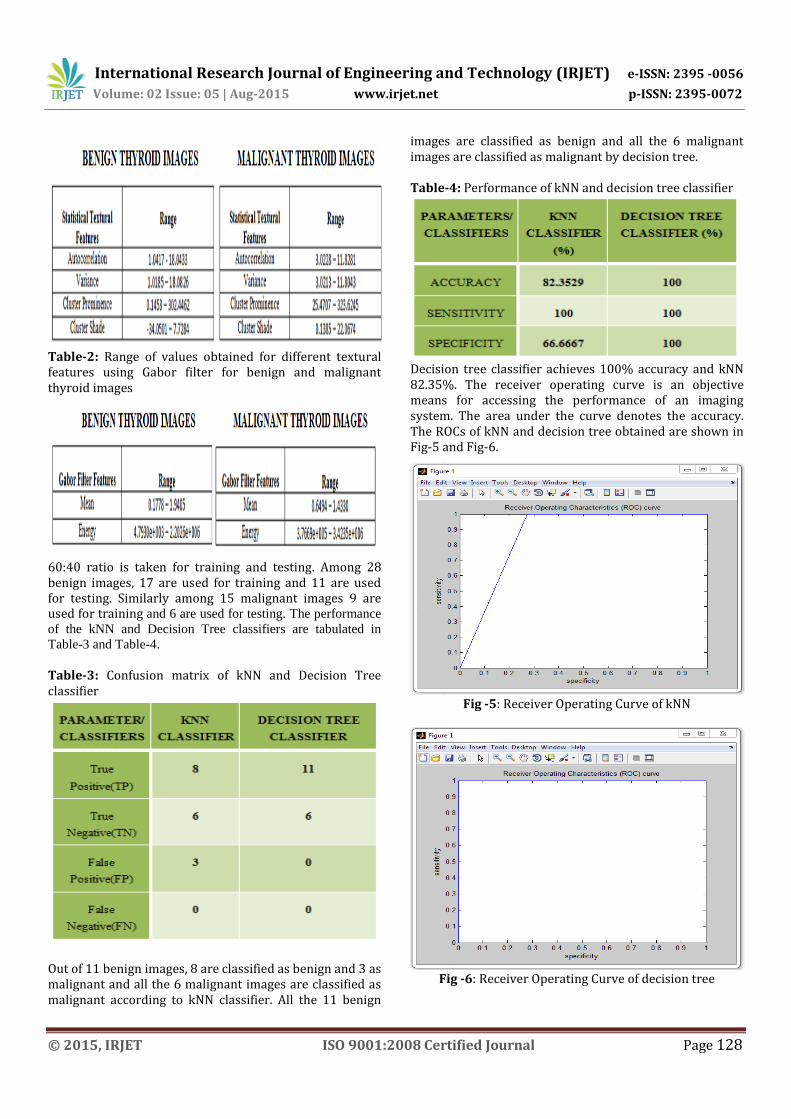
Fig -4: Magnitude and Real part obtained after the
application of Gabor filter
The range of GLCM feature values for benign and malignant images is tabulated in Table-1. Table-2 represents the range of features based on Gabor filter. Table-1: Range of values obtained for different textural features using GLCM for benign and malignant thyroid images
International Research Journal of Engineering and Technology (IRJET) e-ISSN: 2395 -0056
Volume: 02 Issue: 05 | Aug-2015 www.irjet.net p-ISSN: 2395-0072
© 2015, IRJET ISO 9001:2008 Certified Journal Page 128
Table-2: Range of values obtained for different textural features using Gabor filter for benign and malignant thyroid images
60:40 ratio is taken for training and testing. Among 28 benign images, 17 are used for training and 11 are used for testing. Similarly among 15 malignant images 9 are used for training and 6 are used for testing. The performance
of the kNN and Decision Tree classifiers are tabulated in
Table-3 and Table-4.
Table-3: Confusion matrix of kNN and Decision Tree classifier
Out of 11 benign images, 8 are classified as benign and 3 as malignant and all the 6 malignant images are classified as malignant according to kNN classifier. All the 11 benign
images are classified as benign and all the 6 malignant images are classified as malignant by decision tree. Table-4: Performance of kNN and decision tree classifier
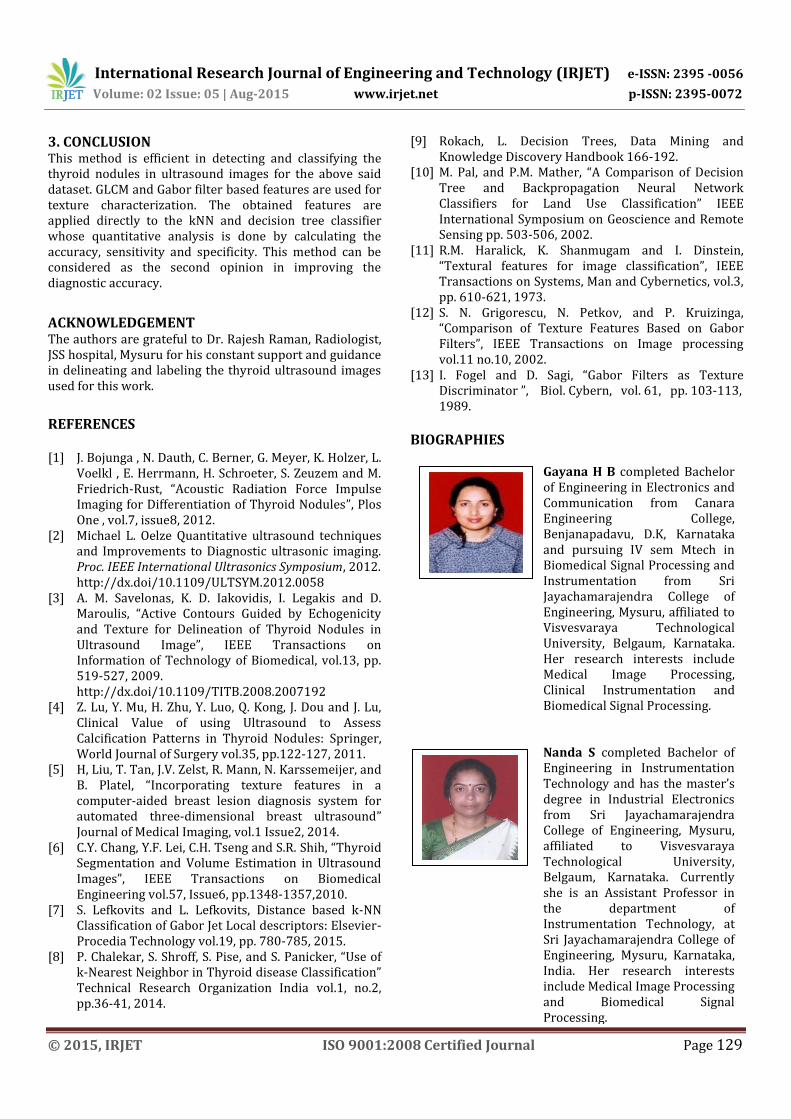
Decision tree classifier achieves 100% accuracy and kNN 82.35%. The receiver operating curve is an objective means for accessing the performance of an imaging system. The area under the curve denotes the accuracy. The ROCs of kNN and decision tree obtained are shown in Fig-5 and Fig-6.
Fig -5: Receiver Operating Curve of kNN
Fig -6: Receiver Operating Curve of decision tree
International Research Journal of Engineering and Technology (IRJET) e-ISSN: 2395 -0056
Volume: 02 Issue: 05 | Aug-2015 www.irjet.net p-ISSN: 2395-0072
© 2015, IRJET ISO 9001:2008 Certified Journal Page 129
3. CONCLUSION This method is efficient in detecting and classifying the thyroid nodules in ultrasound images for the above said dataset. GLCM and Gabor filter based features are used for texture characterization. The obtained features are applied directly to the kNN and decision tree classifier whose quantitative analysis is done by calculating the accuracy, sensitivity and specificity. This method can be considered as the second opinion in improving the diagnostic accuracy.
ACKNOWLEDGEMENT The authors are grateful to Dr. Rajesh Raman, Radiologist, JSS hospital, Mysuru for his constant support and guidance in delineating and labeling the thyroid ultrasound images used for this work.
REFERENCES [1] J. Bojunga , N. Dauth, C. Berner, G. Meyer, K. Holzer, L.
Voelkl , E. Herrmann, H. Schroeter, S. Zeuzem and M. Friedrich-Rust, “Acoustic Radiation Force Impulse Imaging for Differentiation of Thyroid Nodules”, Plos One , vol.7, issue8, 2012.
[2] Michael L. Oelze Quantitative ultrasound techniques and Improvements to Diagnostic ultrasonic imaging. Proc. IEEE International Ultrasonics Symposium, 2012. http://dx.doi/10.1109/ULTSYM.2012.0058
[3] A. M. Savelonas, K. D. Iakovidis, I. Legakis and D. Maroulis, “Active Contours Guided by Echogenicity and Texture for Delineation of Thyroid Nodules in Ultrasound Image”, IEEE Transactions on Information of Technology of Biomedical, vol.13, pp. 519-527, 2009. http://dx.doi/10.1109/TITB.2008.2007192
[4] Z. Lu, Y. Mu, H. Zhu, Y. Luo, Q. Kong, J. Dou and J. Lu, Clinical Value of using Ultrasound to Assess Calcification Patterns in Thyroid Nodules: Springer, World Journal of Surgery vol.35, pp.122-127, 2011.
[5] H, Liu, T. Tan, J.V. Zelst, R. Mann, N. Karssemeijer, and B. Platel, “Incorporating texture features in a computer-aided breast lesion diagnosis system for automated three-dimensional breast ultrasound” Journal of Medical Imaging, vol.1 Issue2, 2014.
[6] C.Y. Chang, Y.F. Lei, C.H. Tseng and S.R. Shih, “Thyroid Segmentation and Volume Estimation in Ultrasound Images”, IEEE Transactions on Biomedical Engineering vol.57, Issue6, pp.1348-1357,2010.
[7] S. Lefkovits and L. Lefkovits, Distance based k-NN Classification of Gabor Jet Local descriptors: Elsevier- Procedia Technology vol.19, pp. 780-785, 2015.
[8] P. Chalekar, S. Shroff, S. Pise, and S. Panicker, “Use of k-Nearest Neighbor in Thyroid disease Classification” Technical Research Organization India vol.1, no.2, pp.36-41, 2014.
[9] Rokach, L. Decision Trees, Data Mining and Knowledge Discovery Handbook 166-192.
[10] M. Pal, and P.M. Mather, “A Comparison of Decision Tree and Backpropagation Neural Network Classifiers for Land Use Classification” IEEE International Symposium on Geoscience and Remote Sensing pp. 503-506, 2002.
[11] R.M. Haralick, K. Shanmugam and I. Dinstein, “Textural features for image classification”, IEEE Transactions on Systems, Man and Cybernetics, vol.3, pp. 610-621, 1973.
[12] S. N. Grigorescu, N. Petkov, and P. Kruizinga, “Comparison of Texture Features Based on Gabor Filters”, IEEE Transactions on Image processing vol.11 no.10, 2002.
[13] I. Fogel and D. Sagi, “Gabor Filters as Texture Discriminator ”, Biol. Cybern, vol. 61, pp. 103-113, 1989.
BIOGRAPHIES
Gayana H B completed Bachelor of Engineering in Electronics and Communication from Canara Engineering College, Benjanapadavu, D.K, Karnataka and pursuing IV sem Mtech in Biomedical Signal Processing and Instrumentation from Sri Jayachamarajendra College of Engineering, Mysuru, affiliated to Visvesvaraya Technological University, Belgaum, Karnataka. Her research interests include Medical Image Processing, Clinical Instrumentation and Biomedical Signal Processing. Nanda S completed Bachelor of Engineering in Instrumentation Technology and has the master’s degree in Industrial Electronics from Sri Jayachamarajendra College of Engineering, Mysuru, affiliated to Visvesvaraya Technological University, Belgaum, Karnataka. Currently she is an Assistant Professor in the department of Instrumentation Technology, at Sri Jayachamarajendra College of Engineering, Mysuru, Karnataka, India. Her research interests include Medical Image Processing and Biomedical Signal Processing.