Embed Size (px)
Citation preview
Environ Fluid MechDOI 10.1007/s10652-014-9365-0
ORIGINAL ARTICLE
Clay settling in fresh and salt water
Bruce R. Sutherland · Kai J. Barrett ·Murray K. Gingras
Received: 28 January 2014 / Accepted: 22 May 2014© Springer Science+Business Media Dordrecht 2014
Abstract To gain insight into the process of sedimentation occurring when clay-laden estu-aries and deltas enter marine water, we perform laboratory experiments to measure the settlingrate of initially unflocculated kaolin clay in fresh and salt water. In fresh water, sedimentationis a slow process with the clay particle concentration gradually decreasing nearly uniformlyover hours, consistent with the time-scale expected for particles falling at the Stokes settlingspeed. The dynamics are dramatically different for clay setting in salt water with salini-ties between S = 10 and 70 psu. Within minutes the clay particles flocculate and a sharpconcentration-front between clear water (above) and water with clay in suspension (below)forms near the surface. After formation the concentration-front descends at a near constantspeed until the effects of hindered settling become important. When the concentration-frontforms in saline fluid, the 10 cm deep tank is cleared of particles in tens of minutes instead oftens of hours as is the case for settling in fresh water (S = 0). The initial speed of descent ofthe front, w, depends weakly upon salinity, S, with virtually no dependence upon S providedS � 20 psu. However, the descent speed, w, depends strongly upon clay concentration, C ,with w decreasing as C increases according to a power law: w ∝ C−1.7. The results are con-sistent with observations of relatively quiescent sediment-laden estuaries and deltas wherethey empty into the ocean.
Keywords Particle settling · Flocculation · Sedimentation
Electronic supplementary material The online version of this article (doi:10.1007/s10652-014-9365-0)contains supplementary material, which is available to authorized users.
B. R. Sutherland (B)Departments of Physics and of Earth & Atmospheric Sciences, University of Alberta,Edmonton, AB T6G 2E1, Canadae-mail: [email protected]
K. J. BarrettDepartment of Physics, University of Alberta, Edmonton, AB, Canada
M. K. GingrasDepartment Earth & Atmospheric Sciences, University of Alberta, Edmonton, AB, Canada
123
Environ Fluid Mech
1 Introduction
In natural settings, flocculation of clay minerals occurs dominantly in estuaries and deltaswhere fluvial (i.e., ∼0 psu) waters are mixed with marine waters (∼30 psu). This process ofsedimentation is of interest as it strongly influences the distribution of fine-grained sedimentin these marginal-marine locales. Parameterizing mud-bed sedimentation can help to interpretmud-rock distribution in the stratigraphic record. For example, within estuaries the inner halfis more prone to hosting clay-dominated strata. In contrast, deltas export mud to the deltafront and prodelta.
Herein we present the results of simple experiments that provide insight into the influenceof salinity upon flocculation and settling of clay particles. The experiment results allow usto develop an empirical model characterizing the influence that salinity has on the rate ofsettling of inorganic particles as a result of changes in the flocculation of the clay mineralkaolinite. We also show that increasing the salinity beyond a nominal value does not changethe settling rate, whereas this rate is retarded as particle concentrations become large.
Through a combination of laboratory experiments and observations, several models havebeen proposed for the deposition (as well as erosion) rate of fines in turbulent shear flow.Generally these assume the deposition rate is proportional to concentration, C , of particlesand the settling velocity, ws [16–18,21,24,26,34]. Specifically, in the study of Winterwerp[34], the deposition rate was shown to be given simply by their product: D = wsCb in whichws depends upon time but not depth, and Cb is the near-bottom concentration. The laboratoryexperiments, designed to study the simultaneous processes of deposition and erosion, wereperformed in flume tanks with particles premixed with saline water. As such they did notfocus specifically upon deposition as it depends upon salinity and particle concentration inthe absence of turbulent stresses.
Oligohaline (0.5–5 psu) and mesohaline salinities (5–18 psu) are broadly accepted toinduce flocculation and clay settling [2,7,32]. This corresponds well to studies in modernestuaries, where the turbidity maximum zone is normally positioned within the inner estuary,and where salinities are characteristically below 10 psu [10,32]. For example, in a study ofChesapeake Bay by Cerco et al. [3] the summertime turbidity maxima for the northern andnortheastern estuary reaches occur approximately in the range 7.5–12.5 psu (in the winter,salinity is ∼5 psu lower in those areas). This is likely a result of enhanced flocculationand tidal resuspension in the area of pronounced flocculation. Suspended sediment contentdecreases in the seaward direction, which is interpreted to be a result of clay sedimentation inthe inner estuary and dilution from sea water. The overall distribution of fine sediment is morecomplicated, in that some tributaries to Chesapeake Bay (e.g., the Choptank and Nanticokerivers) contribute little in the way of fine sediment, and thus display no pronounced turbiditymaximum. In contrast, the James River is closer to the bay mouth and its associated sedimentis deposited further seaward than the other rivers.
Although this qualitative link between salinity and suspended inorganic solids is partic-ularly clear in Chesapeake Bay (Cerco et al. [3], Fig. 5a), it has also been observed in theGironde Estuary, France [1], the Jiaojiang Estuary, China (Guan et al. [11], Fig. 5), and inKouchibouguac Bay, Canada [13], to name a few.
Such trends in particle settling and sedimentation may be understood from the chemicalbehaviour of clay minerals. Individual clay particles are plate shaped with negative chargesaround their perimeter and positive charges in the center. This arrangement of charges is suchthat plates repel each other when dispersed in fresh water. However, if the water is saline,sodium and chlorine ions act to neutralize the repulsive forces so that the plates may flocculate.Consequently, clay is expected to settle as flocs in salt water faster than as individual plates in
123
Environ Fluid Mech
fresh water. Indeed, clay settling in salt water qualitatively changes the nature of the settlingdynamics. When flocs form and settle, they sweep up smaller particles and flocs beneath themas they fall. Thus, the incident flocs grow to larger size and fall faster and more efficiently,sweeping up smaller particles. This positive feedback leads to the formation of a descendingconcentration-front between near surface fresh water, which has been swept nearly clear ofclay, and concentrated clay flocs [5]. The concentration-front should not be confused withthe lutocline associated with the rapid increase of clay concentration with depth betweensuspended clays and the mobile fluid mud layer overlying the sediment bed [25]. Herein, by“concentration-front” we refer to the rapid increase in clay concentration from water devoidof clay near the surface to suspended clay particles below.
In this study, we perform controlled laboratory experiments to examine the formation ofthe concentration-front as it depends upon clay concentration and ambient salinity. The exper-imental set-up and analysis methods are described in Sect. 2. Here we also present qualitativeresults showing how salinity is responsible for the formation of clay concentration-fronts inmixtures of initially unflocculated clay. In Sect. 3 we quantify for the first time the forma-tion time and rate of descent of the concentration-front as a function of clay concentrationand salinity. Connections between this work and observations of enhanced sedimentation atfluvial outflows into the ocean are discussed in Sect. 4.
2 Set-up, analytical methods and qualitative results
The experiment set-up is sketched in Fig. 1. More than 50 experiments were performed ina rectangular tank with 0.5 cm thick acrylic side walls. The interior length and width of thetank is 20.0 and 5.1 cm, respectively. The tank is 30 cm tall, but the tank was filled to 10(±0.1)cm with fresh water at the start of an experiment. A specified mass of salt (if any) wasthen mixed in and the resulting density measured to five-digit accuracy using an Anton PaarDMA 4500 density meter. We performed experiments with saline solutions ranging betweenfresh and 70 psu.
A specified mass of kaolin clay was then added to the fresh or salt water. Over all, threetypes of clays were examined. In the experiments for which the formation and evolutionof the concentration-front was examined quantitatively, we used K-WHITE 5000, calcinedaluminum silicate powder [45 (±2) % Al2 O3 and 52 (±2) % Si O2] from American Ele-
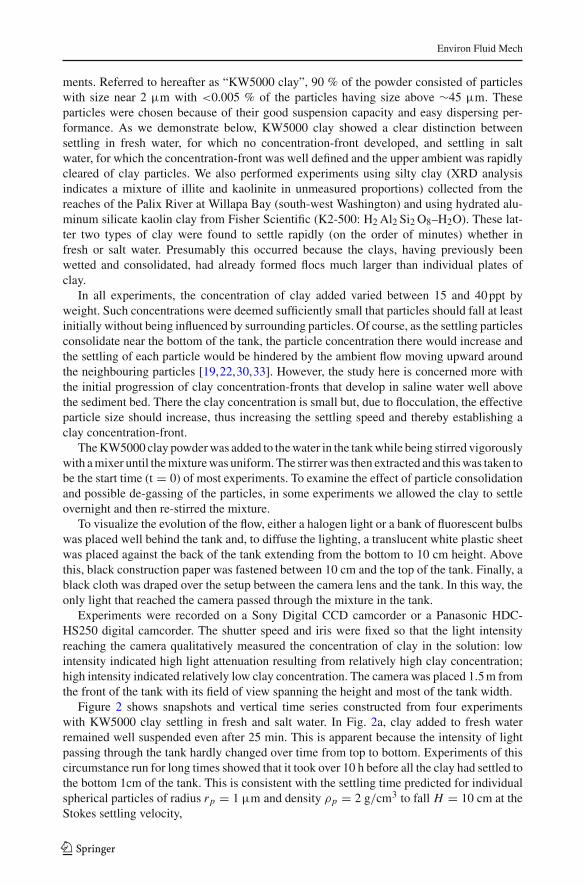
Fig. 1 Experimental setupshowing the side view of the tankfilled to depth H with waterhaving salinity S and clayconcentration C. A camera (left)looks through the tank, which islit from behind by a bank oflights (right) diffused by atranslucent white plastic sheet.The interior width of the tank isW and the distance from the frontof the tank to the camera is Lc
camera
black cloth
S, CH
WLc
123
Environ Fluid Mech
ments. Referred to hereafter as “KW5000 clay”, 90 % of the powder consisted of particleswith size near 2 µm with <0.005 % of the particles having size above ∼45 µm. Theseparticles were chosen because of their good suspension capacity and easy dispersing per-formance. As we demonstrate below, KW5000 clay showed a clear distinction betweensettling in fresh water, for which no concentration-front developed, and settling in saltwater, for which the concentration-front was well defined and the upper ambient was rapidlycleared of clay particles. We also performed experiments using silty clay (XRD analysisindicates a mixture of illite and kaolinite in unmeasured proportions) collected from thereaches of the Palix River at Willapa Bay (south-west Washington) and using hydrated alu-minum silicate kaolin clay from Fisher Scientific (K2-500: H2 Al2 Si2 O8–H2O). These lat-ter two types of clay were found to settle rapidly (on the order of minutes) whether infresh or salt water. Presumably this occurred because the clays, having previously beenwetted and consolidated, had already formed flocs much larger than individual plates ofclay.
In all experiments, the concentration of clay added varied between 15 and 40 ppt byweight. Such concentrations were deemed sufficiently small that particles should fall at leastinitially without being influenced by surrounding particles. Of course, as the settling particlesconsolidate near the bottom of the tank, the particle concentration there would increase andthe settling of each particle would be hindered by the ambient flow moving upward aroundthe neighbouring particles [19,22,30,33]. However, the study here is concerned more withthe initial progression of clay concentration-fronts that develop in saline water well abovethe sediment bed. There the clay concentration is small but, due to flocculation, the effectiveparticle size should increase, thus increasing the settling speed and thereby establishing aclay concentration-front.
The KW5000 clay powder was added to the water in the tank while being stirred vigorouslywith a mixer until the mixture was uniform. The stirrer was then extracted and this was taken tobe the start time (t = 0) of most experiments. To examine the effect of particle consolidationand possible de-gassing of the particles, in some experiments we allowed the clay to settleovernight and then re-stirred the mixture.
To visualize the evolution of the flow, either a halogen light or a bank of fluorescent bulbswas placed well behind the tank and, to diffuse the lighting, a translucent white plastic sheetwas placed against the back of the tank extending from the bottom to 10 cm height. Abovethis, black construction paper was fastened between 10 cm and the top of the tank. Finally, ablack cloth was draped over the setup between the camera lens and the tank. In this way, theonly light that reached the camera passed through the mixture in the tank.
Experiments were recorded on a Sony Digital CCD camcorder or a Panasonic HDC-HS250 digital camcorder. The shutter speed and iris were fixed so that the light intensityreaching the camera qualitatively measured the concentration of clay in the solution: lowintensity indicated high light attenuation resulting from relatively high clay concentration;high intensity indicated relatively low clay concentration. The camera was placed 1.5 m fromthe front of the tank with its field of view spanning the height and most of the tank width.
Figure 2 shows snapshots and vertical time series constructed from four experimentswith KW5000 clay settling in fresh and salt water. In Fig. 2a, clay added to fresh waterremained well suspended even after 25 min. This is apparent because the intensity of lightpassing through the tank hardly changed over time from top to bottom. Experiments of thiscircumstance run for long times showed that it took over 10 h before all the clay had settled tothe bottom 1cm of the tank. This is consistent with the settling time predicted for individualspherical particles of radius rp = 1 µm and density ρp = 2 g/cm3 to fall H = 10 cm at theStokes settling velocity,
123
Environ Fluid Mech
0
2
4
6
8
10
z[c
m]
(a) Settling in Fresh Water: snapshot at 15 min.
(b) Settling in Salt Water: snapshot at 15 min.
(c) Resettling in Fresh Water: snapshot at 15 min.
(d) Resettling in Salt Water: snapshot at 15 min.
vertical time series
0
2
4
6
8
10
z[c
m]
vertical time series
0
2
4
6
8
10
z[c
m]
vertical time series
02010x [cm]
0
2
4
6
8
10
z[c
m]
0 5 10 15 20 25t [min]
vertical time series
0 0.3
0 0.8
0 0.3
0 0.8
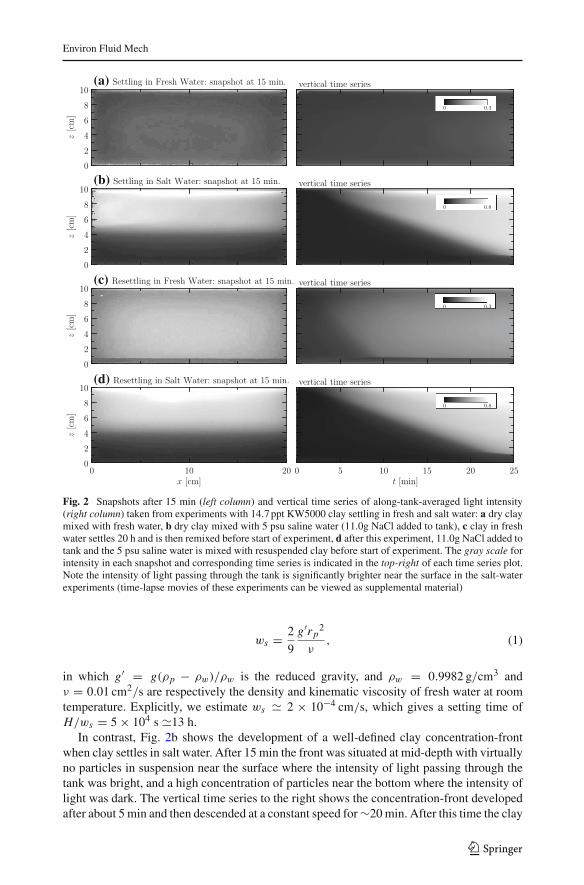
Fig. 2 Snapshots after 15 min (left column) and vertical time series of along-tank-averaged light intensity(right column) taken from experiments with 14.7 ppt KW5000 clay settling in fresh and salt water: a dry claymixed with fresh water, b dry clay mixed with 5 psu saline water (11.0g NaCl added to tank), c clay in freshwater settles 20 h and is then remixed before start of experiment, d after this experiment, 11.0g NaCl added totank and the 5 psu saline water is mixed with resuspended clay before start of experiment. The gray scale forintensity in each snapshot and corresponding time series is indicated in the top-right of each time series plot.Note the intensity of light passing through the tank is significantly brighter near the surface in the salt-waterexperiments (time-lapse movies of these experiments can be viewed as supplemental material)
ws = 2
9
g′rp2
ν, (1)
in which g′ = g(ρp − ρw)/ρw is the reduced gravity, and ρw = 0.9982 g/cm3 andν = 0.01 cm2/s are respectively the density and kinematic viscosity of fresh water at roomtemperature. Explicitly, we estimate ws � 2 × 10⁻⁴ cm/s, which gives a setting time ofH/ws = 5 × 10⁴ s �13 h.
In contrast, Fig. 2b shows the development of a well-defined clay concentration-frontwhen clay settles in salt water. After 15 min the front was situated at mid-depth with virtuallyno particles in suspension near the surface where the intensity of light passing through thetank was bright, and a high concentration of particles near the bottom where the intensity oflight was dark. The vertical time series to the right shows the concentration-front developedafter about 5 min and then descended at a constant speed for ∼20 min. After this time the clay
123
Environ Fluid Mech
consolidated sufficiently near the tank bottom so that settling was hindered and the advanceof the concentration-front slowed.
Comparing these two experiments clearly shows that salinity results in the developmentof a clay concentration-front, which significantly enhances the speed at which the particlessettle. Even in the absence of salinity, clay may settle quickly if the particles have alreadyflocculated. This was observed in experiments using Fisher K2-500 clay and with clay gath-ered from Willapa Bay. Some evidence of this was also seen in experiments with KW5000clay. Figure 2c shows the results of an experiment in which KW5000 clay was allowed tosettle overnight in fresh water before being remixed. Unlike the experiment shown in 3a,here a fraction of the particles are observed to settle out in the first 10 min of the experiment.Presumably, these were particles that formed flocs while consolidating at the bottom of thetank. However, a substantial fraction of the clay particles remained in suspension even after25 min, as evident by the relatively low intensity of light passing through the tank even nearthe surface (note that the intensity scale ranges from 0 to 0.3 in Fig. 2c whereas it rangesfrom 0 to 0.8 in Fig. 2b).
When the same amount of salt was added to the tank as was added in the experimentshown in Fig. 2b, we observe once again the formation of a clay concentration-front thatseparated particle-free fluid near the surface from high particle concentrations near the base(Fig. 2d).
Thus clay may settle quickly in fresh water if it has already undergone processes thatpermit the formation of large flocs [27]. But if the clay suspension remains fine (with particlesizes on the order of 1 µm), salinity clearly acts as a catalyst to the formation of flocs whilethe clay is still in suspension.
This paper seeks to quantify the development and evolution of the clay concentration-fronts sufficiently far above the sediment bed where hindered settling plays an insignificantrole. To track the front position in time, we sequentially examined frames from movies of theexperiment. Each frame was imported into the image- and data-analysis software “MatLab”(www.mathworks.com) where the digitized intensities were represented by a matrix fromwhich we calculated the horizontally averaged intensity as a function of height. Concatenatingthis time-dependent data, with a resolution of 1 s, we constructed vertical time series.
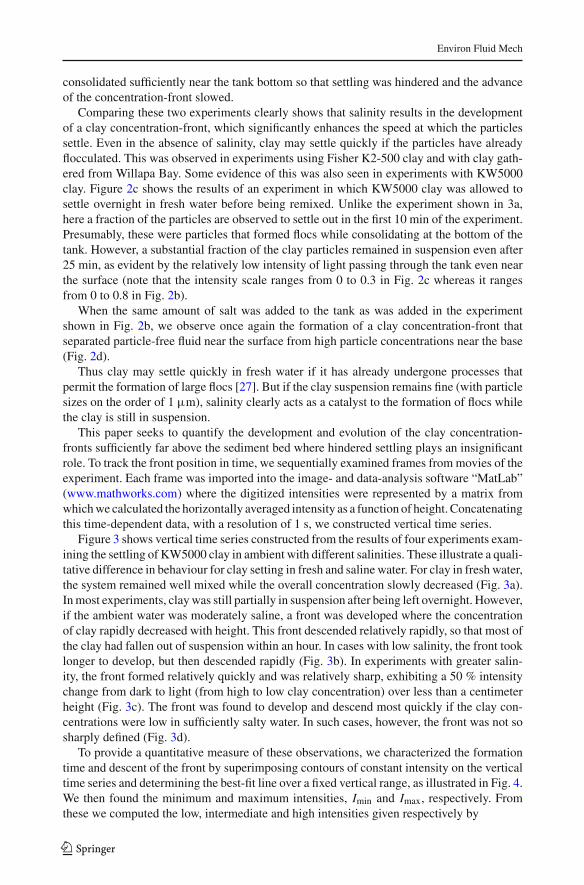
Figure 3 shows vertical time series constructed from the results of four experiments exam-ining the settling of KW5000 clay in ambient with different salinities. These illustrate a quali-tative difference in behaviour for clay setting in fresh and saline water. For clay in fresh water,the system remained well mixed while the overall concentration slowly decreased (Fig. 3a).In most experiments, clay was still partially in suspension after being left overnight. However,if the ambient water was moderately saline, a front was developed where the concentrationof clay rapidly decreased with height. This front descended relatively rapidly, so that most ofthe clay had fallen out of suspension within an hour. In cases with low salinity, the front tooklonger to develop, but then descended rapidly (Fig. 3b). In experiments with greater salin-ity, the front formed relatively quickly and was relatively sharp, exhibiting a 50 % intensitychange from dark to light (from high to low clay concentration) over less than a centimeterheight (Fig. 3c). The front was found to develop and descend most quickly if the clay con-centrations were low in sufficiently salty water. In such cases, however, the front was not sosharply defined (Fig. 3d).
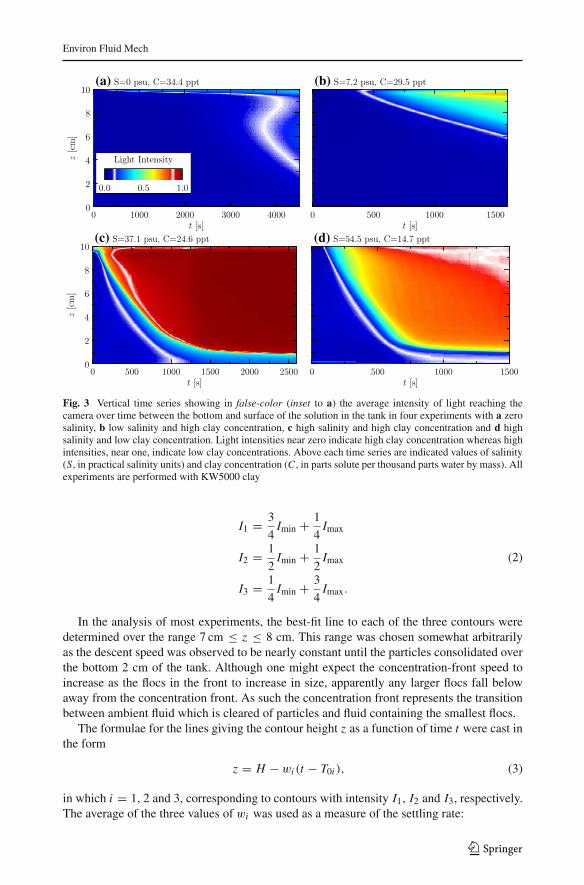
To provide a quantitative measure of these observations, we characterized the formationtime and descent of the front by superimposing contours of constant intensity on the verticaltime series and determining the best-fit line over a fixed vertical range, as illustrated in Fig. 4.We then found the minimum and maximum intensities, Imin and Imax, respectively. Fromthese we computed the low, intermediate and high intensities given respectively by
123
Environ Fluid Mech
0 1000 2000 3000 4000t [s]
0
2
4
6
8
10
z[c
m]
(a) S=0 psu, C=34.4 ppt
0 500 1000 1500t [s]
(b) S=7.2 psu, C=29.5 ppt
0 500 1000 1500 2000 2500t [s]
0
2
4
6
8
10
z[c
m]
(c) S=37.1 psu, C=24.6 ppt
0 500 1000 1500t [s]
(d) S=54.5 psu, C=14.7 ppt
0.0 0.5 1.0
Light Intensity
Fig. 3 Vertical time series showing in false-color (inset to a) the average intensity of light reaching thecamera over time between the bottom and surface of the solution in the tank in four experiments with a zerosalinity, b low salinity and high clay concentration, c high salinity and high clay concentration and d highsalinity and low clay concentration. Light intensities near zero indicate high clay concentration whereas highintensities, near one, indicate low clay concentrations. Above each time series are indicated values of salinity(S, in practical salinity units) and clay concentration (C , in parts solute per thousand parts water by mass). Allexperiments are performed with KW5000 clay
I1 = 3
4Imin + 1
4Imax
I2 = 1
2Imin + 1
2Imax (2)
I3 = 1
4Imin + 3
4Imax.
In the analysis of most experiments, the best-fit line to each of the three contours weredetermined over the range 7 cm ≤ z ≤ 8 cm. This range was chosen somewhat arbitrarilyas the descent speed was observed to be nearly constant until the particles consolidated overthe bottom 2 cm of the tank. Although one might expect the concentration-front speed toincrease as the flocs in the front to increase in size, apparently any larger flocs fall belowaway from the concentration front. As such the concentration front represents the transitionbetween ambient fluid which is cleared of particles and fluid containing the smallest flocs.
The formulae for the lines giving the contour height z as a function of time t were cast inthe form
z = H − wi (t − T0i ), (3)
in which i = 1, 2 and 3, corresponding to contours with intensity I1, I2 and I3, respectively.The average of the three values of wi was used as a measure of the settling rate:
123
Environ Fluid Mech
005100010050t [s]
0
2
4
6
8
10
z[c
m]
Determining Fall Velocity and Virtual Start Time
0.0 0.5 1.0
Light Intensity
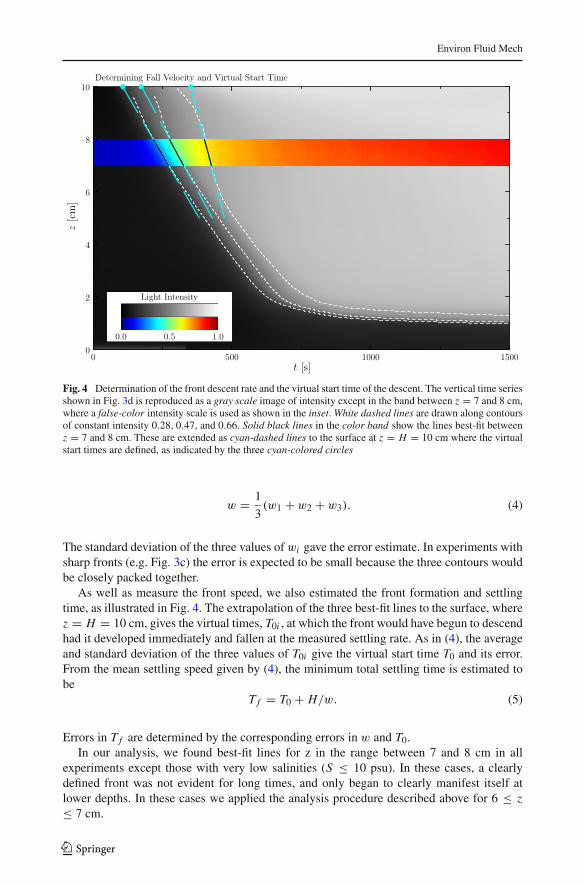
Fig. 4 Determination of the front descent rate and the virtual start time of the descent. The vertical time seriesshown in Fig. 3d is reproduced as a gray scale image of intensity except in the band between z = 7 and 8 cm,where a false-color intensity scale is used as shown in the inset. White dashed lines are drawn along contoursof constant intensity 0.28, 0.47, and 0.66. Solid black lines in the color band show the lines best-fit betweenz = 7 and 8 cm. These are extended as cyan-dashed lines to the surface at z = H = 10 cm where the virtualstart times are defined, as indicated by the three cyan-colored circles
w = 1
3(w1 + w2 + w3). (4)
The standard deviation of the three values of wi gave the error estimate. In experiments withsharp fronts (e.g. Fig. 3c) the error is expected to be small because the three contours wouldbe closely packed together.
As well as measure the front speed, we also estimated the front formation and settlingtime, as illustrated in Fig. 4. The extrapolation of the three best-fit lines to the surface, wherez = H = 10 cm, gives the virtual times, T0i , at which the front would have begun to descendhad it developed immediately and fallen at the measured settling rate. As in (4), the averageand standard deviation of the three values of T0i give the virtual start time T0 and its error.From the mean settling speed given by (4), the minimum total settling time is estimated tobe
T f = T0 + H/w. (5)
Errors in T f are determined by the corresponding errors in w and T0.In our analysis, we found best-fit lines for z in the range between 7 and 8 cm in all
experiments except those with very low salinities (S ≤ 10 psu). In these cases, a clearlydefined front was not evident for long times, and only began to clearly manifest itself atlower depths. In these cases we applied the analysis procedure described above for 6 ≤ z≤ 7 cm.
123
Environ Fluid Mech
3 Quantitative results
In all experiments with fresh water and KW5000 clay, no front developed. Rather the con-centration of clay gradually decreased in time, while exhibiting little variation in space. Evenafter more than 10 h, a substantial concentration of clay particles remained in suspension.
In salt water a front between high and low concentrations of clay developed. Our analysesof the formation and evolution of the fronts as a function of ambient salinity, provide insightinto the behaviour of clay suspensions in a range of salinities.
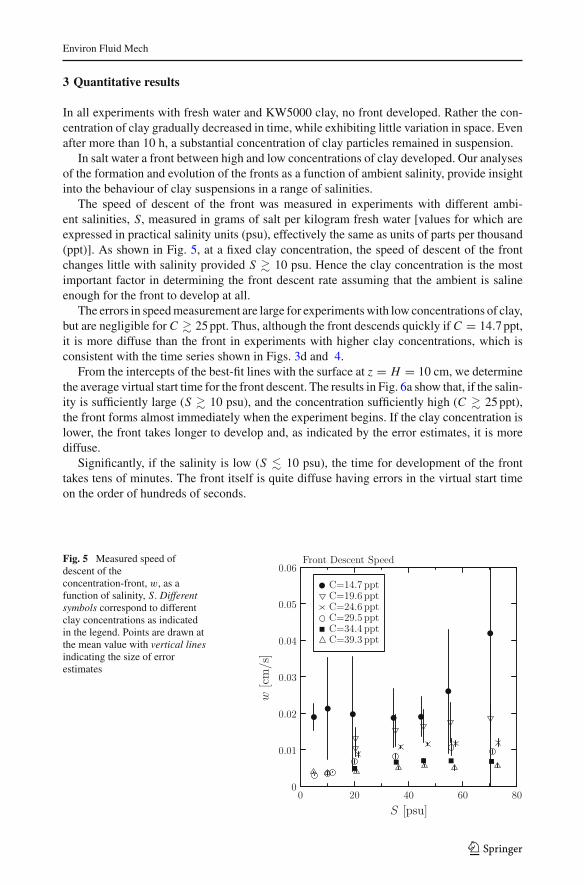
The speed of descent of the front was measured in experiments with different ambi-ent salinities, S, measured in grams of salt per kilogram fresh water [values for which areexpressed in practical salinity units (psu), effectively the same as units of parts per thousand(ppt)]. As shown in Fig. 5, at a fixed clay concentration, the speed of descent of the frontchanges little with salinity provided S � 10 psu. Hence the clay concentration is the mostimportant factor in determining the front descent rate assuming that the ambient is salineenough for the front to develop at all.
The errors in speed measurement are large for experiments with low concentrations of clay,but are negligible for C � 25 ppt. Thus, although the front descends quickly if C = 14.7 ppt,it is more diffuse than the front in experiments with higher clay concentrations, which isconsistent with the time series shown in Figs. 3d and 4.
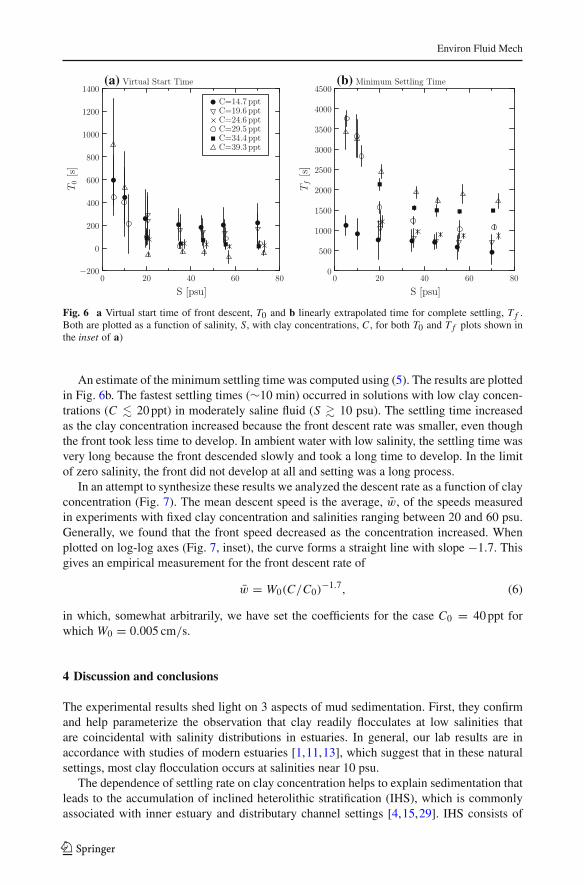
From the intercepts of the best-fit lines with the surface at z = H = 10 cm, we determinethe average virtual start time for the front descent. The results in Fig. 6a show that, if the salin-ity is sufficiently large (S � 10 psu), and the concentration sufficiently high (C � 25 ppt),the front forms almost immediately when the experiment begins. If the clay concentration islower, the front takes longer to develop and, as indicated by the error estimates, it is morediffuse.
Significantly, if the salinity is low (S � 10 psu), the time for development of the fronttakes tens of minutes. The front itself is quite diffuse having errors in the virtual start timeon the order of hundreds of seconds.
Fig. 5 Measured speed ofdescent of theconcentration-front, w, as afunction of salinity, S. Differentsymbols correspond to differentclay concentrations as indicatedin the legend. Points are drawn atthe mean value with vertical linesindicating the size of errorestimates
0 20 40 60 80
S [psu]
0
0.01
0.02
0.03
0.04
0.05
0.06
w[c
m/s
]
Front Descent Speed
C=14.7 pptC=19.6 pptC=24.6 pptC=29.5 pptC=34.4 pptC=39.3 ppt
123
Environ Fluid Mech
0 20 40 60 80
S [psu]
−200
0
200
400
600
800
1000
1200
1400
T0
[s]
(a) Virtual Start Time
C=14.7 pptC=19.6 pptC=24.6 pptC=29.5 pptC=34.4 pptC=39.3 ppt
0 20 40 60 80
S [psu]
0
500
1000
1500
2000
2500
3000
3500
4000
4500
Tf
[s]
(b) Minimum Settling Time
Fig. 6 a Virtual start time of front descent, T0 and b linearly extrapolated time for complete settling, T f .Both are plotted as a function of salinity, S, with clay concentrations, C , for both T0 and T f plots shown inthe inset of a)
An estimate of the minimum settling time was computed using (5). The results are plottedin Fig. 6b. The fastest settling times (∼10 min) occurred in solutions with low clay concen-trations (C � 20 ppt) in moderately saline fluid (S � 10 psu). The settling time increasedas the clay concentration increased because the front descent rate was smaller, even thoughthe front took less time to develop. In ambient water with low salinity, the settling time wasvery long because the front descended slowly and took a long time to develop. In the limitof zero salinity, the front did not develop at all and setting was a long process.
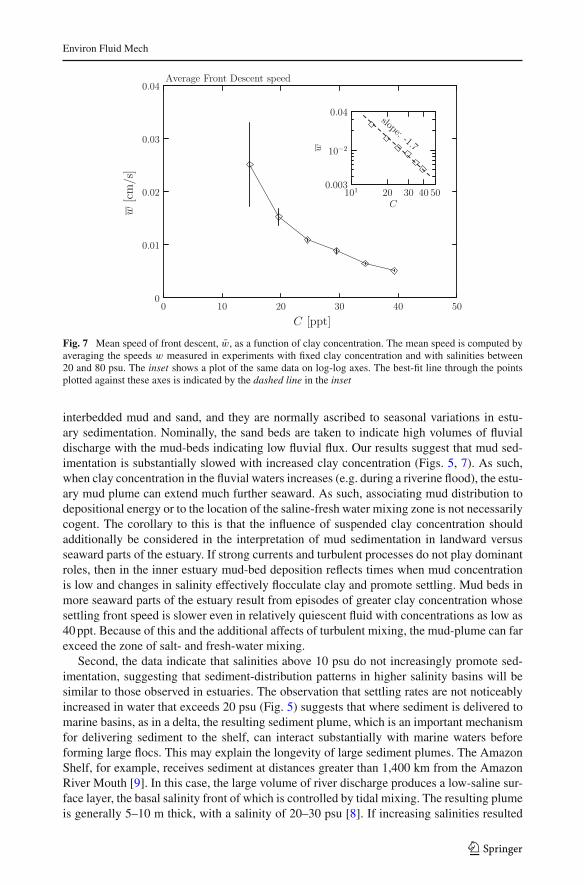
In an attempt to synthesize these results we analyzed the descent rate as a function of clayconcentration (Fig. 7). The mean descent speed is the average, w̄, of the speeds measuredin experiments with fixed clay concentration and salinities ranging between 20 and 60 psu.Generally, we found that the front speed decreased as the concentration increased. Whenplotted on log-log axes (Fig. 7, inset), the curve forms a straight line with slope −1.7. Thisgives an empirical measurement for the front descent rate of
w̄ = W0(C/C0)−1.7, (6)
in which, somewhat arbitrarily, we have set the coefficients for the case C0 = 40 ppt forwhich W0 = 0.005 cm/s.
4 Discussion and conclusions
The experimental results shed light on 3 aspects of mud sedimentation. First, they confirmand help parameterize the observation that clay readily flocculates at low salinities thatare coincidental with salinity distributions in estuaries. In general, our lab results are inaccordance with studies of modern estuaries [1,11,13], which suggest that in these naturalsettings, most clay flocculation occurs at salinities near 10 psu.
The dependence of settling rate on clay concentration helps to explain sedimentation thatleads to the accumulation of inclined heterolithic stratification (IHS), which is commonlyassociated with inner estuary and distributary channel settings [4,15,29]. IHS consists of
123
Environ Fluid Mech
0 10 20 30 40 50
C [ppt]
0
0.01
0.02
0.03
0.04
w[c
m/s
]
Average Front Descent speed
101 20 30 40 50C
0.003
10−2
0.04
w
slope: -1.7
Fig. 7 Mean speed of front descent, w̄, as a function of clay concentration. The mean speed is computed byaveraging the speeds w measured in experiments with fixed clay concentration and with salinities between20 and 80 psu. The inset shows a plot of the same data on log-log axes. The best-fit line through the pointsplotted against these axes is indicated by the dashed line in the inset
interbedded mud and sand, and they are normally ascribed to seasonal variations in estu-ary sedimentation. Nominally, the sand beds are taken to indicate high volumes of fluvialdischarge with the mud-beds indicating low fluvial flux. Our results suggest that mud sed-imentation is substantially slowed with increased clay concentration (Figs. 5, 7). As such,when clay concentration in the fluvial waters increases (e.g. during a riverine flood), the estu-ary mud plume can extend much further seaward. As such, associating mud distribution todepositional energy or to the location of the saline-fresh water mixing zone is not necessarilycogent. The corollary to this is that the influence of suspended clay concentration shouldadditionally be considered in the interpretation of mud sedimentation in landward versusseaward parts of the estuary. If strong currents and turbulent processes do not play dominantroles, then in the inner estuary mud-bed deposition reflects times when mud concentrationis low and changes in salinity effectively flocculate clay and promote settling. Mud beds inmore seaward parts of the estuary result from episodes of greater clay concentration whosesettling front speed is slower even in relatively quiescent fluid with concentrations as low as40 ppt. Because of this and the additional affects of turbulent mixing, the mud-plume can farexceed the zone of salt- and fresh-water mixing.
Second, the data indicate that salinities above 10 psu do not increasingly promote sed-imentation, suggesting that sediment-distribution patterns in higher salinity basins will besimilar to those observed in estuaries. The observation that settling rates are not noticeablyincreased in water that exceeds 20 psu (Fig. 5) suggests that where sediment is delivered tomarine basins, as in a delta, the resulting sediment plume, which is an important mechanismfor delivering sediment to the shelf, can interact substantially with marine waters beforeforming large flocs. This may explain the longevity of large sediment plumes. The AmazonShelf, for example, receives sediment at distances greater than 1,400 km from the AmazonRiver Mouth [9]. In this case, the large volume of river discharge produces a low-saline sur-face layer, the basal salinity front of which is controlled by tidal mixing. The resulting plumeis generally 5–10 m thick, with a salinity of 20–30 psu [8]. If increasing salinities resulted
123
Environ Fluid Mech
in ever increasing flocculation rates, such delta plumes would rapidly lose clay sediment andoffshore sediment transport would be greatly reduced.
A third important conclusion of this study is that high sediment concentrations discourageflocculation and may offer another mechanism for modeling offshore sediment transport inboth hyperpycnal and hypopycnal plumes. Specifically, we show that there is a tendency forsettling rates to slow where the suspended-sediment load exceeds 10 g/L. In most estuarysettings suspended sediment ranges in the turbidity maximum zone fall well below thisthreshold. Many tributaries of Chesapeake Bay, as well as Willapa Bay, Tillamook Bay andCoos Bay (west coast USA), display ∼1 g/L suspended sediment in the inner estuary [31].There are exceptions: the Amazon River estuary approaches 10 g/L [8]; the ChangjiangEstuary, China ranges from 0.5 to 10 g/L [28]; the Fly River delta in Papua New Guinea hasa turbidity maximum of 10 g/L [12]; the Trent Estuary in the UK is reaches ∼12 g/L [23];and the Gironde Estuary locally exceeds 12 g/L [6]. All of the high-suspended-sediment-load examples cited above export fine sediment to the oceanic basin, whereas estuaries withlow fine-grained sediment concentration discharge normally do not. This suggests that underconditions of high suspended-sediment loads, interference in the flocculation process is atleast a factor in transporting clay to the ocean basin.
The impairment of flocculation due to high suspended-sediment concentration may alsobe a factor in delivering fluid muds to the shelf. Fluid mud deposits are increasingly identifiedin the rock record, and are broadly ascribed to delta-associated density currents comprisingsediment-laden hyperpycnal flows derived from high-volume river discharge. Resulting den-sity flows can travel long distances [20], and are thought to represent an important processin transporting mud to the shelf. In recent observations of hyperpycnal flows, the suspendedsediment load exceeds 7 g/L (e.g., Waipaoa, NZ, 28 g/L [14]; the Fly River, PNG, 10 g/L[12]). Although speculative, based on the data, it is reasonable to hypothesize that the coher-ence of fluid muds may be in part maintained by the diminished flocculation rate of clay inthe marine basin.
Being performed in a stationary ambient fluid, our experiments neglect the ambient flowdynamics of estuaries, deltas and river plumes including the influence of turbulence, waves,currents, tides and motion near complex topography. As such our results are strictly applica-ble to relatively quiescent flows far from the influence of turbulence resulting from windstress and breaking waves in the surface mixed layer and from breaking internal waves andboundary layer processes. The next stage of research will examine the influence of turbulencein enhancing or disrupting flocculation and the formation of the concentration front.
Most of the experiments reported upon here used a synthetic clay, KW5000. This claywas useful for the purposes of running controlled laboratory experiments because the micro-scopic platelets of this clay were not significantly flocculated in dry form and because theyreadily dispersed without flocculating when first mixed into fresh water. Future work willexamine sedimentation of clays extracted from river estuaries with an aim of understandingthe influence of sea water upon pre-consolidated clay.
Acknowledgments This research was supported by the National Science and Engineering Research Councilof Canada (NSERC).
References
1. Allen GP, Posamentier HW (1993) Sequence stratigraphy and facies model of an incised valley fill; theGironde Estuary, France. J Sediment Petrol 63(3):378–391
123
Environ Fluid Mech
2. Ani SA, Dyer KR, Huntley DA (1991) Measurement of the influence of salinity on floc density andstrength. Geo-Mar Lett 11:154–158
3. Cerco CF, Kim SC, Noel MR (2013) Management modeling of suspended solids in the Chesapeake Bay,USA. Estuar Coast Shelf Sci 116:87–98
4. Choi K (2010) Rhythmic climbing-ripple cross-lamination in inclined heterolithic stratification (IHS) ofa macrotidal estuarine channel, Gomso Bay, west coast of Korea. J Sediment Res 80(6):550–561
5. Couch MC, Hinch EJ (1991) Sedimentation, aggregation and compaction. In: Bideau D, Dodds JA (eds)Physics of Granular Media. Nova Sciences, New York, pp 299–321
6. Doxaran D, Froidefond JM, Castaing P, Babin M (2009) Dynamics of the turbidity maximum zone in amacrotidal estuary (the Gironde, France): observations from field and MODIS satellite data. Estuar CoastShelf Sci 81(3):321–332
7. Eisma D, Cadee GC (1991) Particulate matter processes in estuaries. SCOPE 42:283–2968. Geyer WR, Beardsley RC, Lentz SJ, Candela J, Limeburner R, Johns WE, Soares ID (1996) Physical
oceanography of the Amazon shelf. Cont Shelf Res 16(5–6):575–6169. Gibbs RJ (1977) Clay mineral segregation in the marine environment. J Sediment Petrol 47(1):237–243
10. Gingras MK, Pemberton SG, Saunders T, Clifton HE (1999) The ichnology of modern and pleistocenebrackish-water deposits at Willapa Bay, Washington; variability in estuarine settings. Palaios 14(4):352–374
11. Guan WB, Kot SC, Wolanski E (2005) 3-D fluid-mud dynamics in the Jiaojiang Estuary, China. EstuarCoast Shelf Sci 65(4):747–762
12. Harris PT, Hughes MG, Baker EK, Dalrymple RW, Keene JB (2004) Sediment transport in distributarychannels and its export to pro-deltaic environment in a tidally dominated delta: fly river, Papua NewGuinea. Cont Shelf Res 24:2431–2454
13. Hauck TE, Dashtgard SE, Pemberton SG, Gingras MK (2009) Brackish-water ichnological trends in amicrotidal barrier island-embayment system, Kouchibouguac National Park, New Brunswick, Canada.Palaios 24(8):478–496
14. Hicks DM, Gomez B, Trustrum NA (2004) Event suspended sediment characteristics and the generationof hyperpycnal plumes at river mouths: East coast continental margin, north island, New Zealand. J Geol112:471–485
15. Hovikoski J, Rasanen M, Gingras MK, Ranzi A, Melo J (2008) Tidal and seasonal controls in the for-mation of late Miocene inclined heterolithic stratification deposits, western Amazonian foreland basin.Sedimentology 55(3):499–530
16. Khelifa A, Hill PS (2006) Models for effective density and settling velocity of flocs. J Hydraul Res44(3):390–401
17. Krone RB (1962) Flume studies of the transport of sediment in estuarial shoaling processes. Tech. Rep.Final Report, Hydraulic Engineering Laboratory and Sanitary Engineering Research Laboratory, Univer-sity of California, Berkeley
18. Krone RB (1993) Sedimentation revisited. In: Mehta AJ (ed) Nearshore and Estuarine Cohesive SedimentTransport, Coastal and Estuarine Studies. Americal Geophysical Union, pp 108–125
19. Kynch G (1952) A theory of sedimentation. Trans Faraday Soc 48:166–17620. Lamb MP, Mohrig D (2009) Do hyperpycnal-flow deposits record river flood dynamics. Geology
37(12):1067–107021. Lau YI, Krishnappan BB (1994) Does re-entrainment occur during cohesive sediment settling? J Hydraul
Eng 120(2):236–24422. Mehta AJ (1986) Characterization of cohesive sediment properties and transport processes in estuaries.
In: Mehta AJ (ed) Estuarine Cohesive Sediment Dynamics, vol 14, Lecture Notes in Coastal and EstuarineStudiesSpringer, Berlin, pp 290–325
23. Mitchell SB, Lawler DM, West JR, Couperthwaite JS (2003) Use of continuous turbidity sensor in theprediction of fine sediment transport in the turbidity maximum of the Trent Estuary, UK. Estuar CoastShelf Sci 58:645–652
24. Parchure TM, Mehta AJ (1985) Erosion of soft cohesive sediment deposits. J Hydraul Eng 111(10):1308–1326
25. Ross MR, Mehta AJ (1989) On the mechanics of lutoclines and fluid mud. J Coast Res 5:51–6226. Sanford LP, Halka JP (1993) Assessing the paradigm of mutualy exclusive erosion and deposition of mud
with examples from upper Chesapeake Bay. Mar Geol 114:37–5727. Schieber J, Southard J, Thaisen K (2007) Accretion of mudstone beds from migrating floccule ripples.
Science 318:1760–176328. Shi Z, Kirby R (2003) Observations of fine suspended sediment processes in the turbidity maximum at
the north passage of the Changjiang Estuary, China. J Coast Res 19(3):529–540
123

Environ Fluid Mech
29. Sisulak C, Dashtgard S (2012) Seasonal controls on the development and character of inclined heterolithicstratification in a tide-influenced, fluvially dominated channel; Fraser River, Canada. J Sediment Res82(4):244–257
30. Travkovski P, Wiberg PL, Geyer WR (2007) Observations and modeling of wave-supported sedimentgravity flows on the Po prodelta and comparison to prior observations from the Eel Shelf. Cont Shelf Res27:375–399
31. Uncles RJ, Smith RE (2005) A note on the comparative turbidity of some estuaries of the americas. JCoast Res 21(4):845–852
32. Uncles RJ, Stephens JA, Law DJ (2006) Turbidity maximum in the macrotidal, highly turbid HumberEstuary, UK; flocs, fluid mud, stationary suspensions and tidal bores. Estuari Coast Shelf Sci 67(1–2):30–52
33. Winterwerp JC (2002) On the flocculation and settling velocity of estuarine mud. Cont Shelf Res 22:1339–1360
34. Winterwerp JC (2007) On the sedimentation rate of cohesive sediment. In: Maa JPY, Sanford LP, Schoell-hamer DH (eds) Estuarine and coastal fine sediment dynamics. Elsevier, Amsterdam, pp 209–226
123