Embed Size (px)
Citation preview
18 SWIM. Cartagena 2004, Spain. (Ed. Araguás, Custodio and Manzano). IGME
435
STUDY OF THE SALT WATER – FRESH WATER INTERFACE IN ENVIRONMENTSOF LOW RESISTIVITY: DOÑANA AQUIFER (SPAIN)
J.L. PLATA* and F. M. RUBIO
Geological Survey of Spain (IGME); Tres Cantos (Madrid) E-mails: [email protected]; [email protected]
Abstract
During the deposition of the sediments, a part of the Almonte-Marismas (Doñana) aquifer was covered bythe seawater, which remained trapped in some layers. The salt water was moved by the recharge watercoming from the unconfined portion of the aquifer, giving rise to an interface. Since 1967 severalgeophysical surveys have been made to determine the position of the interface, mostly based on the useof Vertical Electrical Soundings (VES). New surveys in 1976, 1982 and 1995 used hydrochemical analysis,conductivity logging and VES, giving new versions of the interface. Due to the dimension of the area andthe long distance between measuring points, these lines offer a very rough image of the actual interfacesituation. From 2002, IGME is essaying new geophysical strategies. Electrical imaging is the base method.Seismic reflection was also performed to avoid the interpretation problems caused by the low-resistivityenvironment. Temperature, conductivity, induction logging, spectral gamma ray and down-hole velocityhave also been measured at several wells. The initial conclusion of our work is that the penetration neededin this area is not always reached by the electrical imaging method. Otherwise, the real situation of theinterface seems to be rather more complicated than previously deduced from the available information.
Keywords: Doñana, petrophysics, electrical imaging, salt water, induction logging, spectral gamma
Introduction
The Almonte-Marismas aquifer (also called Doñana aquifer) is located in the Guadalquivir river basin, atthe south west of Spain. It is limited to the north by the outcropping of a Miocene-Pliocene formation ofblue marls, which is believed to be the impervious base of the aquifer, and that follows a line betweenHuelva and Seville; the eastern limit is the Guadalquivir River, and to the south the aquifer meets the
* Corresponding author
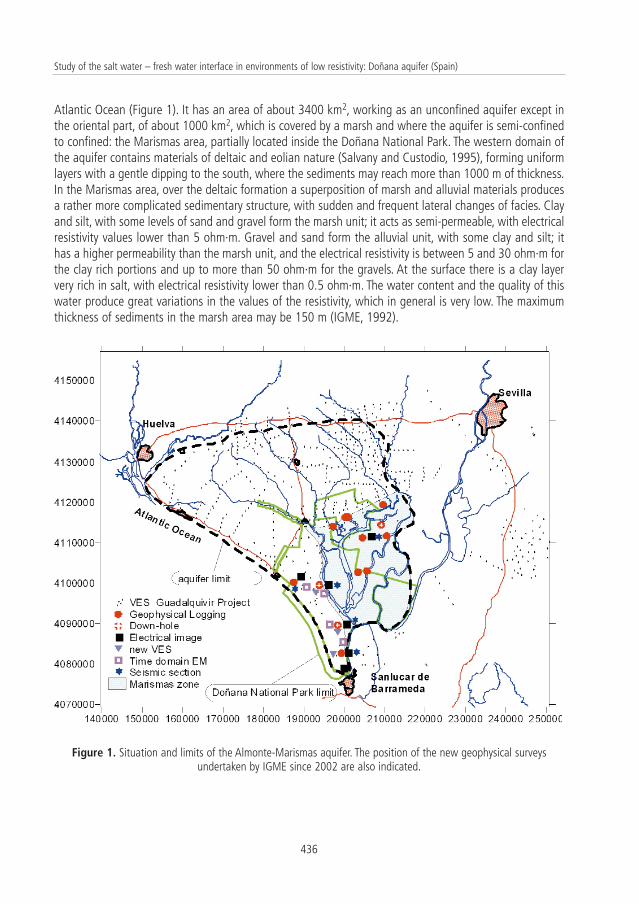
Atlantic Ocean (Figure 1). It has an area of about 3400 km2, working as an unconfined aquifer except inthe oriental part, of about 1000 km2, which is covered by a marsh and where the aquifer is semi-confinedto confined: the Marismas area, partially located inside the Doñana National Park. The western domain ofthe aquifer contains materials of deltaic and eolian nature (Salvany and Custodio, 1995), forming uniformlayers with a gentle dipping to the south, where the sediments may reach more than 1000 m of thickness.In the Marismas area, over the deltaic formation a superposition of marsh and alluvial materials producesa rather more complicated sedimentary structure, with sudden and frequent lateral changes of facies. Clayand silt, with some levels of sand and gravel form the marsh unit; it acts as semi-permeable, with electricalresistivity values lower than 5 ohm·m. Gravel and sand form the alluvial unit, with some clay and silt; ithas a higher permeability than the marsh unit, and the electrical resistivity is between 5 and 30 ohm·m forthe clay rich portions and up to more than 50 ohm·m for the gravels. At the surface there is a clay layervery rich in salt, with electrical resistivity lower than 0.5 ohm·m. The water content and the quality of thiswater produce great variations in the values of the resistivity, which in general is very low. The maximumthickness of sediments in the marsh area may be 150 m (IGME, 1992).
Figure 1. Situation and limits of the Almonte-Marismas aquifer. The position of the new geophysical surveysundertaken by IGME since 2002 are also indicated.
436
Study of the salt water – fresh water interface in environments of low resistivity: Doñana aquifer (Spain)
The Marismas are then formed by continental sediments and by marine sediments, which during theprocess of sedimentation retained the sea water. Due to the recharge water coming from the unconfinedportion of the aquifer, and also to the water extraction from pumping wells for irrigation, the sea waterimbedded in the marine layers was displaced to the south, giving rise to the existence of two areas withdifferent quality of groundwater. In the unconfined aquifer and in part of the semi-confined one,groundwater is of good quality (with electrical conductivity lower than 1 mS/cm). In the south andsoutheast, where the thickness of the sediments is more important, groundwater becomes richer in NaCl(with more than 20 mS/cm). So, an interface with NE-SW direction is supposed to exist limiting these twoareas.
Historical Geophysical determinations of the interface
The aquifer has been studied from the sixties of the last century, and the problem of defining the situationon the salt water- fresh water interface has been always considered. From a geophysical point of view, theonly petrophysical parameter that is able to characterize the presence of salt water in a rock is electricalresistivity. Nevertheless, there are some geological situations where the contrast of resistivity due to thepresence of salt water in a permeable layer may be masked by the low resistivity of the limitingimpermeable ones. This is the case in Doñana, where the apparent resistivity measured in a VES may bethe same for a clay layer and for sands with salt water. The existence of a very conductive surface layer,with less than 1 ohm·m, puts still more difficulties to the use of the geoelectrical methods, because belowthis layer, everything has a resistive behaviour: sands with fresh water, sand with salt water or a clay layer.Otherwise, the contact resistance of the electrodes presents in this area a very great variation, going from0.5 ohm·m for the salty clay to more than 1 000 ohm·m for the dry sand dunes that at some places areover the marsh formation. This variation may affect to a large extent the interpretation of the field data ofVertical Electrical Soundings, mostly with the interpretation tools available a few decades ago.
Trying to avoid the difficulty for a correct interpretation of the VES in these conditions, different approacheshave been used through the years in order to define the situation of the interface at Doñana. At a firstinstance, the transversal resistance T was used instead of the apparent resistivity. With a few VES and theknowledge of the salinity in two wells, a first “interface” was traced in 1967 (Astier, 1967) as a lineseparating points where the transversal resistance was higher than 5000 ohm·m·m. As the exploration ofthe aquifer went on, new wells were made providing new data about water salinity, and modifications tothe interface position were needed. In 1969 more VES were measured, and the limit value of T wasmodified to 3000 ohm·m·m. The drawing of this interface line covers distances greater than 50 km, withtwo or three tying points along it. A new methodology was applied in 1970 (Astier, 1970): chemical wateranalysis from ten wells were correlated with the T values from the VES closest to each well, giving anequivalence of 1.5 g/L of NaCl for 3000 ohm·m·m. Assuming a thickness of 100 m for the aquifer and aporosity of 20%, this value was translated to all the VES made until this year, and a new interface line,modifying at some places the previous one, was drawn.
Between 1971 and 1976 more than 460 wells forming a grid of less than one kilometre of side were madein an area of about 30 x 15 km2, which allowed the improvement of the studies. Only ten wells werelogged with geophysics, getting information of the formation resistivity, gamma ray, spontaneous potential
437
18 SWIM. Cartagena 2004, Spain J.L. PLATA and F. M. RUBIO
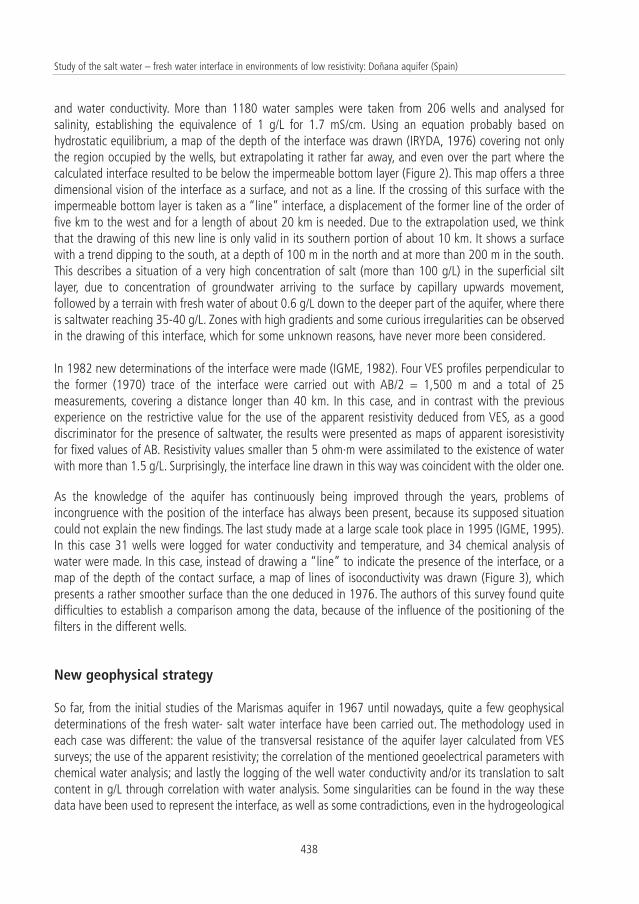
and water conductivity. More than 1180 water samples were taken from 206 wells and analysed forsalinity, establishing the equivalence of 1 g/L for 1.7 mS/cm. Using an equation probably based onhydrostatic equilibrium, a map of the depth of the interface was drawn (IRYDA, 1976) covering not onlythe region occupied by the wells, but extrapolating it rather far away, and even over the part where thecalculated interface resulted to be below the impermeable bottom layer (Figure 2). This map offers a threedimensional vision of the interface as a surface, and not as a line. If the crossing of this surface with theimpermeable bottom layer is taken as a “line” interface, a displacement of the former line of the order offive km to the west and for a length of about 20 km is needed. Due to the extrapolation used, we thinkthat the drawing of this new line is only valid in its southern portion of about 10 km. It shows a surfacewith a trend dipping to the south, at a depth of 100 m in the north and at more than 200 m in the south.This describes a situation of a very high concentration of salt (more than 100 g/L) in the superficial siltlayer, due to concentration of groundwater arriving to the surface by capillary upwards movement,followed by a terrain with fresh water of about 0.6 g/L down to the deeper part of the aquifer, where thereis saltwater reaching 35-40 g/L. Zones with high gradients and some curious irregularities can be observedin the drawing of this interface, which for some unknown reasons, have never more been considered.
In 1982 new determinations of the interface were made (IGME, 1982). Four VES profiles perpendicular tothe former (1970) trace of the interface were carried out with AB/2 = 1,500 m and a total of 25measurements, covering a distance longer than 40 km. In this case, and in contrast with the previousexperience on the restrictive value for the use of the apparent resistivity deduced from VES, as a gooddiscriminator for the presence of saltwater, the results were presented as maps of apparent isoresistivityfor fixed values of AB. Resistivity values smaller than 5 ohm·m were assimilated to the existence of waterwith more than 1.5 g/L. Surprisingly, the interface line drawn in this way was coincident with the older one.
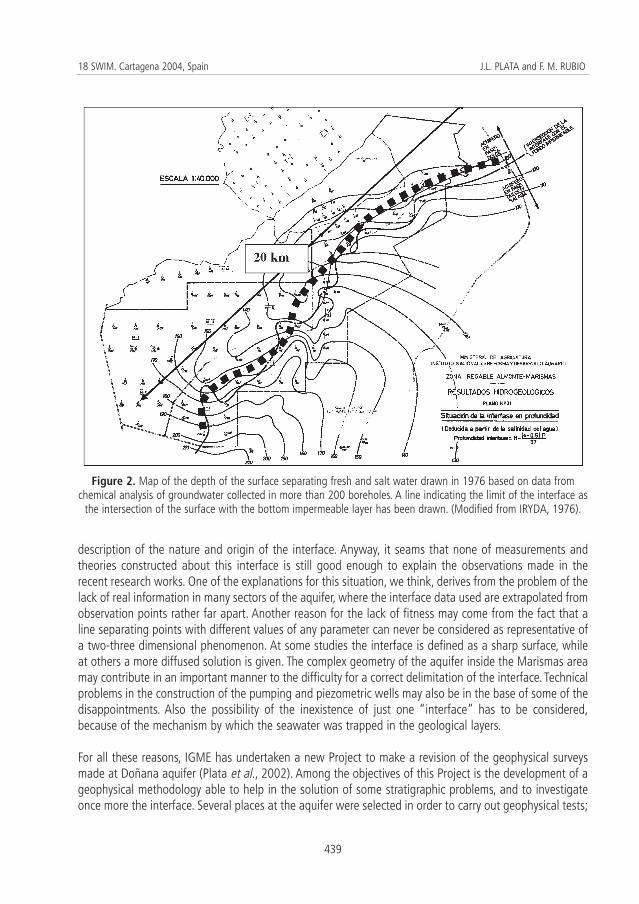
As the knowledge of the aquifer has continuously being improved through the years, problems ofincongruence with the position of the interface has always been present, because its supposed situationcould not explain the new findings. The last study made at a large scale took place in 1995 (IGME, 1995).In this case 31 wells were logged for water conductivity and temperature, and 34 chemical analysis ofwater were made. In this case, instead of drawing a “line” to indicate the presence of the interface, or amap of the depth of the contact surface, a map of lines of isoconductivity was drawn (Figure 3), whichpresents a rather smoother surface than the one deduced in 1976. The authors of this survey found quitedifficulties to establish a comparison among the data, because of the influence of the positioning of thefilters in the different wells.
New geophysical strategy
So far, from the initial studies of the Marismas aquifer in 1967 until nowadays, quite a few geophysicaldeterminations of the fresh water- salt water interface have been carried out. The methodology used ineach case was different: the value of the transversal resistance of the aquifer layer calculated from VESsurveys; the use of the apparent resistivity; the correlation of the mentioned geoelectrical parameters withchemical water analysis; and lastly the logging of the well water conductivity and/or its translation to saltcontent in g/L through correlation with water analysis. Some singularities can be found in the way thesedata have been used to represent the interface, as well as some contradictions, even in the hydrogeological
438
Study of the salt water – fresh water interface in environments of low resistivity: Doñana aquifer (Spain)
description of the nature and origin of the interface. Anyway, it seams that none of measurements andtheories constructed about this interface is still good enough to explain the observations made in therecent research works. One of the explanations for this situation, we think, derives from the problem of thelack of real information in many sectors of the aquifer, where the interface data used are extrapolated fromobservation points rather far apart. Another reason for the lack of fitness may come from the fact that aline separating points with different values of any parameter can never be considered as representative ofa two-three dimensional phenomenon. At some studies the interface is defined as a sharp surface, whileat others a more diffused solution is given. The complex geometry of the aquifer inside the Marismas areamay contribute in an important manner to the difficulty for a correct delimitation of the interface. Technicalproblems in the construction of the pumping and piezometric wells may also be in the base of some of thedisappointments. Also the possibility of the inexistence of just one “interface” has to be considered,because of the mechanism by which the seawater was trapped in the geological layers.
For all these reasons, IGME has undertaken a new Project to make a revision of the geophysical surveysmade at Doñana aquifer (Plata et al., 2002). Among the objectives of this Project is the development of ageophysical methodology able to help in the solution of some stratigraphic problems, and to investigateonce more the interface. Several places at the aquifer were selected in order to carry out geophysical tests;
439
18 SWIM. Cartagena 2004, Spain J.L. PLATA and F. M. RUBIO
Figure 2. Map of the depth of the surface separating fresh and salt water drawn in 1976 based on data fromchemical analysis of groundwater collected in more than 200 boreholes. A line indicating the limit of the interface as
the intersection of the surface with the bottom impermeable layer has been drawn. (Modified from IRYDA, 1976).
in the case of the salt-fresh water interface we are going to refer here just to the works done inside theMarismas area. A relatively small area was selected inside the zone covered by the last works conductedin 1995 (Figure 3), and a battery of methods employed (Plata and Rubio, 2003). Vertical ElectricalSoundings and Time Domain Electromagnetic, which have been used in other areas of the aquifer for otherpurposes, were disregarded because a more continuos sampling was needed in this case. To verify thepetrophysical behaviour of the different lithologies, geophysical logging has been chosen as the mostefficient tool (Plata and Rubio, 2004). With the natural gamma ray we expect to be able to differentiatebetween clay and gravel layers, and is also good for correlation among borehole information. To get a moreprecise knowledge of the composition of the silt and clay layers, spectral gamma data have beenmeasured, recording the K, Th and U channels with a calibrated probe. This provides more informationabout the mineralogy of clay and allows a good differentiation between clay rich sand layers and sand richclay layers.
Fluid temperature and conductivity are standard measurements in this kind of surveys. These logs aresupposed to provide information about the inputs and intakes of water, as well as of the salt content,whose evolution inside the casing is a result of the equilibrium established by the piezometric level andgroundwater flow. Nevertheless these measurements may be distorted because of the boreholeconstruction system and the positioning of the filters, which produce variations on the properties ofgroundwater not related to the hydrogeological situation. It is also necessary to bear in mind that thewater column inside the borehole may not be representing the situation of the formation water at the samedepth. The fluid conductivity does not provide information about the nature of the fluid inside the layers,which modifies its resistivity and the contrast of this parameter between adjacent layers. Conductivity hasbeen reduced to 25 ºC.
Formation resistivity has been logged by electromagnetic induction at several wells on both sides of theinterface, in boreholes with PVC casing. With this parameter we try to determine the formation resistivityof the different layers, as well as the influence of the water quality on it, as a fundamental tool for thedesign and interpretation of the electrical surface methods.
The surface base method has been the electrical imaging, making a profile of 3,300 m on theaforementioned area (Figure 3). The distance between stations has been established in 15 m, with anelectrode arrangement of 1,200 m. Several electrode configurations have been used:Wenner, dipole-dipoleand Schlumberger. Along the same profile a seismic reflection section was measured with the idea ofreducing the ambiguity in the interpretation of the geoelectrical data with the help of a correct geometrysupplied by the seismic section. Down-hole seismic velocity has also been measured at some selectedboreholes to improve the processing of data and the time-depth conversion.
Before interpreting the geoelectrical section it is necessary to calibrate the resistivity values found in thelogs. As an example, in the case of the well shown in Figure 4, made inside the Marismas formation, thereis a sequence of 190 m of clay with some gravel and sands intercalation. The fluid conductivity is of about15 mS/cm in the first 24 m, and more than 20 mS/cm from a depth of 50 m to the end. The gamma raylog shows a sand intercalation not previously detected between 10 and 25 m, clearly identified not onlyby the total counts of the gamma ray, but by the complete absence of U in the spectral gamma and thehigher resistivity in the induction log, which reaches 8 ohm·m. Therefore, a contrast of all these parameters
440
Study of the salt water – fresh water interface in environments of low resistivity: Doñana aquifer (Spain)
is present when a change in lithology not affected by the presence of groundwater takes place. Below thislayer, the clay layer shows a resistivity of about 1 ohm·m down to a gravel layer at a depth of about 65 m,detected by a raise in resistivity to 3 ohm·m and a low in gamma ray total counts; the U content helps alsoto identify the nature of this layer, with some clay intercalation. Below 110 m the gamma raymeasurements are clearly indicating the presence of additional sand layers than those indicated by thegeological column, but no variation in resistivity is appreciable, which remains between 1 and 2 ohm·m.Both the bottom sand layer, where the aquifer filter is set, and the clear intercalation of clay inside it, arenot detected by the formation resistivity log. Our interpretation in this regard is that the first gravel layerdoes not contain water or contains fresher groundwater than the one detected by the conductivity, but thedeeper permeable layers bears saltwater, which modifies the resistivity giving no contrast with theimpermeable clay layers. The fluid conductivity is indicating the salinity of the water column inside the well,which is not related to the formation water. In these situations, the use of geoelectrical methods from thesurface will be useless for lithological discrimination. Comparing this kind of analysis at several wells, wehave verified that the resistivity contrast of a sand layer with the surrounding clay layer may be as high as200 ohm·m when the sand is dry; if the conductivity of groundwater is in the order of 15 mS/cm, theresistivity may be as low as 20 ohm·m for the sand layer, reaching 5 ohm·m when groundwater has a
441
18 SWIM. Cartagena 2004, Spain J.L. PLATA and F. M. RUBIO
Figure 3. New map of the interface, drawn in 1995, expressed in lines of the same value of water conductivity afterlogging of 31 boreholes and 34 chemical analyses. The line for 1 mS/cm approximately coincides with the limit ofthe interface drawn in Figure 2. The area chosen to conduct new geophysical measurements in 2002 is marked.Wells at both sides of the interface have been logged (big black dots). The position of the seismic and electrical
image profile is also indicated. (Modified from IGME, 1995).
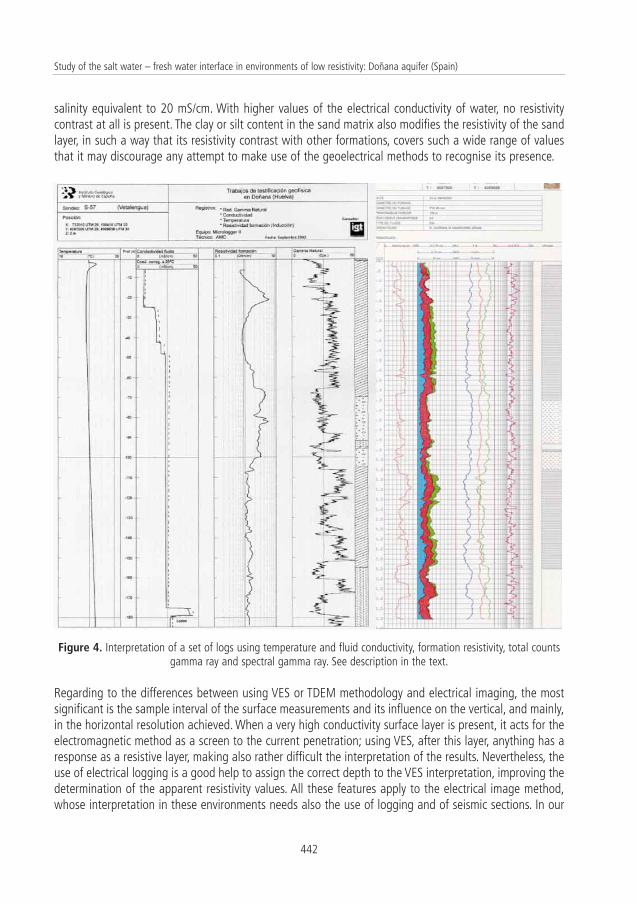
salinity equivalent to 20 mS/cm. With higher values of the electrical conductivity of water, no resistivitycontrast at all is present. The clay or silt content in the sand matrix also modifies the resistivity of the sandlayer, in such a way that its resistivity contrast with other formations, covers such a wide range of valuesthat it may discourage any attempt to make use of the geoelectrical methods to recognise its presence.
Figure 4. Interpretation of a set of logs using temperature and fluid conductivity, formation resistivity, total countsgamma ray and spectral gamma ray. See description in the text.
Regarding to the differences between using VES or TDEM methodology and electrical imaging, the mostsignificant is the sample interval of the surface measurements and its influence on the vertical, and mainly,in the horizontal resolution achieved. When a very high conductivity surface layer is present, it acts for theelectromagnetic method as a screen to the current penetration; using VES, after this layer, anything has aresponse as a resistive layer, making also rather difficult the interpretation of the results. Nevertheless, theuse of electrical logging is a good help to assign the correct depth to the VES interpretation, improving thedetermination of the apparent resistivity values. All these features apply to the electrical image method,whose interpretation in these environments needs also the use of logging and of seismic sections. In our
442
Study of the salt water – fresh water interface in environments of low resistivity: Doñana aquifer (Spain)
experience in the Doñana aquifer using all these electrical methods of geophysical exploration, there is onemore difficulty to add: the geometry of the bodies is rarely two dimensional and a great heterogeneity isnearly always present due to a rather fast change of the sedimentary facies and chemical nature of thewater content. Anyway, the use of electrical images is expected to allow a better definition of thesechanges.
Preliminary interpretation
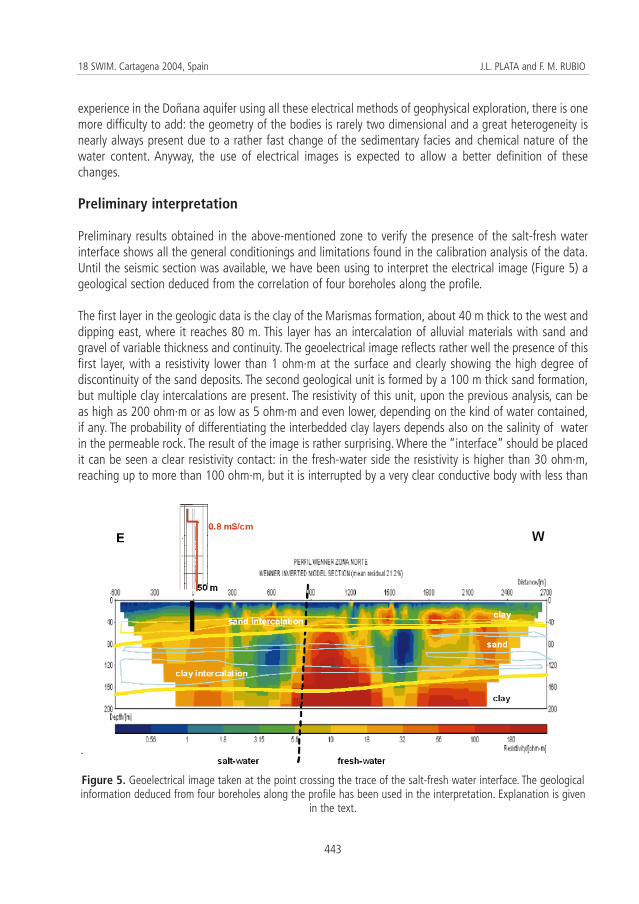
Preliminary results obtained in the above-mentioned zone to verify the presence of the salt-fresh waterinterface shows all the general conditionings and limitations found in the calibration analysis of the data.Until the seismic section was available, we have been using to interpret the electrical image (Figure 5) ageological section deduced from the correlation of four boreholes along the profile.
The first layer in the geologic data is the clay of the Marismas formation, about 40 m thick to the west anddipping east, where it reaches 80 m. This layer has an intercalation of alluvial materials with sand andgravel of variable thickness and continuity. The geoelectrical image reflects rather well the presence of thisfirst layer, with a resistivity lower than 1 ohm·m at the surface and clearly showing the high degree ofdiscontinuity of the sand deposits. The second geological unit is formed by a 100 m thick sand formation,but multiple clay intercalations are present. The resistivity of this unit, upon the previous analysis, can beas high as 200 ohm·m or as low as 5 ohm·m and even lower, depending on the kind of water contained,if any. The probability of differentiating the interbedded clay layers depends also on the salinity of waterin the permeable rock. The result of the image is rather surprising. Where the “interface” should be placedit can be seen a clear resistivity contact: in the fresh-water side the resistivity is higher than 30 ohm·m,reaching up to more than 100 ohm·m, but it is interrupted by a very clear conductive body with less than
443
18 SWIM. Cartagena 2004, Spain J.L. PLATA and F. M. RUBIO
Figure 5. Geoelectrical image taken at the point crossing the trace of the salt-fresh water interface. The geologicalinformation deduced from four boreholes along the profile has been used in the interpretation. Explanation is given
in the text.
0.5 ohm·m, whose meaning is unknown. No correlation with the clay intercalation is appreciated. At thesalt-water side, the resistivity is below 30 ohm·m, and a very conductive body with less than 5 ohm·m isalso present; some correlation of this body with the clay intercalations could be interpreted. Thisgeoelectrical situation is also visible in the dipole-dipole and Schlumberger sections, with the inherentdifferences that are due to the electrode configuration.
The third layer is the blue marl, which is the impermeable substratum of the aquifer, and appears at a depthof 140 m, reaching 170 m to the east. It is rather evident that the current has not reached this penetration,and that the information derived from the electrical image may be probably valid only down to 100 m.
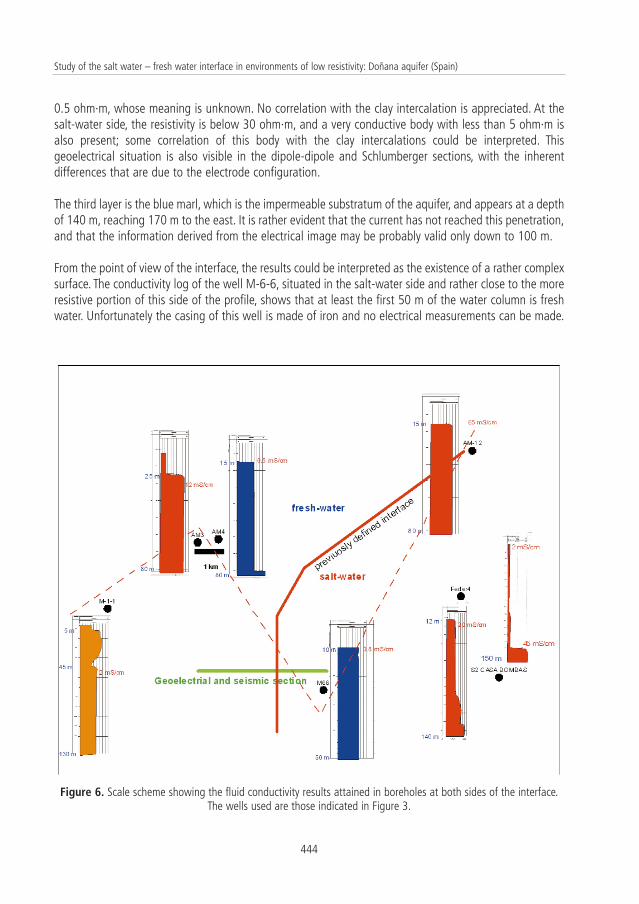
From the point of view of the interface, the results could be interpreted as the existence of a rather complexsurface. The conductivity log of the well M-6-6, situated in the salt-water side and rather close to the moreresistive portion of this side of the profile, shows that at least the first 50 m of the water column is freshwater. Unfortunately the casing of this well is made of iron and no electrical measurements can be made.
444
Study of the salt water – fresh water interface in environments of low resistivity: Doñana aquifer (Spain)
Figure 6. Scale scheme showing the fluid conductivity results attained in boreholes at both sides of the interface.The wells used are those indicated in Figure 3.
Looking now at the conductivity logs of the wells surrounding the electrical profile (Figure 6) otheranomalies are found. Toward the salty side, wells AM-12, S-2 and Feder-4 are filled with salt water (morethan 20 mS/cm), though it is interesting to see the huge gradient identified between Feder-4 and S-2 wells.The already mentioned M-6-6 borehole does not present high salinity in the first 50 m. To the fresh-waterside, the well M-1-1 is in the limit of 2 mS/cm from the surface, and wells AM-3 and AM-4, just a fewhundreds of meters apart, show a very different situation: in the first 80 m water is saline in one of themand fresh in the other one. If the same criterion that has been used in the older studies for drawing theinterface is used with these new data, an important and strange modification of the interface “line” shouldbe made.
Conclusions
In the former studies of the Doñana aquifer the methodology for the determination of the interface wasbased on the resistivity measured in Vertical Electrical Soundings (VES), taking as discrimination parameterjust the apparent resistivity or the transversal resistance. Correlation of the VES apparent resistivity withthe water chemical analysis and water conductivity from logging was the next step in the system used todraw a line separating points where the value of one of these parameters was different. The results of noneof these surveys are enough to explain the new discoveries about the distribution of salt water in thisaquifer. The only way to draw a two- or three-dimensional surface is the use of two or three dimensionalsampling, which is only possible if a tied grid of wells is at our disposal or if a geophysical method is usedwith such a sampling rate, as Electrical Image. For the right interpretation of the field measurements, theresistivity values need to be calibrated with the aid of geophysical logging, lithological information andchemical analysis of water. At the Doñana aquifer the use of geoelectrical methods is specially difficult,because the distortion produced by salt water in the resistive layers and the presence of a very conductivelayer at surface does not always allow the distinction between the different geoelectrical situations. Thepenetration of the current is also limited using the short interval between electrodes imposed by theinstrumentation available for electrical imaging. With all these limitations, and as a result of a firstinterpretation of some of the new data taken, our feeling is that the interface at Doñana is rather morecomplicated than previously believed.
References
ASTIER (1967). Etude hidrogeologique du bassin du Guadalquivir. Rapport sur les résultats de la prospectiongéophysique. Centro de documentación del IGME S/R. (Unpublished).
ASTIER (1970). Interprétation d´ensemble de sondages électriques des zones d´Almonte et des Marismas. Centro dedocumentación del IGME. S/R. (Unpublished).
IGME (1982). Estudio hidrogeológico del acuífero Almonte-Marismas. Estudio geofísico de la interfase agua dulce -agua salada. Geological Institute of Spain, IGME, Ref. 35.655. (Unpublished).
IGME (1992). Hidrogeología del Parque Nacional de Doñana y su entorno. Colección Informe. Geological Institute ofSpain, IGME, Madrid.
IGME (1995). Estudio sobre la evolución de la calidad fisico-química de las aguas subterráneas en el sector orientalde la unidad hidrogeológica de Almonte-Marismas. Geological Institute of Spain, IGME. Ref. 35.963. (Unpublished).
IRYDA (1976). Informe final de los sondeos de la zona regable de Almonte-Marismas y síntesis hidrogeológica. SpanishInstitute of Rural Development. (Unpublished).
445
18 SWIM. Cartagena 2004, Spain J.L. PLATA and F. M. RUBIO
PLATA, J.L.; RUBIO, F.M.; MANZANO, M.; MEDIAVILLA, C. and ARIAS, M. (2002). Proyecto para la revisión de lainformación geofísica existente sobre el acuífero Almonte- Marismas (Doñana). Proceedings III Asamblea HispanoPortuguesa de Geodesia y Geofísica. Valencia. España: 1916-1919.
PLATA, J.L. and RUBIO, F.M. (2003). Avance de los trabajos geofísicos últimamente realizados en el acuífero Almonte-Marismas (Doñana). Geological Institute of Spain, IGME; Serie Hidrogeología y Aguas Subterráneas nº 8; TIAC03,I: 169-176.
PLATA, J.L. and RUBIO, F.M. (2004). Nuevas testificaciones geofísicas en el acuífero Almonte-Marismas. ProceedingsIV Asamblea Hispano Portuguesa de Geodesia y Geofísica. Figueira da Foz. Portugal: 367-368.
SALVANY, J.M. and CUSTODIO, E. (1995). Características litoestratigráficas de los depósitos plio-cuaternarios del bajoGuadalquivir en el área de Doñana: implicaciones hidrogeológicas. Rev. Soc. Geo. España, (1-2): 21-31.
446
Study of the salt water – fresh water interface in environments of low resistivity: Doñana aquifer (Spain)
Topic 5.
Hydrochemical and isotopic aspects ofsaline water intrusion