Embed Size (px)
Citation preview

CLB023 Software Cost Estimating
lesson 2- Step 2: Collect and Analyze Data TOC I RESOURCES I PRINT I HELP
Introduction and Obj ectives
Welcome to the Collec t and Analyze Data lesson. After comple ting this lesson, you will understand this second o f the five major steps o f developing a software cost estimate.
l esson Obj ect iv es
After comple ting this lesson you will be able to:
• Compare various sources o f so ftware data.
• Recommend appropriate data normalization steps to support software cost estimates.
• Cri t ique produc tivi ty as a commonly- ci ted software metric .
• Relate the primary software cost drivers to each o ther and to development cost .
Develop Collect and Develop Consider Document \ Scope and Analyze Estimate Risk and and Present '. Approach Data Methodology Uncertainty Estimate
Q
..._ I Page 1 of 53 ~ Back Next

Long Description
Graphic illustrates the steps of the Cost Estimating process. The steps from left to right are: Develop Scope and Approach, Collect and Analyze Data (highlighted), Develop Estimate Methodology, Consider Risk and Uncertainty, and Document and Present Estimate.

CLB023 Software Cost Estimating
lesson 2- Step 2: Collect and Analyze Data TOC I RESOURCES I PRINT I HELP
Software Data
T he basic estimating me thodologies ( analogy . parametric , engineering . and extrapolation from ac tuals) are all data-driven . Credible and t imely data inpu ts are required when using any o f these me thodologies. I f data required for a speci fic approach are no t available, then that estimating me thodology canno t be used. Because o f this, the estimator must iden ti fy the best sources for the me thod to be used.
T he table below shows eigh t basic sources o f data and whe ther they are considered a primary or secondary source o f information . When preparing a cost estimate, estimators should consider all c redible data sources; however, whenever feasible, primary sources o f data should be given the most consideration .
Source I Source Type IBasic Accounting Records Primary
I. Cost Reports I Primary or Secondary Historical Databases
I Primary or Secondary
l Functional Specialist I Primary or Secondary Technical Databases Primary or Secondary
LOther Information Systems I Primary or Secondary Contracts Secondary
I Cost Proposals I Secondary Q
~ I Page2 of 53 I ..... Back Next

Popup Text
Analogy
An estimate of costs based on historical data of a similar (analogous) item.
Parametric
A cost estimating methodology using statistical relationships between historical costs and other program variables such as system physical or performance characteristics, contractor output measures, or manpower loading.
Engineering
Derived by summing detailed cost estimates of the individual work packages and adding appropriate burdens. Usually determined by a contractor’s industrial engineers, price analysts, and cost accountants.

Popup Text
Extrapolation from actuals: Extrapolation method requires prototype or preproduction actual cost data on the system considered. Primarily used in estimating the production cost of system hardware, and assumes a relationship (technical, performance) between cost of prototypes and production units.
Primary sources
Primary data are obtained from the original source, and are considered the best in quality and the most reliable.
Secondary sources
Secondary data are derived (possibly “sanitized”) from primary data, and are not obtained directly from the source. Because of this, they may be of lower quality and usefulness.

Long Description
Table with two columns and nine rows. The data are as follows:
Source Source Type
Basic Accounting Records Primary
Cost Reports Primary or Secondary
Historical Databases Primary or Secondary
Functional Specialist Primary or Secondary
Technical Databases Primary or Secondary
Other Information Systems Primary or Secondary
Contracts Secondary
Cost Proposals Secondary

CLB023 So ftwar e Cost Estimating
Lesson 2 - Step 2 : Collect and Analyze Data TOC I RESOURCES I PR INT I HELP
Softwar e Data, Cont.
Like risk, sofl\vare may have broader range of potential data, since most systems contain software.
While there are certain platform considerations that drive differences in software complexity and hence development produc tivity, software data should not be considered commodity -specific a priori. Cost Data
In general, the pre ference is to combine data and adjust for differences appropriately rather than Technical Data,discard data altoge ther and end up with a data set that is unnecessarily narrow. Cost Drivers, Size
While focus is on cost data, do not forget t o collect technical data, which will help identify cost drivers Programmatic Data, and support size estimates, and programmatic data, Schedulewhich will support schedule estimates.
Where possible, collect both initial estimates and final values, in order to capture historical growth.
l{)) Questions Managers ShoYid Ask Qf
..... I Poge 3 of SJ .....
Back Next

Popup Text
Questions Managers Should Ask
• Does the estimating organization have a method for organizing and retaining information on completed projects (a historical database)?
• Does the database contains a useful set of completed projects? • Has unpaid overtime, if used, been quantified, so that recorded data provide a valid basis for
estimating future effort? • Are schedule milestones (start and finish dates) described in terms of criteria for initiation or
completion, so that work accomplished between milestones is clearly bounded? • Have any cost models that were used for estimating been used also to provide consistent
frameworks for recording historical data (which helps ensure that comparable terms and parameters are used across all projects, and that recorded data are suitable for use in the estimating models)?
• Does the organization have a structured process for capturing effort and cost data from ongoing projects?
• Does the development organization hold postmortems at the completion of projects to ensure that recorded data are valid, and to ensure that events that affected costs or schedules get recorded and described while they are still fresh in people’s minds?
• Does information on completed projects include the life-cycle model used, together with the portion covered by the recorded cost and schedule, and a workflow schematic that illustrates the software process used?
• Does information on completed projects include actual (measured) size, cost, and schedule, and the actual staffing profile?
• Does information on completed projects include an estimate at completion, together with the values for cost model parameters that map the estimate to the actual cost and schedule?

Long Description
Inverted pyramid graphic with the text in the following descending order:
Top tier: Cost Data, Technical Data Second tier: Programmatic Data, Cost Drivers, Size Bottom tier: Schedule Estimate

- ---------------
----------
CLB023 Software Cost Estimating Lesson 2 - Step 2: Collect and Analyze Data TOC I RESOURCES I PRINT I HELP
Software Data - Development Data
Software Resource Dat a Reports (SRDRs) are used t o collect and report softw are element data on major Department of Defense (DoD) sof twarein tensive systems, and they represen t DoD's only standard centralized approach to so ftware data collec tion.
Data is required from MAIS programs and MDAPs containing software e ffort with a projected value greater than S25M (FY 2002 dollars) .
The data collected includes the type and size of the sof tware applica tion, t he schedule and labor resources (effort) needed for i ts development, the quali ty of the delivered sof tware, and o ther descriptive development data, capturing both the es timated and ac tual charac teristics o f new so ftware developments or upgrades.
Both the Government program office and, later on after contract award, the development contractor submit this report. For contractors, this report constitutes a contract data deliverable (CDRL) that formalizes the reporting of sof tware metric and resource data.
Selec t image to view enlarged version.
......,.ma - -·=-=- -I - ·-· - . -·--~ ___.._ . \
_,..._____~_....._...._ _..._ _ ---------...___ ·---- ... -=
-----------·-----· ...-----·--...--. -·-----u
<01111111111 1 Page 4of S3 ~ Bac.k • Next

- --- - ---
CLB023 Software Cost Estimating
lesson 2- Step 2: Collect and Analyze Data TOC I RESOURCES I PRINT I HELP
Software Data - Development Data, Cont.
No te that the SRDR forms were previously designated DD 2630, bu t since they are now tailorable, no DD designation is given.
During each o f the phases o f so ftware developmen t, numerous ac tivi t ies will be per formed in disciplines such as software developmen t, so ftware program managemen t (PM), so ftware configuration managemen t CCM), and software quali ty assurance COA ) . It is impor tan t to try to capture the associated e ffor t as comprehensively and with as much granulari ty as possible.
The DoD 5000.4-M- 1. Cost and So ftware Data Repor ting CCSDR) Manual. OSD CAPE. November 4. 2011 provides guidance. Selec t each graphic below to view examples o f the Ini t ial Governmen t Repor t, Ini t ial Developer Repor t, and Final Developer Repor t .
---- --·- ·-- ,_,_,_ .-. -· - -- _:~~
.=- -" -= ---- ~~ln:it-ja1-..==,.::~--- Initial :::.... -- • ina I ¥ 1:> · 1~~Qyernment Development ,~ eve oper
____ _Report ;;_.::Report --=~- -:::-__ .__ -- =·--- -
·- -- :§: - -- --·· - -- ----·--·---- -----=---- :::::=·: - -------·
-~ Page 5 of 53 ~
Back li ) Next

Popup Text
Program Management (PM)
The process whereby a single leader exercises centralized authority and responsibility for planning, organizing, staffing, controlling, and leading the combined efforts of participating/assigned civilian and military personnel and organizations, for the management of a specific defense acquisition program or programs, throughout the system life cycle.
Configuration Management (CM)
The technical and administrative direction and surveillance actions taken to identify and document the functional and physical characteristics of a Configuration Item (CI), to control changes to a CI and its characteristics, and to record and report change processing and implementation status. It provides a complete audit trail of decisions and design modifications.
Quality Assurance (QA)
A planned and systematic pattern of all actions necessary to provide confidence that adequate technical requirements are established, that products and services conform to established technical requirements, and that satisfactory performance is achieved.
CLB023 Software Cost Estimating
lesson 2- Step 2: Collect and Analyze Data TOC I RESOURCES I PRINT I HELP
Software Data - Cost Data
SRDR data are en tered in to the De fense Au tomated Cost Information System (DACIMS) that provides the cost community with instan t access to historical cost data needed to develop independen t, substan tiated estimates. DACIMS is a secure website that allows cost analysts to browse through thousands o f Con trac tor Cost Data Repor ts (CCDRs) and SRDRs and associated documen ts via the In terne t .
It is the largest repository o f DoD cost information. Registration for access to the DACIMS can be ob tained through the Defense Cost and Resource Center CDCARCl .
SRDRs con tain e ffor t data ( labor hours) and the corresponding CCDRs have cost data (dollars), which provides a po ten tial cross-check for so ftware developmen t labor rates (dollars per hour) .
Mr. Mike Popp, a cost analyst for the Naval Air Systems Command (NAVAIR) rou tinely posts summary SRDR data in convenien t Excel form to one o f the DCARC eRooms .
...rl I ~Page 6 of 53
Back Iii ) Next

CLB023 So ftwar e Cost Estimating
Lesson 2 - Step 2: Collect and Analyze Data TOC I RESOURCES I PR INT I HELP
Software Data - Sizing Data
Estimating product size lays the foundation for software cost and schedule estimation .
Size is considered by software projec t managers to be a major technical performance or productivity indicator, allowing them to track a project during development.
Estimating product size is no t simple to do. I t is o ften dependen t on the experience o f the persons doing the estimating.
To transcend an expert-based approach, i t is crucial to have sizing da ta in the historical database, for the purpose of generating both sizing estimates and size-driven cost estimating relationships (CERs) .
..... I Poge 7 of SJ .....
Back flij Next

CLB023 So ftwar e Cost Estimating
Lesson 2 - Step 2 : Collect and Analyze Data TOC I RESOURCES I PR INT I HELP
Software Data - Sizing Data, Cont.
The traditional software data sizing measurement is Source Lines Of Code (SLOC). One of the advantages of SLOC is that it can be counted empirically in an automated fashion after the code is released.
Counting conventions vary widely, bu t there is a movement in the community toward a common standard o f the " USC code counter ."
SLOC counts can represen t either physical SLOC, a simple tally of all non- blank, non- comment lines, or logical SLOC, which tries to arrive at a consisten t semantic unit by taking in to account language syntax and varying programming styles .
..... I Poge 8ofSJ .....
Back [jlj Next

CLB023 Software Cost Estimating
lesson 2- Step 2: Collect and Analyze Data TOC I RESOURCES I PRINT I HELP
Softw are Data - Operati ng and Support (O&S) Data
As previously no ted in the CES discussion, O&S cost elements 6.2 Sustaining Support and 6.3 Software Maintenance Support are o f particular interest in so ftware.
Collec ting data to support Post-Deployment Software Support CPDSS) estimates is a particular challenge, and a j oint e ffort is underway by the three service cost centers to collec t so ftware maintenance data from bo th organic support ac tivi t ies and contrac tors.
In the area o f contrac tor logistics support (CLS), a DO Form 1921- 4 is being considered to capture some data on software support.
- """""'""' -·CO$lOATA~IMR'fR(I"QftT
______...,__,________..__.._.o.r-.OooMM...._...__, =-·-..__,_"'_~··--.............§ ·-·--·-·-·-··--...---------"----·---...-. .._______.... ____
-- oMt,.-Wll•~lft~HiihOoo olol( ..,.,..;qor....:ooo;.o...--·-·--..-·....-·-·--·-·-··-·--·---- •. ....._......._,.,S_(J-(;too~''"7c"'-! )._--0"---11·-··-~· - -· - ..........,.., .. .._ ·~- ~
tMII.IO"o..-"'0004
. ~ '""'""~""" ·......._..,. ..._,Jo:<o_•
eo~·-{a~~~ ~~~u '"·-·"'-·--~"""'""-- ~-~ ,_,. __n
U .Q7...<UILWI u.u~,.;;_,_.,u~J ll. ....tt •.-o~ ·.- ....·----00tllo~OTOOO."l ¢011'S~>JOOWU1'1Ctf
..lllf10111.... 1U"""~ - -·.... -·.....IOOO!r. ....... ~ ""'"·-·- • ' . " '
-...... ~ Pa ge g of 53 ~
Back liiii ) Next

Popup Text
Post-Deployment Software Support (PDSS)
Those software support activities that occur after the deployment of the system.
CLB023 Software Cost Estimating
Lesson 2 - Step 2: Collect and Analyze Data TOC I RESOURCES I PRI NT I HELP
Software Data - Operating and Support (O&S) Data, Cont.
Office of the Secretary o f Defense (OSD) under took the Visibili ty and Management o f Operating and Support Cos ts (VAMOSC) initiative to facili tate the development o f a well · de fined, standard presen ta tion o f O&S costs by major de fense acquisition programs.
VAMOSC data can serve as a basis for decisions concerning affordability, budget development, support concepts, cost tradeoffs, modifications, and retention of current sy stems.
1·Unfortunately, in the area o f so ftware suppor t, 05MI5 _,.·. · ~ - .- 1~ ·VAMOSC data alone are generally insufficien t to ---------------·---support es timating much beyond a simple average.
The Services have implemented VAMOSC through the following programs:
• Army - Operating and Support Management Information Sy stem {OSMIS)
• Navy- Navy VAMOSC
• Air Force - Air Force Total Ownership Cost (AFTOC)
......._ I Page 10 of 53 _.....
Back Next

CLB023 So ftwar e Cost Estimating
Lesson 2 - Step 2 : Collect and Analyze Data TOC I RESOURCES I PR INT I HELP
Softwar e Data - R8tes Data
Because sofl\vare development is a labor- intensive activity, the traditional estimating approach is to estimate effort first in labor hours or person-months and then "dollarize• that effort by applying the appropriate labor rate.
Rates should be representative o f the capabili ty used to produce the effor t estimate, and premiums should be included for specialized skills such as experience with programming languages or development platforms or quali fications such as security clearances.
These analyses should be based on historical data for labor rates and associated inflation trends.
Such data may be available via gov ernment surveillance organizations such as the Defense Contract Audit Agencv (DCAAl and Defense Contract Management Agencv (DCMA).
..... I Pope 11 of SJ .....
Back Next

CLB023 So ftwar e Cost Estimating
Lesson 2 - Step 2: Collect and Analyze Data TOC I RESOURCES I PR INT I HELP
Software Data - Collecting Rates Data
In collecting rates data, it is preferable to have actual rates across a wide range of labor categories, each with clearly-defined qualifications, and several years.
Contrac tor-specific rates may also be available in General Sery jces Administration (GSA) schedules and proposals, bu t make sure to be clear on whether the rates are binding or merely a current best es timate.
Where necessary, a single composite rate, representing the weighted average labor ra te of the development team, may suffice .
..... I Pope 12 of SJ .....
Back Next

CLB023 So ftwar e Cost Estimating
Lesson 2 - Step 2 : Collect and Analyze Data TOC I RESOURCES I PR INT I HELP
Data Normalization
The mantra for data normalization is " What's in the number?" While much faith is put into actual data from historical programs, i t is important to understand the context in which those data w ere collected so that w e can properly adjust them to be comparable with data from other sources - the proverbial "apples to apples."
{{)) Questions Managers ShouldAsk f'
..... I Pope 13 of SJ .....
Back Next

Popup Text
Questions Managers Should Ask
Is the organization’s historical evidence capable of supporting a reliable estimate?
• Are elements included in (and excluded from) the effort, cost, schedule, size, and reuse measures in the database clearly identified?
• Have the data in the historical database been examined to identify inconsistencies, and have anomalies been corrected or explained?
• Does information on completed projects include a work breakdown structure or alternative description of the tasks included in the recorded cost?
• Does information on completed projects include non-labor and management costs? • Does information on completed projects include a summary or list of significant deliverables
(software and documentation) produced by the project, and a summary of any unusual issues that affected cost or schedule?

CLB023 Software Cost Estimating
lesson 2- Step 2: Collect and Analyze Data TOC I RESOURCES I PRINT I HELP
Data Normalization, Cont
For so ftware estimating, the three most impor tan t types o f normalizations are con ten t, sizing, and operating environmen t . Selec t each tab below to learn more.
Content
Effor t data should be adjusted to re flec t a consisten t se t o f ac tivi t ies. Ideally, i t should include all labor ac tivi t ies charged direc tly to the so ftware developmen t task, such as:
a. Engineering labor charges for System/ So ftware Requiremen ts Analysis, Design, Code, Test, and In tegration
b. Documentation e ffor t
c . Configuration Managemen t (CM)
d. So ftware Quali ty Assurance (QA)
e. Managemen t e ffor t charged direc tly to the task
Normalization is tan tamount to the estimating step and must there fore be bo th traceable and de fensible.
There will always be a cer tain amount o f irreducible random " noise" in the data, bu t normalization strives to adjust for systematic e ffec ts such as the changing purchasing power o f the dollar through time ( inflation) that i f ignored would in troduce " bias." By doing so, we can better detect the " signal" in the data, namely the response o f cost to driving variables .
.....rfl I Page 14 of 53 _......
Back Next

Popup Text
Content
Effort data should be adjusted to reflect a consistent set of activities. Ideally, it should include all labor activities charged directly to the software development task, such as:
a. Engineering labor charges for System/Software Requirements Analysis, Design, Code, Test, and Integration
b. Documentation effort c. Configuration Management (CM) d. Software Quality Assurance (QA) e. Management effort charged directly to the task
Sizing
Delivered SLOC should be adjusted to reflect degree of reuse to give an Equivalent (New) SLOC number, which should have a more consistent relationship with effort.
Operating Environment
Data are often segregated by platform and/or application to reflect the way that reliability, safety, and other considerations affect the complexity and difficulty of the code.

CLB023 Software Cost Estimating
lesson 2- Step 2: Collect and Analyze Data TOC I RESOURCES I PRINT I HELP
Data Normalization - Content
Arguably the most impor tan t normalization step is to adjust e ffor t or cost numbers to re flec t a consisten t work scope or " con ten t ." One required application o f this principle is the segregation o f recurring and nonrecurring costs. Selec t each tab below to learn more abou t each.
Non-recurring costs include all the e ffor ts required to develop and quali fy a given i tem, such as requiremen ts de fini t ion/ allocation, design, analysis, developmen t, and quali fication/ veri fication.
Vir tually all so ftware developmen t and testing costs prior to ini t iation o f rou tine system operation are non-recurring.
..... Back Next

Popup Text
Non-recurring Costs
Non-recurring costs include all the efforts required to develop and qualify a given item, such as requirements definition/allocation, design, analysis, development, and qualification/verification.
Virtually all software development and testing costs prior to initiation of routine system operation are nonrecurring.

Popup Text
Recurring Costs
Recurring costs cover all efforts required to produce end-item hardware, including manufacturing and test, engineering support for production, and spare units or parts. Production support software costs are commonly classified as recurring.
A more germane normalization for software is the segregation of fixed and variable costs.
For example, infrastructure costs such as SILs are largely fixed – you need the lab whether you write one line of code or a million – whereas design/code/test activities do vary with the amount of code being developed.
Examples of adjustment for consistent scope include:
• If the effort data for some historical programs include software requirements but others start at design, then either the requirements effort must be removed from the former or a way must be found to “plus up” the latter to represent the same scope.
• Suppose the systems engineering department compared five similar programs, and found that two included design-to-cost (DTC) Design-to-Cost (DTC) requirements. To normalize the data, the DTC hours must be deleted from those two programs to create a data set with consistent program scope.

Popup Text
Design-to-cost (DTC)
Management concept that historically emphasized cost-effective design (minimizing cost while achieving performance) and targeting an Average Unit Procurement Cost (AUPC). DTC concentrated on the contractors’ activities associated with tracking/controlling costs and performing cost-performance analyses/tradeoffs. Cost As an Independent Variable (CAIV) has refocused DTC to consider cost objectives for the total life cycle of the program and to view CAIV with the understanding it may be necessary to trade off performance to stay within cost objectives and constraints. DTC is now those actions that are undertaken to meet cost objectives through explicit design activities. Contractual implementation of DTC should go beyond simply incentivizing the contractor to meet cost commitments—it should also incentivize the contractor to seek out additional cost reduction opportunities.

CLB023 So ftwar e Cost Estimating
Lesson 2 - Step 2 : Collect and Analyze Data TOC I RESOURCES I PR INT I HELP
Data Normalization - Histor ical Cost Data
Historical cost data can also be adjusted for anomalies when it is not reasonable to expect the new project estimates to contain these unusual costs.
For example, development test program data are collec ted from five similar programs, and i t is found that one program experienced a major test failure. A considerable amount o f resources were required to find and solve the problem.
I f an adjustment is made to this data point, then the analys t must thoroughly document the ac tions taken to identify the anomalous hours.
I f t he hours are removed from the base estimate, then a corresponding risk should be added to the program's risk register with a consequence equal t o the additional hours and an appropriate probability (apparently 20%).
-
..... I Pooeteof SJ .....
Back Next

CLB023 So ftwar e Cost Estimating
Lesson 2 - Step 2 : Collect and Analyze Data TOC I RESOURCES I PR INT I HELP
Data Normalization - Cost
Other than simply keeping dollars ($), thousands (SK), millions (SM), and billions (SB) straight, the most common and impor tant normalization of cost units is adjustment for inflation, called escalation.
Infla tion is the general increase in price levels (or conversely decline in purchasing power) over time.
Inflation indices (or index numbers) are used to pLit costs in a consistent "base-year dollar" for the purposes o f estimating.
Inflation is certainly relevant to any software cost data, though for the development, the preference is to estimate effort ( labor hours or person- months) first and then apply labor rates, in which case only the rat es need to be escalated.
..... I Pope 17 of SJ .....
Back Next

CLB023 So ftwar e Cost Estimating
Lesson 2 - Step 2 : Collect and Analyze Data TOC I RESOURCES I PR INT I HELP
Data Normalization - Sizing Units
The more relevant normalization for software is adjustment for sizing units.
This is less straightforward than for hardware, where one can simply multiply by 2 .54 to convert from inches to centimeters, for example.
The mos t common sizing unit for software is source lines o f code {SLOe), and the most common normalization for SLOC is the conversion to Equivalent SLOC {ESLOC), bo th o f which are addressed later in this lesson.
ESLOC attempts to capture the varying effort associated with developing new code as compared with reusing code, with or without modification.
The effort required to develop code also varies by programming language, so that either data sets are segregated by language, or a factor is applied to convert size in one language to another.
..... I Pope 18 of SJ .....
Back Next

CLB023 Software Cost Estimating
lesson 2- Step 2: Collect and Analyze Data TOC I RESOURCES I PRINT I HELP
Data Normalization - Operating Environment
Software data are o ften categorized by Application ( the func t ion o f the so ftware, such as fligh t con trol or mission planning ) and Platform ( where the so ftware resides, such as Airborne or Ground) . T he idea is that these are key fac tors influencing the di f ficul ty and complexi ty o f the code, and there fore the amount o f e ffor t required to develop i t .
After the categorization is determined, the analyst may segregate the data and analyze each grouping separately . Al ternately, the data may be combined and indicator variables used in the subsequen t regression analysis to account for any signi fican t di fferences between groupings.
Operating Environmen t is also addressed in the cost drivers ( complexi ty ) sec t ion o f this lesson .
Software Data- Operating Environment
Application
Platform
Data
Q
.....rfl I Page 19 of 53 _......
Back Next

Popup Text
Long Description
Flowchart illustrating Software data categorization with Application as on one branch and Platform on the other branch. Each category (Application, Platform) has Data as supporting subordinate components.

CLB023 Software Cost Estimating
lesson 2- Step 2: Collect and Analyze Data TOC I RESOURCES I PRINT I HELP
Data Analysis
After data collec t ion and normalization, data analysis is conduc ted to develop estimating relationships .
Bo th so ftware development cost (e ffort) and schedule ( duration ) can be related to size and o ther driv ing fac tors, for example . Data analysis is essentially the application o f graphical, numerical, and algebraic princ iples from probabili ty and statistics.
A simple bar chart could be used to show ini t ial estimates and final values as a c lear indication o f code growth .
A histogram could show the distribution o f CSC!s by size in a so ftware database. A two-sample t-test could be conduc ted to explore differences be tween two populations ( Aircraft vs. Space, or C++ vs. C#) .
A scatterplo t o f e ffort in hours vs. size in ESLOC could be used to discern a cost estimating relationship, or CER.
... •• o:J .. 0
o:J .. ., .. .. o.s
... .. .. ., .. • OJ
.., ••..
02
... .. .. "\:, .,
• .. .. .. ..
Page 20 of 53~ I ..... Back Next

CLB023 So ftwar e Cost Estimating
Lesson 2 - Step 2: Collect and Analyze Data TOC I RESOURCES I PR INT I HELP
Data Analysis - Productivity
One commonly reported software metric is productivjtv. which attempts to capture the efficiency of designers and programmers in developing code.
It is simply the ratio of code size (usually in SLOC) to effort ( in labor hours, days, or months). While this quotient is often called a factor, i t is really more of a rate. Its inverse (e ffort per size ), which is often used, makes this clearer.
. - = Gil E3 • 0 ,(;;;;;;;; ::)• '""'~ . . . '
..... I Poge21ofSJ .....
Back Next

Popup Text
Productivity
The actual rate of output or production per unit of time worked.
CLB023 Software Cost Estimating
lesson 2- Step 2: Collect and Analyze Data TOC I RESOURCES I PRINT I HELP
Data Analysis - Productivity, Cont.
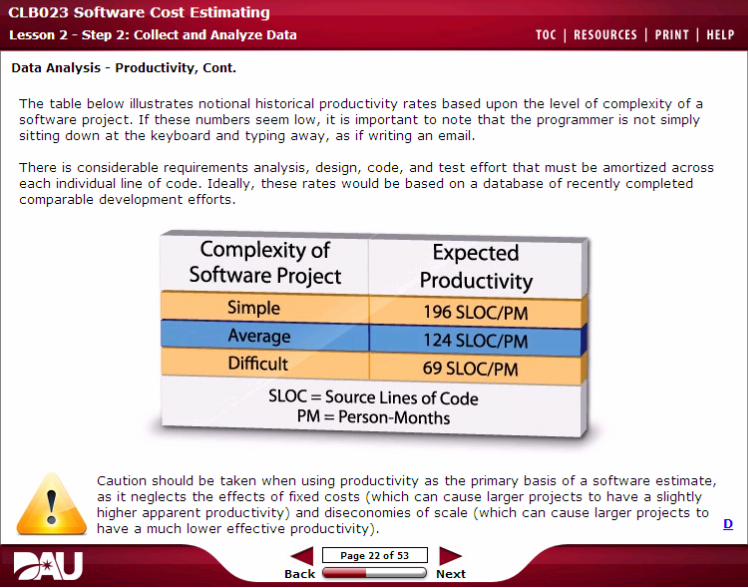
T he table below illustrates no t ional historical productiv i ty rates based upon the level o f complexi ty o f a so f tware projec t . I f these numbers seem low, i t is impor tan t to no te that the programmer is no t simply sitting down at the keyboard and typing away, as i f wri t ing an email.
T here is considerable requiremen ts analysis, design, code, and test e ffor t that must be amor t ized across each indiv idual line o f code. Ideally, these rates would be based on a database o f recen tly comple ted comparable development e ffor ts .
Complexity of Expected Software Project Productivity
Simple ' 196 SLOC/PM
Average I 124SLOCIPM Difficult I
69SLOC/PM I
SLOC =Source Lines of Code 4_ PM =Person-Months
'
Cau tion should be taken when using productiv i ty as the primary basis o f a so f tware estimate, as i t neglec ts the e ffec ts o f fixed costs ( which can cause larger projec ts to have a sligh t ly higher apparen t productiv i ty ) and diseconomies o f scale ( which can cause larger projec ts to have a much lower e ffec t ive productiv i ty ) . Q
.....rfl I Page 22 of 53 _......
Back Next

Long Description
Table with data:
Complexity of Software Expected Project Productivity Simple 196 SLOC/PM Average 124 SLOC/PM Difficult 69 SLOC/PM SLOC = Source Lines of Code PM = Person-Months

CLB023 Software Cost Estimating
lesson 2- Step 2: Collect and Analyze Data TOC I RESOURCES I PRINT I HELP
Software Cost Drivers
A primary goal o f data analysis is to understand the fac tors or parameters that drive cost in order to facili tate the developmen t o f CERs. The three main categories o f so ftware developmen t cost drivers are Size, Complexity and Capabili ty, each o f which is discussed in the following pages.
Throughou t this discussion i t is impor tan t to no te that the nature o f cost drivers is expec ted to vary by the type o f so ftware. Selec t each tab to learn more abou t types o f so ftware.
Developed - The e ffor t for designing, coding, and testing developed software is driven by the size and complexity o f the code, and the capabili ty o f the developmen t team.
SIZE COMPLEXITY CAPABILITY
.....rfl I Page 23 of 53 _......
Back Next

Popup Text
Developed
Developed - The effort for designing, coding, and testing developed software is driven by the size and complexity of the code, and the capability of the development team.
COTS Commercial off-the-shelf (COTS) - The functionality provided by the COTS package and its sophistication drive purchase and licensing costs, and the ease of use and thoroughness of documentation of its application programming interface (APIs) drive integration costs.
ERP Enterprise Resource Planning (ERP) - The scope and effort for an ERP implementation are driven by the RICE-FW count, an enumeration of the required Reports, Interfaces, Conversions, Extensions, Forms and Workflows.
CLB023 Software Cost Estimating
lesson 2- Step 2: Collect and Analyze Data TOC I RESOURCES I PRINT I HELP
Software Cost Drivers - Size
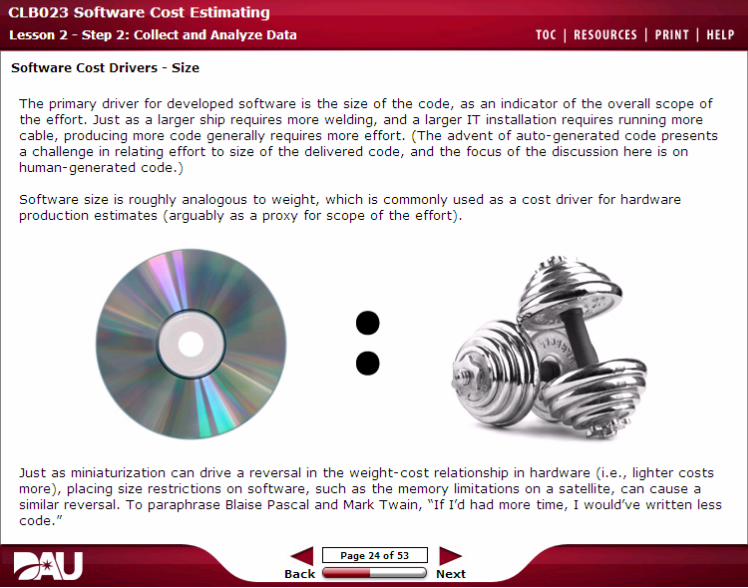
The primary driver for developed software is the size o f the code, as an indicator o f the overall scope o f the e ffor t . Just as a larger ship requires more welding, and a larger IT installation requires running more cable, producing more code generally requires more e ffor t . (The adven t o f au to- generated code presen ts a challenge in relating e ffor t to size o f the delivered code, and the focus o f the discussion here is on human-generated code.)
Software size is roughly analogous to weigh t, which is commonly used as a cost driver for hardware produc tion estimates (arguably as a proxy for scope o f the e ffor t ) .
•• Just as miniaturization can drive a reversal in the weigh t-cost relationship in hardware ( i.e., ligh ter costs more), placing size restric tions on software, such as the memory limitations on a satelli te, can cause a similar reversal. To paraphrase Blaise Pascal and Mark T wain, " If I 'd had more time, I would've written less code."
.....rfl I Page 24 of 53 _......
Back Next

CLB023 So ftwar e Cost Estimating
Lesson 2 - Step 2: Collect and Analyze Data TOC I RESOURCES I PR INT I HELP
Software Cost Dr ivers - Size, Cont.
The most common sizing measure is SLOC; however, other potential sizing units include:
• Function Points, which attempt to remain language- independen t by focusing on the required functionality o f the software
• Objec t Points, which are tailored for use with objec t -oriented ( 0 0 ) programming
• Story Poin ts, which are used in Agile Software Development
• RICE- FW, the sizing measure specific to ERP
Keep in mind that the SRDRs should be considered a primary source of Size and other softv.rare data.
Also remember that for new programs, software size is i tself an estimate!
..... I Pope 25 of 53 .....
Back Next
CLB023 So ftwar e Cost Estimating
Lesson 2 - Step 2: Collect and Analyze Data TOC I RESOURCES I PR INT I HELP
Software Cost Dr ivers - Size- Source Lines of Code (SLOC)
Source Lines Of Code (SLOC) is exactly what it sounds like .
When each code release is completed, an automated code counter can be run to tally Delivered Soyrce Lines Of Code {DSLOC) for inclusion in the historical database.
Logical SLOC is generally pre ferred to physical SLOC, though consistency throughout the database is most important.
For new programs, SLOC must be estimated up fron t, often by analogy to comparable completed effor ts.
..... I Pope 28 of SJ .....
Back Next

Popup Text
Source Lines of Code (SLOC)
Number of lines of software code, including executable instructions and data declarations but excluding comments, blanks, and continuation lines. Can be accurately and consistently counted using automated tools once the code is developed.
Delivered Source Lines of Code (DSLOC)
The actual source lines of code (SLOC) delivered as part of a software release. May be physical or logical.

CLB023 Software Cost Estimating l esson 2- Step 2: Collect and Analyze Data TOC I RESOURCES I PR INT I HELP
Software Cost Drivers - Size - SLOC, Cont.
In a typical software development CER, as in the one from COCOMO II, the exponent on the size parameter indicates the response of effort to size.
A priori, we might expect a direct linear relationship between size an effort, and this is t he implici t assumption of the produc tivity metric just discussed.
However, i f economies of scale are presen t, effort should increase at a decreasing rate with size, corresponding to an exponen t less than 1.
Conversely, if diseconomies o f scale are present, effort should increase at an increasing ra te with size, corresponding to an exponent greater than 1.
Experience shows that the latter is more common, and our examples will reflect that scenario.
These equations are calibrated to estimate the effort of an entirely new development, writing code from scratch .
~ I Pogel7of53 .....
Back Next

CLB023 So ftwar e Cost Estimating
Lesson 2 - Step 2: Collect and Analyze Data TOC I RESOURCES I PR INT I HELP
Software Cost Dr ivers - Size- Equivalent SLOC (ESLOC)
Modem software is typically not written from scra tch, but instead its dev elopment involves the reuse of code. Therefore, a new sizing metric must be used to reftect the change. Equivalent SLOC {ESLOC) is now used.
It is importan t to to understand the varying terms used for reused code.
" Reuse" often implies no modification, whereas " modified" usually re fers to reused code that was altered to some ex tent.
" Carryover" is of ten used to denote code that is being reused from the previous release of the sof tware.
..... I Pope 28 of SJ I ..... Back Next

Popup Text
Equivalent Source Lines of Code (ESLOC)
A weighted average of the amounts of code requiring re-design, re-implementation, and re-test.

CLB023 Software Cost Estimating
lesson 2- Step 2: Collect and Analyze Data TOC I RESOURCES I PRINT I HELP
Softw are Cost Drivers - Size - ESLOC, Cont.
The idea o f ESLOC is to convert DSLOC to a (smaller ) number to re flec t the to tal e ffort required. The ac tual e ffort, taking into account reuse, is " equivalent" to the e ffort that would be required to develop the smaller amount o f code (ESLOC) from scratch.
ESLOC is generally calculated by applying an e ffic iency fac tor to DSLOC.
Efficiency Factor (EF) X DSLOC ESLOC
By defini t ion, the e ffic iency fac tor for all new code is 100% . That is, the ESLOC for all new code is iden tical to DSLOC. The e ffic iency fac tor decreases from there as reuse ge ts more " e ffic ient."
Applying a small e ffic iency fac tor makes ESLOC quite small in comparison to DSLOC. Because this is the primary driver o f the estimate, care must be taken in applying the e ffic iency and making sure i t is soundly derived.
.....rfl I Page 29 of 53 _......
Back Next

CLB023 Software Cost Estimating
lesson 2- Step 2: Collect and Analyze Data TOC I RESOURCES I PRINT I HELP
Softw are Cost Drivers - Size - ESLOC, Cont.
A standard approach is to compute the e ffic iency fac tor as a weighted average o f fac tors for each phase o f development. For example, assume that 40% o f a new development e ffort is design, 30% is coding, and 30% is integration and test ( I&T ) .
The weighted averages can be applied to the frac tion o f existing code that needs to be redesigned, the frac tion o f existing code that needs to be rewritten, and the degree o f re test required, respec tively .
The information presented in the graphic assumes the following software development scenario: existing computer so ftware configuration i tem (CSCI ) o f 10,000 SLOC ( 10 KSLOC), 50% redesign, 80% recode, 100% re test .
Component Weighted Avg Existing CSCI Efficiency Factor New Development
~ Design 40%(0.4) SO% 20%L Coding I 301111 (03) I 8096 24911 I_ I&T 30%(0.3) !I 100% 30%
TOTAL 74%
~
ESLOC -74% X 10 000 74 >, 00 (7.4 KSLOC) ' The e ffort to reuse this code is 74% o f what i t would take to wri te i t from scratch, a 26% savings. To compute to tal ESLOC for a planned release, add the size o f the new code to be produced and the ESLOC calculations for each piece o f reused code.
Q
.....rfl I Page 30 of 53 _......
Back Next

Popup Text
Degree of retest
Generally all code needs to be retested, even the portion reused without modification.
Long Description
Table with the following data:
Component Weight Avg. New Development
Existing CSCI
Efficiency Factor
Design 40% (0.4) 50% 20%
Coding 30% (0.3) 80% 24%
I&T 30% (0.3) 100% 30%
Total 74%
ESLOC = 74% X 10,000 = 7,400 (7.4 KSLOC)

CLB023 So ftwar e Cost Estimating
Lesson 2 - Step 2: Collect and Analyze Data TOC I RESOURCES I PR INT I HELP
Software Cost Dr ivers - Size - ProRad ESLOC Calculations
The number of SLOC for the software development effort of each waveform was known to be a driving cost of the estimate.
The sizing estimate started in FY1998 with a review o f the waveforms to be applied to the Air Force's SpeakEASY Radio.
The Rome Laboratories had developed a list o f wave forms and expec ted SLOC as part o f the design for SpeakEASY.
These SLOC counts were reviewed by a team of radio and waveform experts from the Army's PM TRCS, the Navy's Digital Modular Radio Program, and from DARPA to come up with expected SLOC for the ProRad application waveforms.
Similar reviews were conducted with other analogous radio systems. ProRad Click here to y jew a proRad waveform SLOC data table. Case Study
...... I Poge31ofS3 .....
Back Next

CLB023 So ftwar e Cost Estimating
Lesson 2 - Step 2 : Collect and Analyze Data TOC I RESOURCES I PR INT I HELP
Software Cost Dr ivers - Size - ProRad ESLOC Calculations, Cont.
In sum, the following programs w ere used to help estimate the SLOC for the various ProRad w aveform software development efforts :
• Army Systems: Joint Tac tical Terminal (JTT); Joint Communications Interface Terminal {JCIT)
• Navy Systems : Digital Modular Radio {DMR); Mul ti-Function Information Distribution System (MIDS)
• Air Force Systems: Airborne Integra ted Terminal Group (AITG); SpeakEASY Radio
In addition, two acquisition strategies were ev aluated for each waveform:
1. Develop the entire waveform software from scratch; and ProRad
2. Modify the existing waveform soft ware to make it SCA-complian t Case Study
Click here to y jew a proRad wave form SLOC data table.
..... I Pope 32 of SJ .....
Back Next

CLB023 So ftwar e Cost Estimating
Lesson 2 - Step 2: Collect and Analyze Data TOC I RESOURCES I PR INT I HELP
Software Cost Dr ivers - Size - Function Points
Function points are a size measure that considers the number of functions being developed based on the requirements specification . It is perhaps the most perhaps the most prevalent alternative to SLOC.
The functions counted comprise:
• External Inputs (EI) - User inpu ts that provide data
• External Outputs (EO) - Outpu t to users SLICh as reports, screens, error messages
• External Inquiries (EQ) - Data sent to other applica tions
• Internal Logical Files ( ILF) - Online input that results in so ftware response
• External Interface Files (ElF) - Machine readable in terfaces used to transmit information to another sys tem (disks and tapes)
Function Type Simple Average I Complex El 3 4 6 EO I 4 I 6 7 EQ 3 I 4 6 ILF _I 7 10 15
.liii ElF I 5 7 10 Q
..... I Pope 33 of S3 .....
Back Next

Long Description
Table with the following data:
Function Type Simple Average Complex
EI 3 4 6
EO 4 6 7
EQ 3 4 6
ILF 7 10 15
EIF 5 7 10

CLB023 So ftwar e Cost Estimating
Lesson 2 - Step 2 : Collect and Analyze Data TOC I RESOURCES I PR INT I HELP
Software Cost Dr ivers - Size - Function Points, Cont.
After the functions are counted, they are weighted first for complexity to get an unadjusted function point (UFP) count-see table below. The UFP count is then further adjusted to account for 14 additional factors.
There are a number of standards for function point counting, and the In ternational Function pojnt Users Group ( !FPUG) certifies function poin t counters .
Funct ion Type Simple Average Complex El 3 4 6 EO I 4 6 7 EQ 3 i 4 6
.. ILF ElF
I 7
5
10
7 15 10
Q
..... I Pope 34 of SJ I ..... Back Next

Long Description
Table with the following data:
Function Type Simple Average Complex
EI 3 4 6
EO 4 6 7
EQ 3 4 6
ILF 7 10 15
EIF 5 7 10

CLB023 So ftwar e Cost Estimating
Lesson 2 - Step 2 : Collect and Analyze Data TOC I RESOURCES I PR INT I HELP
Software Cost Driver s - Complex ity
After Size, the next broad category of sofl\vare cost drivers is Complexity, factors relating to the sofi\Vare itself.
The factors may include:
• Quality - requirements for sa fety or reliability that dic tate the degree to which the code must be bugfree.
• LangL1age - the programming language( s) LISed for development.
• Application - the intended function of the software, which dictates the difficulty of the algorithms needed
• Hardware Limitations - limited memory or processor speed, as on a satellit e.
• Number of Modules - driv es the degree of integration, standardization, communication, and coordination required.
• Number of interfaces - both internal interfaces with COTS packages and external in terfaces with other systems.
..... I Pope 35 of 53 .....
Back Next

CLB023 So ftwar e Cost Estimating
Lesson 2 - Step 2: Collect and Analyze Data TOC I RESOURCES I PR INT I HELP
Software Cost Dr ivers - Complex ity - Complex ity Factors
Greater complexity drives up cost, often at increasing rates. While the response may not be exponential in a strict mathematical sense, complexity factors can have a significant impact . COCOMO 11 divides complexity-related considerations into two groups, product factors and pla tform factors.
Platform Factors 1
• RELY Required Software Reliabili ty ' ·"' ProdiictEM s by Rating
• OATA Database Size '·"' 1.60 /
• CPLX Produc t Complexity lAO 4~
• RUSE Developed for Reusabili ty 1.00'·'"~~~~~ OMO ;:::;. :# nuv
• DOCU Documentation Match to Life- Cycle Needs 0.00 -DATA
- CPU< OAO _ ,,,,Whether or not you use COCOMO, the response OJO - oocuillustrated here is typical. .... - .... _..,. .........
The EMs are Effort Multipliers, and you can see that a single factor can easily drive e ffort up or down Select the image to enlarge. (usually the former) by 20 or 30 percent.
..... I Pope 38 of SJ .....
Back Next

Popup Text
Product Factors
• RELY Required Software Reliability • DATA Database Size • CPLX Product Complexity • RUSE Developed for Reusability • DOCU Documentation Match to Life-Cycle Needs
Whether or not you use COCOMO, the response illustrated here is typical. The EMs are Effort Multipliers, and you can see that a single factor can easily drive effort up or down (usually the former) by 20 or 30 percent.

Popup Text
Platform Factors
• RELY Required Software Reliability • DATA Database Size • CPLX Product Complexity • RUSE Developed for Reusability • DOCU Documentation Match to Life-Cycle Needs
Whether or not you use COCOMO, the response illustrated here is typical.
The EMs are Effort Multipliers, and you can see that a single factor can easily drive effort up or down (usually the former) by 20 or 30 percent.

CLB023 So ftwar e Cost Estimating
Lesson 2 - Step 2: Collect and Analyze Data TOC I RESOURCES I PR INT I HELP
Software Cost Drivers - Complexity - Quality
Quality requirements for DoD software are usually defined by system safety (if this flight software fails, the plane may crash, and the crew may die) and operational availability (high system reliability, so that i t is almost never "down") .
High quali ty calls for well -defined requirements, care ful design, thorough tes ting, and o ften addi tional Mission Assurance (MA) or Independent Veri fication and Validation ( IV&V), all driving up effort in comparison to a slapdash development.
Quality is primarily rela ted to the COCOMO EM for Reliabili ty ( RELY) .
High- quality softo.Yare has the side benefit of being eminently more maintainable.
Typically there will not be many bugs to find in the first place, and those that do arise are rela tively easy to fix.
..... I Pope 37 of SJ .....
Back Next

CLB023 So ftwar e Cost Estimating
Lesson 2 - Step 2 : Collect and Analyze Data TOC I RESOURCES I PR INT I HELP
Software Cost Drivers - Complex ity - Quality, Cont.
As with many complex development efforts, software is often prey to maj or defects uncovered during integration and testing ( i&T), requiring significant rework.
To avoid this situation, a sound development approach includes breaking things down in to manageable components, defining standards and in ter faces, and veri fication and validation o f each step throughOLit the process.
T igh t schedules and staffing constrain ts often force a departure from these bes t prac tices.
The result may be that the code does not work because of improperly defined interfaces or coders working overtime and simply making mistakes.
Software quality measures are often collected to assist in project management.
Typical measures include de fects identified, defects fixed, de fect density, de fect ra tes, and McCabe's cycloma tic complexity .
..... I Pope 38 of SJ .....
Back Next

CLB023 Softw a re Cost Estimating l esson 2 - Step 2: Collect and Analyze Data
Software Cost Drivers - Complex ity - Programming Language
Comput ers operate based on sets o f instructions contained in programs. These programs can be written in v arious languages. Within the same release, d ifferent CSCis may be w ritten in different languages. The figure t o the right shows the various levels of programming languages. Select each oval t o read more.
The lowest level represen ts the binary, or machine, instructions that a computer execu tes .
The next level represents assembly code; one assembly line o f code (LOC) usually generates one machine instrue tion.
Next are the Hjgher-Order Languages (HOLsl , closer to • normal English." Compared to assembly language, HOLs are easier to read and write, bu t they also consume more of a computer's resources. Thirdgeneration languages such as FORTRAN, COBOL, ADA, and c are examples of HOLs.
Recently, there has been a trend t oward Very High Order Languages (VHOLs), which more closely resemble human languages. VHOLs allow a person with li ttle or no programming background to program a computer .
TOC I RESOURCES I PRIN T I HELP
"How fast must I 90 tD reach Oaytoofrom Columbus in one hour?"
Compute speed given distance and time.
SPEED • tPtoow-Pa.o)DELTIM
LDA PN<w SHf Pa.o SHf AC LDA DIM
01101101 11101101 001~.!100
~ I Poge 3Rof53 .....
Back Ne xt

Popup Text
Higher-Order Language (HOL)
A programming language that requires little knowledge of the computer on which a program will run, allows symbolic naming of operations and addresses, provides features designed to facilitate expression of data structures and program logic, and usually results in several machine language instructions for each program statement. Examples include Ada, BASIC, C, C++, COBOL, FORTRAN, PASCAL, and ALGOL. Also called Third Generation Language (3GL).
Note As previously noted, data should be segregated by language, or different languages should be normalized to a common standard.
Lower-order languages may be more machine efficient, but they result in lower development productivity because they are more onerous to code.

CLB023 So ftwar e Cost Estimating
Lesson 2 - Step 2: Collect and Analyze Data
Software Cost Drivers - Complex ity - Application
As previously noted, the correlated c haracteristics of Operating Environment, Platform, and Application drive the effort needed for software development.
Application is primarily related to the COCOMO EM for Produc t Complexity {CPLX), while Platform is related to all three Pia t form Fac tors .
For example, the hardware on which software will rLin can affect the way so ftware is written. On weapons or space fligh t systems where space, weight, and power are at a premium, computer storage may be limited, forcing the developer to write code that is much more efficient than for a ground system with unlimited storage space.
Application refers to the use of the software, which may vary by CSCI. It reflects the degree of sophistication required in the component algorithms and relates back to the previous discussion of Quality.
Operating systems with the requirement for reliability and stric t timing require more care ful design and development and significantly more testing than simple rna th operations.
TOC I RESOURCES I PR INT I HELP
Statistical/Mathematical
String Manipulation
Graphical User Interface (GUI)
Data Storage and Retrieval
Graphical Functions
Online Communications
Control Functions
Multimedia
RealTime
Interactive
Operating System
Logical Functions
Select each of t he titles on the graphic above t o read more.
Q
..... I Poge40ofSJ .....
Back Next

Long Description
A CD disk with interactive (clickable) listed topics overlaid. The topics and their descriptions are as follows:
Statistical/Mathematical - Simple math calculations, statistical routines, calculator functionality; processing time is not important.
String Manipulation - Text based manipulation, sorting, formatting, text-based input and output functionality, text processing, parsing, and sorting.
Graphical User Interface (GUI) - Interactive user interface; response time not critical; input sheets for an application, toolbar functionality, etc.
Data Storage and Retrieval - Reading and writing data to file or database, database management, database access control and security.
Graphical Functions - Data plotting, graphics creating and access, creation and manipulation of line charts, pie charts, etc.
Control Functions - Hardware control functions.
Multimedia - Information processing in a variety of formats (audio, video and text); response time very important but not critical.
Real Time - Machine to machine process communication with critical response time, protocol requirements strict, heavy interaction with hardware.
Interactive - Real time functionality with graphical capability; response must be immediate and visual, critical response time, strict protocol requirements, heavy interaction with hardware.

Popup Text
Operating System - Task and memory functions, response time critical, heavy interaction with hardware, strict timing and high reliability requirements.
Logical Functions - Algorithms containing complex mathematical logic such as smart air protection systems.
CLB023 So ftwar e Cost Estimating
Lesson 2 - Step 2: Collect and Analyze Data TOC I RESOURCES I PR INT I HELP
Software Cost Drivers - Complex ity - ProRad Complexity
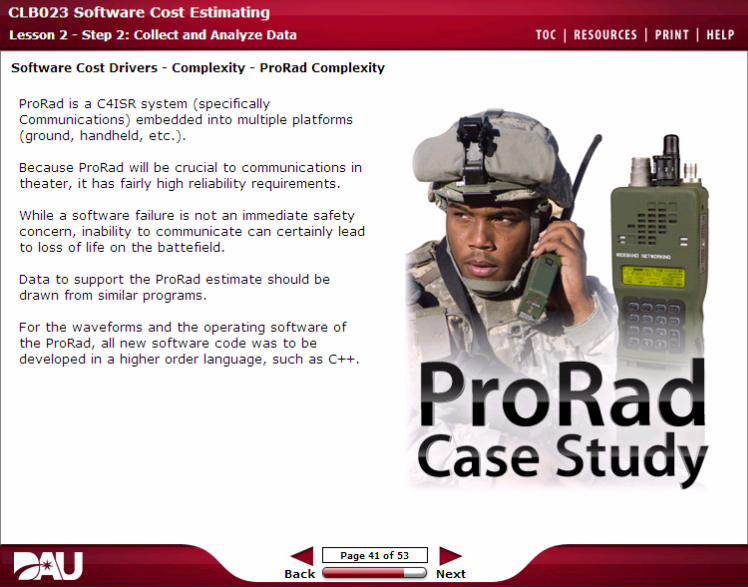
ProRad is a C41SR system (specifically Communications) embedded into multiple platforms (ground, handheld, etc. ) .
Because ProRad will be crucial to communications in theater, i t has fairly high reliability requirements.
While a software failure is no t an immediate safety concern, inabili ty to communicate can certainly lead to loss o f li fe on the batte field.
Data to support the ProRad estimate should be drawn from similar programs.
For t he waveforms and the operating software of the ProRad, all new software code was to be dev eloped in a higher order language, such as C++.
ProRad Case Study
..... I Pope 41 of SJ .....
Back Next

CLB023 So ftwar e Cost Estimating
Lesson 2 - Step 2 : Collect and Analyze Data TOC I RESOURCES I PR INT I HELP
Software Cost Dr iver s - Capability
The third main group of cost drivers is capability, encompassing both the skill, experience, and expertise of the development team and the tools at their disposal.
Computer- Aided Software Engineering, or CASE, tools should au tomate the software development process, bringing in tegrity and e fficiency .
Relevant experience on the part o f the individual programmers incl~1des experience coding in a particular language, experience developing a certain type o f application, and experience in a particular development environment .
..... I Poge42ofSJ .....
Back Next
CLB023 So ftwar e Cost Estimating
Lesson 2 - Step 2: Collect and Analyze Data TOC I RESOURCES I PR INT I HELP
Software Cost Dr ivers Capability, Cont.
It c an be a challenge t o assess the collectiv e capability of a sizeable development team, and even more of a challenge to estimate what the capability of a development team will be early in acquisition, before a development contractor has even been selected.
Take care to avoid the " Lake Wobegon Effect," wherein all development teams are claimed to be BY GARRISON KEILLOR
above average.
On the con trary, large projec ts tend to experience regression to the mean.
As you would expect, greater capability drives down cost.
Unfortunately, the effect is asymmetric , with low capability impacting productivity disproportionately more than high capability.
A mnemonic for this is "Bad programmers hur t you more than good programmers help you."
This is illustrated on the next page.
..... I Poge43ofS3 .....
Back Next

CLB023 Software Cost Estimating
Lesson 2 - Step 2: Collect and Analyze Data TOC I RESOURCES I PR INT I HELP
Software Cost Drivers - Capability - Capability Factors
COCOMO II divides capability- related considerations into two groups: personnel factors and product factors. Select each tab to leam more.
Product Factors
• ACAP Analys t Capability uo
• PCAP Programmer Capabili ty lAO
• PCON Personnel Con tinuity 1.20
• APEX Applica tions Experience UXt
PLEX Platform Experience 0.80
• - ACAP 0.60 - I'CAP
• L TEX Language and Tool Experience - PCONOAO -APEX
Whether or not you use COCOMO, the response 0.20 - - - PlEX- mxillustrated here is typical.
0.00
vtry tow lOW' NominOII 1-qh Very Hlilf' rx-11.- 1-tChNote that the effect is rev ersed from Complexity. L-____________...::.____..:__ _ ...::.__J
Select the image to enlarge.
..... I Pope 44of SJ .....
Back Next

Popup Text
Personnel Factors
• ACAP Analyst Capability • PCAP Programmer Capability • PCON Personnel Continuity • APEX Applications Experience • PLEX Platform Experience • LTEX Language and Tool Experience
Whether or not you use COCOMO, the response illustrated here is typical.
Note that the effect is reversed from Complexity.
Product Factors
• TOOL Use of Software Tools • SITE Multisite Development • SCED Required Development Schedule

CLB023 Software Cost Estimating
lesson 2- Step 2: Collect and Analyze Data TOC I RESOURCES I PRINT I HELP
Software Cost Drivers - Capability - Capability Maturity Model - Integrated (CCMI)
In 1987, the Software Engineering Institute (SEI) at Carnegie Mellon University developed a methodology for assessing an organization's so ftware processes. This became the framework for the Capabili ty Maturi ty Model (CMM).
The CMM was ini t ially developed for the Government to evaluate an organization's abili ty to perform software development and maintenance work on Government contrac ts. In 2001, SEI replaced CMM-SW with a suite o f CMM Integration CCMMil models.
The CMMI model for systems engineering and software (SE/ SW) has five levels o f so ftware process maturi ty . These charac teris tics are typically demonstrated by organizations at that level.
Software Engineering Institute
Carnegie Mellon
~ I Page 45 of 53 ~ Back Next

Popup Text
Capability Maturity Model (CMM)
Originally developed by DoD’s Software Engineering Institute (SEI), the Software CMM (SW-CMM) was extensively used for disciplined software process improvement efforts. While references to it are still encountered, a more comprehensive and integrated process model—the Capability Maturity Model Integration (CMMI)—has replaced the SW-CMM. The SW-CMM was retired effective Dec. 31, 2005, and all SW-CMM ratings expired Dec. 31, 2007.
Capability Maturity Model Integration (CMMI)
Derived from the now-retired Software Capability Maturity Model (SW-CMM), the CMMI integrates a number of disciplines into a unified model useful for process improvement. Three domain variations (socalled “CMMI constellations”) of the CMMI exist: one for development organizations (CMMI-DEV), one for acquisition organizations (CMMI-ACQ), and one for service-type organizations (CMMI-SVC). All the models share a common set of core processes with additional processes added as appropriate for the domain. While the CMMI models can provide ratings on a numerical scale (5 being the highest), DoD’s preference is to use them primarily in a process improvement role, de-emphasizing numerical ratings. The Software Engineering Institute (SEI) manages the three CMMI product suites.

CLB023 So ftwar e Cost Estimating
Lesson 2 - Step 2: Collect and Analyze Data TOC I RESOURCES I PR INT I HELP
Software Cost Drivers - Capability - CMMI, Cont.
Organizations that have implemented software process improvements resulting from CMM and CMMI evaluations have generally achiev ed many benefits, including significant cost savings and significant re turn on investment (ROI) .
In addition, many Government buying ac tivi t ies wan t contrac tors to be certi fied at a par ticular level before considering them for con tract award.
As with mos t assessments, the cer tification does no t magically make an organiza tion more produc tive, but rather i t is the applica tion of principles and processes that both lead to greater efficiency and support the CMMI rating, which makes CMMI level a reasonable indicator of productivity .
..... I Pope 4hf SJ .....
Back Next

CLB023 So ftwar e Cost Estimating
Lesson 2 - Step 2: Collect and Analyze Data TOC I RESOURCES I PR INT I HELP
Software Cost Drivers - Capability - ProRad Capability
The Joint ProRad Program Office assumed that software would be dev eloped by "programmers with nominal to high skill lev els and experience, using object-oriented skills and prac tices.•
We should be worried that this assumption creates a risk that developers will no t be able to sta ff such an above-average team for this significan t effort.
No assumptions were made about the maturity o f the vendors' so ftware development processes, such as a particular CMMI rating.
ProRad Case Study
..... I Poge47ofSJ .....
Back Next

CLB023 So ftwar e Cost Estimating
Lesson 2 - Step 2: Collect and Analyze Data TOC I RESOURCES I PR INT I HELP
Knowledge Review
Wee Sofl\vare Coding, Ltd., is a small business with a S30M subcontract for software developmen t on an ACAT I program.
TRUE or FALSE: Because of the rela tively small dollar value of the subcontract, they do not have to submit an SRDR.
TRUE
./ FALSE
The answer is FALSE. Any so ft ware developmen t e ffort o f $20M for an ACAT I program requires an SRDR submission.
..... I Poge48ofSJ .....
Back Next

CLB023 So ftwar e Cost Estimating
Lesson 2 - Step 2: Collect and Analyze Data TOC I RESOURCES I PR INT I HELP
Knowledge Review
The Super-Duper Coding Group produced a 10K SLOC CSCI using 5,000 labor hours. Which o f the following would you expect for their productivity in developing a 20K SLOC CSCI?
Less than 10,000 labor hours
10,000 labor hours
U More than 10,000 labor hours
./ Less than 2 SLOC/ hour
More than 2 SLOC/ hour
Less than 2 SLOC/hour would be expec ted for the produc tivity in developing a 20K SLOC CSCJ. Demonstra ted produc tivi ty is 2 SLOC/ hour, but produc tivi ty is generally expec ted to decline for larger e ffor ts due to diseconomies o f scale.
..... I Pope 4hf SJ .....
Back Next

CLB023 So ftwar e Cost Estimating
Lesson 2 - Step 2: Collect and Analyze Data TOC I RESOURCES I PRINT I HELP
Knowledge Review
For which of the following factors would a rating of Very High translate to less development effort than a rating of Nominal?
Required Software Reliability
Database Size
U ProdLIC t Complexity
Platform Vola tility
.J Personnel Continuity
Very High rating in Personnel Cont inuity would translate to less development effort than a rating o f Nominal. The first foLir factors are all related to Complexity, which drives LIP development effort. Higher Personnel ContinLii ty, which is in the Capabili ty family, woLIId drive down development e ffort.
..... I Pope 50 of 53 .....
Back Next

CLB023 So ftwar e Cost Estimating
Lesson 2 - Step 2: Collect and Analyze Data TOC I RESOURCES I PR INT I HELP
Knowledge Review
A software development effort is to produce two CSCis of 8K SLOC. The first is to be written from scratch . The second is based on an existing CSCI of the same size, and the effort will require 60% recode and 80% retest. What is the combined ESLOC for the two CSC!s?
8,000 SLOC
./ 11, 360 SLOC
13,600 SLOC
16,000 SLOC
16,000 SLOC
11,3 60 SLOC is the combined ESLOC for the two CSCi s. For the first CSCI, 8K DSLOC transla tes into 8K ESLOC, because i t 's 100% new . The e fficiency fac tor for the second CSCI (assuming 40%/30%/30% Design/ Code/Test) is 0.4 * 0% + 0.3 ~ 60% + 0.3 * 80% = 0.42, which when multiplied by 8K SLOC gives 3,360 SLOC. The sum o f the two gives the correc t answer above.
..... I Pope 51 of 53 .....
Back Next

CLB023 Software Cost Estimating
lesson 2- Step 2: Collect and Analyze Data TOC I RESOURCES I PRINT I HELP
Summary
This comple tes the Collec t and Analyze Data lesson. In this lesson you learned:
• So ftware Resource Data Repor ts (SRDRs) and o ther sources o f ac tual e ffor t, sizing, and o ther data from comple ted programs are crucial to suppor t reliable software estimates.
• So ftware data must be normalized in order to be made comparable, including for a consisten t se t o f ac tivi t ies (e ffor t data) and to account for differences in code counters and programming languages (sizing data) .
• While development productivi ty ( lines o f code per hour, for example) is a use ful and commonly ci ted software measure, i t is no t the best way to estimate e ffor t .
• Size is the primary driver for developed software, along with Complexity o f the code and Capabili ty o f the development team and i ts tools.
Develop Collect and Develop Consider Document \ Scope and Analyze Estimate Risk and and Present '. Approach Data Methodology Uncertainty Estimate
Q
.....rfl I Page 52 of 53 _......
Back Next

Long Description
Graphic illustrates the steps of the Cost Estimating process. The steps from left to right are: Develop Scope and Approach, Collect and Analyze Data (highlighted), Develop Estimate Methodology, Consider Risk and Uncertainty, and Document and Present Estimate.

CLB023 So ftwar e Cost Estimating
Lesson 2 - Step 2 : Collect and Analyze Data TOC I RESOURCES I PR INT I HELP
Lesson Completion
You have completed the content for this lesson.
To con tinue, selec t another lesson from the Table o f Con ten ts on the le ft.
I f you have closed or hidden the Table of Contents, click the Show TOC
button at the top in the Atlas navigation bar.
..... I Poo• 53 of 53 .....
Back Next