Embed Size (px)
Citation preview
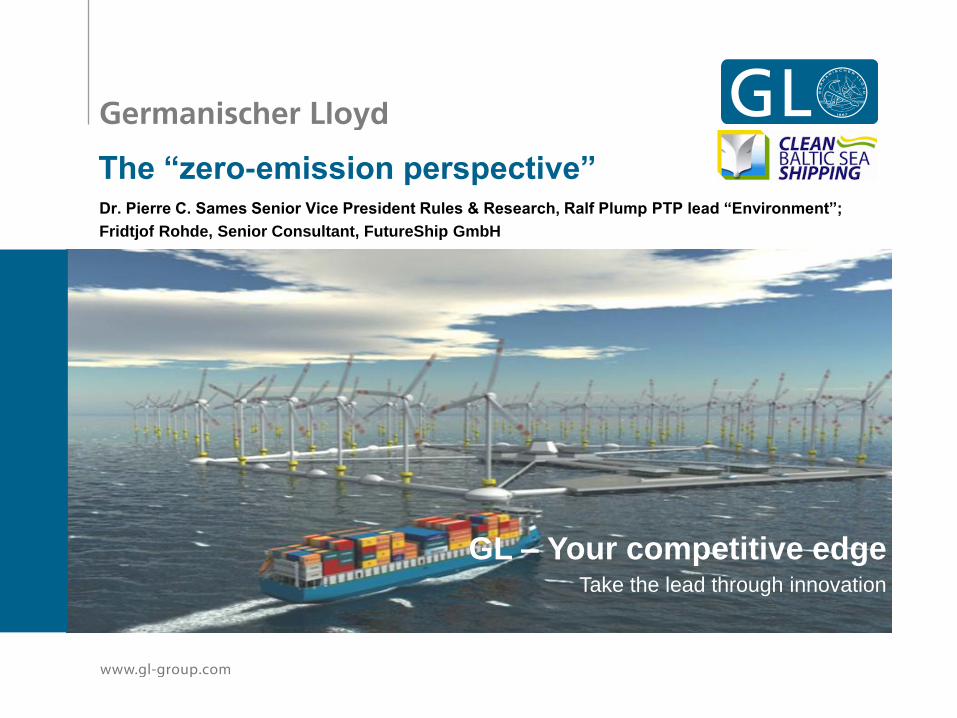
GL – Your competitive edge Take the lead through innovation
The “zero-emission perspective” Dr. Pierre C. Sames Senior Vice President Rules & Research, Ralf Plump PTP lead “Environment”;
Fridtjof Rohde, Senior Consultant, FutureShip GmbH

A vision for a zero emission container feeder vessel | CLEAN BALTIC SEA SHIPPING MIDTERM
CONFERENCE 2012-09-19, Riga / Latvia | No. 2
Contents
The challenges
One solution
• the vessel
• Hydrogen as fuel
• cost-benefit analysis
• LH2 or CH2
• a ferry concept
Conclusions
A vision for a zero emission container feeder vessel | CLEAN BALTIC SEA SHIPPING MIDTERM
CONFERENCE 2012-09-19, Riga / Latvia | No. 3
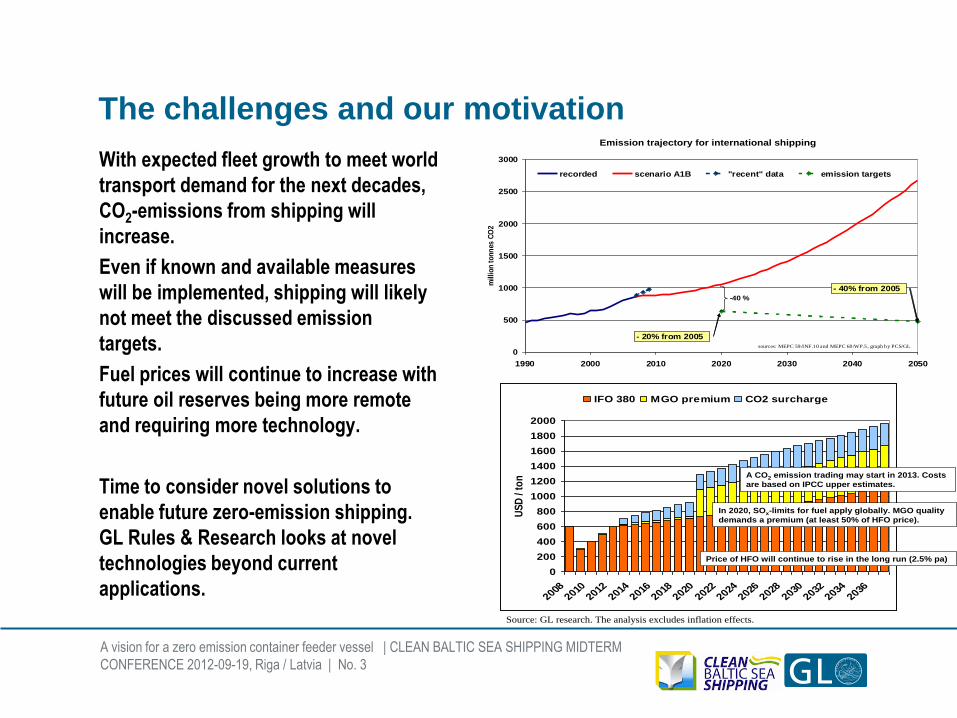
The challenges and our motivation
With expected fleet growth to meet world
transport demand for the next decades,
CO2-emissions from shipping will
increase.
Even if known and available measures
will be implemented, shipping will likely
not meet the discussed emission
targets.
Fuel prices will continue to increase with
future oil reserves being more remote
and requiring more technology.
Time to consider novel solutions to
enable future zero-emission shipping.
GL Rules & Research looks at novel
technologies beyond current
applications.
Emission trajectory for international shipping
0
500
1000
1500
2000
2500
3000
1990 2000 2010 2020 2030 2040 2050
mill
ion
to
nn
es C
O2
recorded scenario A1B "recent" data emission targets
- 20% from 2005
- 40% from 2005
-40 %
sources: MEPC 59/INF.10 and MEPC 60/WP.5, graph by PCS/GL
0
200
400
600
800
1000
1200
1400
1600
1800
2000
20082010
20122014
20162018
20202022
20242026
20282030
20322034
2036
US
D /
ton
IFO 380 MGO premium CO2 surcharge
A CO2 emission trading may start in 2013. Costs
are based on IPCC upper estimates.
Price of HFO will continue to rise in the long run (2.5% pa)
In 2020, SOx-limits for fuel apply globally. MGO quality
demands a premium (at least 50% of HFO price).
Source: GL research. The analysis excludes inflation effects.
A vision for a zero emission container feeder vessel | CLEAN BALTIC SEA SHIPPING MIDTERM
CONFERENCE 2012-09-19, Riga / Latvia | No. 4
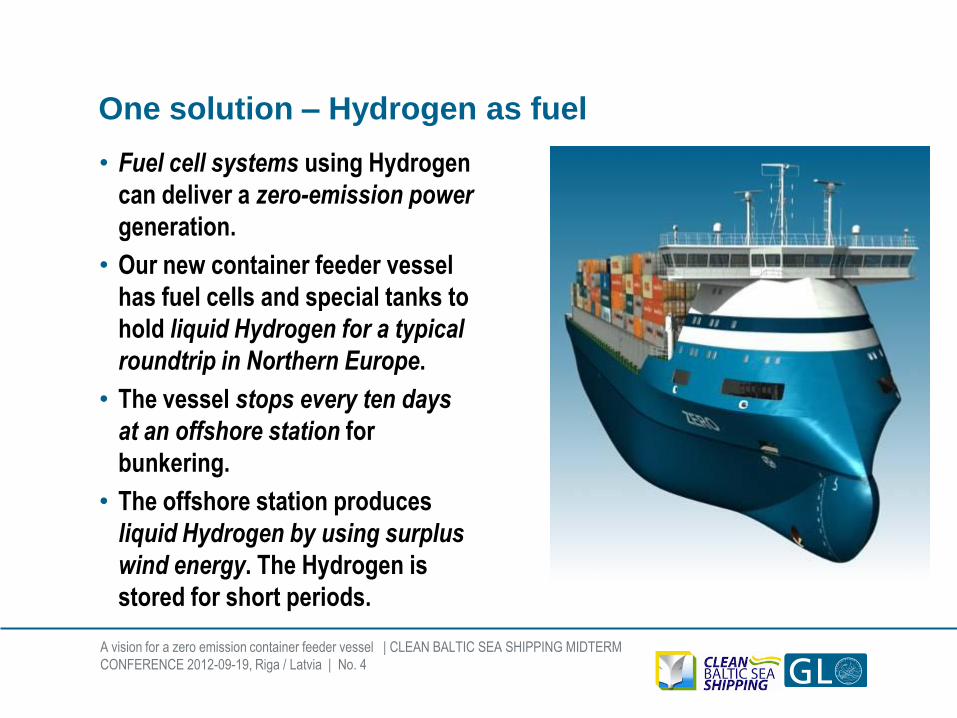
One solution – Hydrogen as fuel
• Fuel cell systems using Hydrogen
can deliver a zero-emission power
generation.
• Our new container feeder vessel
has fuel cells and special tanks to
hold liquid Hydrogen for a typical
roundtrip in Northern Europe.
• The vessel stops every ten days
at an offshore station for
bunkering.
• The offshore station produces
liquid Hydrogen by using surplus
wind energy. The Hydrogen is
stored for short periods.
A vision for a zero emission container feeder vessel | CLEAN BALTIC SEA SHIPPING MIDTERM
CONFERENCE 2012-09-19, Riga / Latvia | No. 5
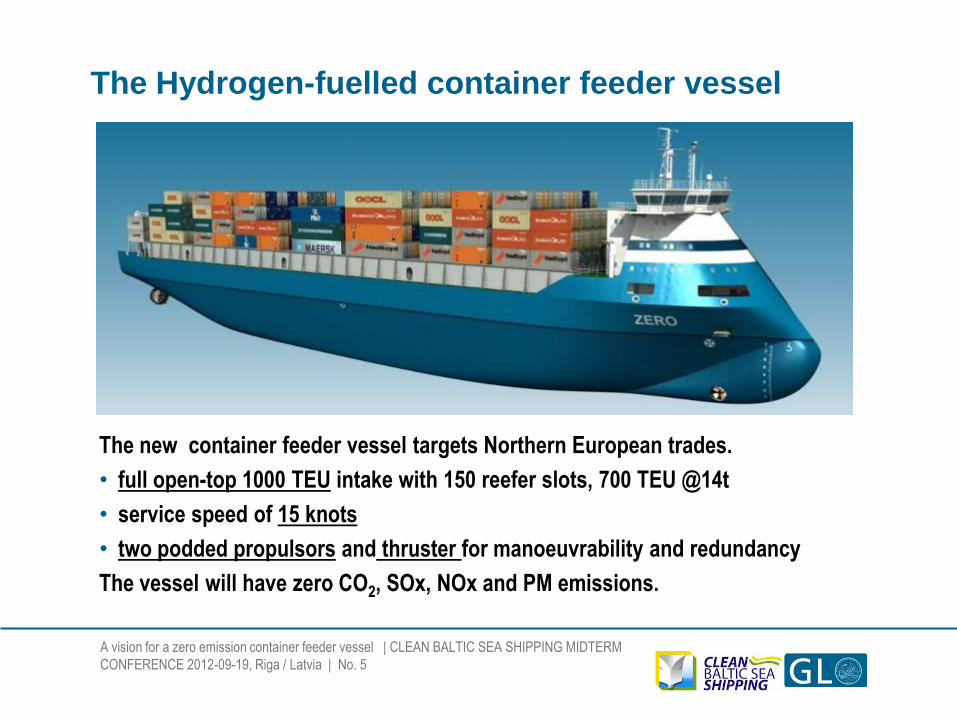
The Hydrogen-fuelled container feeder vessel
The new container feeder vessel targets Northern European trades.
• full open-top 1000 TEU intake with 150 reefer slots, 700 TEU @14t
• service speed of 15 knots
• two podded propulsors and thruster for manoeuvrability and redundancy
The vessel will have zero CO2, SOx, NOx and PM emissions.
A vision for a zero emission container feeder vessel | CLEAN BALTIC SEA SHIPPING MIDTERM
CONFERENCE 2012-09-19, Riga / Latvia | No. 6
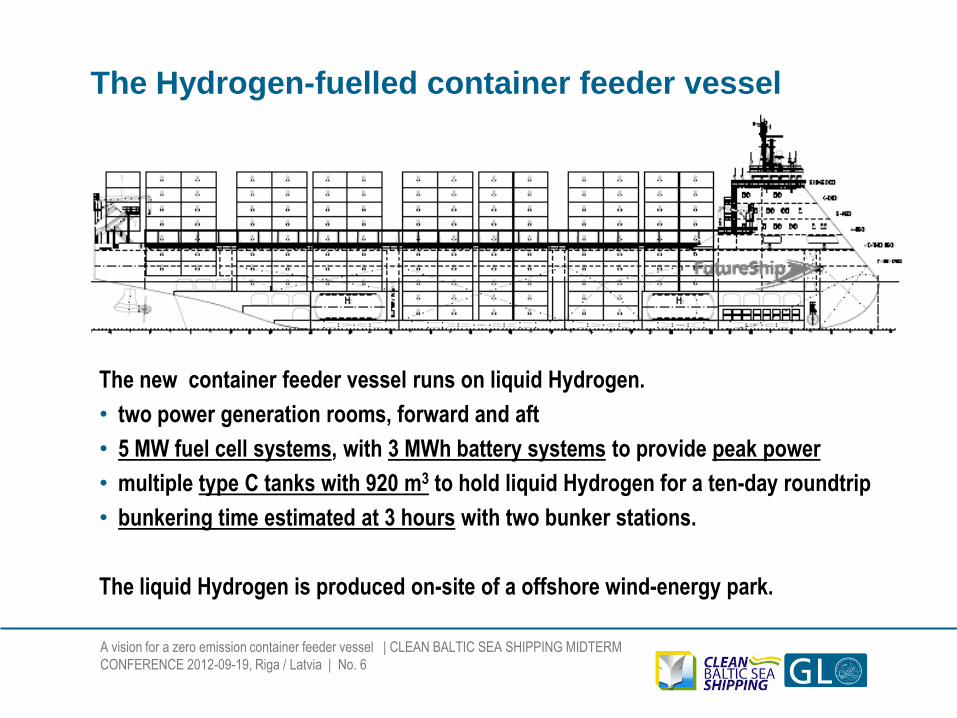
The Hydrogen-fuelled container feeder vessel
The new container feeder vessel runs on liquid Hydrogen.
• two power generation rooms, forward and aft
• 5 MW fuel cell systems, with 3 MWh battery systems to provide peak power
• multiple type C tanks with 920 m3 to hold liquid Hydrogen for a ten-day roundtrip
• bunkering time estimated at 3 hours with two bunker stations.
The liquid Hydrogen is produced on-site of a offshore wind-energy park.
A vision for a zero emission container feeder vessel | CLEAN BALTIC SEA SHIPPING MIDTERM
CONFERENCE 2012-09-19, Riga / Latvia | No. 8
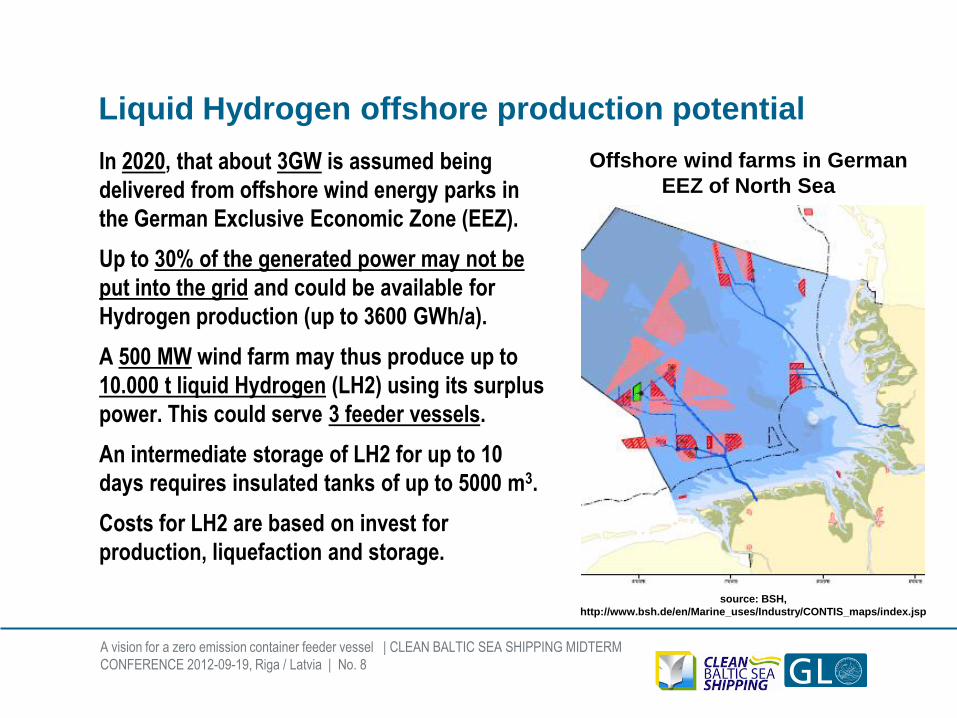
Liquid Hydrogen offshore production potential
In 2020, that about 3GW is assumed being
delivered from offshore wind energy parks in
the German Exclusive Economic Zone (EEZ).
Up to 30% of the generated power may not be
put into the grid and could be available for
Hydrogen production (up to 3600 GWh/a).
A 500 MW wind farm may thus produce up to
10.000 t liquid Hydrogen (LH2) using its surplus
power. This could serve 3 feeder vessels.
An intermediate storage of LH2 for up to 10
days requires insulated tanks of up to 5000 m3.
Costs for LH2 are based on invest for
production, liquefaction and storage.
source: BSH,
http://www.bsh.de/en/Marine_uses/Industry/CONTIS_maps/index.jsp
Offshore wind farms in German
EEZ of North Sea
A vision for a zero emission container feeder vessel | CLEAN BALTIC SEA SHIPPING MIDTERM
CONFERENCE 2012-09-19, Riga / Latvia | No. 10
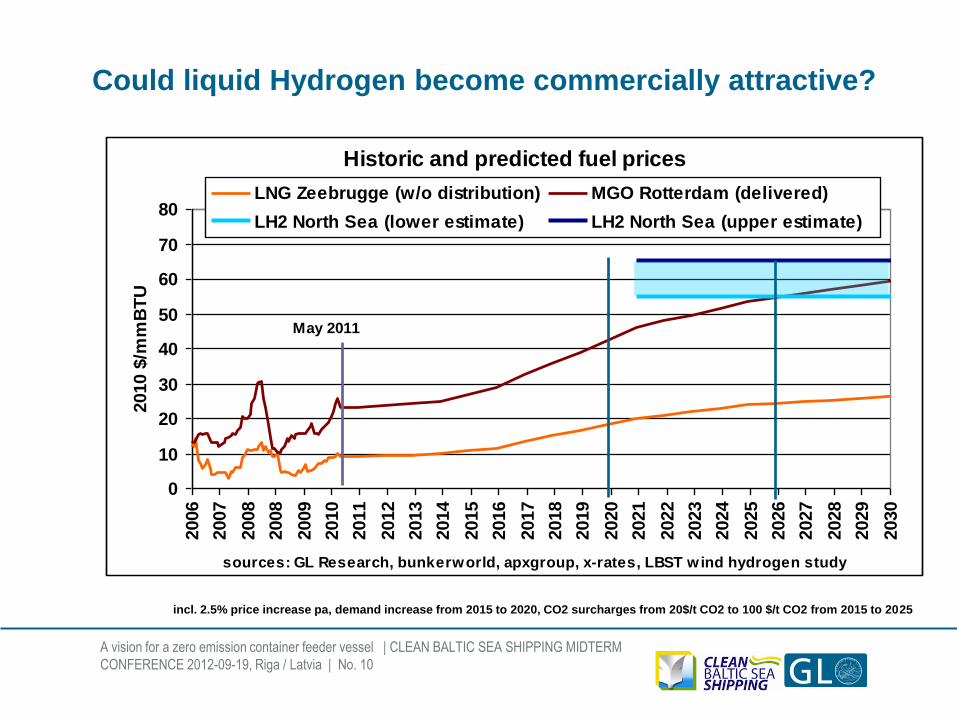
Could liquid Hydrogen become commercially attractive?
incl. 2.5% price increase pa, demand increase from 2015 to 2020, CO2 surcharges from 20$/t CO2 to 100 $/t CO2 from 2015 to 2025
Historic and predicted fuel prices
0
10
20
30
40
50
60
70
802006
2007
2008
2008
2009
2010
2011
2012
2013
2014
2015
2016
2017
2018
2019
2020
2021
2022
2023
2024
2025
2026
2027
2028
2029
2030
2010 $
/mm
BT
U
LNG Zeebrugge (w/o distribution) MGO Rotterdam (delivered)
LH2 North Sea (lower estimate) LH2 North Sea (upper estimate)
May 2011
sources: GL Research, bunkerworld, apxgroup, x-rates, LBST wind hydrogen study
A vision for a zero emission container feeder vessel | CLEAN BALTIC SEA SHIPPING MIDTERM
CONFERENCE 2012-09-19, Riga / Latvia | No. 12
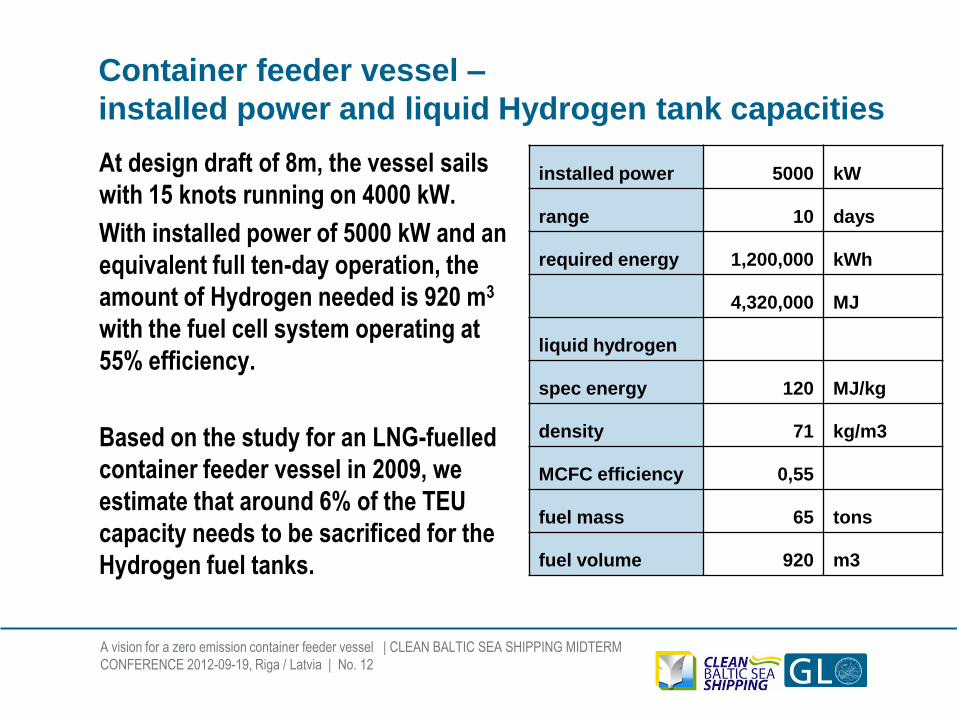
Container feeder vessel –
installed power and liquid Hydrogen tank capacities
At design draft of 8m, the vessel sails
with 15 knots running on 4000 kW.
With installed power of 5000 kW and an
equivalent full ten-day operation, the
amount of Hydrogen needed is 920 m3
with the fuel cell system operating at
55% efficiency.
Based on the study for an LNG-fuelled
container feeder vessel in 2009, we
estimate that around 6% of the TEU
capacity needs to be sacrificed for the
Hydrogen fuel tanks.
installed power 5000 kW
range 10 days
required energy 1,200,000 kWh
4,320,000 MJ
liquid hydrogen
spec energy 120 MJ/kg
density 71 kg/m3
MCFC efficiency 0,55
fuel mass 65 tons
fuel volume 920 m3
A vision for a zero emission container feeder vessel | CLEAN BALTIC SEA SHIPPING MIDTERM
CONFERENCE 2012-09-19, Riga / Latvia | No. 13
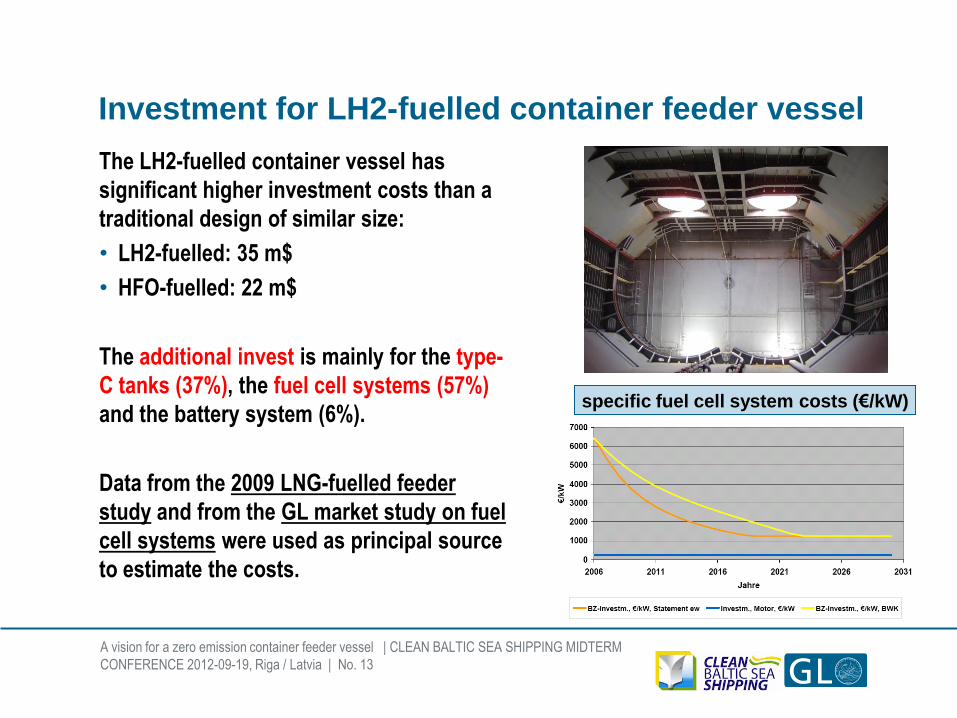
Investment for LH2-fuelled container feeder vessel
The LH2-fuelled container vessel has
significant higher investment costs than a
traditional design of similar size:
• LH2-fuelled: 35 m$
• HFO-fuelled: 22 m$
The additional invest is mainly for the type-
C tanks (37%), the fuel cell systems (57%)
and the battery system (6%).
Data from the 2009 LNG-fuelled feeder
study and from the GL market study on fuel
cell systems were used as principal source
to estimate the costs.
specific fuel cell system costs (€/kW)
A vision for a zero emission container feeder vessel | CLEAN BALTIC SEA SHIPPING MIDTERM
CONFERENCE 2012-09-19, Riga / Latvia | No. 14
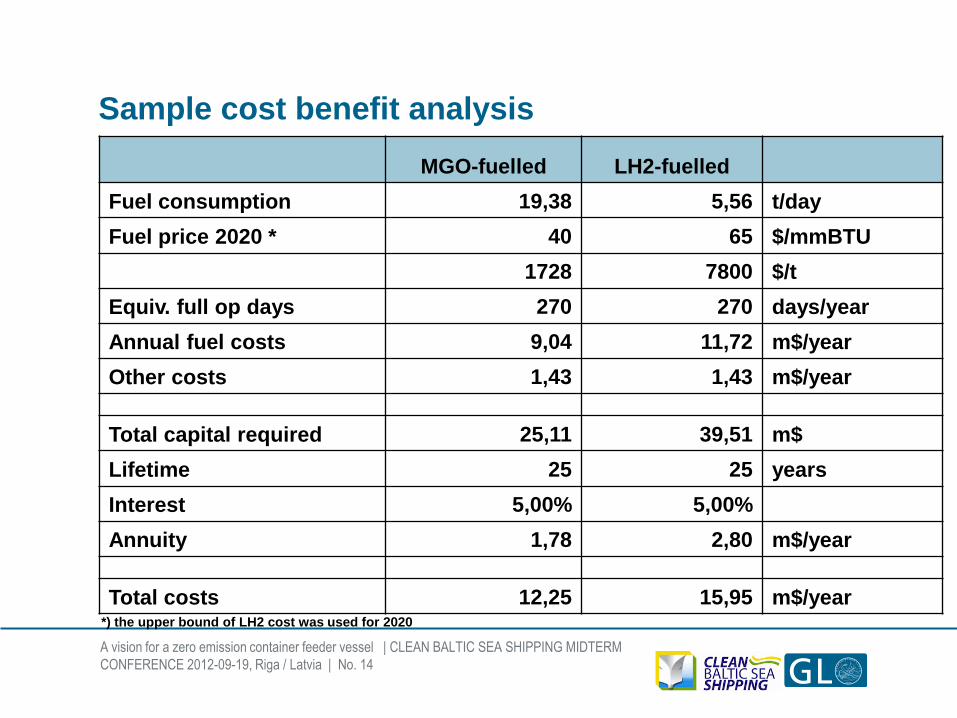
Sample cost benefit analysis
MGO-fuelled LH2-fuelled
Fuel consumption 19,38 5,56 t/day
Fuel price 2020 * 40 65 $/mmBTU
1728 7800 $/t
Equiv. full op days 270 270 days/year
Annual fuel costs 9,04 11,72 m$/year
Other costs 1,43 1,43 m$/year
Total capital required 25,11 39,51 m$
Lifetime 25 25 years
Interest 5,00% 5,00%
Annuity 1,78 2,80 m$/year
Total costs 12,25 15,95 m$/year *) the upper bound of LH2 cost was used for 2020
A vision for a zero emission container feeder vessel | CLEAN BALTIC SEA SHIPPING MIDTERM
CONFERENCE 2012-09-19, Riga / Latvia | No. 15
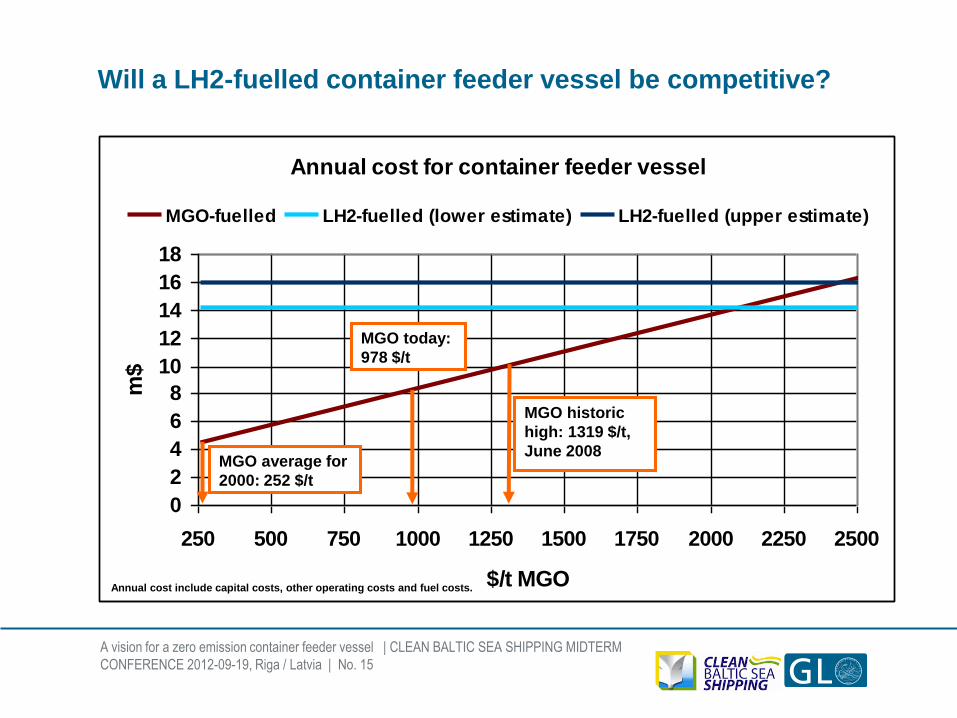
Annual cost for container feeder vessel
0
2
4
6
8
10
12
14
16
18
250 500 750 1000 1250 1500 1750 2000 2250 2500
$/t MGO
m$
MGO-fuelled LH2-fuelled (lower estimate) LH2-fuelled (upper estimate)
Will a LH2-fuelled container feeder vessel be competitive?
MGO historic
high: 1319 $/t,
June 2008
Annual cost include capital costs, other operating costs and fuel costs.
MGO average for
2000: 252 $/t
MGO today:
978 $/t
A vision for a zero emission container feeder vessel | CLEAN BALTIC SEA SHIPPING MIDTERM
CONFERENCE 2012-09-19, Riga / Latvia | No. 16
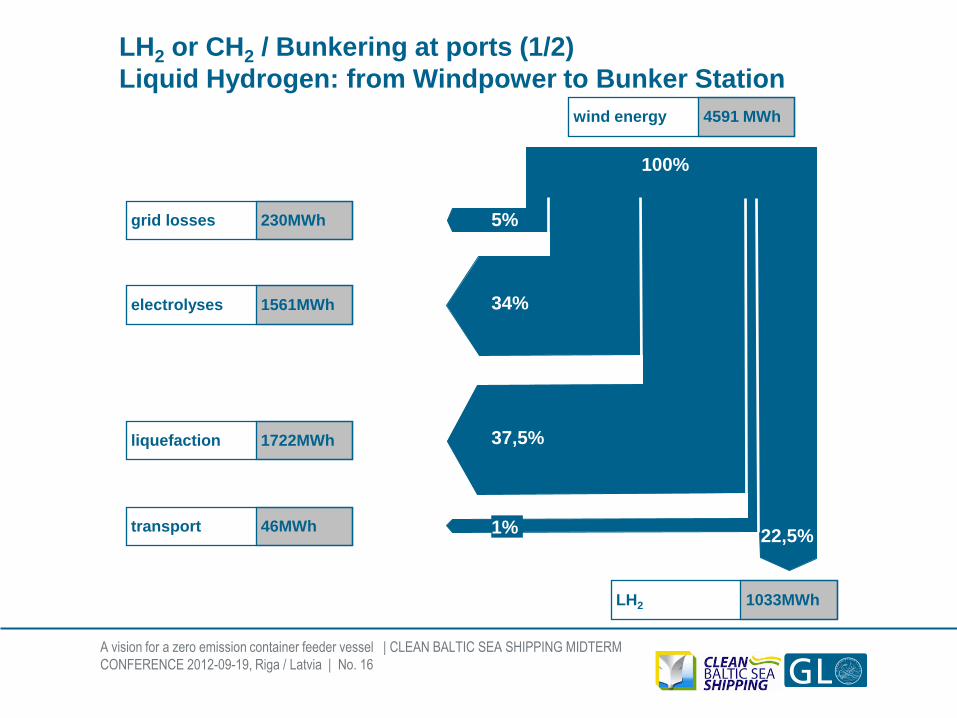
LH2 or CH2 / Bunkering at ports (1/2)
Liquid Hydrogen: from Windpower to Bunker Station
4591 MWh wind energy
230MWh grid losses
1561MWh electrolyses
1722MWh liquefaction
46MWh transport
1033MWh LH2
100%
5%
34%
37,5%
1% 22,5%
A vision for a zero emission container feeder vessel | CLEAN BALTIC SEA SHIPPING MIDTERM
CONFERENCE 2012-09-19, Riga / Latvia | No. 17
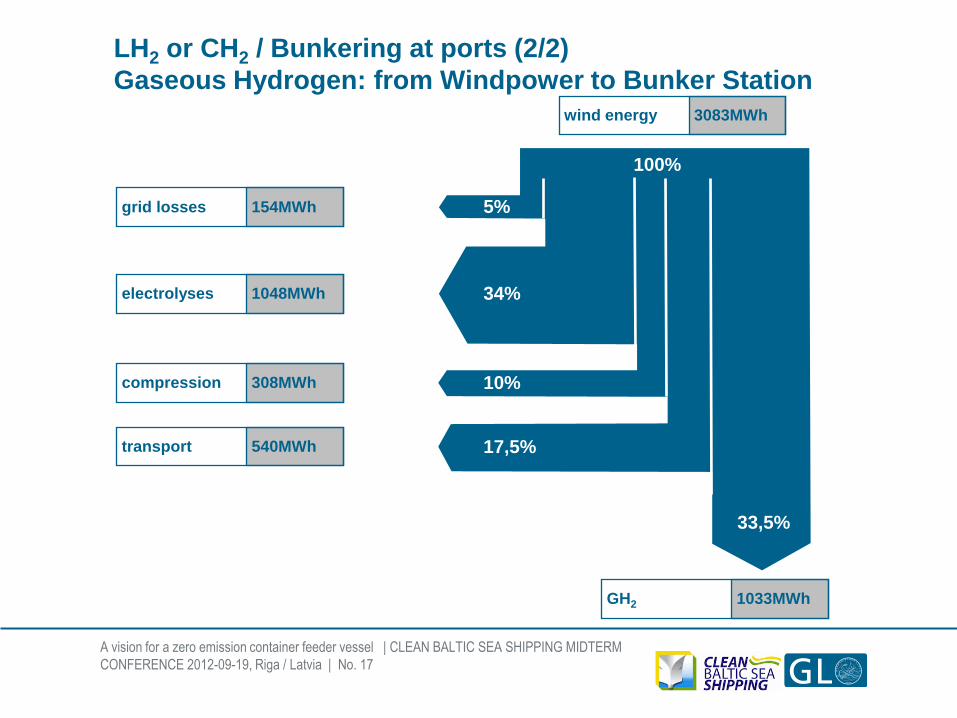
LH2 or CH2 / Bunkering at ports (2/2)
Gaseous Hydrogen: from Windpower to Bunker Station
3083MWh wind energy
154MWh grid losses
1048MWh electrolyses
308MWh compression
540MWh transport
1033MWh GH2
34%
10%
17,5%
33,5%
100%
5%
A vision for a zero emission container feeder vessel | CLEAN BALTIC SEA SHIPPING MIDTERM
CONFERENCE 2012-09-19, Riga / Latvia | No. 19
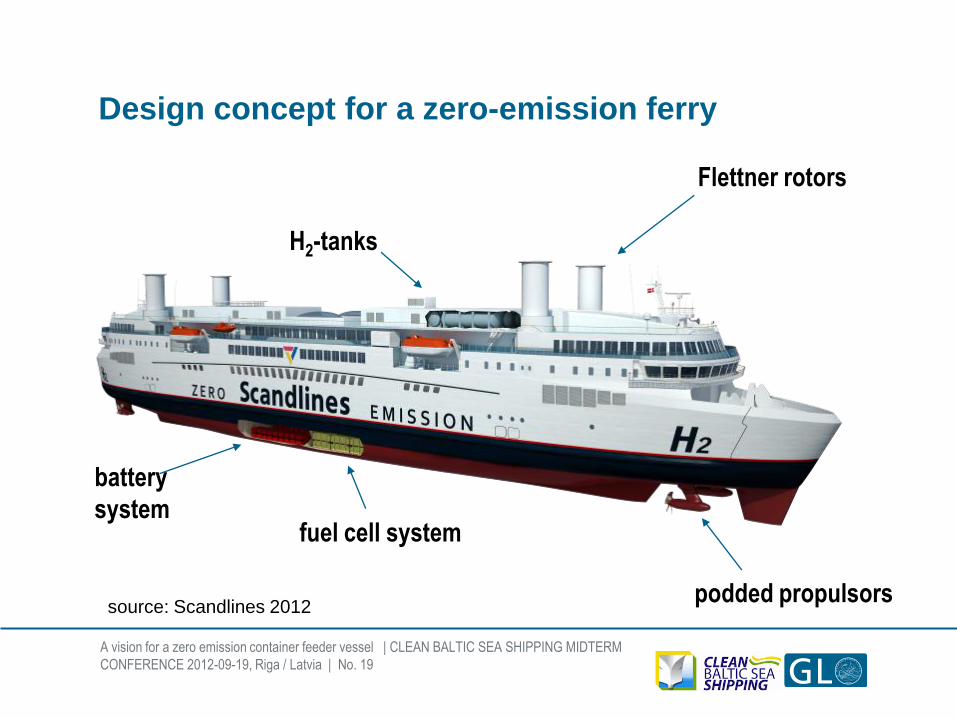
Design concept for a zero-emission ferry
battery
system fuel cell system
H2-tanks
Flettner rotors
podded propulsors source: Scandlines 2012
A vision for a zero emission container feeder vessel | CLEAN BALTIC SEA SHIPPING MIDTERM
CONFERENCE 2012-09-19, Riga / Latvia | No. 21
Conclusions
A vision for a zero-emission container
feeder vessel was created. The vessel
will run on liquid Hydrogen produced
by offshore wind farms’ surplus
energy.
The LH2-fuelled container feeder
vessel may become economically
attractive when MGO prices increase
beyond 2.000 $/t.
A design concept for a zero-emission
ferry was developed with Scandlines.
GL expects first dedicated zero-
emission ships on short-sea routes.