Embed Size (px)
Citation preview

Clean Energy Investment Trends, 2Q 2018 Wind investment in the U.S. spurs global clean energy in first half of year
July 9, 2018

1 July 9, 2018
Clean energy investment was $76.7 billion in the second quarter of 2018, up 8% year-on-year, the increase driven by stronger activity in the U.S. and, to some extent, Europe.
• Global investment in clean energy for the first 6 months of 2018 was $138.2 billion, with China and the U.S. accounting for 65% of the total.
• The first half of 2018 shows solar investment down 19% compared to the same period last year at $71.6 billion, with wind up 33% at $57.2 billion.
• U.S. wind investment stood out in the first half of 2018, reaching $17.5 billion, up by 121% on its figure in the same period last year.
• Chinese wind investment was resilient, rising 4% to $17.6 billion in 1H.
• Significant wind power investments included the $1.5 billion 731.5MW Borssele 3 and 4 offshore wind farm in Dutch waters, the $769 million 478MW Hale County onshore wind project in the U.S. and the $627 million 120MW Formosa 1 Miaoli project (the first offshore wind array to be financed in the sea off Taiwan).
• China invested $35.1 billion in solar in the first half of this year, down 29% from 1H 2017. This reflected a cooling-off in China’s solar boom, with the full extent of the government-ordered cutback to be manifest from the second half of the year onwards.
Wind investment in the U.S. spurs global clean energy in 1H 2018
Global New Investment in Clean Energy
$76.7bn Global clean energy investment in 2Q 2018
31% Increase in U.S. investment compared to 1H 2017

2 July 9, 2018
Contents
Quarterly Trends, New Investment 3
Quarterly Trends, Funds in Circulation 30
Top Deals 34
Annual Trends, New Investment 36
Clean Energy Stock Performance 56
Definitions and FAQs 60

3 July 9, 2018
Quarterly Trends, New InvestmentQuarterly trends since 1Q 2005

4 July 9, 2018
Global New Investment in Clean Energy 1Q 2005 – 2Q 2018
Quarterly Trends, New Investment
0
10
20
30
40
50
60
70
80
90
100
1Q 2Q 3Q 4Q 1Q 2Q 3Q 4Q 1Q 2Q 3Q 4Q 1Q 2Q 3Q 4Q 1Q 2Q 3Q 4Q 1Q 2Q 3Q 4Q 1Q 2Q 3Q 4Q 1Q 2Q 3Q 4Q 1Q 2Q 3Q 4Q 1Q 2Q 3Q 4Q 1Q 2Q 3Q 4Q 1Q 2Q 3Q 4Q 1Q 2Q 3Q 4Q 1Q 2Q
2005 2006 2007 2008 2009 2010 2011 2012 2013 2014 2015 2016 2017 '18
$bn
Four quarter running averageVersion WF18.04All values nominal
Source:Bloomberg NEF

5 July 9, 2018
Global New Investment in Clean Energy, by Region1Q 2005 – 2Q 2018
Quarterly Trends, New Investment
0
10
20
30
40
50
60
70
80
90
100
1Q 2Q 3Q 4Q 1Q 2Q 3Q 4Q 1Q 2Q 3Q 4Q 1Q 2Q 3Q 4Q 1Q 2Q 3Q 4Q 1Q 2Q 3Q 4Q 1Q 2Q 3Q 4Q 1Q 2Q 3Q 4Q 1Q 2Q 3Q 4Q 1Q 2Q 3Q 4Q 1Q 2Q 3Q 4Q 1Q 2Q 3Q 4Q 1Q 2Q 3Q 4Q 1Q 2Q
2005 2006 2007 2008 2009 2010 2011 2012 2013 2014 2015 2016 2017 '18
$bn
APAC EMEA AMERVersion WF18.04All values nominal
Source:Bloomberg NEF
Balance shifts from Europe as largest-investing region to Asia
as number one region

6 July 9, 2018
Global New Investment in Clean Energy, by Sector1Q 2005 – 2Q 2018
Quarterly Trends, New Investment
0
10
20
30
40
50
60
70
80
90
100
1Q 2Q 3Q 4Q 1Q 2Q 3Q 4Q 1Q 2Q 3Q 4Q 1Q 2Q 3Q 4Q 1Q 2Q 3Q 4Q 1Q 2Q 3Q 4Q 1Q 2Q 3Q 4Q 1Q 2Q 3Q 4Q 1Q 2Q 3Q 4Q 1Q 2Q 3Q 4Q 1Q 2Q 3Q 4Q 1Q 2Q 3Q 4Q 1Q 2Q 3Q 4Q 1Q 2Q
2005 2006 2007 2008 2009 2010 2011 2012 2013 2014 2015 2016 2017 '18
$bn
Solar Wind Other BiofuelsVersion WF18.04All values nominal
Source:Bloomberg NEF
Solar moves from third biggest sector in 2006, behind wind and biofuels, to the biggest
sector in most quarters by 2011

7 July 9, 2018
Global New Investment in Clean Energy, by Asset Class1Q 2005 – 2Q 2018
Quarterly Trends, New Investment
0
10
20
30
40
50
60
70
80
90
100
1Q 2Q 3Q 4Q 1Q 2Q 3Q 4Q 1Q 2Q 3Q 4Q 1Q 2Q 3Q 4Q 1Q 2Q 3Q 4Q 1Q 2Q 3Q 4Q 1Q 2Q 3Q 4Q 1Q 2Q 3Q 4Q 1Q 2Q 3Q 4Q 1Q 2Q 3Q 4Q 1Q 2Q 3Q 4Q 1Q 2Q 3Q 4Q 1Q 2Q 3Q 4Q 1Q 2Q
2005 2006 2007 2008 2009 2010 2011 2012 2013 2014 2015 2016 2017 '18
$bn
Asset finance* Small scale solar Public markets VC/PEVersion WF18.04All values nominal
Source:Bloomberg NEF
Dollar investment via asset finance and small-scale solar projects has been affected by sharp reductions in PV costs
8 July 9, 2018
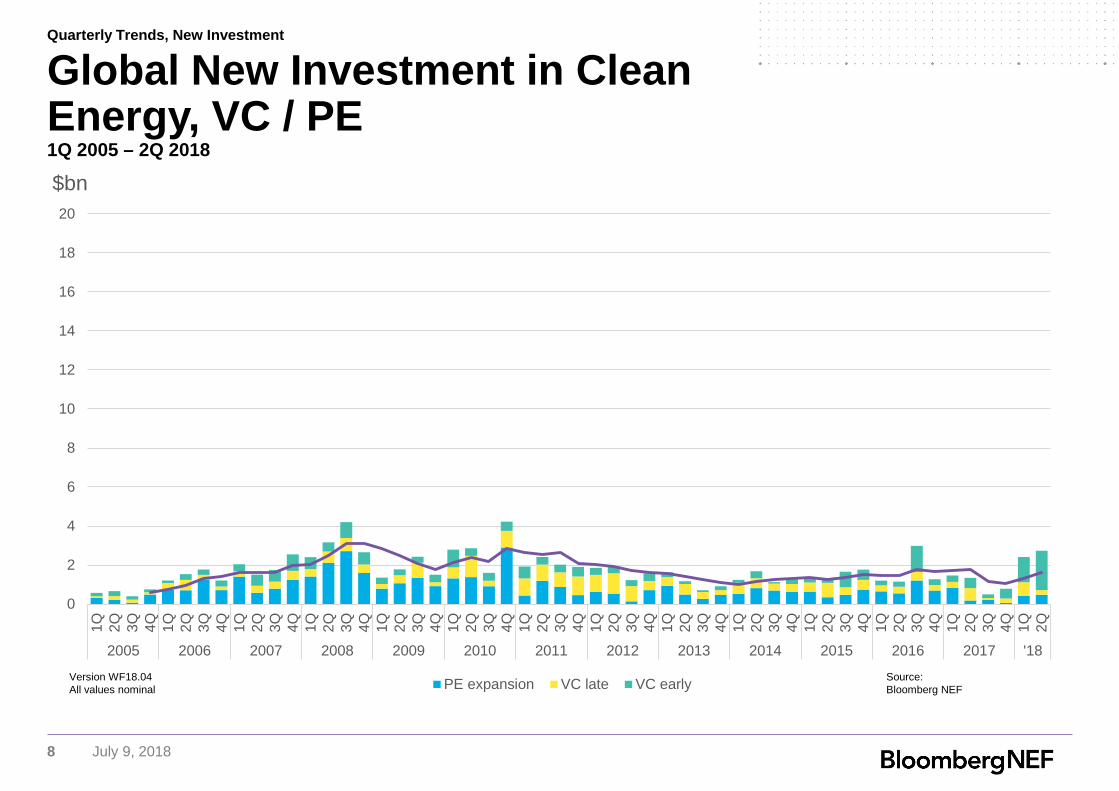
Global New Investment in Clean Energy, VC / PE1Q 2005 – 2Q 2018
Quarterly Trends, New Investment
0
2
4
6
8
10
12
14
16
18
20
1Q 2Q 3Q 4Q 1Q 2Q 3Q 4Q 1Q 2Q 3Q 4Q 1Q 2Q 3Q 4Q 1Q 2Q 3Q 4Q 1Q 2Q 3Q 4Q 1Q 2Q 3Q 4Q 1Q 2Q 3Q 4Q 1Q 2Q 3Q 4Q 1Q 2Q 3Q 4Q 1Q 2Q 3Q 4Q 1Q 2Q 3Q 4Q 1Q 2Q 3Q 4Q 1Q 2Q
2005 2006 2007 2008 2009 2010 2011 2012 2013 2014 2015 2016 2017 '18
$bn
PE expansion VC late VC earlyVersion WF18.04All values nominal
Source:Bloomberg NEF

9 July 9, 2018
Global New Investment in Clean Energy, Public Markets1Q 2005 – 2Q 2018
Quarterly Trends, New Investment
0
2
4
6
8
10
12
14
16
18
20
1Q 2Q 3Q 4Q 1Q 2Q 3Q 4Q 1Q 2Q 3Q 4Q 1Q 2Q 3Q 4Q 1Q 2Q 3Q 4Q 1Q 2Q 3Q 4Q 1Q 2Q 3Q 4Q 1Q 2Q 3Q 4Q 1Q 2Q 3Q 4Q 1Q 2Q 3Q 4Q 1Q 2Q 3Q 4Q 1Q 2Q 3Q 4Q 1Q 2Q 3Q 4Q 1Q 2Q
2005 2006 2007 2008 2009 2010 2011 2012 2013 2014 2015 2016 2017 '18
$bn
IPO Secondary & PIPE OTC Convertible & otherVersion WF18.04All values nominal
Source:Bloomberg NEF

10 July 9, 2018
New Investment in Clean Energy AMER1Q 2005 – 2Q 2018
Quarterly Trends, New Investment
0
5
10
15
20
25
30
35
40
45
50
1Q 2Q 3Q 4Q 1Q 2Q 3Q 4Q 1Q 2Q 3Q 4Q 1Q 2Q 3Q 4Q 1Q 2Q 3Q 4Q 1Q 2Q 3Q 4Q 1Q 2Q 3Q 4Q 1Q 2Q 3Q 4Q 1Q 2Q 3Q 4Q 1Q 2Q 3Q 4Q 1Q 2Q 3Q 4Q 1Q 2Q 3Q 4Q 1Q 2Q 3Q 4Q 1Q 2Q
2005 2006 2007 2008 2009 2010 2011 2012 2013 2014 2015 2016 2017 '18
$bn
Solar Wind OtherVersion WF18.04All values nominal
Source:Bloomberg NEF
Relatively steady regional trend disguises big variations in
investment levels in the US, Canada and Latin America

11 July 9, 2018
New Investment in Clean Energy EMEA1Q 2005 – 2Q 2018
Quarterly Trends, New Investment
0
5
10
15
20
25
30
35
40
45
50
1Q 2Q 3Q 4Q 1Q 2Q 3Q 4Q 1Q 2Q 3Q 4Q 1Q 2Q 3Q 4Q 1Q 2Q 3Q 4Q 1Q 2Q 3Q 4Q 1Q 2Q 3Q 4Q 1Q 2Q 3Q 4Q 1Q 2Q 3Q 4Q 1Q 2Q 3Q 4Q 1Q 2Q 3Q 4Q 1Q 2Q 3Q 4Q 1Q 2Q 3Q 4Q 1Q 2Q
2005 2006 2007 2008 2009 2010 2011 2012 2013 2014 2015 2016 2017 '18
$bn
Solar Wind OtherVersion WF18.04All values nominal
Source:Bloomberg NEF
Investment peaked at the time of the German and Italian solar
booms in 2010-11. More recently, Africa and the Middle East have started to account
for more big project financings

12 July 9, 2018
New Investment in Clean Energy APAC1Q 2005 – 1Q 2018
Quarterly Trends, New Investment
0
5
10
15
20
25
30
35
40
45
50
1Q 2Q 3Q 4Q 1Q 2Q 3Q 4Q 1Q 2Q 3Q 4Q 1Q 2Q 3Q 4Q 1Q 2Q 3Q 4Q 1Q 2Q 3Q 4Q 1Q 2Q 3Q 4Q 1Q 2Q 3Q 4Q 1Q 2Q 3Q 4Q 1Q 2Q 3Q 4Q 1Q 2Q 3Q 4Q 1Q 2Q 3Q 4Q 1Q 2Q 3Q 4Q 1Q 2Q
2005 2006 2007 2008 2009 2010 2011 2012 2013 2014 2015 2016 2017 '18
$bn
Solar Wind OtherVersion WF18.04All values nominal
Source:Bloomberg NEF

13 July 9, 2018
Will AMER break out of the $15 - $25bn range?
Will EMEA ever experience the highs of 2010 & 2011 again?
Will APAC continue to be the driver of green investment?
Comparing AMER, EMEA & APACQuarterly Trends, New Investment

14 July 9, 2018
New Investment in Clean Energy United States1Q 2005 – 2Q 2018
Quarterly Trends, New Investment
0
5
10
15
20
25
30
35
40
45
50
1Q 2Q 3Q 4Q 1Q 2Q 3Q 4Q 1Q 2Q 3Q 4Q 1Q 2Q 3Q 4Q 1Q 2Q 3Q 4Q 1Q 2Q 3Q 4Q 1Q 2Q 3Q 4Q 1Q 2Q 3Q 4Q 1Q 2Q 3Q 4Q 1Q 2Q 3Q 4Q 1Q 2Q 3Q 4Q 1Q 2Q 3Q 4Q 1Q 2Q 3Q 4Q 1Q 2Q
2005 2006 2007 2008 2009 2010 2011 2012 2013 2014 2015 2016 2017 '18
$bn
Four quarter running averageVersion WF18.04All values nominal
Source:Bloomberg NEF
High levels of investment in 2011 came on the back of spending under the American Recovery and Reinvestment Act, and a rush to build wind
projects in advance of what would have been the end of the Production Tax Credit in 2012.

15 July 9, 2018
New Investment in Clean Energy United States, by Sector1Q 2005 – 2Q 2018
Quarterly Trends, New Investment
0
5
10
15
20
25
30
35
40
45
50
1Q 2Q 3Q 4Q 1Q 2Q 3Q 4Q 1Q 2Q 3Q 4Q 1Q 2Q 3Q 4Q 1Q 2Q 3Q 4Q 1Q 2Q 3Q 4Q 1Q 2Q 3Q 4Q 1Q 2Q 3Q 4Q 1Q 2Q 3Q 4Q 1Q 2Q 3Q 4Q 1Q 2Q 3Q 4Q 1Q 2Q 3Q 4Q 1Q 2Q 3Q 4Q 1Q 2Q
2005 2006 2007 2008 2009 2010 2011 2012 2013 2014 2015 2016 2017 '18
$bn
Solar Wind OtherVersion WF18.04All values nominal
Source:Bloomberg NEF

16 July 9, 2018
New Investment in Clean Energy Europe1Q 2005 – 2Q 2018
Quarterly Trends, New Investment
0
5
10
15
20
25
30
35
40
45
50
1Q 2Q 3Q 4Q 1Q 2Q 3Q 4Q 1Q 2Q 3Q 4Q 1Q 2Q 3Q 4Q 1Q 2Q 3Q 4Q 1Q 2Q 3Q 4Q 1Q 2Q 3Q 4Q 1Q 2Q 3Q 4Q 1Q 2Q 3Q 4Q 1Q 2Q 3Q 4Q 1Q 2Q 3Q 4Q 1Q 2Q 3Q 4Q 1Q 2Q 3Q 4Q 1Q 2Q
2005 2006 2007 2008 2009 2010 2011 2012 2013 2014 2015 2016 2017 '18
$bn
Four quarter running averageVersion WF18.04All values nominal
Source:Bloomberg NEF

17 July 9, 2018
New Investment in Clean Energy Europe, by sector1Q 2005 – 2Q 2018
Quarterly Trends, New Investment
0
5
10
15
20
25
30
35
40
45
50
1Q 2Q 3Q 4Q 1Q 2Q 3Q 4Q 1Q 2Q 3Q 4Q 1Q 2Q 3Q 4Q 1Q 2Q 3Q 4Q 1Q 2Q 3Q 4Q 1Q 2Q 3Q 4Q 1Q 2Q 3Q 4Q 1Q 2Q 3Q 4Q 1Q 2Q 3Q 4Q 1Q 2Q 3Q 4Q 1Q 2Q 3Q 4Q 1Q 2Q 3Q 4Q 1Q 2Q
2005 2006 2007 2008 2009 2010 2011 2012 2013 2014 2015 2016 2017 '18
$bn
Solar Offshore Onshore OtherVersion WF18.04All values nominal
Source:Bloomberg NEF
A boom in offshore wind saw huge projects getting the go-ahead in both UK and German waters in 2015-16

18 July 9, 2018
New Investment in Clean Energy China1Q 2005 – 2Q 2018
Quarterly Trends, New Investment
0
5
10
15
20
25
30
35
40
45
50
1Q 2Q 3Q 4Q 1Q 2Q 3Q 4Q 1Q 2Q 3Q 4Q 1Q 2Q 3Q 4Q 1Q 2Q 3Q 4Q 1Q 2Q 3Q 4Q 1Q 2Q 3Q 4Q 1Q 2Q 3Q 4Q 1Q 2Q 3Q 4Q 1Q 2Q 3Q 4Q 1Q 2Q 3Q 4Q 1Q 2Q 3Q 4Q 1Q 2Q 3Q 4Q 1Q 2Q
2005 2006 2007 2008 2009 2010 2011 2012 2013 2014 2015 2016 2017 '18
$bn
Four quarter running averageVersion WF18.04All values nominal
Source:Bloomberg NEF

19 July 9, 2018
0
5
10
15
20
25
30
35
40
45
50
1Q 2Q 3Q 4Q 1Q 2Q 3Q 4Q 1Q 2Q 3Q 4Q 1Q 2Q 3Q 4Q 1Q 2Q 3Q 4Q 1Q 2Q 3Q 4Q 1Q 2Q 3Q 4Q 1Q 2Q 3Q 4Q 1Q 2Q 3Q 4Q 1Q 2Q 3Q 4Q 1Q 2Q 3Q 4Q 1Q 2Q 3Q 4Q 1Q 2Q 3Q 4Q 1Q 2Q
2005 2006 2007 2008 2009 2010 2011 2012 2013 2014 2015 2016 2017 '18
$bn
Solar Wind OtherVersion WF18.04All values nominal
Source:Bloomberg NEF
New Investment in Clean Energy China, by sector1Q 2005 – 2Q 2018
Quarterly Trends, New Investment

20 July 9, 2018
New Investment in Clean Energy Brazil1Q 2005 – 2Q 2018
Quarterly Trends, New Investment
0
2
4
6
8
10
12
14
16
18
20
1Q 2Q 3Q 4Q 1Q 2Q 3Q 4Q 1Q 2Q 3Q 4Q 1Q 2Q 3Q 4Q 1Q 2Q 3Q 4Q 1Q 2Q 3Q 4Q 1Q 2Q 3Q 4Q 1Q 2Q 3Q 4Q 1Q 2Q 3Q 4Q 1Q 2Q 3Q 4Q 1Q 2Q 3Q 4Q 1Q 2Q 3Q 4Q 1Q 2Q 3Q 4Q 1Q 2Q
2005 2006 2007 2008 2009 2010 2011 2012 2013 2014 2015 2016 2017 '18
$bn
Four quarter running averageVersion WF18.04All values nominal
Source:Bloomberg NEF
Brazil enjoyed a biofuels investment boom in 2007-08 and, later, a pick-up in wind farm development on the
back of auction wins

21 July 9, 2018
New Investment in Clean Energy Canada1Q 2005 – 2Q 2018
Quarterly Trends, New Investment
0
2
4
6
8
10
12
14
16
18
20
1Q 2Q 3Q 4Q 1Q 2Q 3Q 4Q 1Q 2Q 3Q 4Q 1Q 2Q 3Q 4Q 1Q 2Q 3Q 4Q 1Q 2Q 3Q 4Q 1Q 2Q 3Q 4Q 1Q 2Q 3Q 4Q 1Q 2Q 3Q 4Q 1Q 2Q 3Q 4Q 1Q 2Q 3Q 4Q 1Q 2Q 3Q 4Q 1Q 2Q 3Q 4Q 1Q 2Q
2005 2006 2007 2008 2009 2010 2011 2012 2013 2014 2015 2016 2017 '18
$bn
Four quarter running averageVersion WF18.04All values nominal
Source:Bloomberg NEF

22 July 9, 2018
New Investment in Clean Energy Mexico1Q 2005 – 2Q 2018
Quarterly Trends, New Investment
0
2
4
6
8
10
12
14
16
18
20
1Q 2Q 3Q 4Q 1Q 2Q 3Q 4Q 1Q 2Q 3Q 4Q 1Q 2Q 3Q 4Q 1Q 2Q 3Q 4Q 1Q 2Q 3Q 4Q 1Q 2Q 3Q 4Q 1Q 2Q 3Q 4Q 1Q 2Q 3Q 4Q 1Q 2Q 3Q 4Q 1Q 2Q 3Q 4Q 1Q 2Q 3Q 4Q 1Q 2Q 3Q 4Q 1Q 2Q
2005 2006 2007 2008 2009 2010 2011 2012 2013 2014 2015 2016 2017 '18
$bn
Four quarter running averageVersion WF18.04All values nominal
Source:Bloomberg NEF

23 July 9, 2018
New Investment in Clean Energy United Kingdom1Q 2005 – 2Q 2018
Quarterly Trends, New Investment
0
2
4
6
8
10
12
14
16
18
20
1Q 2Q 3Q 4Q 1Q 2Q 3Q 4Q 1Q 2Q 3Q 4Q 1Q 2Q 3Q 4Q 1Q 2Q 3Q 4Q 1Q 2Q 3Q 4Q 1Q 2Q 3Q 4Q 1Q 2Q 3Q 4Q 1Q 2Q 3Q 4Q 1Q 2Q 3Q 4Q 1Q 2Q 3Q 4Q 1Q 2Q 3Q 4Q 1Q 2Q 3Q 4Q 1Q 2Q
2005 2006 2007 2008 2009 2010 2011 2012 2013 2014 2015 2016 2017 '18
$bn
Four quarter running averageVersion WF18.04All values nominal
Source:Bloomberg NEF
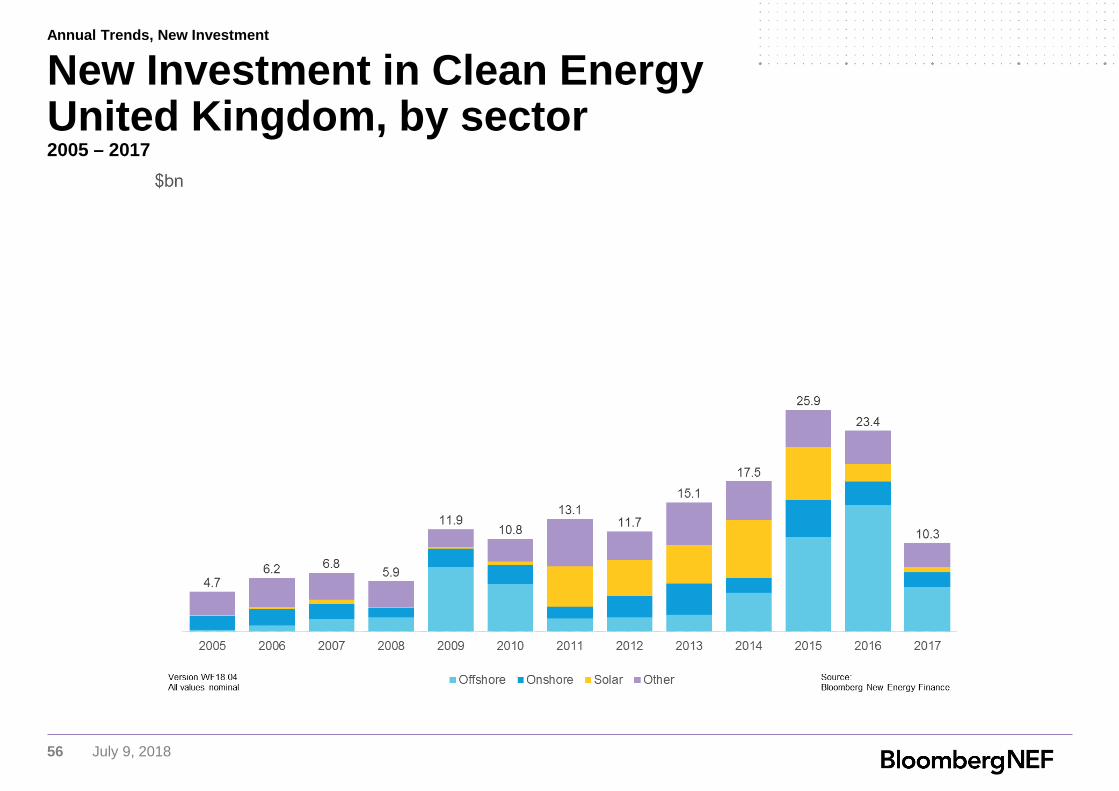
One of the world's largest non-hydro renewable energy financings, for the
1.2GW Hornsea offshore wind project, boosted UK investment in 1Q 2016

24 July 9, 2018
New Investment in Clean Energy Germany1Q 2005 – 2Q 2018
Quarterly Trends, New Investment
0
2
4
6
8
10
12
14
16
18
20
1Q 2Q 3Q 4Q 1Q 2Q 3Q 4Q 1Q 2Q 3Q 4Q 1Q 2Q 3Q 4Q 1Q 2Q 3Q 4Q 1Q 2Q 3Q 4Q 1Q 2Q 3Q 4Q 1Q 2Q 3Q 4Q 1Q 2Q 3Q 4Q 1Q 2Q 3Q 4Q 1Q 2Q 3Q 4Q 1Q 2Q 3Q 4Q 1Q 2Q 3Q 4Q 1Q 2Q
2005 2006 2007 2008 2009 2010 2011 2012 2013 2014 2015 2016 2017 '18
$bn
Four quarter running averageVersion WF18.04All values nominal
Source:Bloomberg NEF

25 July 9, 2018
New Investment in Clean Energy France1Q 2005 – 2Q 2018
Quarterly Trends, New Investment
0
2
4
6
8
10
12
14
16
18
20
1Q 2Q 3Q 4Q 1Q 2Q 3Q 4Q 1Q 2Q 3Q 4Q 1Q 2Q 3Q 4Q 1Q 2Q 3Q 4Q 1Q 2Q 3Q 4Q 1Q 2Q 3Q 4Q 1Q 2Q 3Q 4Q 1Q 2Q 3Q 4Q 1Q 2Q 3Q 4Q 1Q 2Q 3Q 4Q 1Q 2Q 3Q 4Q 1Q 2Q 3Q 4Q 1Q 2Q
2005 2006 2007 2008 2009 2010 2011 2012 2013 2014 2015 2016 2017 '18
$bn
Four quarter running averageVersion WF18.04All values nominal
Source:Bloomberg NEF
France has been a relatively steady market for wind and solar in recent
years, but far below the UK and Germany in terms of dollars invested

26 July 9, 2018
New Investment in Clean Energy Spain1Q 2005 – 2Q 2018
Quarterly Trends, New Investment
0
2
4
6
8
10
12
14
16
18
20
1Q 2Q 3Q 4Q 1Q 2Q 3Q 4Q 1Q 2Q 3Q 4Q 1Q 2Q 3Q 4Q 1Q 2Q 3Q 4Q 1Q 2Q 3Q 4Q 1Q 2Q 3Q 4Q 1Q 2Q 3Q 4Q 1Q 2Q 3Q 4Q 1Q 2Q 3Q 4Q 1Q 2Q 3Q 4Q 1Q 2Q 3Q 4Q 1Q 2Q 3Q 4Q 1Q 2Q
2005 2006 2007 2008 2009 2010 2011 2012 2013 2014 2015 2016 2017 '18
$bn
Four quarter running averageVersion WF18.04All values nominal
Source:Bloomberg NEF

27 July 9, 2018
New Investment in Clean Energy Italy1Q 2005 – 2Q 2018
Quarterly Trends, New Investment
0
2
4
6
8
10
12
14
16
18
20
1Q 2Q 3Q 4Q 1Q 2Q 3Q 4Q 1Q 2Q 3Q 4Q 1Q 2Q 3Q 4Q 1Q 2Q 3Q 4Q 1Q 2Q 3Q 4Q 1Q 2Q 3Q 4Q 1Q 2Q 3Q 4Q 1Q 2Q 3Q 4Q 1Q 2Q 3Q 4Q 1Q 2Q 3Q 4Q 1Q 2Q 3Q 4Q 1Q 2Q 3Q 4Q 1Q 2Q
2005 2006 2007 2008 2009 2010 2011 2012 2013 2014 2015 2016 2017 '18
$bn
Four quarter running averageVersion WF18.04All values nominal
Source:Bloomberg NEF
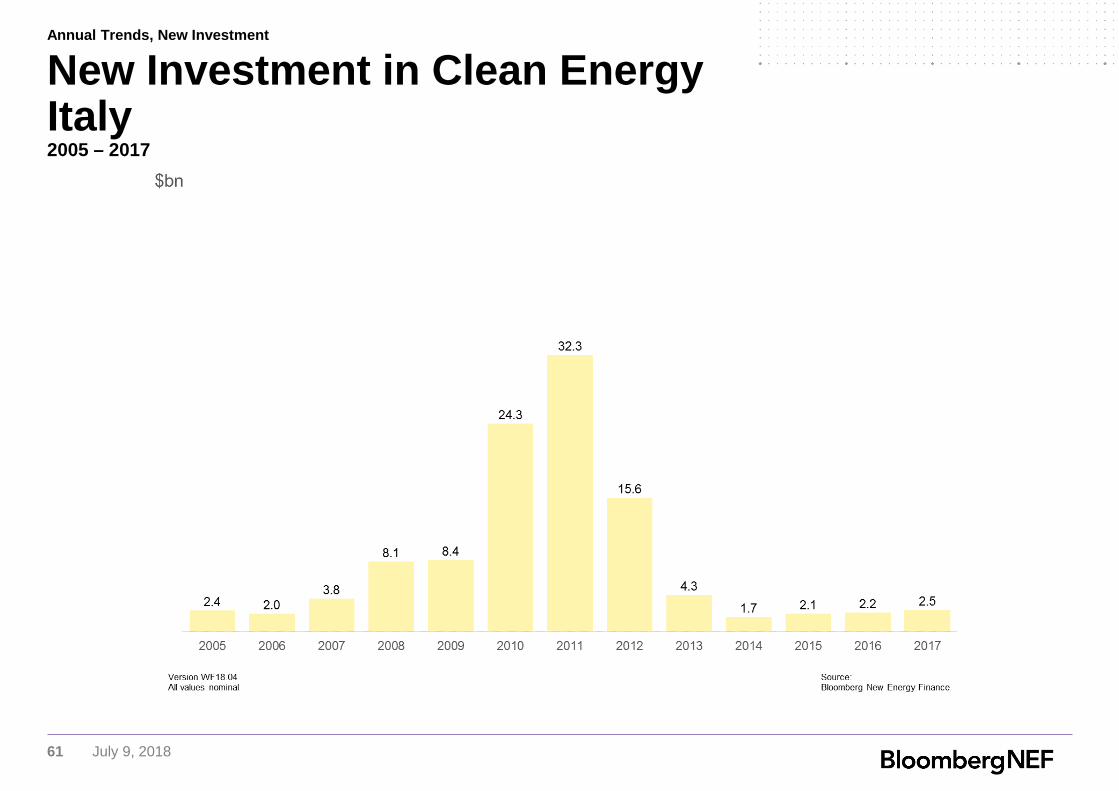
Retroactive cuts to solar feed-in tariffs have deterred clean energy
investment in Italy in recent years

28 July 9, 2018
New Investment in Clean Energy Morocco1Q 2005 – 2Q 2018
Quarterly Trends, New Investment
0
2
4
6
8
10
12
14
16
18
20
1Q 2Q 3Q 4Q 1Q 2Q 3Q 4Q 1Q 2Q 3Q 4Q 1Q 2Q 3Q 4Q 1Q 2Q 3Q 4Q 1Q 2Q 3Q 4Q 1Q 2Q 3Q 4Q 1Q 2Q 3Q 4Q 1Q 2Q 3Q 4Q 1Q 2Q 3Q 4Q 1Q 2Q 3Q 4Q 1Q 2Q 3Q 4Q 1Q 2Q 3Q 4Q 1Q 2Q
2005 2006 2007 2008 2009 2010 2011 2012 2013 2014 2015 2016 2017 '18
$bn
Four quarter running averageVersion WF18.04All values nominal
Source:Bloomberg NEF

29 July 9, 2018
New Investment in Clean Energy Japan1Q 2005 – 2Q 2018
Quarterly Trends, New Investment
0
2
4
6
8
10
12
14
16
18
20
1Q 2Q 3Q 4Q 1Q 2Q 3Q 4Q 1Q 2Q 3Q 4Q 1Q 2Q 3Q 4Q 1Q 2Q 3Q 4Q 1Q 2Q 3Q 4Q 1Q 2Q 3Q 4Q 1Q 2Q 3Q 4Q 1Q 2Q 3Q 4Q 1Q 2Q 3Q 4Q 1Q 2Q 3Q 4Q 1Q 2Q 3Q 4Q 1Q 2Q 3Q 4Q 1Q 2Q
2005 2006 2007 2008 2009 2010 2011 2012 2013 2014 2015 2016 2017 '18
$bn
Four quarter running averageVersion WF18.04All values nominal
Source:Bloomberg NEF

30 July 9, 2018
New Investment in Clean Energy India1Q 2005 – 2Q 2018
Quarterly Trends, New Investment
0
2
4
6
8
10
12
14
16
18
20
1Q 2Q 3Q 4Q 1Q 2Q 3Q 4Q 1Q 2Q 3Q 4Q 1Q 2Q 3Q 4Q 1Q 2Q 3Q 4Q 1Q 2Q 3Q 4Q 1Q 2Q 3Q 4Q 1Q 2Q 3Q 4Q 1Q 2Q 3Q 4Q 1Q 2Q 3Q 4Q 1Q 2Q 3Q 4Q 1Q 2Q 3Q 4Q 1Q 2Q 3Q 4Q 1Q 2Q
2005 2006 2007 2008 2009 2010 2011 2012 2013 2014 2015 2016 2017 '18
$bn
Four quarter running averageVersion WF18.04All values nominal
Source:Bloomberg NEF
Indian investment is likely to increase in the years ahead, as investors try to
meet the government's ambitious target of 100GW of solar by 2022

31 July 9, 2018
New Investment in Clean Energy Australia1Q 2005 – 2Q 2018
Quarterly Trends, New Investment
0
2
4
6
8
10
12
14
16
18
20
1Q 2Q 3Q 4Q 1Q 2Q 3Q 4Q 1Q 2Q 3Q 4Q 1Q 2Q 3Q 4Q 1Q 2Q 3Q 4Q 1Q 2Q 3Q 4Q 1Q 2Q 3Q 4Q 1Q 2Q 3Q 4Q 1Q 2Q 3Q 4Q 1Q 2Q 3Q 4Q 1Q 2Q 3Q 4Q 1Q 2Q 3Q 4Q 1Q 2Q 3Q 4Q 1Q 2Q
2005 2006 2007 2008 2009 2010 2011 2012 2013 2014 2015 2016 2017 '18
$bn
Four quarter running averageVersion WF18.04All values nominal
Source:Bloomberg NEF
Australia achieved record investment levels in 2017. However, that will likely mark a peak – investment will
taper over the coming years unless there is a significant change in government policy, see this note

32 July 9, 2018
New Investment in Clean Energy Vietnam1Q 2005 – 2Q 2018
Quarterly Trends, New Investment
0
2
4
6
8
10
12
14
16
18
20
1Q 2Q 3Q 4Q 1Q 2Q 3Q 4Q 1Q 2Q 3Q 4Q 1Q 2Q 3Q 4Q 1Q 2Q 3Q 4Q 1Q 2Q 3Q 4Q 1Q 2Q 3Q 4Q 1Q 2Q 3Q 4Q 1Q 2Q 3Q 4Q 1Q 2Q 3Q 4Q 1Q 2Q 3Q 4Q 1Q 2Q 3Q 4Q 1Q 2Q 3Q 4Q 1Q 2Q
2005 2006 2007 2008 2009 2010 2011 2012 2013 2014 2015 2016 2017 '18
$bn
Four quarter running averageVersion WF18.04All values nominal
Source:Bloomberg NEF

33 July 9, 2018
Quarterly Trends, Funds in CirculationQuarterly trends since 1Q 2005

34 July 9, 2018
Global Clean Energy, Funds in Circulation, by Region1Q 2005 – 2Q 2018
Quarterly Trends, Funds in Circulation
0
5
10
15
20
25
30
35
40
45
50
1Q 2Q 3Q 4Q 1Q 2Q 3Q 4Q 1Q 2Q 3Q 4Q 1Q 2Q 3Q 4Q 1Q 2Q 3Q 4Q 1Q 2Q 3Q 4Q 1Q 2Q 3Q 4Q 1Q 2Q 3Q 4Q 1Q 2Q 3Q 4Q 1Q 2Q 3Q 4Q 1Q 2Q 3Q 4Q 1Q 2Q 3Q 4Q 1Q 2Q 3Q 4Q 1Q 2Q
2005 2006 2007 2008 2009 2010 2011 2012 2013 2014 2015 2016 2017 '18
$bn
AMER EMEA APACVersion WF18.04All values nominal
Source:Bloomberg NEF
Funds in circulation is secondary investment in clean energy where existing assets and
companies are bought and sold. For instance, the refinancing of renewable energy assets, public
market investor exits, private equity buy-outs and mergers and acquisitions

35 July 9, 2018
Global Clean Energy, Funds in Circulation, by Sector1Q 2005 – 2Q 2018
Quarterly Trends, Funds in Circulation
0
5
10
15
20
25
30
35
40
45
50
1Q 2Q 3Q 4Q 1Q 2Q 3Q 4Q 1Q 2Q 3Q 4Q 1Q 2Q 3Q 4Q 1Q 2Q 3Q 4Q 1Q 2Q 3Q 4Q 1Q 2Q 3Q 4Q 1Q 2Q 3Q 4Q 1Q 2Q 3Q 4Q 1Q 2Q 3Q 4Q 1Q 2Q 3Q 4Q 1Q 2Q 3Q 4Q 1Q 2Q 3Q 4Q 1Q 2Q
2005 2006 2007 2008 2009 2010 2011 2012 2013 2014 2015 2016 2017 '18
$bn
Solar Wind Other BiofuelsVersion WF18.04All values nominal
Source:Bloomberg NEF
36 July 9, 2018
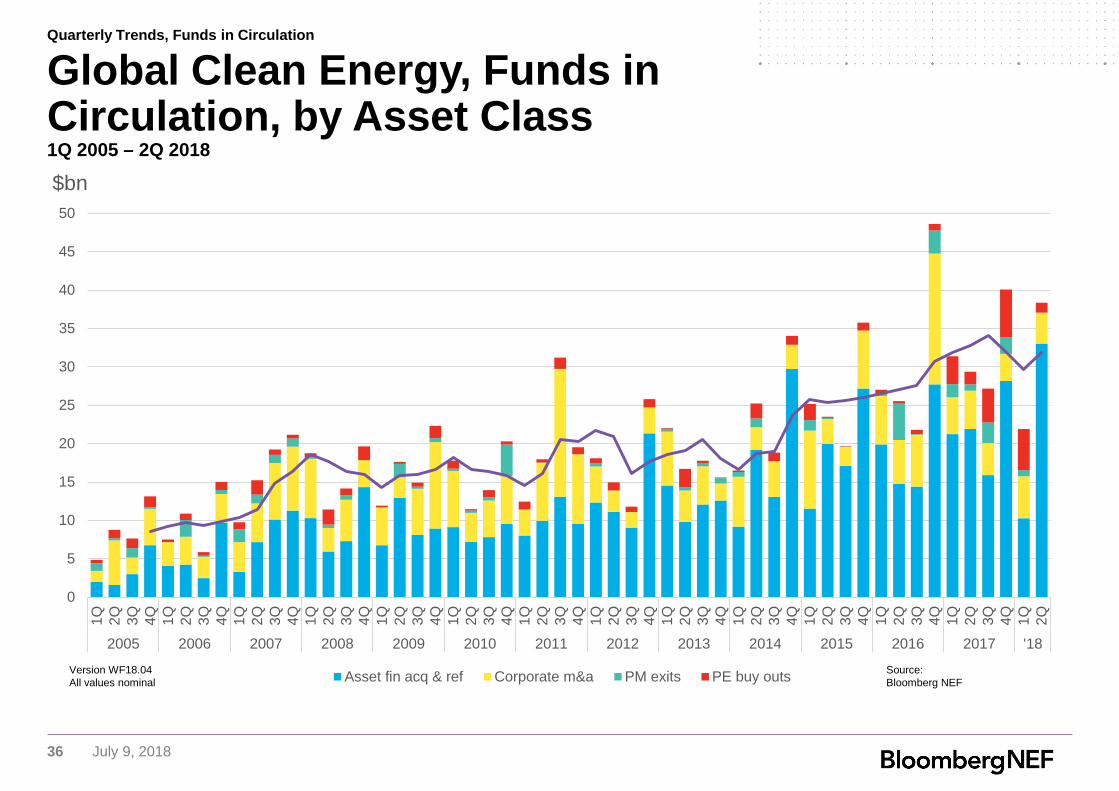
Global Clean Energy, Funds in Circulation, by Asset Class1Q 2005 – 2Q 2018
Quarterly Trends, Funds in Circulation
0
5
10
15
20
25
30
35
40
45
50
1Q 2Q 3Q 4Q 1Q 2Q 3Q 4Q 1Q 2Q 3Q 4Q 1Q 2Q 3Q 4Q 1Q 2Q 3Q 4Q 1Q 2Q 3Q 4Q 1Q 2Q 3Q 4Q 1Q 2Q 3Q 4Q 1Q 2Q 3Q 4Q 1Q 2Q 3Q 4Q 1Q 2Q 3Q 4Q 1Q 2Q 3Q 4Q 1Q 2Q 3Q 4Q 1Q 2Q
2005 2006 2007 2008 2009 2010 2011 2012 2013 2014 2015 2016 2017 '18
$bn
Asset fin acq & ref Corporate m&a PM exits PE buy outsVersion WF18.04All values nominal
Source:Bloomberg NEF
37 July 9, 2018
Top DealsTop Quarterly Deals for 2Q 2018

38 July 9, 2018
Project Name Country Sector Type of Transaction Capacity Value
Borssele III & IV Offshore Wind Farm Netherlands Wind Debt 731.5MW $1,659m
EIG Atacama 1 STEG Plant Chile Solar Debt 110MW $881m
Hale County Wind Farm U.S. Wind Equity 478MW $769m
Formosa I Miaoli Offshore Wind Farm Taiwan Wind Debt 120MW $627m
Huanghe Hainan Gonghe Wind Farm China Wind Equity 450MW na
Geronimo Crocker Wind Farm U.S. Wind Equity 400MW na
Top Asset Finance Deals2Q 2018
Top Deals

39 July 9, 2018
Organisation Country Sector Type of Transaction Value
Youxia Motors China Electrified Transport VC - Series B / Second round $795m
Future Mobility Corporation China Electrified Transport VC - Series B / Second round $500m
Wunder U.S. Solar VC - Series B / Second round $112m
Proterra U.S. Electrified Transport PE - Expansion capital $100m
Top Venture Capital / Private Equity Deals2Q 2018
Top Deals

40 July 9, 2018
Organisation Stock Exchange Sector Type of Transaction New Equity Raised
Contemporary Amperex Technology Shenzhen Stock Exchange Electrified Transport IPO $852.5m
TerraForm Power NASDAQ Wind PIPE $650m
Transalta Renewables Toronto Stock Exchange Wind Secondary $112.7m
Daqo New Energy New York Stock Exchange Wind Secondary $110m
Top Public Market Deals2Q 2018
Top Deals

41 July 9, 2018
Annual Trends, New InvestmentAnnual trends since 2005

42 July 9, 2018
Global New Investment in Clean Energy2005 – 2017
Annual Trends, New Investment

43 July 9, 2018
Global New Investment in Clean Energy by Region2005 – 2017
Annual Trends, New Investment

44 July 9, 2018
Global New Investment in Clean Energy by Sector2005 – 2017
Annual Trends, New Investment

45 July 9, 2018
Global New Investment in Clean Energy by Asset Class2005 – 2017
Annual Trends, New Investment

46 July 9, 2018
New Investment in Clean Energy United States2005 – 2017
Annual Trends, New Investment

47 July 9, 2018
New Investment in Clean Energy United States, by sector2005 – 2017
Annual Trends, New Investment
48 July 9, 2018
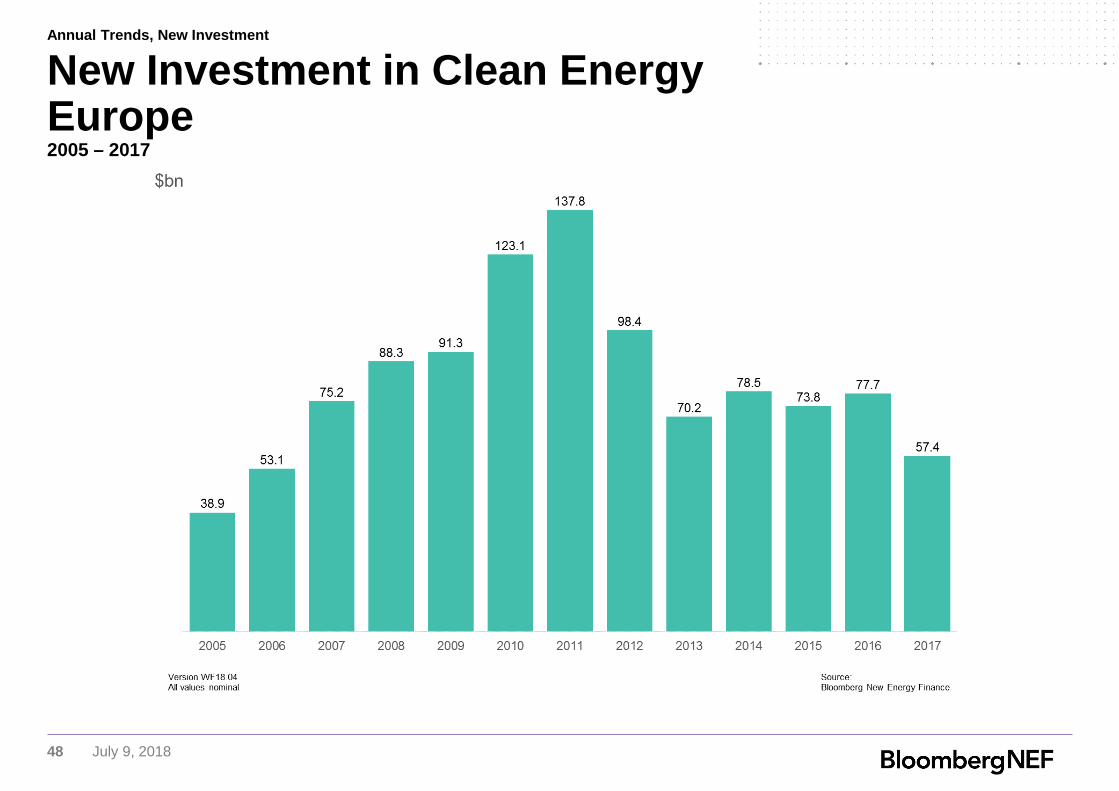
New Investment in Clean Energy Europe2005 – 2017
Annual Trends, New Investment

49 July 9, 2018
New Investment in Clean Energy Europe2005 – 2017
Annual Trends, New Investment

50 July 9, 2018
New Investment in Clean Energy China2005 – 2017
Annual Trends, New Investment

51 July 9, 2018
New Investment in Clean Energy China, by sector2005 – 2017
Annual Trends, New Investment

52 July 9, 2018
New Investment in Clean Energy Brazil2005 – 2017
Annual Trends, New Investment

53 July 9, 2018
New Investment in Clean Energy Canada2005 – 2017
Annual Trends, New Investment

54 July 9, 2018
New Investment in Clean Energy Mexico2005 – 2017
Annual Trends, New Investment
55 July 9, 2018
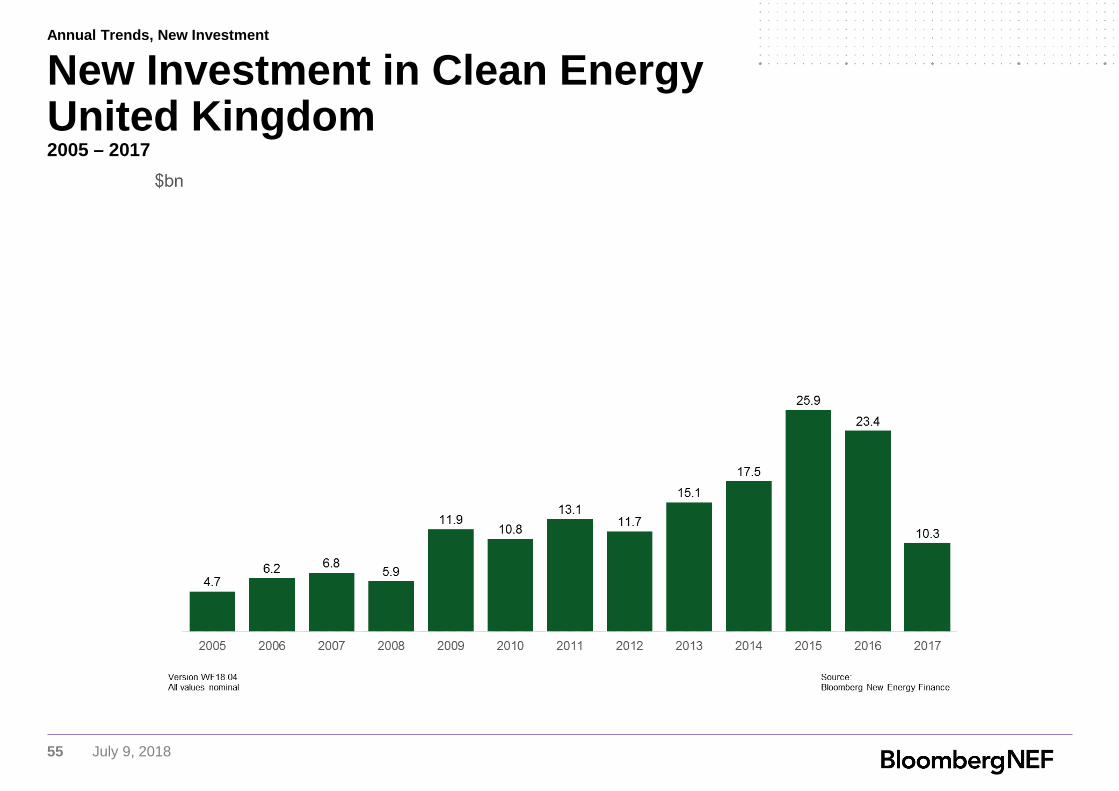
New Investment in Clean Energy United Kingdom2005 – 2017
Annual Trends, New Investment
56 July 9, 2018
New Investment in Clean Energy United Kingdom, by sector2005 – 2017
Annual Trends, New Investment
57 July 9, 2018
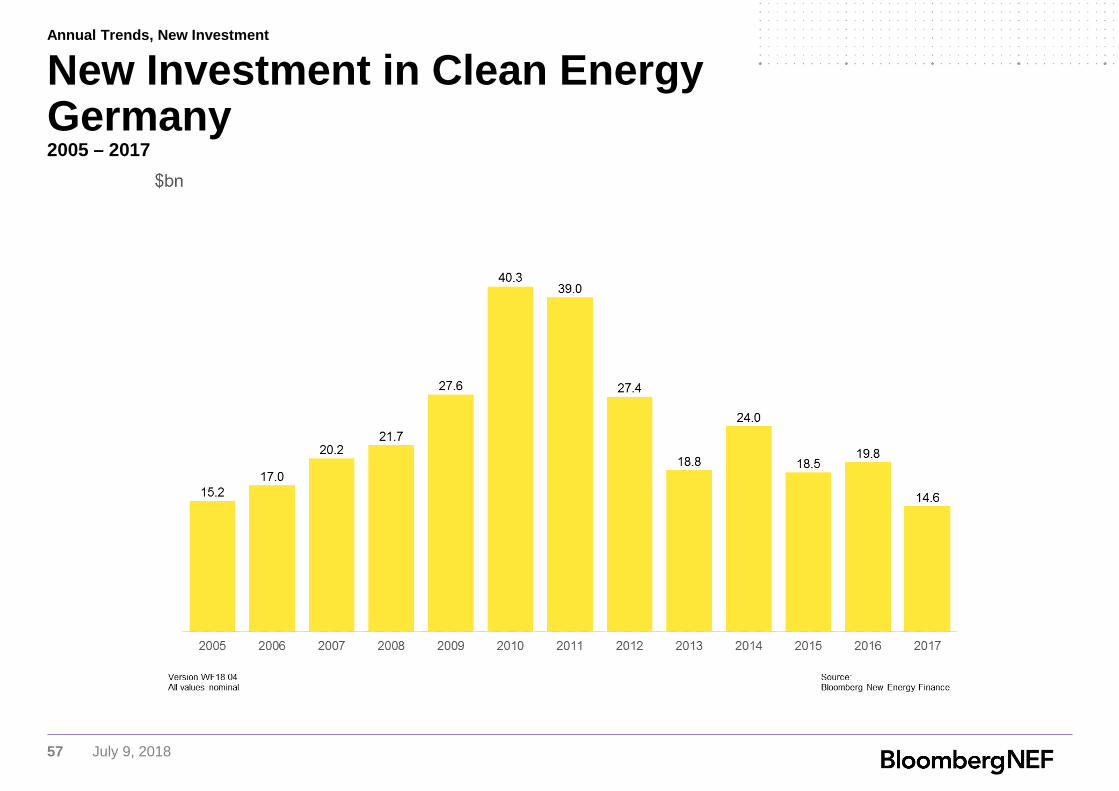
New Investment in Clean Energy Germany2005 – 2017
Annual Trends, New Investment

58 July 9, 2018
New Investment in Clean Energy Germany, by sector2005 – 2017
Annual Trends, New Investment
Onshore and offshore wind have dominated German investment since
the end of the solar boom in 2012

59 July 9, 2018
New Investment in Clean Energy France2005 – 2017
Annual Trends, New Investment

60 July 9, 2018
New Investment in Clean Energy Spain2005 – 2017
Annual Trends, New Investment
61 July 9, 2018
New Investment in Clean Energy Italy2005 – 2017
Annual Trends, New Investment

62 July 9, 2018
New Investment in Clean Energy Japan2005 – 2017
Annual Trends, New Investment

63 July 9, 2018
New Investment in Clean Energy Japan, by sector2005 – 2017
Annual Trends, New Investment

64 July 9, 2018
New Investment in Clean Energy India2005 – 2017
Annual Trends, New Investment

65 July 9, 2018
New Investment in Clean Energy Australia2005 – 2017
Annual Trends, New Investment

66 July 9, 2018
Clean Energy Stock PerformanceClean energy and the stock market

67 July 9, 2018
NEX vs NASDAQ & S&P 5002005 – 2018 YTD
Clean Energy Stock Performance
50
100
150
200
250
300
350
400
Jan 05 Jan 06 Jan 07 Jan 08 Jan 09 Jan 10 Jan 11 Jan 12 Jan 13 Jan 14 Jan 15 Jan 16 Jan 17 Jan 18
NEX NASDAQ S&P 500Source: Bloomberg New Energy Finance
Values as of July 4, 2018, all indexes rebased to 100 on Jan 1, 2005
The WilderHill New Energy Global Innovation Index (NEX) is a modified dollar-weighted index of publicly traded companies active in renewable and low-carbon energy, and which stand to benefit from responses to climate change and energy security concerns. The majority of index members are quoted outside the US.

68 July 9, 2018
NEX vs NASDAQ & S&P 5002012 – 2018 YTD
Clean Energy Stock Performance
50
100
150
200
250
300
350
Jan 12 Jul 12 Jan 13 Jul 13 Jan 14 Jul 14 Jan 15 Jul 15 Jan 16 Jul 16 Jan 17 Jul 17 Jan 18
NEX NASDAQ S&P 500Source: Bloomberg New Energy Finance
Values as of July 4, 2018, all indexes rebased to 100 on Jan 1, 2012

69 July 9, 2018
NEX vs NASDAQ & S&P 5002015 – 2018 YTD
Clean Energy Stock Performance
50
70
90
110
130
150
170
190
Jan 15 Jul 15 Jan 16 Jul 16 Jan 17 Jul 17 Jan 18
NEX NASDAQ S&P 500Source: Bloomberg New Energy Finance
Values as of July 4, 2018, all indexes rebased to 100 on Jan 1, 2015
70 July 9, 2018
Definitions and FAQsHow Bloomberg New Energy Finance defines clean energy

71 July 9, 2018
+ 2.8
+ 22.1+ 14.5 + 1.3
+ 8.7 $49.4bn - 3.1
+ 216.1
+ 21.6
+ 49.4 $333.5bn
+ 127.9 $461.4bn
VC Corp RD&D Gov R&D PE Publicmarkets new
equity
Totalcompany
investment
Re-investedeq.
Renewableenergy AF
Digital energy& storage AF
Small-scalesolar
Totalinvestment
M&A/buy-outsetc.
Totaltransactions
$bn
Version WF18.04 Source: Bloomberg NEF
Definitions2017 Clean Energy Investment Types and Flows
This chart shows the full range of investment in clean energy by asset class. It runs from the early
‘tech’ stage fund raisings and R&D on the left, through to the roll-out phase of new-build asset finance (AF) in the middle. It finishes with total
secondary market, non-new investment including corporate M&A, private equity buy-outs, investor
exits and asset refinancing and acquisitions.
Asset and company mergers, acquisitions, refinancing, buy-outs etc.
Projects
Technology development
Equipment manufacturing/ scale-up
Definitions and FAQs

72 July 9, 2018
Venture capital and private equity (VCPE)Early and late stage venture capital funding rounds of pure play clean energy companies as well as funds raised privately for the purposes of expansion.
Public markets (PM)Funds raised by publicly quoted or OTC quoted pure play clean energy companies on the capital markets. This may be through IPOs or follow-on offerings like secondary offerings, private investment in public equity or PIPEs, convertibles etc.
Asset financeThe new build financing of renewable energy generating projects as well as smart metering and energy storage projects - smart metering and energy storage investment are only reported annually. Renewable energy generating projects includes both electricity generating and biofuels producing assets. Projects may be financed off the owner's balance sheet, or through financing mechanisms such as project finance, syndicated equity from institutional investors, or project bonds underwritten by banks.
Re-invested equityIsolates values for balance sheet-financed project investments by companies who have raised money privately or publicly over the past 12 months. The purpose of this category is to prevent double counting of money raised publicly or privately that has been invested in clean energy assets.
Small scale solar Given the technical limitations in tracking small-scale solar projects, BNEF's asset finance database excludes projects below roughly 1MW. Unlike utility scale asset investment, small-scale solar investment is based on top-down analyst estimates.
Government r&dGovernment r&d figures are sourced from the IEA, IMF, OECD, and various government agencies.
Corporate r&dThe Bloomberg Terminal is used to source corporate r&d figures for key quoted companies in all clean energy sectors.
DefinitionsAsset classes
Definitions and FAQs

73 July 9, 2018
WindElectricity generation using wind turbines. Included in this sector, are players across the entire value chain of both onshore and offshore developments. From manufacturers of turbines, components and subassemblies to developers, generators, utilities and engineering firm.
SolarAll technologies which capture energy directly from the sun. These include production of electricity using semiconductor-based photovoltaic (pv) materials, use of concentrated sunlight to heat fluids that drive power generation equipment (solar thermal), and passive methods which use sunlight to heat water. Whilst company level investment of passive methods is recorded, investment in passive projects is not.
BiofuelsLiquid transportation fuels including biodiesel and bioethanol. These can be derived from a range of biomass sources, including sugar cane, rape seed, soybean oil or non-food cellulosic feedstock. Our database excludes producers of base biomass, but includes suppliers of everything from the processing technologies and equipment, through the logistics of distribution, to manufacturers of energy systems which are specially adapted for the use of biofuels and products, and the services on which they depend.
Biomass & wasteElectricity and/or heat produced with bio-based feedstocks, typically through incineration but also through more advanced processes like gasification or anaerobic digestion. This sector also includes waste-to-energy which includes energy produced through landfill gas projects and incineration of municipal and industrial waste.
Energy smart technologiesThis sector covers technologies like digital energy, smart grids, power storage, hydrogen and fuel cells, advanced transportation and energy efficiency on both the demand and supply side.
Other renewablesIncludes small hydro - hydro projects with capacities smaller or equal to 50MW; geothermal - extraction of useful power from heat stored in the earth; marine - the extraction of tidal, wave and thermal energy from the ocean.
DefinitionsSectors
Definitions and FAQs
74 July 9, 2018
Other low carbon tech / servicesThis sector covers clean energy service companies such as consultants, government agencies and policy makers, NGOs, financial serviceproviders, investors, and clean energy information providers (such as ourselves). It also covers the corporate activity of organizations across the carbon market value chains.
DefinitionsSectors
Definitions and FAQs

75 July 9, 2018
Q1: Why is there a difference between the sum of the quarterly figures and the annual figures?Quarterly figures do not include certain asset classes which we only produce annually. These asset classes are corporate and government r&dand asset finance for energy smart technologies, in other words, smart meters and energy storage investment
Q2: Which countries are included in Europe?Europe includes all 28 EU countries, and non-EU countries like Switzerland, Norway, Turkey and Russia. The majority of clean energy investment stems from the EU though
FAQsDefinitions and FAQs

76 July 9, 2018
Copyright and disclaimer
The Bloomberg NEF ("BNEF"), service/information is derived from selected public sources. Bloomberg Finance L.P. and its affiliates, in providing the service/information, believe that the information it uses comes from reliable sources, but do not guarantee the accuracy or completeness of this information, which is subject to change without notice, and nothing in this document shall be construed as such a guarantee. The statements in this service/document reflect the current judgment of the authors of the relevant articles or features, and do not necessarily reflect the opinion of Bloomberg Finance L.P., Bloomberg L.P. or any of their affiliates (“Bloomberg”). Bloomberg disclaims any liability arising from use of this document, its contents and/or this service. Nothing herein shall constitute or be construed as an offering of financial instruments or as investment advice or recommendations by Bloomberg of an investment or other strategy (e.g., whether or not to “buy”, “sell”, or “hold” an investment). The information available through this service is not based on consideration of a subscriber’s individual circumstances and should not be considered as information sufficient upon which to base an investment decision. You should determine on your own whether you agree with the content. This service should not be construed as tax or accounting advice or as a service designed to facilitate any subscriber’s compliance with its tax, accounting or other legal obligations. Employees involved in this service may hold positions in the companies mentioned in the services/information.
The data included in these materials are for illustrative purposes only. The BLOOMBERG TERMINAL service and Bloomberg data products (the “Services”) are owned and distributed by Bloomberg Finance L.P. (“BFLP”) except that Bloomberg L.P. and its subsidiaries (“BLP”) distribute these products in Argentina, Australia and certain jurisdictions in the Pacific islands, Bermuda, China, India, Japan, Korea and New Zealand. BLP provides BFLP with global marketing and operational support. Certain features, functions, products and services are available only to sophisticated investors and only where permitted. BFLP, BLP and their affiliates do not guarantee the accuracy of prices or other information in the Services. Nothing in the Services shall constitute or be construed as an offering of financial instruments by BFLP, BLP or their affiliates, or as investment advice or recommendations by BFLP, BLP or their affiliates of an investment strategy or whether or not to “buy”, “sell” or “hold” an investment. Information available via the Services should not be considered as information sufficient upon which to base an investment decision. The following are trademarks and service marks of BFLP, a Delaware limited partnership, or its subsidiaries: BLOOMBERG, BLOOMBERG ANYWHERE,BLOOMBERG MARKETS, BLOOMBERG NEWS, BLOOMBERG PROFESSIONAL, BLOOMBERG TERMINAL and BLOOMBERG.COM. Absence of any trademark or service mark from this list does not waive Bloomberg's intellectual property rights in that that name, mark or logo. All rights reserved. © 2018 Bloomberg.

Coverage.
Clean energyAdvanced transportCommoditiesDigital industry
Bloomberg NEF (BNEF) is a leading provider of primary research on clean energy, advanced transport, digital industry, innovative materials, and commodities.
BNEF’s global team leverages the world’s most sophisticated data sets to create clear perspectives and in-depth forecasts that frame the financial, economic and policy implications of industry-transforming trends and technologies.
BNEF research and analysis is accessible via web and mobile platforms, as well as on the Bloomberg Terminal.
Client enquiries:Bloomberg Terminal: press <Help> key twiceEmail: [email protected]
Learn more: about.bnef.com | @BloombergNEF