Embed Size (px)
Citation preview

The FactsThe Facts
Cleaning UpAir Pollution
fromAmerica’s Power Plants
Cleaning UpAir Pollution
fromAmerica’s Power Plants


The Facts
Cleaning UpAir Pollution
fromAmerica’s Power Plants
NATIONAL ENVIRONMENTAL TRUST • CLEAR THE AIR
WASHINGTON, DC
ACKNOWLEDGEMENTS
Cleaning Up Air Pollution From America’s Power Plants: The Facts, was
compiled by staff of the National Environmental Trust under the
supervision of Mark Wenzler. The Clean Air Task Force provided
research assistance.
This publication was made possible by the generous support
of The Pew Charitable Trusts. The opinions expressed in this
publication are those of the National Environmental Trust
and Clear the Air and do not reflect the views of The Pew
Charitable Trusts.
The National Environmental Trust is a national, non-profit envi-
ronmental organization that provides public policy expertise and
educational outreach on national environmental issues. For
more information on NET, please visit: http://www.environet.org.
Clear the Air is a joint project of the Clean Air Task Force,
National Environmental Trust, and the U.S. Public Interest
Research Group (U.S. PIRG) Education Fund.
© National Environmental Trust 2002.
CONTENTS
CONTENTS
I THE ELECTRIC UTILITY INDUSTRY AT A CROSSROADS . . . . . . .5
1 Power Plants: How Much Do They Contribute to
U.S. Air Pollution? . . . . . . . . . . . . . . . . . . . . . . . . . . . . . . . .10
Endnotes . . . . . . . . . . . . . . . . . . . . . . . . . . . . . . . . . . . . . . . . . .13
II POLICIES AND PROPOSALS . . . . . . . . . . . . . . . . . . . . . . . . . . .15
2 Clean Air Objectives . . . . . . . . . . . . . . . . . . . . . . . . . . . . . . .16
3 The “Grandfather” Loophole . . . . . . . . . . . . . . . . . . . . . . . .20
4 Carbon Dioxide: Why Action Is Needed Now . . . . . . . . . . .26
5 Confronting CO2 and Global Warming . . . . . . . . . . . . . . . .30
Endnotes . . . . . . . . . . . . . . . . . . . . . . . . . . . . . . . . . . . . . . . . . .34
III POWER PLANT CLEANUP: MYTHS AND FACTS . . . . . . . . . . . .39
6 The Bush Administration’s “Clear Skies Initiative”
for Power Plants . . . . . . . . . . . . . . . . . . . . . . . . . . . . . . . . . .40
7 Power Plant Cleanup Costs . . . . . . . . . . . . . . . . . . . . . . . . . .43
8 Natural Gas and the Demand for Clean Energy . . . . . . . . . .45
9 The Future of Coal . . . . . . . . . . . . . . . . . . . . . . . . . . . . . . . .47
10 Power Plant Cleanup and Coal Mining . . . . . . . . . . . . . . . .50
11 Power Plant Cleanup and Reliable Electricity Supplies . . . .53
Endnotes . . . . . . . . . . . . . . . . . . . . . . . . . . . . . . . . . . . . . . . . . .57
IV HEALTH AND ENVIRONMENTAL IMPACTS . . . . . . . . . . . . . . .63
12–Harm to Human Health . . . . . . . . . . . . . . . . . . . . . . . . . . . .64
13–Acid Rain . . . . . . . . . . . . . . . . . . . . . . . . . . . . . . . . . . . . . . .69
14–Air Pollution in America’s National Parks . . . . . . . . . . . . . .71
15–Power Plants, Toxic Pollution, and Children . . . . . . . . . . . .74
16–Global Warming . . . . . . . . . . . . . . . . . . . . . . . . . . . . . . . . . .76
Conclusion . . . . . . . . . . . . . . . . . . . . . . . . . . . . . . . . . . . . . . . . .81
Endnotes . . . . . . . . . . . . . . . . . . . . . . . . . . . . . . . . . . . . . . . . . .82
3

THE ELECTRIC UTILITY INDUSTRY AT A CROSSROADS4

OVERVIEW
Over the next decade, the United States will
make enormous investments in new sources
of electricity. The Bush administration
projects that as many as 1,900 new power
plants will be needed,1 and industry analysts
estimate that electric generating capacity
will increase by 40%.2 While investments in
energy efficiency could substantially reduce
the number of new power plants needed to
meet growing demand,3 there is no doubt
that utilities will be investing billions of
dollars in new generating facilities over the
coming years.
These new power plants–likely to operate
for 50 years or more–mean a future of
either cleaner, healthier air or of worsening
pollution, depending on decisions that
Congress will make in the coming months.
Currently, there is no law to ensure new
5
The Electric UtilityIndustry at a CrossroadsI

plants will minimize emissions that contribute to problems like
global warming. In the meantime, many existing utilities are
operating with virtually no pollution controls, making them a
major cause of health and environmental damage. Policy makers,
however, are considering legislation that would clean up the
older plants and ensure that new ones limit their contributions
to greenhouse gases and other air pollution problems.
The decisions public officials make now will determine whether
air pollution improves or worsens over the next several decades.
Power plants operating today are the number one industrial
source of several major air pollutants, including:
• sulfur dioxide–a pollutant linked to acid rain, haze pollution in
parks, and respiratory disease and death
THE ELECTRIC UTILITY INDUSTRY AT A CROSSROADS6
Projections based on data from The NorthBridge Group and Resource DataInternational (RDI).4
NWPA
CAAZNMNV
Legend to Net Additions(Gigawatts)
Combined Cycle
OtherCombustion Turbine
RMPW
MAPP
SPP
ERCOT
MAIN
SERC
FL
ECAR
MAAC
NYPP
NEPOOL
11.7
14.7
1.1 1.6
21.6
1.8
1.0
2.6
2.0
6.2
0.8
1.3
1.7
0.6
1.2
10.5
1.7 1.4
7.11.2 1.4 1.6
10.3
0.9
14.5
16.3
3.7
4.3
1.4 0.0
10.4
1.1-0.3
9.7
3.6
0.2
42.7
20.5
2.0
9.4
6.6
0.0
F IGURE 1— Projected Electric Generating Capacity Additions by 2006(by electricty supply region)

THE ELECTRIC UTILITY INDUSTRY AT A CROSSROADS
• nitrogen oxides–a cause of ozone smog and asthma attacks
• mercury–a pollutant linked to developmental problems in
children, and
• carbon dioxide–a major cause of global warming.
7
CARBON DIOXIDE: A PRINCIPAL CAUSE OF
GLOBAL WARMING
“Carbon dioxide is probably the single most important agent
contributing to climate changes today.”
“The [global climate] changes observed over the last several
decades are likely because of human activities, for the most
part.”
“Since the Industrial Revolution, … atmospheric concentra-
tions of CO2 have risen about 28 percent …, principally
because of fossil fuel combustion, which accounted for
almost 98 percent of total U.S. CO2 emissions in 1998.”
“Carbon dioxide … [is] more abundant in the Earth’s atmos-
phere now than at any time during the past 400,000 years.”
National Academy of Sciences,
“A Closer Look at Global Warming: Are We Changing the Climate?”
http://www4.nas.edu/onpi/webextra.nsf/web/climate?OpenDocument.
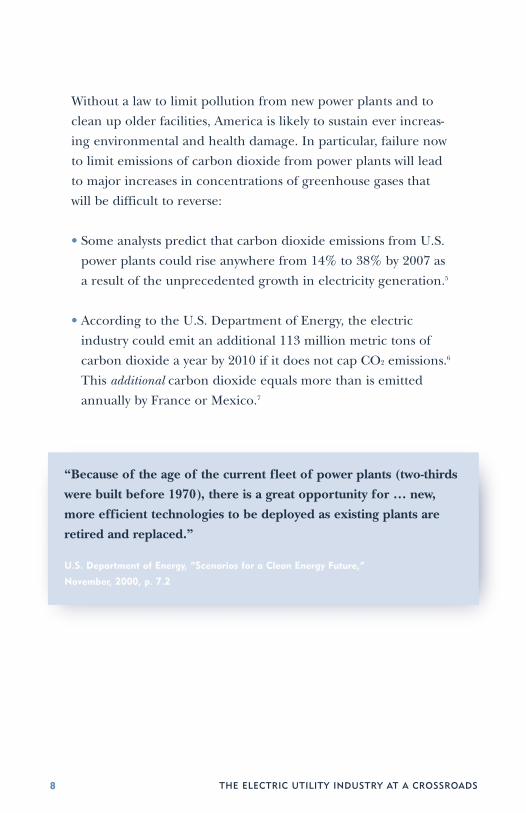
Without a law to limit pollution from new power plants and to
clean up older facilities, America is likely to sustain ever increas-
ing environmental and health damage. In particular, failure now
to limit emissions of carbon dioxide from power plants will lead
to major increases in concentrations of greenhouse gases that
will be difficult to reverse:
• Some analysts predict that carbon dioxide emissions from U.S.
power plants could rise anywhere from 14% to 38% by 2007 as
a result of the unprecedented growth in electricity generation.5
• According to the U.S. Department of Energy, the electric
industry could emit an additional 113 million metric tons of
carbon dioxide a year by 2010 if it does not cap CO2 emissions.6
This additional carbon dioxide equals more than is emitted
annually by France or Mexico.7
THE ELECTRIC UTILITY INDUSTRY AT A CROSSROADS8
“Because of the age of the current fleet of power plants (two-thirds
were built before 1970), there is a great opportunity for … new,
more efficient technologies to be deployed as existing plants are
retired and replaced.”
U.S. Department of Energy, “Scenarios for a Clean Energy Future,”
November, 2000, p. 7.2

THE ELECTRIC UTILITY INDUSTRY AT A CROSSROADS
Thus, the electric utility industry–and the nation–stand at a criti-
cal crossroads: Will the U.S. continue to rely on the outdated
technologies of the last century, thus locking in a future of pol-
luted cities and countryside, as well as increased global warming?
Or will utilities clean up older power plants and use cleaner
technologies and fuels to reduce both air pollution and global
warming?
In 2000, policy makers began to respond to the environmental
and health problems from power plant emissions. Serious
proposals were advanced to clean up emissions of sulfur dioxide,
nitrogen oxides, mercury, and carbon dioxide. Now Congress
and the Bush administration will choose between two starkly
divergent paths. With one, America has an opportunity to
become a leader in the deployment of newer, cleaner electricity
generating technologies: combined cycle natural gas, solar, wind,
geothermal, biomass, and advanced coal gasification. The other
path will lock the U.S., for the next 50 years, into continued
reliance on the highly polluting, antiquated technologies of
the last century.
The facts are clear: decisions by policy makers in the coming
months will determine whether the air in our cities and national
parks is healthy. Choices now will determine how much more
global warming pollution this nation will produce during the
first half of the 21st century.
9
In spite of many decades of efforts to clean up the nation’s air,
serious pollution problems persist: respiratory disease, acid rain,
toxic contamination of the food chain, and global warming. The
U.S. Environmental Protection Agency estimates that over 120
million Americans–43% of the population–live in areas that currently
have unhealthy air.8
The electric industry ranks at or near the top of all U.S. sources
of air pollution.
• Utilities emit more carbon dioxide, sulfur dioxide, and mercury
than any other source.
• Nitrogen oxide emissions from power plants are second only to
the combined emissions of every car and truck in the United
States–approximately 200 million vehicles.
• The bulk of the electric industry’s pollution comes from aging
coal-fired power plants. While a little more than half the elec-
tric power produced in the United States is generated by coal,
these plants are responsible for more than 90% of the indus-
try’s pollution.
Recent studies have shown that over 30,000 people die prema-
turely each year from health problems linked to power plant
emissions.13 To put that number in context, pollution from elec-
THE ELECTRIC UTILITY INDUSTRY AT A CROSSROADS10
POWER PL ANTS : HOW MUCH DO THEYCONTRIBUTE TO U .S . A IR POLLUT ION?
1

THE ELECTRIC UTILITY INDUSTRY AT A CROSSROADS
tric utilities kills more people each year than drunk driving acci-
dents or homicides. By contrast, if older power plants were
required to clean up and meet modern standards, more lives
could be spared annually than are saved with seatbelt use.14
11
Sulfur dioxide causes acid rain, haze pollution in national parks, respiratorydisease, and premature death.
■ 64% Coal-fired power plants■ 3% Other power plants■ 33% All other sources
■ 35% Coal-fired power plants■ 5% Other power plants■ 60% All other sources
Carbon dioxide is the greenhouse gasmost closely linked with global warming.
Nitrogen oxides produce ozone smog, apollutant that causes breathing problems,asthma attacks, and reduced agriculturalproduction.
Mercury contaminates rivers and lakesthroughout the United States, makingmany fish dangerous to eat, and causingdevelopmental disabilities in children.
■ 23% Coal-fired power plants■ 2% Other power plants■ 75% All other sources
■ 33% Coal-fired power plants■ 1% Other power plants■ 66% All other sources
F IGURE 2— U.S. Emissions ofSulfur Dioxide
F IGURE 3— U.S. Emissions ofCarbon Dioxide
F IGURE 4— U.S. Emissions ofNitrogen Oxides
F IGURE 5— U.S. Emissions ofMercury

THE ELECTRIC UTILITY INDUSTRY AT A CROSSROADS12
F IGURE 6— Unnecessary Deaths
30,000
25,000
20,000
15,000
10,000
5,000
0
POWER PLANTPOLLUTION
30,100
16,93517,893
DRUNKDRIVING
HOMICIDES
DE
ATH
S
F IGURE 7— Lives Saved
18,000
15,000
12,000
9,000
6,000
3,000
0
IF WE CLEAN UPPOWER PLANTS
18,700
6,000
BY CURRENTSEAT BELT USE
NU
MB
ER
OF
LIV
ES
SA
VE
D A
NN
UA
LLY
POWER PL ANT A IR POLLUT ION: HEALTH DAMAGE IN CONTEXT

THE ELECTRIC UTILITY INDUSTRY AT A CROSSROADS
ENDNOTES1 White House National Energy Policy Development Group, Reliable, Affordable and
Environmentally Sound Energy for America’s Future, May 2001, “Overview,” p. xi;http://www.whitehouse.gov/energy/Overview.pdf.
2 Harlan Byrne, “Too Much Power? The Utility Industry’s in a Building Boom. WhySkeptics Fear a Bust,” Barron’s, August 6, 2001.
3 According to U.S. EPA, moderate to advanced utilization of energy efficiency measureswill reduce electricity demand by between 8% and 24% from a “business as usual” sce-nario. U.S. EPA, Economic Analysis of a Multi-Emissions Strategy (prepared forSenators James M. Jeffords and Joseph I. Lieberman), October 31, 2001, pp. 6-7;http://www.epa.gov/air/jeffordslieberm.pdf.
4 Clean Air Task Force, Scraping the Bottom of the Barrel for Power: Why There Is NoNeed to Relax Clean Air Safeguards on Dirty Power Plants to “Keep the Lights On,”November 8, 2001; http://cta.policy.net/relatives/18560.pdf. See Appendix A, “ElectricPower New Capacity Additions Update,” Erin O’Neill, The NorthBridge Group, October31, 2001, p. 4, figure 4.
5 Peter Menyasz, “NAFTA Study Estimates Major Increase in CO2 Emissions fromElectricity Sector,” Daily Environmental Report, November 28, 2001: “Planned expansionof electricity generating capacity in the United States, Canada, and Mexico would signifi-cantly increase carbon dioxide emissions across North America, the North AmericanCommission for Environmental Cooperation said.… Although not all planned projects arelikely to be completed, generating capacity is expected to increase by 53 percent in theUnited States by 2007 … the study said. That would increase U.S. emissions of CO2 bybetween 14 percent and 38 percent by 2007 from the 1998 level of 2.3 billion tons peryear.”
6 U.S. Department of Energy, Scenarios for a Clean Energy Future, November 2000,Chapter 7, Table 7.12; http://www.nrel.gov/docs/fy01osti/29379.pdf.
7 Gregg Marland and Tom Boden (Oak Ridge National Laboratory) and Bob Andres(University of North Dakota), National Fossil Fuel CO2 Emissions, January 2002;http://cdiac.esd.ornl.gov/trends/emis/top98.tot.
8 U.S. EPA, Latest Finds on National Air Quality 2000: Status and Trends, September2001, p. 2; http://www.epa.gov/oar/aqtrnd00/brochure/00brochure.pdf.
9 U.S. EPA, National Air Pollutant Emissions Trends, 1900-1998, March 2000, Chapter 3,p. 3-12, Table 3-4; http://www.epa.gov/ttn/chief/trends/trends98/chapter3.pdf.
10 Ibid., Chapter 8, p. 8-5, Table 8-1; http://www.epa.gov/ttn/chief/trends/trends98/chapter8.pdf.
11 Ibid., Chapter 3, p. 3-10, Table 3-2; http://www.epa.gov/ttn/chief/trends/trends98/chapter3.pdf.
12 U.S. EPA, Mercury Study Report to Congress, “Executive Summary,” Vol. I, Part 3,“Findings of the Mercury Study Report to Congress,” p. 3-6, Table 3-1, December 1997;http://www.epa.gov/ttn/oarpg/t3/reports/volume1.pdf.
13 Abt Associates, The Particulate-Related Health Benefits of Reducing Power PlantEmissions, October 2000; http://www.clnatf.org/resources/reports/Abt_PM_report.pdf.For a quick reference to the key findings of the Abt Associates study, see Clear the Air,Death, Disease & Dirty Power: Mortality and Health Damage Due to Air Pollution fromPower Plants, October 2000, p. 3; http://cta.policy.net/fact/mortality/mortalitylowres.pdf.
14 Ibid.
13
POLICIES AND PROPOSALS14

As Congress devises a plan to clean up
power plants, it will consider a number of
options, including ones backed by the Bush
aministration, industry, and the environ-
mental and public health communities.
These proposals vary greatly in scope,
timing, and levels of pollution reduction.
Determining which ones offer the greatest
degree of public health and environmental
protection will require Congress to sort
through a host of policy issues. Among
these are:
• whether power plants previously exempted
from clean air regulations should be
allowed to continue operating without
modern pollution controls, or be required
finally to clean up;
15
Policies andProposalsII
• whether special provisions should be included to prevent some
plants from increasing pollution and harming local air quality;
and
• whether we should begin now to take steps to address global
warming by reducing CO2 emissions from power plants.
The choices Congress makes will determine the quality of our air
for generations to come.
Legislators will wrestle with several key policy issues in the com-
ing months as they attempt to write a plan for cleaning up power
plants. The proposals under discussion address some or all of the
following nine objectives.
1. Reduce nitrogen oxides (NOX): Nitrogen oxides are the pri-
mary ingredient in ozone smog, the pollutant that causes “red
alert” days in much of the eastern United States during the
summer months. Ozone smog is linked to asthma attacks and
lung disease, as well as crop damage and degradation of aquat-
ic ecosystems.1 Power plants are the single biggest industrial
sources of NOX emissions.2
2. Reduce sulfur dioxide (SO2): Sulfur dioxide is the chief ingre-
dient in fine particulate matter in the eastern United States.
Particulate matter is linked to lung disease, asthma attacks,
and premature deaths.3 SO2 is also linked to acid rain and
POLICIES AND PROPOSALS16
CLEAN A IR OBJECT IVES2
POLICIES AND PROPOSALS
haze pollution in national parks.4 Power plants are the
number one source of SO2 pollution in the United States.5
3. Reduce mercury (Hg): Mercury contaminates the food chain
and is linked to developmental problems in young children.6
Coal-fired power plants are the number one source of
mercury emissions.7
4. Reduce carbon dioxide (CO2): Carbon dioxide is the most
prevalent global warming pollutant,8 and power plants are the
number one source of CO2 in the U.S.9
5. Close the “grandfather” loophole: Under the 1977 Clean Air
Act, facilities were exempted (“grandfathered”) from meeting
modern pollution standards as long as they did not undergo
major physical or operational changes that resulted in signifi-
cantly increased emissions. The U.S. Department of Justice has
sued 51 power plants for making such changes in violation of
the law.10 The grandfather loophole would be closed after a
number of years under some cleanup plans.
6. Allow emissions “trading”: In order to meet some or all of
their obligations for emissions reductions, power plants would
be given the choice of either reducing emissions by installing
pollution controls or by switching to cleaner burning fuels, or
they could buy emissions “credits” from other plants that have
emissions below the required limit.
17

7. Protect local air quality: One of the potential problems of
emissions trading is that some plants may rely too heavily on
buying emissions credits from other plants and thereby fail to
improve air quality near their plants. Another problem is that
some emissions, like mercury, are so toxic that trading could
result in a dangerous buildup of this pollutant near certain
plants. Some proposals address these problems by limiting
trading in areas with poor local air quality, or toxic “hot spots,”
and by closing the grandfather loophole to ensure that every
plant is eventually cleaned up.
8. Encourage renewable power and energy efficiency: Research
by the Department of Energy shows that the overall cost of
reducing power plant emissions declines sharply if the reduc-
tions are achieved, in part, by increasing reliance on renew-
able power and energy efficiency measures.11 Several proposals
call for greater use of renewable energy sources and greater
energy efficiency.
9. Provide electric utilities with regulatory certainty: Utility
executives have complained that their ability to plan and build
new, cleaner power plants is hampered by having to comply
with different regulatory programs for different pollutants,
each with a different compliance schedule. They have asked
Congress for one plan that regulates all pollutants on a
coordinated time frame. An important objective of all
multi-pollutant cleanup plans is to give electric utilities the
regulatory certainty they need to plan and build cleaner
new power plants.
POLICIES AND PROPOSALS18

POLICIES AND PROPOSALS 19
75% reduc-tion from1997 levelsby 2007.T
75% reduc-tion belowfull imple-mentationof the Acid RainProgram by2007.T
Cap CO2 at1990 levelsby 2007.T
90% reduc-tion from1999 levelsby 2007.No trading
EPA mustpreventlocalizedadverseeffects onpublichealth andenvironment.
At theplant’s 30thbirthday, itmust meetmodernemissionstandards.
Calls onEPA toincreasethe use ofrenewablesand effi-ciency programs.
67% reduc-tion from1997 levelsby 2018 (2 steps:2008,2018).T
73% reduc-tion by 2018(2 steps:2010,2018). T
Notrequired.
63% reduc-tion by 2018(2 steps:2010, 2018).T
No protections.
No. Likelyto expandgrandfatherloophole inseveralareas.
Eliminatesor modifiesseveralClean AirAct pro-grams,includingNSR.
80% reduc-tion fromcurrentemissionsby 2012 (2 steps:2004,2009).
78% reduc-tion belowfull imple-mentationof Acid RainProgram by 2012 (2 steps:2004,2009).
Cap CO2 at1990 levelsby 2010with addi-tionalreductionsof at least10% by2020.
95% reduc-tion by2012 (2 steps:2004,2009).
Statesretainauthority topreventlocaladverseimpacts.Federalgovt. toremedyinterstateimpacts.
Notaddressed.
RetainsClean AirAct pro-grams forpowerplants suchas NSR,BART andHg MACT.
CleanEnergyGroup proposal(a)
50% reduc-tion fromcurrentemissionlevels by2008.T
60% reduc-tion beyondPhase IIAcid RainProgram by2012.T
Cap CO2 at1990 levelsby 2012.T
70%-90%reduction by2012.T
No. No. Calls for anumber ofchanges toNSR.
CleanPowerGroup proposal(b)
66% reduc-tion fromcurrentemissionslevels by2011 (3 steps:2005, 2008,2011).T
73% reduc-tion fromcurrentemissionlevels by2011 (3 steps:2005, 2008,2011).T
No. But ifCongressmandatesCO2 reduc-tions, then3 steps: (1)2005- capat businessas usual; (2)2009- cutgrowth rate;(3) 2011-decliningcap.
77% reduc-tion fromcurrentemissionlevels by2011 (3 steps:2005, 2008,2011).T
EPA toenact “hotspot” pro-tections formercuryonly.
No. Eliminatesor modifiesClean AirAct pro-grams,includingNSR.However,NSRremainsuntil capstake effect.
EdisonElectricInstituteproposal (c)
≈ 50%reductionbelow cur-rent emis-sion levelsby 2015.T
≈ 50%reductionbelowPhase IIacid rainlevels by2015.T
Notrequired.
≈ 50%reductionby 2015.T
No. No. None.
Multi-pollutant proposals
NOx Cap SO2 Cap CO2 Cap Hg Cap LocalImpacts
Protection
De-grand-fathering Provision
Other
Jeffords-LiebermanClean PowerAct (S 556)andWaxman-BoehlertCleanSmokestacksAct (HR1256)
Bush “ClearSkies” pro-posal
NortheastStates proposal(ME, NH,VT, MA, CT, RI, NYand NJ)
F IGURE 8— Power Plant Clean Up Proposals( T= TRADING ALLOWED)
Efforts to clean up America’s power plants with existing laws
have repeatedly met a major stumbling block–the so-called
“grandfather” loophole. This exempts older, mostly coal-fired
plants granted permits before 1977 from modern air pollution
standards. Even after all power plants finally comply with acid
rain provisions of the 1990 Clean Air Act (in approximately
2010), grandfathered coal-fired power plants will still emit six
times more sulfur dioxide pollution than a coal-fired power plant
that meets current standards.12
The loophole for older facilities was included in 1977 clean air
legislation with the understanding that these plants would retire
and be replaced by newer, cleaner ones. In agreeing to this
exemption, Congress also built a safety net into the law, known
as “New Source Review,” to ensure that the oldest plants would
eventually be cleaned up, if they were not, in fact, retired. This
provision requires that grandfathered power plants upgrade
their pollution controls, meeting the same standards as “new
sources,” whenever they undertake major modifications to
extend the useful life of the plant and significantly increase air
pollution. This compromise gave power companies the flexibility
to retire their old plants or to gradually modernize pollution
controls at the same time they modernized their plants.
A quarter century later, however, virtually none of the plants
exempted under the 1977 Act has modernized pollution controls
or retired. The economic advantage enjoyed under this loophole
POLICIES AND PROPOSALS20
THE “GRANDFATHER” LOOPHOLE3

POLICIES AND PROPOSALS
has helped to lock in place older, highly polluting coal-fired facil-
ities as America’s leading providers of electricity.13 The owners
have little incentive to build clean new plants as long as they can
maximize the amount of electricity–and pollution–produced by
their old ones.
The Department of Justice has charged operators of dozens of
grandfathered plants with violating the law by substantially
rebuilding facilities to generate more electricity without notifying
EPA or improving pollution controls as required by New Source
Review.14 Consequently, companies wishing to build new plants
face the obstacle of competing with antiquated ones that have
been spared the cost of installing and operating modern pollu-
tion controls.
Two competing views have emerged in cleanup legislation over
how the loophole issue should be resolved. Some of the leading
bills in Congress would put an end to the exemption and cap
pollution once and for all after a set period of time. The other
approach, represented by the Bush administration’s “Clear
Skies Initiative” and some industry proposals, would cap some
pollutants, but leave the grandfather loophole in place and
even expand it to permit the oldest plants to continue operating
without installing modern pollution controls.
Both the Clean Power Act, sponsored by Senators Jim Jeffords (I-
VT) and Joseph Lieberman (D-CT),15 and the Clean Smokestacks
Act, sponsored by Representatives Sherwood Boehlert (R-NY)
and Henry Waxman (D-CA),16 would put an end to regulatory
exemptions for the oldest and most polluting plants. These bills
21
also require that each individual plant meet modern pollution
control standards either by their 30th year of operation or 5
years from enactment of the proposed legislation, whichever is
later. These bills not only seek to improve air quality by cleaning
up older plants, but also to encourage new plants to enter the
market by eliminating the advantages enjoyed by grandfathered
plants because of their much lower operating costs.
In contrast to the bills proposed by Jeffords-Lieberman and
Boehlert-Waxman, other proposals do not address the problem
of grandfathered plants. Notably, the Bush administration’s
“Clear Skies” plan seeks to expand the grandfather loophole by
increasing the number and scope of exemptions available under
the New Source Review program. These exemptions provide
older coal-fired plants with significant new leeway to expand
operations and increase emissions without having to modernize.
The Bush administration claims that New Source Review regula-
tions will not be needed if the “Clear Skies Initiative” becomes
law. It maintains emissions caps called for by its proposal will
achieve the same degree of emissions reductions as enforcing
New Source Review would, but with greater flexibility for indus-
try.17 However, there are two major flaws in the administration’s
reasoning.
First, even if the Clear Skies Initiative were enacted today, its
pollution caps would not fully take effect until 2018 at the
earliest.18 Furthermore, the administration wants to make imme-
diate changes to New Source Review that would not require
congressional approval. Therefore, under the Bush plan, there
POLICIES AND PROPOSALS22
POLICIES AND PROPOSALS 23
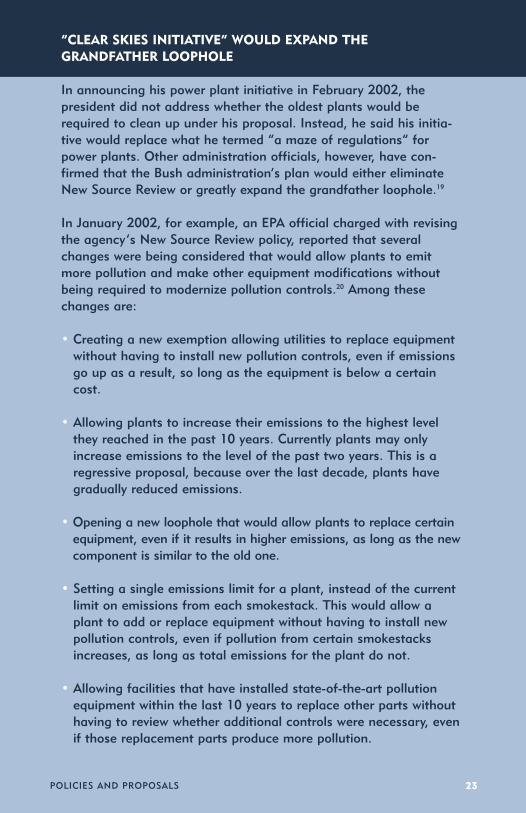
“CLEAR SKIES INITIATIVE” WOULD EXPAND THEGRANDFATHER LOOPHOLE
In announcing his power plant initiative in February 2002, the president did not address whether the oldest plants would berequired to clean up under his proposal. Instead, he said his initia-tive would replace what he termed “a maze of regulations” forpower plants. Other administration officials, however, have con-firmed that the Bush administration’s plan would either eliminateNew Source Review or greatly expand the grandfather loophole.19
In January 2002, for example, an EPA official charged with revisingthe agency’s New Source Review policy, reported that severalchanges were being considered that would allow plants to emitmore pollution and make other equipment modifications withoutbeing required to modernize pollution controls.20 Among thesechanges are:
• Creating a new exemption allowing utilities to replace equipmentwithout having to install new pollution controls, even if emissionsgo up as a result, so long as the equipment is below a certaincost.
• Allowing plants to increase their emissions to the highest levelthey reached in the past 10 years. Currently plants may onlyincrease emissions to the level of the past two years. This is aregressive proposal, because over the last decade, plants havegradually reduced emissions.
• Opening a new loophole that would allow plants to replace certainequipment, even if it results in higher emissions, as long as the newcomponent is similar to the old one.
• Setting a single emissions limit for a plant, instead of the currentlimit on emissions from each smokestack. This would allow aplant to add or replace equipment without having to install newpollution controls, even if pollution from certain smokestacksincreases, as long as total emissions for the plant do not.
• Allowing facilities that have installed state-of-the-art pollutionequipment within the last 10 years to replace other parts withouthaving to review whether additional controls were necessary, evenif those replacement parts produce more pollution.

could be a period of at least 16 years during which neither full
pollution caps nor NSR would keep power plant emissions in
check.
Second, unlike New Source Review, the Clear Skies plan does
not require each and every “grandfathered” power plant to
install state-of-the-art pollution controls if it expands in a way
that increases emissions. For instance, the oldest and dirtiest
power plants would be able to use the “cap and trade” system of
the Bush plan to buy pollution allowances instead of cleaning up.21
This is precisely what power plants did under the Clean Air
Act’s Acid Rain control program. During the first phase of that
program, only a fraction (6%) of power plants installed pollution
controls.22 The vast majority either switched to a slightly less
polluting fuel or purchased pollution allowances from the few
plants that did install pollution controls.
Congress recognized in 1990 that pollution caps alone are not
sufficient to force every plant to lower emissions. That is why it
left New Source Review in place–the primary tool of the Clean
Air Act for cleaning up grandfathered plants.23 In doing so,
Congress tried to protect local air quality, even while preserving
maximum flexibility for industry to make pollution cuts in the
most economical ways possible.
In contrast, the Clear Skies Initiative provides no such protection
for local air quality, which could have serious localized health
POLICIES AND PROPOSALS24

effects. Studies by scientists at the Harvard School of Public
Health have shown that health damage can occur among popula-
tions living in the immediate vicinity of grandfathered power
plants. Based on the findings in these studies, hundreds of lives
could be saved each year by closing the loophole and requiring
plants to modernize pollution controls.24
Finally, by expanding the grandfather loophole, the Bush admin-
istration’s plan would increase the cost advantage older, dirtier
power plants have over new or proposed plants trying to enter a
deregulated and highly competitive energy market.
POLICIES AND PROPOSALS 25
F IGURE 9— EST IMATED DEATHS FROM SELECTED POWER PL ANTSAND L IVES SAVED THROUGH LOWER EMISS IONS
Grandfathered PowerPlants Studied byHarvard Researchers
Number of DeathsCaused Each Year by Power PlantPollution
Number of LivesSaved Each Year IfModern PollutionControls Are Installed
Nine Chicago, Illinois-
Area Power Plants.1
Two Southeastern
Massachusetts Power
Plants.2
300
159
200
124

A major issue surrounding new power plant emissions controls is
whether to include carbon dioxide along with other pollutants in
the ultimate plan. As a candidate, Mr. Bush initially supported
including CO2 in the cleanup plan, but now as president he
opposes this measure.25
In contrast, a growing number of electric utilities have recog-
nized that it makes good business sense to adopt a strategy that
addresses all pollutants at once, including CO2, rather than hav-
ing to make major capital investments to clean up SO2, NOX, and
mercury pollution now and to undertake a separate initiative for
CO2 at some future date.26
Many industry executives recognize that if they fail to address
CO2 emissions, it is only a matter of time before Congress steps
in to correct the problem. With all signs pointing to impending
POLICIES AND PROPOSALS26
CARBON DIOXIDE: WHY ACTION IS NEEDED NOW4
“[If elected, Governor Bush will] Propose Legislation that Will
Require Electric Utilities to Reduce Emissions and Significantly
Improve Air Quality. [The] legislation will: Establish mandatory
reduction targets for emissions of four main pollutants: sulfur diox-
ide, nitrogen oxide, mercury and carbon dioxide.”
Governor George W. Bush,
“A Comprehensive National Energy Policy,” September 29, 2000.
POLICIES AND PROPOSALS
CO2 regulation, any plan that omits this pollutant would force
utilities to make investments today that may well be obsolete
tomorrow. With the industry poised to add as much as 290,000
MW (million watts) of new generating capacity in the next
decade—a 40% increase over current capacity27—the issue of
pollution control becomes even more critical. In the words of
one utility consortium, “business and markets hate uncertainty.”28
That is why so many utilities have been outspoken on the need
to include carbon dioxide in the ultimate legislation.
In addition to the bottom-line concerns of utility companies,
other factors are having an effect on business executives and
government officials as they confront the issue of carbon dioxide
in power plant emissions:
• The seriousness of global warming is becoming clearer. The
Third Assessment Report from the Intergovernmental Panel on
Climate Change, released in February 2001, found that over
the next 100 years, global average temperatures will rise by
between 2.4° and 10.4° F (1.4° to 5.8° C).29
• Global warming has already affected ecosystems. “Examples of
observed changes include shrinkage of glaciers, thawing of
permafrost, … declines of some plant and animal populations
and earlier flowering of trees, emergence of insects, and egg-
laying in birds.”30
• Global warming impacts could be irreversible. Irreparable dam-
age is occurring to “glaciers, coral reefs and atolls, mangroves,
boreal and tropical forests, polar and alpine ecosystems, prairie
wetlands, and remnant native grasslands.”31
27

ELECTRIC INDUSTRY EXECUTIVES RECOGNIZE THE VALUE
OF CLEANING UP ALL MAJOR POLLUTANTS IN ONE COM-
PREHENSIVE PLAN
“A piecemeal pollutant-by-pollutant approach to emissions reduc-
tions is costly and inefficient…. In comparison, an integrated
strategy would allow electricity generators to optimize their
pollution control decisions.”
The Clean Energy Group32
“It makes good business sense to know what our CO2 control
obligations might be for a period of time so that we can factor
that into our decisions when we comply with the other emissions
reductions.… If we know the whole package, including CO2, we’d
probably make a decision to retire more plants.”
Dale Heydlauff, Senior Vice President for Environmental Affairs, American Electric Power33
“Our proposal calls for mandatory, nation-wide emissions caps
for nitrogen oxide, sulfur dioxide, mercury and carbon dioxide
[emphasis added]; established dates certain for producing neces-
sary emissions reductions; [and] implementation through emis-
sions banking and trading….”
Frank Cassidy, President, PSEG Power, LLC34
“The fragmented regulatory framework which now applies to
electric power plants emissions is blocking progress toward
our long-term energy and environmental goals. There is need
for a coordinated multi-pollutant framework for power plant
emissions….“
James E. Rogers, Vice Chairman, President, and CEO, Cinergy Corporation35
POLICIES AND PROPOSALS28
POLICIES AND PROPOSALS
Meanwhile, concerns are growing over the effects of global
warming on humans:
• Researchers calculate that greenhouse gas emissions over
the next 20 years will contribute to some 64,000 premature
deaths, 65,000 chronic bronchitis cases, and 37 million lost
“person-days” of restricted work and activity in just four large
cities in the Western Hemisphere: São Paulo, Brazil; Mexico
City; Santiago, Chile; and New York City.36
• A report by Harvard University’s Center for Health and the
Global Environment has found that over the past three
decades, global warming has contributed to a variety of weather
extremes and pest problems. These have caused greater than
normal fluctuations in farm income, and researchers say this
pattern will likely continue. According to the report, “extreme
weather events have caused severe crop damage and have
exacted a significant economic toll for U.S. farmers over the
past 20 years.… Expected temperature increases are likely to
hasten the maturation of annual crop plants, thereby reducing
their total yield potential, with extremely high temperatures
causing more severe losses.”37
Despite the seriousness of the problem, carbon dioxide emis-
sions are on a steady upward trend. The Department of Energy
predicts, “Carbon dioxide emissions from energy use are project-
ed to increase at an average rate of 1.5 percent per year, from
1,562 million metric tons of carbon equivalent in 2000 to 2,088
million metric tons in 2020. Projected emissions in 2020 are
higher by 47 million metric tons carbon equivalent than in 2001,
29

due to higher projected energy demand in the commercial and
transportation sectors and more coal-fired electricity generation
[emphasis added] than in 2001.”38
Responding to mounting evidence of the effects of global
warming, the 107th Congress has indicated renewed interest in
legislation addressing it. In all, 36 separate pieces of proposed
legislation containing elements focused specifically on green-
house gas emissions or climate change have been introduced.
Congress is also preparing or discussing additional legislation,
including:
• A bill by Senators McCain and Lieberman to establish a nation-
al cap-and-trade system for CO2
• A provision, sponsored by Senators Jeff Bingaman (D-NM) and
Tom Daschle (D-SD), to create a carbon registry
• Carbon sequestoration Programs, particulary for agricultural
lands.
Overseas, other nations, frustrated with U.S. foot-dragging, are
moving ahead on their own to implement global warming agree-
ments. Despite the withdrawal by the U.S. from the Kyoto global
warming treaty, Romano Prodi, the president of the European
Commission, announced in early March 2002 that “the Council
POLICIES AND PROPOSALS30
CONFRONTING CO 2 AND GLOBAL WARMING5

POLICIES AND PROPOSALS
has now approved the Kyoto Protocol thus enabling the EU to
proceed with its ratification. I am confident that Member States
will take the necessary steps in order to allow for a simultaneous
ratification together with the European Community before 1
June 2002.”39 In addition, the Japanese government has affirmed
that it, too, will proceed with the Kyoto Protocol.
31
“Jeffords to Tackle Global Warming,” The Associated Press,
July 10, 2001. “Vermont Sen. James Jeffords named global
warming as his first priority when he formally became
chairman of the Senate Environment and Public Works
Committee on Tuesday.”
“Byrd Proposal to Create Office for Climate Control
Approved” Charleston Gazette, August 3, 2001. “A key
Senate committee has given unanimous approval to climate
control legislation authored by Sen. Robert Byrd.”
“Lieberman, McCain Announce Intent to Draft Legislation
Creating Cap-and-Trade System,” Bureau of National
Affairs, Daily Environment Report, August 6, 2001. “Two key
senators announced Aug. 3 their intent to draft legislation
to cap emissions of greenhouse gases and to put in place
an allowance trading system they say will encourage
innovative technologies for reducing emissions of the
gases believed to cause global warming.”

Even though the U.S. has no national policy for mitigating CO2
emissions, individual states are acting to cut greenhouse gas
emissions. At least 25 states and Puerto Rico have begun to
develop “action plans” to address global warming, and 19 of
them have been completed to date.40 The plans recommend a
number of policies to stem CO2 emissions, including:
• voluntary measures for energy efficiency,
• tax incentives for fuel switching and cogeneration,
• renewable portfolio standards for utility companies,
• emissions trading, and
• recycling programs.41
Some of the plans establish future emission reduction or
efficiency goals or call on the federal government to take action,
while others set up stakeholder processes to identify appropriate
climate change or efficiency actions.
• Massachusetts has established regulations to reduce emissions
from the state’s six oldest and dirtiest power plants.42 This
legislation represents the first time that generating facilities
have been subject to mandatory CO2 reductions. Under the
provisions that took effect in June 2001, the plants will no
longer be “grandfathered,” or allowed to operate with weaker
emissions standards than newer plants.
POLICIES AND PROPOSALS32

POLICIES AND PROPOSALS
• Illinois has enacted a law intended to limit emissions from
older power plants. The legislation could lead to significant
cuts in sulfur dioxide, nitrogen oxide, mercury, and green-
house gas emissions from the aging fleet of coal-burning
electric power plants in the state.43
• New York Governor George Pataki has directed state agencies
to determine what can be done “to combat the emissions of
carbon dioxide from power plants and industries” associated
with global warming. His directive contrasts with President
Bush’s decision to back away from a campaign promise of
tougher federal regulation of carbon dioxide emissions.44
• The General Assembly of California has passed a bill to control
emissions of greenhouse gases. The new law could lead to
sweeping changes in how cars sold in America are built, mak-
ing California the first state to regulate vehicle exhaust linked
to global warming.45
33
ENDNOTES1 U.S. EPA, Air Quality Where You Live, “Health and Environmental Impacts of NOx”;
http://epa.gov/air/urbanair/nox/hlth.html.
2 Ibid., “NOx: What is it? Where does it come from?”;http://epa.gov/air/urbanair/nox/what.html.
3 Ibid., “Health and Environmental Impacts of SO2”;http://www.epa.gov/air/urbanair/so2/hlth1.html.
4 Ibid., “Chief Causes for Concern”; http://www.epa.gov/air/urbanair/so2/chf1.html.
5 Ibid., “SO2: What is it? Where does it come from?”;http://www.epa.gov/air/urbanair/so2/what1.html.
6 National Academy of Sciences, Toxicological Effects of Methyl Mercury, NationalAcademy Press, 2000, Chapter 5, p. 147 et seq.;http://books.nap.edu/books/0309071402/html/147.html#pagetop.
7 U.S. EPA, Mercury Study Report to Congress, “Executive Summary,” Vol. I, Part 3,“Findings of the Mercury Study Report to Congress,” December 1997, Table 3-1;http://www.epa.gov/ttn/oarpg/t3/reports/volume1.pdf.
8 U.S. EPA, Emission Trends: National Air Pollutant Emission Trends, 1900-1998, March2000; http://www.epa.gov/ttn/chief/trends/trends98/chapter8.pdf.
9 Ibid.
10 U.S. EPA, Office of Regulatory Enforcement, Coal-fired Power Plants Enforcement;http://es.epa.gov/oeca/ore/aed/coal/index.html.
11 U.S. Department of Energy, Scenarios for a Clean Energy Future, November 2000,Chapter 7, “The Electricity Sector”; http://www.nrel.gov/docs/fy01osti/29379.pdf.
12 Grandfathered coal-fired power plants without SO2 emissions controls emit an averageof 1.776 lb of SO2 per MBtu, while the average rate for coal-fired power plants with SO2
controls is 0.143 lb/MBtu. So, on average, a plant without SO2 controls emits more than12 times the SO2 of plants with controls. Compared with the legal standard for newplants, which is 0.3 lb/MBtu, the average uncontrolled plant’s emissions are six timesgreater. See U.S. EPA, Acid Rain Program, “1998 Continuous Emissions MonitoringData”; http://www.epa.gov/airmarkets/egrid/index.html. All units with an emission rategreater than 0.6 lb/MBtu were considered to be uncontrolled, while units with an emis-sion rate below 0.3 were considered to be controlled.
13 U.S. Department of Energy, Electric Generating Unit Inventory, “Industry Capability byFuel Source and Industry Sector”;http://www.eia.doe.gov/cneaf/electricity/epav1/elecprod.html#tab2.
14 U.S. EPA, Office of Regulatory Enforcement, Coal-fired Power Plants Enforcement;http://es.epa.gov/oeca/ore/aed/coal/index.html.
15 To view the Clean Power Act and obtain a full list of current co-sponsors, go tohttp://thomas.loc.gov/ and enter “S.556” in the bill number search field.
16 To view the Clean Smokestacks Act and obtain a full list of current co-sponsors, go tohttp://thomas.loc.gov/ and enter “H.R. 1256” in the bill number search field.
POLICIES AND PROPOSALS34

POLICIES AND PROPOSALS
17 Tripp Baltz, “New Source Review Must Be Eliminated in Any Trading Bill, Air ChiefSays,” BNA Daily Environment Report, March 18, 2002.
18 The White House, “Executive Summary,” The Clear Skies Initiative, February 14, 2002;http://www.whitehouse.gov/news/releases/2002/02/clearskies.html.
19 Triipp Baltz, op cit.
20 Alex Canizares, “Cinergy, Southern to Gain From Clean-Air Law Changes,” BloombergNews, January 2, 2002. Article based on interview of EPA official William Harnett.
21 Ibid.
22 A summary of compliance strategies implemented by the 443 coal-fired units regulatedunder Phase I of the acid rain program is as follows: fuel switching: 162 (37%); purchas-ing pollution allowances from other units: 39 (9%); installing emissions controls (fuel gasde-sulfurization): 27 (6%); using previously installed controls: 25 (6%); retiring facilities: 7(2%); boiler re-powering: 1 (< 1%); substituting and compensating units: 182 (41%).Source: U.S. Department of Energy, Energy Information Administration, Form EIA-767;http://www.eia.doe.gov/cneaf/electricity/page/eia767.html.
23 Clean Air Act, Acid Rain Program, §413 42 U.S.C. 7651l.
24 Two recent studies by Harvard researchers show that populations surrounding powerplants suffer serious health damage as a result of pollution from those plants: (1) J. I.Levy, et al., “Using CALPUFF to evaluate the impacts of power plant emissions inIllinois: Model sensitivity and implications,” Atmospheric Environment, 36 (6): 1063-1075(2002); http://www.hsph.harvard.edu/press/releases/press1032001.html; and (2) J. I.Levy and J. D. Spengler, “Modeling the benefits of power plant emission controls inMassachusetts,” Journal of Air & Waste Management Association, 52: (2002);http://www.hsph.harvard.edu/papers/plant/plant.pdf.
25 “Bush, in Reversal, Won’t Seek Cut in Emissions of Carbon Dioxide,” New York Times,March 14, 2001, and “Bush Drops a Call for Emissions Cuts; Energy Firms OpposedCarbon Dioxide Pledge,” Washington Post, March 14, 2001.
26 “Utilities May Be Greener Than Bush,” Wall Street Journal, May 10, 2001. The paperreported, for example, that a growing number of utility executives recognized the need to (1) treat global warming as real; (2) acknowledge CO2 emissions are a major part ofthe problem; and (3) accept the reality of eventually being required to reduce CO2
emissions.
27 Harlan Byrne, “Too Much Power? The Utility Industry’s in a Building Boom. WhySkeptics Fear a Bust,” Barron’s, August 6, 2001.
28 Clean Energy Group, A Multi-pollutant approach is a win-win for the environment andindustry, January 8, 2001; http://www.mjbradley.com/documents/multipollutant.pdf.
29 Intergovernmental Panel on Climate Change Working Group I, Third AssessmentReport, “Summary for Policymakers,” January 2001, p. 13.
30 Intergovernmental Panel on Climate Change Working Group II, “Summary forPolicymakers,” Third Assessment Report, January 2001, p. 3.
31 IPCC Working Group II, Op. Cit.
32 Ibid. Clean Energy Group companies include: Conectiv, Consolidated Edison, Inc.,Entergy Corp., Exelon Power Corp., KeySpan, Northeast Utilities, Ontario PowerGeneration, Inc., Pacific Gas & Electric, Public Service Enterprise Group, Inc., NationalEnergy Group, and Sempra.
35

33 “Utility Executive Critiques Multi-Emissions Plan, NSR,” AIR Daily, January 29, 2002.
34 Testimony of Frank Cassidy, President, PSEG Power, LLC, Senate Environment andPublic Works Committee, May 17, 2000, Clean Air Act: Incentive-Based UtilityEmissions Reductions. Transcript at: http://frwebgate.access.gpo.gov/cgi-bin/getdoc.cgi?dbname=106_senate_hearings&docid=f:68421.wais.
35 Testimony of James E. Rogers, Vice Chairman, President, and CEO, Cinergy Corp.,Senate Environment and Public Works Committee, May 17, 2000, Clean Air Act:Incentive-Based Utility Emissions Reductions. Transcript at:http://frwebgate.access.gpo.gov/cgi-bin/getdoc.cgi?dbname=106_senate_hearings&docid=f:68421.wais.
36 Luis Cifuentes, Victor H. Borja-Aburto, Nelson Gouveia, George Thurston, Devra LeeDavis, “Assessing the Health Benefits of Urban Air Pollution Reductions Associated withClimate Change Mitigation (2000-2020): Santiago, São Paulo, México City, and NewYork City,” Environmental Health Perspectives, Vol. 109, Supplement 3 (June 2001):419-425.
37 Cynthia Rosenzweig, Ana Iglesias, X.B. Yang, Paul Epstein, Eric Chivian, “ClimateChange and U.S. Agriculture: Impacts of Warming and Extreme Weather Events onProductivity, Plant Diseases, and Pests,” Harvard University Center for Health and theGlobal Environment, May 2000.
38 U.S. Department of Energy, “Overview,” Annual Energy Outlook 2002 with Projections to2020, December 2001, p. 6; http://www.eia.doe.gov/oiaf/aeo/pdf/0383(2002).pdf.
39 European Commission press release issued by Commission President Romano Prodi onratification of the Kyoto Protocol. Brussels, March 4, 2002.
40 U.S. EPA, Global Warming, State Action Plans;http://yosemite.epa.gov/globalwarming/ghg.nsf/actions/StateActionPlans.
41 Ibid.
42 Commonwealth of Massachusetts, Governor Jane Swift, press release, “Swift UnveilsNation’s Toughest Power Plant Regulations,” April 23, 2001;http://www.state.ma.us/gov/press/pr042301powerplants.htm.
43 “Illinois Enacts Law Seeking to Limit Emissions From Older Power Plants,” DailyEnvironment Report, Bureau of National Affairs, August 9, 2001.
44 “Pataki says task force will look at carbon dioxide emissions,” The Associated Press,May 14, 2001.
45 “The State Assembly Passes Bill to Control Emissions of Greenhouse Gas,” Los AngelesTimes, January 31, 2002.
POLICIES AND PROPOSALS36

POLICIES AND PROPOSALS
F IGURE 8
(a)Clean Energy Group companies are: Conectiv, Consolidated Edison, Inc., Entergy Corp.,Exelon Power Corp., KeySpan, Northeast Utilities, Ontario Power Generation, Inc.,Pacific Gas & Electric, Public Service Enterprise Group, Inc., National Energy Group,and Sempra.
(b)Clean Power Group companies are: Calpine, El Paso Corp., Enron, NiSource, TrigenEnergy.
(c) Edison Electric Institute (EEI) is an association of 200 U.S. electric companies.
F IGURE 9
1J. I. Levy, et al., “Using CALPUFF to evaluate the impacts of power plant emissions inIllinois: Model sensitivity and implications,” Atmospheric Environment, 36 (6): 1063-1075(2002). See http://www.hsph.harvard.edu/press/releases/press1032001.html.
2J. I. Levy and J. D. Spengler, “Modeling the benefits of power plant emission controls inMassachusetts” Journal of Air & Waste Management Association, 52: (2002). Seehttp://www.hsph.harvard.edu/papers/plant/plant.pdf.
37

POWER PLANT CLEANUP: MYTHS AND FACTS38

With so much at stake in the debate over
how best to clean up power plant pollution,
a number of myths have sprung up that are
not consistent with the facts. Contrary to
claims by some utilities and members of
the Bush administration, comprehensive
reductions in power plant emissions are
affordable and achievable–and they will not
cause electricity shortages. The demand for
new, clean power can be met economically
and with existing domestic energy supplies.
Indeed, coal will continue to make up a
large part of our energy mix under any
cleanup scenario.
As the facts demonstrate, significant reduc-
tions in air pollution from electricity plants
can be a win-win solution for the environ-
ment and for consumers.
39
Power Plant Cleanup: Myths and FactsIII

In February 2002, President Bush announced his “Clear SkiesInitiative”–a plan to clean up air pollution from America’s powerplants. The president described his proposal for reducing threemajor pollutants–nitrogen oxides, sulfur dioxide, andmercury–as “the most significant step America has ever taken …to cut power plant emissions ….”1 But a look at the fine printshows that the president’s proposal would actually do less thanthe current law.
POWER PLANT CLEANUP: MYTHS AND FACTS40
THE BUSH ADMINISTRAT ION ’S “CLEAR SK IES IN IT IAT IVE” FOR POWER PL ANTS
6
MY
TH
FA
CT
The Bush administration’s “Clear Skies” power plant initiative
will reduce power plant emissions further and faster than
existing programs under the Clean Air Act.
Although the Bush plan will reduce some power plant pollutants
below today’s levels, even larger reductions will result from the
existing programs that the president wants to replace.

POWER PLANT CLEANUP: MYTHS AND FACTS
The president says his plan will both streamline regulations forindustry and provide greater environmental protection.2 While itis true that replacing many programs with a single one wouldresult in “streamlining,” the ultimate test is whether or not thenew program will produce similar or better results.
EPA has analyzed the emissions reductions that would resultfrom full implementation of the Clean Air Act programs that thepresident’s “Clear Skies Initiative” would replace.3 This analysisshows that the emissions caps proposed under “Clear Skies” arehigher than the caps that would be set under the existing CleanAir Act.4 Thus, the president’s proposal would allow more pollu-tion than if existing laws were simply enforced.5
• Sulfur Dioxide – “Clear Skies” cap is 50% higher: PresidentBush says his plan will cap sulfur dioxide emissions from powerplants at a level 73% below current emissions. But the Bush plancap is actually 50% higher than the cap that would result fromfull implementation of current programs in the Clean Air Act.
• Nitrogen Oxides – “Clear Skies” cap is 36% higher: The presi-dent says his plan will cap power plant nitrogen oxide emissionsat a level 67% below current emissions. But the “Clear Skies”cap is 36% higher than the current Clean Air Act would achieve.
• Mercury – “Clear Skies” cap is 200% higher: The president sayshis plan will cap power plant mercury emissions at 69% belowthe current emissions level. But the president’s cap is 200%higher than the emissions limit that would be achieved undercurrent law.
41
FA
CT
The President’s plan is weaker than the laws it would eliminate.

Under President Bush’s plan, final pollution reductions for the
three pollutants covered by his proposal would not be achieved
until 2018. Existing laws, however, would produce even deeper
reductions up to a decade sooner: Caps for nitrogen oxides would
be met by 2010; sulfur dioxide by 2012; and mercury by 2008.
POWER PLANT CLEANUP: MYTHS AND FACTS42
FA
CT The president’s plan would delay pollution reductions
up to 10 years.
Clean Air Act(existing programs)
1
Bush “ClearSkies” Plan
(two-step approach)5
Increase allowedby Bush plan over
Clean Air Actexisting programs
(by 2018)6
% increase allowedby Bush plan over
Clean Air Act existing programs
(by 2018)
Delay allowed byBush plan overClean Air Act
existing programs
1.25 million toncap by 20102
2.1 million toncap by 2008
1.7 million toncap by 2018
450,000 tonsmore NOx
36% moreNOx
8-year delay
2 million ton cap by 20123
4.5 million toncap by 2010
3 million ton capby 2018
1 million tonsmore SO2
50% moreSO2
6-year delay
Maximum emis-sion of 5 tons
per year by 20084
Maximum emis-sion of 26 tons
per year by 2010
Maximum emis-sion of 15 tons
per year by 2018
10 tons more Hg
200% more Hg
10-year delay
No Limit
No Limit
No Limit
NITROGEN OXIDES(NOx)
SULFUR DIOXIDE(SO2)
MERCURY(Hg)
CARBON DIOXIDE(CO2)
F IGURE 10— Comparison of Bush Administration “Clear Skies”Power Plant Initiative With Existing Clean Air Act Programs

POWER PLANT CLEANUP: MYTHS AND FACTS
Both EPA and the U.S. Department of Energy (DOE) have ana-
lyzed the cost of implementing cleanup legislation. Although
their calculations have been criticized for inflating costs, the
agencies’ estimates show that including carbon dioxide in the
plan is only slightly more costly than excluding it.6
(1) The EPA calculated that costs of making significant CO2
reductions from power plants were “negligible for all cases, and
may even result in economic benefits.”7 A similar analysis by
DOE also found that such costs were negligible.8
43
POWER PL ANT CLEANUP COSTS7
MY
TH
FA
CT
Carbon dioxide cannot be included in cleanup legislation
because it will be too expensive for plant owners and
consumers.
Studies by EPA and the Department of Energy show that it can
be affordable to include carbon dioxide in cleanup legislation.

(2) Costs of reducing CO2 emissions from power plants would be
still lower than EPA and DOE project, if flawed assumptions by
each were corrected. For instance:
• Both DOE and EPA overstate the costs of reducing CO2 emis-
sions by attributing construction costs for new natural gas plants
to CO2 reductions rather than to basic market demand for
electricity. In fact, about 42% of additional required electricity
capacity is already either in operation or under construction.9
Therefore, if new natural gas plants are being built to meet mar-
ket demand and are expected to be profitable at market rates,
then their construction costs won’t increase future production
costs for electricity.
• According to the DOE and EPA analyses, total reduction costs
for carbon dioxide reflect the price of tradable emissions per-
mits. However, EPA has historically overestimated the cost of
permits under a “cap and trade” scheme. For instance, when
the Acid Rain Program was proposed in 1990, EPA overestimat-
ed the actual cost of SO2 permits by more than a factor of five.10
After years of experience implementing this program, EPA
acknowledged, “independent studies show that real-life experi-
ences with the program reveal greater cost savings than initially
expected, due in large part to the efficiencies achieved through
emissions trading.”11 It is reasonable, therefore, to expect that
actual permit prices for CO2 credits would be significantly
lower than EPA’s projections.
(3) Finally, under every scenario modeled by DOE, additional
energy efficiency combined with increases in the percent of
electricity generated from renewable sources (e.g., wind, solar,
POWER PLANT CLEANUP: MYTHS AND FACTS44

POWER PLANT CLEANUP: MYTHS AND FACTS
• The DOE projects that U.S. consumption of natural gas will be
33.8 trillion cubic feet (tcf) per year in 2020 under a “business
as usual” scenario that takes into account various growth fac-
tors.13 Some electric utilities claim that a cap on CO2 emissions
will result in a precipitous rise in natural gas consumption if
they are required to switch from coal to a fuel source such as
natural gas with lower CO2 emissions. The DOE calculates,
45
NATURAL GAS AND THE DEMAND FOR CLEAN ENERGY
8
MY
TH
FA
CT
The U.S. does not have adequate supplies of natural gas to meet
increased demand if power plants are required to reduce carbon
dioxide emissions.
Government data show that the U.S. has abundant natural gas
supplies more than adequate to meet future demand, even if
power plants are required to reduce CO2 emissions.
biomass, and geothermal energy) further reduce CO2 emissions
from the power sector and cut costs to consumers by about 16%
compared with the less efficient business-as-usual scenarios that
rely more heavily on fossil fuels.12

however, that consumption of natural gas will increase less
than 10% above business as usual by 2020 if power plant
carbon dioxide emissions are capped as part of multi-pollutant
legislation.14
• Natural gas supplies–both domestic and imported–are more
than adequate to meet the increase in consumption projected
to occur with a CO2 cap for power plants. According to the
National Petroleum Council, U.S. onshore and offshore natural
gas reserves total 1,779 trillion cubic feet (tcf), equal to a 52.6-
year supply at 2020 demand levels.15 If a cap on CO2 emissions
from power plants were to take effect, the additional consump-
tion of natural gas would mean a 48-year supply at 2020
demand levels–only a few years less than with no cap.16
• DOE also projects that the additional demand for natural gas
due to a cap on CO2 emissions will be met through higher
imports and increases in domestic production.17 Total domestic
production in 2020 is projected to be 1.3 trillion cubic feet
higher with a cap on CO2 emissions from power plants. In
addition, DOE projects that there will be significant growth in
natural gas imports both from Mexico and other countries
such as Canada, Algeria, and Australia.18
POWER PLANT CLEANUP: MYTHS AND FACTS46

POWER PLANT CLEANUP: MYTHS AND FACTS
There are many ways that coal-fired power plants can comply
with CO2 reductions without having to abandon coal: (1) pur-
chase CO2 credits from other utilities through the cap-and-trade
program; (2) employ advanced coal technologies to reduce CO2
output or even capture CO2 before it leaves the plant; and (3)
reduce CO2 emissions by increasing energy efficiency.
Trading Carbon Emissions Credits
Under an emissions cap-and-trade system, individual power
plants can comply with the CO2 cap either by reducing pollution
at their plants (for instance, by installing pollution controls or
switching to less-polluting fuels) or by “trading,” purchasing
emissions allowances from other plants that have reduced emis-
sions below their required limit. In this way, individual plants can
47
THE FUTURE OF COAL9
MY
TH
FA
CT
Deep cuts in emissions of pollutants from power plants–
especially carbon dioxide–will drastically reduce or even
eliminate coal as a source of electricity.
Coal-fired power plants have a number of options for meeting
CO2 reduction targets, all of which allow for the continued use
of this fuel source.

make the decision that is most economically efficient, given the
unique characteristics of each plant (e.g., age, size, fuel use, cost
of adding pollution controls, etc.). Many coal-fired power plants
will be able to satisfy a significant portion of their CO2 reduction
obligations through the purchase of emissions allowances gener-
ated by other plants that install pollution controls or switch to
lower carbon fuels. The plants selling credits also earn revenue
from the transaction.
Advanced Coal Technologies
While some in the electric industry claim that there are no tech-
nologies available to coal-fired power plants for reducing CO2,
the coal industry’s own advisory council says that viable, commer-
cially available technology can substantially reduce CO2 emissions
from coal-fired power plants.
Increasing Electricity Availability From Coal-Fired Generation in the
Near-Term (May 2001), a publication of the National Coal
Council, points to a proven advanced technology–“Integrated
Gasification Combined Cycle” (IGCC) steam turbines. IGCC
converts coal to a gas and then burns it in a state-of-the-art
combined cycle turbine to generate electricity (similar to
turbines used by the cleanest natural gas-fired power plants
today). Current IGCC technology is capable of reducing CO2
emissions by 23% over conventional coal-fired power plants,
and reductions are expected to reach 57% as the technology
improves.19 Thus, coal can remain an important part of our ener-
gy future–even with a cap on CO2 emissions from power plants.
POWER PLANT CLEANUP: MYTHS AND FACTS48

POWER PLANT CLEANUP: MYTHS AND FACTS
Energy Efficiency
If every coal or natural gas fired plant in the U.S. operated 5%
more efficiently, greenhouse gas emissions in 2010 could be cut
by nearly 40 million metric tons of carbon, approximately 10%
of the total reduction target the U.S. negotiated under the 1997
Kyoto climate change agreement.20
Today, power plants are only about 33% efficient.21 U.S. DOE
and the Office of Technology Assessment (OTA) examined
potential improvements in power plant efficiency and deter-
mined that a 5% increase in efficiency could be achieved at little
or no cost to utilities because efficiency improvements pay for
themselves over time.22
If such efficiencies are feasible and cost-effective, why haven’t
they been implemented before now? One reason is that electric
utilities pass increases in the price of fuel directly on to con-
sumers. This has eliminated the market incentive that drives
nearly every other industry to conserve raw materials. Another
reason is more generic to industry as a whole: There is a reluc-
tance to invest in improvements that have more than a two-year
payback.23 While some efficiency measures easily meet this target,
others do not. Recently, however, there have been signs that
some businesses are beginning to implement energy efficiency
improvements with paybacks as long as five years.24
49
POWER PLANT CLEANUP: MYTHS AND FACTS50
MY
TH
FA
CT
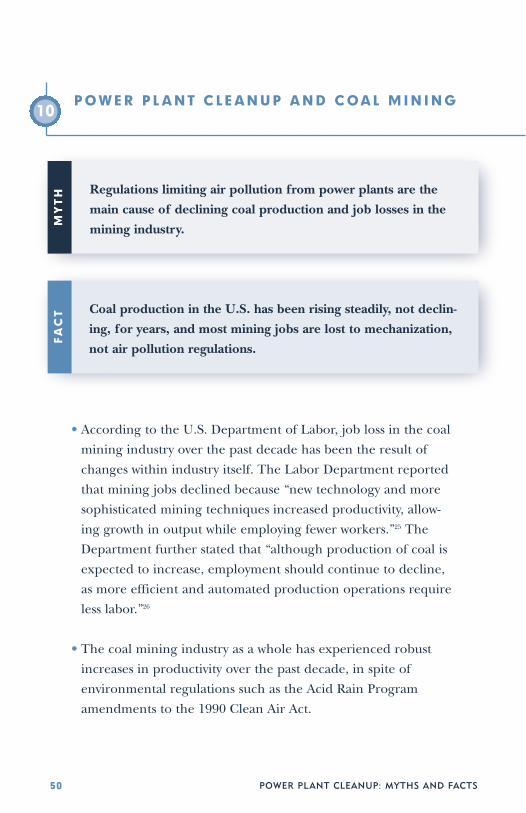
Regulations limiting air pollution from power plants are the
main cause of declining coal production and job losses in the
mining industry.
Coal production in the U.S. has been rising steadily, not declin-
ing, for years, and most mining jobs are lost to mechanization,
not air pollution regulations.
POWER PL ANT CLEANUP AND COAL MINING10
• According to the U.S. Department of Labor, job loss in the coal
mining industry over the past decade has been the result of
changes within industry itself. The Labor Department reported
that mining jobs declined because “new technology and more
sophisticated mining techniques increased productivity, allow-
ing growth in output while employing fewer workers.”25 The
Department further stated that “although production of coal is
expected to increase, employment should continue to decline,
as more efficient and automated production operations require
less labor.”26
• The coal mining industry as a whole has experienced robust
increases in productivity over the past decade, in spite of
environmental regulations such as the Acid Rain Program
amendments to the 1990 Clean Air Act.

POWER PLANT CLEANUP: MYTHS AND FACTS 51
F IGURE 11— U.S Coal Mining Productivity by Type of Mine, 1990-200027
12
10
8
6
4
2
0
SURFACE
TOTAL
UNDERGROUND
SH
OR
T TO
NS
PE
R M
INE
R P
ER
HO
UR
1990 1992 1994 1996 1998 2000
• The steady growth in productivity for coal is expected to con-tinue into the future. For instance, in 2000, the industry pro-duced 22.58 quadrillion Btu (British thermal units) worth ofenergy from coal. The U.S. Department of Energy predicts thatnumber will grow to 26.88 quadrillion Btu by 2020 under a scenario of low economic growth and to 30.08 quadrillion Btuwith high growth, an increase of as much as 25%.28
• Coal consumption in the U.S. continued to rise throughout the1990s, in spite of the sulfur dioxide reductions called for by theClean Air Act Acid Rain Program.

• Although the Labor Department claims that stricter environ-mental regulations for electric power plants have the potentialto induce plants to replace coal with cleaner fuels, it acknowl-edges that recent improvements in clean coal technologiessuch as integrated gasification combined cycle (IGCC) willallow utilities to continue burning coal.30
• Finally, in key coal-mining and coal-consuming states likeKentucky and Ohio, the majority of residents do not believethat environmental regulations are to blame for the decline incoal industry jobs. Rather, most say that jobs have been lostmainly because companies have replaced workers withmachines that can do the same tasks.
POWER PLANT CLEANUP: MYTHS AND FACTS52
F IGURE 12— Coal Consumption by Sector, 1989-199929
1,200
1,000
800
600
400
200
0
U.S. TOTAL
RESIDENTIAL/COMMERCIAL AND OTHER INDUSTRIAL
ELECTRIC POWER
MIL
LIO
N S
HO
RT
TON
S
1989 1991 1993 1995 1997 1999
COKE PLANTS

POWER PLANT CLEANUP: MYTHS AND FACTS
—In Kentucky, only 16% of residents surveyed blamed environ-mental regulations for lost coal jobs; nearly two-thirds (64%)said job loss was due to workers being replaced by machines.31
—Only 16% of residents surveyed in Ohio blamed environ-mental regulations for a loss of coal industry jobs; 63% saidmechanization was the reason.32
53
POWER PL ANT CLEANUP AND REL IABLEELECTR IC ITY SUPPL IES
11
MY
TH
FA
CT
Reducing carbon dioxide pollution from power plants is too
risky at this time, because it could discourage the development
of new power plants needed to ease America’s “energy crisis.”
America is not in an energy crisis: New power plants are being
built at a record pace. The industry is investing in more new
electric generating capacity now than at any time in history, and
can provide more than enough power to meet future needs.
The notion that electricity shortages might result if utilities were
required to reduce carbon dioxide emissions gained national
prominence in March 2001. At that time, California’s electricity
crisis was at its peak.

Less than six months after declaring a crisis, however,
California’s problems were over, and many analysts predicted
that the U.S. might be building too much new power capacity.
U.S. Energy Secretary Spencer Abraham acknowledged early in
2002 that the fears of an energy crisis had passed, and that
America was in an unprecedented period of adding new electric
generating capacity.
In fact, 74,527 MW of new generating capacity has been built
since 1998. As of October 2001, 105,324 MW of new generating
capacity is under construction, and an additional 79,902 MW of
capacity is under development to go on line by 2006. Annual
capacity additions are projected to continue rising to over 60,000
MW of new capacity per year in 2002 and 2003. This is more new
capacity than was added in the entire decade of the 1990s.
F IGURE 13— Electric Generating Capacity Added -1990-200033
POWER PLANT CLEANUP: MYTHS AND FACTS54
25,000
20,000
15,000
10,000
5,000
0
MW
YEAR
1990 1991 1992 1993 1994 1995 1996 1997 1998 1999 2000
SOURCE: EIA

POWER PLANT CLEANUP: MYTHS AND FACTS 55
F IGURE 14— Historical vs. Projected Growth in Generating Capacity:1990–200634
F IGURE 15— Current and Projected Electrical Capacity Reserve Margins35
80,000
70,000
60,000
50,000
40,000
30,000
20,000
10,000
0
MW
YEAR
1990 1991 1992 1993 1994 1995 1996 1997 1998 1999 2000 2001 2002 2003 2004 2005 2006
SOURCE: EIA, RDI/NORTHBRIDGE
■ Historical Data ■ Projected Growth
Limit of activeproject planning
horizon.
40%
35%
30%
25%
20%
15%
10%
5%
0
-5%
MW
ECAR ERCOT FRCC MAAC MAIN MAPP NPCC NEPOOL NYPP SERC SPP WSCC
■ 2001 ■ 2006

POWER PLANT CLEANUP: MYTHS AND FACTS56
“Just months after the Bush administration painted a picture of
shortages and called for a power plant a week to be built for the
next 20 years, power prices are falling, industry analysts are warning
of a surplus of electricity in parts of the country and some compa-
nies are reconsidering their plans to build new plants.”
“As Prices Fall, Utilities Weigh the Economics of New Plants,”
The New York Times, August 22, 2001.
“Consider what did not happen in 2001. Gasoline prices did not
surge; they dropped. Electricity prices did not continue climbing;
they dropped. Natural gas prices did not increase; they dropped. In
the face of Enron’s collapse, the largest bankruptcy in U.S. history,
there were no price spikes, no trading panics, no electricity outages
and no gas shortages. On the contrary, we’ve added some 51,000
megawatts of electricity this year and some 99,000 are scheduled to
come on line in 2002. That’s more power added to our economy
than at any time in history.”
Energy Secretary Spencer Abraham, “Deregulation Is Working,” The Washington
Post, January 14, 2002.

POWER PLANT CLEANUP: MYTHS AND FACTS
ENDNOTES1 Remarks by President Bush at National Oceanographic and Atmospheric Administration,
“U.S. Environmental Policy,” February 14, 2002; http://www.whitehouse.gov/news/releases/2002/02/20020214-5.html.
2 Ibid.
3 U.S. EPA, “Discussion of Multi-Pollutant Strategy,” Meeting with Edison Electric Institute,September 18, 2001; “Comparison of Requirements Under Business-as-Usual and theStraw Proposal,” p. 10; http://www.cleartheair.org/currentstatus.pdf. EPA prepared thisanalysis for the Edison Electric Institute, a consortium of the nation’s electric utilities.The analysis compares EPA’s “straw” proposal for power plant cleanup (an earlier andmore stringent version of the “Clear Skies” plan) with the level of cleanup that wouldoccur if existing Clean Air Act programs were fully implemented (the so-called “businessas usual” scenario). Although EPA’s straw proposal was ultimately rejected by the WhiteHouse in favor of the weaker “Clear Skies” plan, EPA’s “business as usual” analysisremains as a valid measure of emissions caps that would result if current Clean Air Actprograms were fully implemented.
4 Ibid. See Figure 10 for a comparison of “Clear Skies” emissions caps and Clean Air Act“business-as-usual” emissions caps.
5 There will be increases in emissions under the Bush “Clear Skies” plan from emissionsthat would occur under the Clean Air Act “business-as-usual” scenario, because theBush plan replaces existing Clean Air Act programs rather than supplementing them. Inhis speech announcing the power plant cleanup plan, the president confirmed that “theClean [sic] Skies legislation … will replace a confusing, ineffective maze of regulationsfor power plants …”; http://www.whitehouse.gov/news/releases/2002/02/ 20020214-5.html.In testimony before Congress in July 2001, EPA Administrator Whitman confirmed thatthe administration’s power plant cleanup program would replace rather than supplementexisting Clean Air Act programs. See http://www.senate.gov/~epw/whitman_0726.htm.
6 U.S. EPA, Analysis of Multi-Emissions Proposals for the U.S. Electricity Sector(Requested by Senators Smith, Voinovitch and Brownback), November 1, 2001;http://www.epa.gov/air/meproposalsanalysis.pdf. In this analysis, EPA looked only atSO2, NOX, and mercury control costs and found that reductions of these pollutantscaused little or no increase in electricity prices. EPA stated, “The impact of the policieson wholesale power price is small, ranging from 0.5 mills/kwh to 0.7 mills/kwh, or 1.9%to 2.4% respectively. The percentage impact on consumers would be less, reflecting theother components of consumer price not affected by these scenarios.” Ibid., p. 14. Thehigh end of the price increase range (0.7 mills/kwh) applied to a projected average resi-dential electricity bill in 2010, based on Department of Energy sales and price forecasts,adds 73 cents to the monthly bill. It is difficult to calculate additional costs from CO2
reductions, because neither EPA nor the Department of Energy has analyzed CO2 costsindependently of other pollution reduction costs. Both EPA and DOE analyze CO2 reduc-tions as part of an overall package that includes reductions of SO2, NOX, and mercury. Indoing so, however, both agencies recognize that steps for reducing CO2 will also reduceemissions of the other pollutants. DOE states, for example, that “the cost for NOX emis-sion allowances is expected to decline to zero by 2010 because the actions taken to[reduce CO2] result in [lower] NOX emissions.” U.S. Department of Energy, Analysis ofStrategies for Reducing Multiple Emissions from Electric Power Plants with AdvancedTechnology Scenarios, October 2001, pp. 23-24;http://www.eia.doe.gov/oiaf/servicerpt/eppats/pdf/sroiaf(2001)05.pdf.
57

7 U.S. EPA, Economic Analysis of a Multi-Emissions Strategy, prepared for SenatorsJames M. Jeffords and Joseph I. Lieberman, October 31, 2001, p. 27;http://www.epa.gov/air/jeffordslieberm.pdf. The reduction target analyzed by EPA was 58million metric tons of carbon by 2020.
8 U.S. Department of Energy, Analysis of Strategies for Reducing Multiple Emissions fromElectric Power Plants with Advanced Technology Scenarios, October 2001, p. 29, Table8; http://www.eia.doe.gov/oiaf/servicerpt/eppats/pdf/sroiaf(2001)05.pdf
9 Clean Air Task Force, Scraping the Bottom of the Barrel for Power: Why There Is NoNeed to Relax Clean Air Safeguards on Dirty Power Plants to “Keep the Lights On,”November 8, 2001; http://cta.policy.net/relatives/18560.pdf. See Appendix A, “ElectricPower New Capacity Additions Update,” Erin O’Neill, The NorthBridge Group, October31, 2001, p. 3, figure 2 (“U.S. Historic and Projected Capacity Additions”).
10 U.S. EPA, Progress Report on the EPA Acid Rain Program, November 1999, p. 4;http://www.epa.gov/airmarkets/progress/arpreport/acidrainprogress.pdf.
11 Ibid.
12 U.S. Department of Energy, Analysis of Strategies for Reducing Multiple Emissions fromElectric Power Plants with Advanced Technology Scenarios, October 2001, p. xiv, TableE2; http://www.eia.doe.gov/oiaf/servicerpt/eppats/pdf/sroiaf(2001)05.pdf.
13 U.S. Department of Energy, Annual Energy Outlook 2002 with Projections to 2020,December 2001, p. 4; http://www.eia.doe.gov/oiaf/aeo/pdf/0383(2002).pdf.
14 U.S. Department of Energy, Analysis of Strategies for Reducing Multiple Emissions fromElectric Power Plants with Advanced Technology Scenarios, October 2001, p. xiv, TableES2; http://www.eia.doe.gov/oiaf/servicerpt/eppats/pdf/sroiaf(2001)05.pdf. Compare pri-mary energy consumption of natural gas under the 2020 reference case with emissionslimits and without emissions limits.
15 National Petroleum Council, Meeting the Challenge of the Nation’s Growing Natural GasDemand, December 1999, p.39, Table 3; http://www.npc.org/reports/ReportVol1.pdf.Total proved and additional assessed natural gas supplies equal 1,466 tcf for the lower48 states and 313 tcf for Alaska, for a total of 1,779 tcf for the U.S., as of 1999.
16 Ibid., footnotes 14 and 15. If, as DOE states, natural gas consumption will be 33.8 tcf by2020 without a CO2 cap and 10% higher with a CO2 cap, then natural gas consumptionwill increase to 37.18 tcf by 2020 with a cap. If, as National Petroleum Council states,natural gas supplies are currently (as of 1999) 1,779 tcf, then there will be an approxi-mately 48-year supply of natural gas with a CO2 cap, as opposed to 52.6 years without aCO2 cap.
17 U.S. Department of Energy, Analysis of Strategies for Reducing Multiple Emissions fromElectric Power Plants with Advanced Technology Scenarios, October 2001, pp. 25-26;http://www.eia.doe.gov/oiaf/servicerpt/eppats/pdf/sroiaf(2001)05.pdf.
18 Ibid.
19 R.H. Williams, Advanced Energy Supply Technologies, Chapter 8, “World EnergyAssessment: Energy and the Challenge of Sustainability,” United Nations DevelopmentProgramme, 2000.
POWER PLANT CLEANUP: MYTHS AND FACTS58

POWER PLANT CLEANUP: MYTHS AND FACTS
20 National Environmental Trust, Powering the Future: Clean Energy for a CleanEnvironment, 1997. This report uses U.S. EPA and U.S. DOE data to calculate emissionrates for power plants. The average emissions rates (lb CO2/MWh) vary tremendouslyfor coal and for natural gas, as much as 40%. On average, coal-fired plants emit 2,300lb/MWh, and natural gas-fired plants emit 1,300. Given the current amounts of genera-tion from each fuel, a 5% increase in efficiency means 40 million metric tons of carbonequivalent (MMtC) not released into the atmosphere. This is approximately 10% of theU.S. reduction goal under the Kyoto Protocol. For a copy of this report, contact NationalEnvironmental Trust, 202-887-8800.
21 Coal-fired power plants are approximately 33% efficient, on average. This means thatonly 33% of the energy potentially obtained from burning the coal is actually convertedto electricity. U.S. Department of Energy, Office of Energy Efficiency and RenewableEnergy, Scenarios of U.S. Carbon Reductions: Potential Impacts of Energy Technologiesby 2010 and Beyond (Report # ORNL/CON-444, Washington, DC, 1997), pp. 7.28-7.29.
22 Ibid.
23 Capital improvements other than new construction typically require a two-year paybackperiod before investment will occur. New Jersey Department of EnvironmentalProtection, Evaluation of the Effectiveness of Pollution Prevention Planning in NewJersey, May 1996. Companies, however, capitalize new construction and new processesover 20 years or more. Many energy efficiency projects have paybacks longer than twoyears, especially if new equipment is involved. In general, companies choose to treatenergy efficiency as any other capital investment, rather than giving it the status of agenuine process upgrade; consequently, it won’t necessarily get done.
24 For example, see F. Irwin et al., Taking a Byte out of Carbon: Electronics Innovation forClimate Protection. World Resources Institute, 1998.
25 U.S. Department of Labor, Bureau of Labor Statistics, Mining and Quarrying website.See Nature of Industry; http://www.bls.gov/oco/cg/cgs004.htm#nature; and Outlook;http://www.bls.gov/oco/cg/cgs004.htm#outlook.
26 Ibid.
27 U.S. Department of Energy, Coal Industry Annual 2000, 2000, p. 63, figure 5;ftp://ftp.eia.doe.gov/pub/pdf/coal.nuclear/05842000.pdf.
28 U.S. Department of Energy, Annual Energy Outlook 2002 with Projections to 2020,December 2001, p. 7, Table 1; http://www.eia.doe.gov/oiaf/aeo/pdf/0383(2002).pdf.
29 U.S. Department of Energy, U.S. Coal Supply and Demand: 2000 Review, 2000, p. 6,fig. 5; http://www.eia.doe.gov/cneaf/coal/page/special/feature.pdf.
30 U.S. Department of Labor, Bureau of Labor Statistics, Mining and Quarrying website.See Outlook; http://www.bls.gov/oco/cg/cgs004.htm#outlook.
31 The Mellman Group, Inc., “Kentucky 4th Congressional District Voter Attitudes TowardClean Air Regulations,” September 4, 1998. The Mellman Group designed and adminis-tered this survey conducted by professional interviewers. The survey interviewed 400likely November 1998 voters in Kentucky’s 4th Congressional District. The survey wasconducted between August 19 and 22, 1998. The margin of error is +/- 4.9 percentagepoints at the 95% confidence level. A copy is available from National EnvironmentalTrust, 202-887-8800.
59

32 The Mellman Group, Inc., “Ohio 6th Congressional District Voter Attitudes Toward CleanAir Regulations,” September 8, 1998. The Mellman Group designed and administeredthis survey conducted by professional interviewers. The survey interviewed 400 likelyNovember 1998 voters in Ohio’s 6th Congressional District. The survey was conductedbetween August 25 and 27, 1998. The margin of error is +/- 4.9 percentage points at the95% confidence level. A copy can be obtained from National Environmental Trust, 202-887-8800.
33 Clean Air Task Force, Scraping the Bottom of the Barrel for Power: Why There Is NoNeed to Relax Clean Air Safeguards on Dirty Power Plants to “Keep the Lights On,”November 8, 2001; http://cta.policy.net/relatives/18560.pdf. See Appendix A, “ElectricPower New Capacity Additions Update,” Erin O’Neill, The NorthBridge Group, October31, 2001 (“U.S. Historic and Projected Capacity Additions”). New generation projectionsin this “Update” are based on a forecast prepared by The NorthBridge Group.Information on plants under construction or in the development process used to preparethis forecast comes from the October update of “NEWGen” database maintained byResource Data International (RDI). The process for siting, permitting, and constructing anew power plant typically takes four to five years. The status of plants in the earlystages of this process is less certain than those in advanced stages of development.Thus, new power plant development projections can only be made based on currentmarket activity through about 2004-6.
34 Ibid.
35 Ibid.
POWER PLANT CLEANUP: MYTHS AND FACTS60

POWER PLANT CLEANUP: MYTHS AND FACTS
F IGURE 10
1 U.S. EPA, “Discussion of Multi-Pollutant Strategy,” Meeting with EEI, September 18,2001; “Comparison of Requirements Under Business-as-Usual and the Straw Proposal,”p. 10; http://www.cleartheair.org/currentstatus.pdf.
2 Ibid. EPA projects that measures to implement the national ambient air quality standard(“NAAQS”) for ground-level ozone will lead to a cap on power plant nitrogen oxide (NOx)emissions of 1.09 million tons per year in the so-called “OTAG” region by 2010. “OTAG”is the “Ozone Transport Assessment Group” and covers 37 states in the eastern half ofthe country. EPA’s analysis does not calculate what the cap will be for the entire country.However, informal discussions with EPA air quality officials have indicated that thenationwide cap on power plant NOx emissions by 2010 will be 1.25 million tons per yearunder existing CAA programs.
3 Ibid, p. 10. Sulfur dioxide is the primary cause of fine particulate matter pollution. EPAprojects that, in order to meet national ambient air quality standards for fine particulatematter (the “PM 2.5 NAAQS”) by 2012, a 2 million ton per year cap on power plant sulfurdioxide emissions will be necessary.
4 U.S. EPA, presentation on Section 112 “Maximum Achievable Control Technology”(MACT) rule for mercury, December 4, 2001; http://www.cleartheair.org/epamercury.pdf.EPA’s analysis shows that the Clean Air Act’s MACT rule for mercury will result in a 5 tonper year mercury emissions rate for the electric utility industry. See U.S. EPA presenta-tion, pp. 4-6, where EPA states “If we did MACT now for coal and … if we subcatego-rized by coal type … this would result in … tons emitted under MACT … total ~ 5.”
5 See White House, “Fact Sheet: President Bush Announces Clear Skies & GlobalClimate Change Initiatives”; http://www.whitehouse.gov/news/releases/2002/02/20020214.html.
6 There will be increases in emissions under the Bush plan from emissions that wouldoccur under the Clean Air Act “business as usual” scenario because the Bush planreplaces existing Clean Air Act programs rather than supplementing them. In his speechannouncing the power plant cleanup plan, the president confirmed that “[t]he CleanSkies legislation … will replace a confusing, ineffective maze of regulations for powerplants”; http://www.whitehouse.gov/news/releases/2002/02/20020214-5.html. In testimony before Congress in July 2001, EPA Administrator Whitman confirmed that theadministration’s multi-pollutant program would replace rather than supplement existingClean Air Act programs. See: http://www.senate.gov/~epw/whitman_0726.htm
61

HEALTH AND ENVIRONMENTAL IMPACTS62

Of all the reasons driving policy makers to
develop plans for cleaning up power plants,
the most compelling is the growing body of
scientific evidence linking harmful air
pollution from these plants with damage
to human health and the environment.
Heading the list of adverse effects are global
warming, asthma attacks, acid rain, and pre-
mature death. Recent studies show that sig-
nificant reductions in major air pollutants
from power plants–specifically sulfur diox-
ide, nitrogen oxides, carbon dioxide, and
mercury–will lead to major improvements
in public health and environmental quality.
63
Health andEnvironmental ImpactsIV

Scientific studies show that there are serious and wide-ranging
health consequences from exposure to sulfur dioxide and nitro-
gen oxides. Unfortunately, millions of Americans regularly
breathe unhealthy levels of these contaminants.
Power plant emissions of sulfur dioxide and nitrogen oxides
alone are responsible each year for an estimated:
• 30,100 deaths
• 20,100 hospitalizations
• 603,000 asthma attacks
• 5,130,000 lost workdays due to illness1
Power Plants and Death
Scientists have been able to demonstrate a link between air
pollution from particular power plants and serious health effects,
including premature death. For example, researchers at the
Harvard School of Public Health found that air pollution from
a group of power plants in the Chicago area was responsible for
approximately 400 deaths per year. The study found that clean-
ing up emissions from these plants would save approximately 300
lives per year. This important research was reported in a publica-
tion of the Harvard Center for Risk Analysis under its former
HEALTH AND ENVIRONMENTAL IMPACTS64
HARM TO HUMAN HEALTH12

HEALTH AND ENVIRONMENTAL IMPACTS
director, John Graham. Graham later joined the Bush adminis-
tration as head of the Office of Information and Regulatory
Affairs in the White House Office of Management and Budget.2
Death due to fine particle pollution from power plants, most fre-
quently affecting the elderly, follows days when pollution levels
are high. Research shows that people living in areas with elevated
levels of fine particle soot die months or years earlier than they
otherwise would. Death rates in these areas usually remain high
for weeks or months following periods of increased pollution.
Studies also show that cleaning up sulfur dioxide and nitrogen
oxide emissions from power plants would have enormous public
health benefits each year, including:
• 18,700 lives saved
• 366,000 fewer asthma attacks
• 12,200 fewer hospitalizations
• $100 billion savings from reduced illness and death3
Other recent research has shown that ozone caused by nitrogen
oxides from power plants and other sources not only triggers
asthma attacks but may also contribute to the onset of asthma
in healthy children. A new study by the California State Air
Resources Board and the University of Southern California
points strongly to ozone as a cause in the development of asthma
65

in young people who did not previously have the disease.4
Researchers found that children living in communities with high
ozone levels who played three or more sports developed asthma
at a rate three times higher than those in low ozone areas.
Because participation in very physical sports can result in a child
drawing up to 17 times the “normal” amount of air into the
lungs, young athletes are more likely to develop asthma.
Health Impacts Are Worst Near Power Plants
During the summer of 2000 (the most recent year for which data
are available), the health-based standard for ozone smog was
exceeded in 39 states and the District of Columbia. In all, there
were more than 4,000 violations of the federal health standard
for ozone in 2000.5 There is a strong correlation between high
concentrations of ozone smog and proximity to power plants,
especially in the Midwest and Southeast, where roughly 60% of
the nation’s coal-fired power plants are located. In the Ohio
HEALTH AND ENVIRONMENTAL IMPACTS66

HEALTH AND ENVIRONMENTAL IMPACTS
Valley, for example, emissions from coal- and oil-fired power
plants account for nearly 50% of elevated ozone levels in the
valley, enough by themselves to cause violations of the federal
health standard for this pollutant.8
Likewise, the areas with the highest concentrations of fine parti-
cle pollution are also the ones with the greatest number of coal-
67
Air Pollution from Power Plants Harms Public Health
Fine Particle Soot: When power plants burn coal, they
produce sulfur dioxide that forms fine particles that are
extremely harmful to human health. These particles can be
inhaled deeply into the lungs where they lodge, causing
severe damage, including asthma attacks, respiratory
illness, and premature death. Sulfur dioxide from power
plants is the leading cause of fine particle soot in the
eastern half of the U.S.6
Ozone Smog: Power plants produce nitrogen oxides that are
transformed into ozone smog on hot summer days, resulting
in “code red” conditions in cities and towns throughout the
U.S. Ozone smog causes respiratory damage ranging from
temporary discomfort to asthma attacks and long-term,
permanent lung damage. Coal-burning power plants
produce more nitrogen oxide pollution than any other
industrial source.7

fired power plants. In the map, the areas with the highest con-
centration of deadly particle pollution also contain the greatest
number of coal-burning power plants.
Recent studies by researchers at the Harvard School of Public
Health have established that people who live within a 30-mile
radius of certain large, coal-fired power generators are three to
four times more likely to die from air pollution than people who
live 30 miles or more from these plants.9
HEALTH AND ENVIRONMENTAL IMPACTS68
F IGURE 16—Correlation of Deaths From Power Plant Air Pollution andLocation of Coal-Fired Power Plants
2
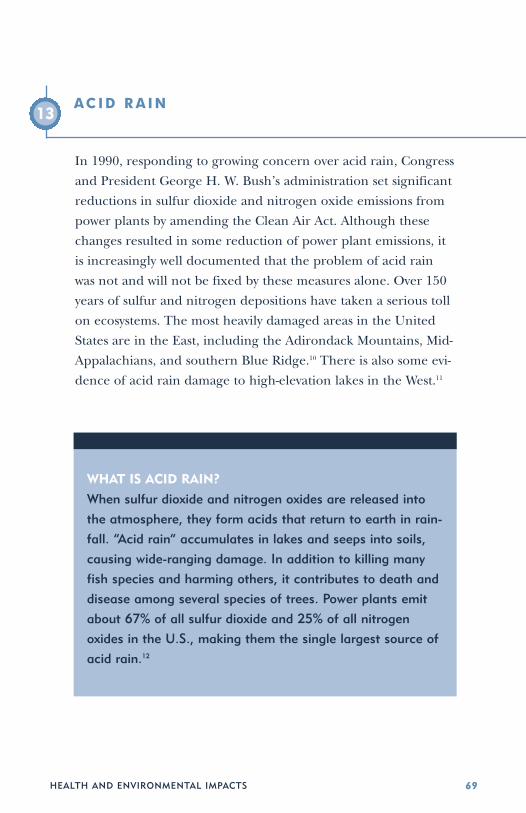
HEALTH AND ENVIRONMENTAL IMPACTS
In 1990, responding to growing concern over acid rain, Congress
and President George H. W. Bush’s administration set significant
reductions in sulfur dioxide and nitrogen oxide emissions from
power plants by amending the Clean Air Act. Although these
changes resulted in some reduction of power plant emissions, it
is increasingly well documented that the problem of acid rain
was not and will not be fixed by these measures alone. Over 150
years of sulfur and nitrogen depositions have taken a serious toll
on ecosystems. The most heavily damaged areas in the United
States are in the East, including the Adirondack Mountains, Mid-
Appalachians, and southern Blue Ridge.10 There is also some evi-
dence of acid rain damage to high-elevation lakes in the West.11
69
ACID RAIN13
WHAT IS ACID RAIN?
When sulfur dioxide and nitrogen oxides are released into
the atmosphere, they form acids that return to earth in rain-
fall. “Acid rain” accumulates in lakes and seeps into soils,
causing wide-ranging damage. In addition to killing many
fish species and harming others, it contributes to death and
disease among several species of trees. Power plants emit
about 67% of all sulfur dioxide and 25% of all nitrogen
oxides in the U.S., making them the single largest source of
acid rain.12

Acid rain causes a swath of damage from
Maine to the Carolinas.13
Maine: Acid rain has contributed to the decline of Atlantic
salmon, with the greatest impact on young fish.14
New York and New England: Forty-one percent of lakes in
New York’s Adirondacks and 15% of lakes in New England
are either chronically or periodically acidic. Nearly 25% of
surveyed lakes in the Adirondacks do not support any fish,
and many others have less aquatic life and reduced species
diversity when compared with less acidic lakes.15 Acid rain is
also the major cause of red spruce death in New York.16
Pennsylvania: Acid rain has reduced fish diversity in north-
west Pennsylvania17 and is associated with the deterioration
and death of sugar maples and red oaks.18
Virginia: Streams in Shenandoah National Park frequently
receive rainfall that is as acidic as lemon juice.19 American
Rivers, for example, placed Paine Run River on its “Most
Endangered” list in 2001 because, without further cuts in
air pollution, it will become too acidic to sustain brook trout
and other aquatic life. Overall, 30% of trout streams in
Virginia are acidic, making them either marginal or unsuit-
able for brook trout.20
North Carolina and Tennessee: Many high-elevation streams
in the Great Smoky Mountains are acidic.21 Acid rain is also
making forest soil chemically imbalanced, endangering
high-altitude forests.22
HEALTH AND ENVIRONMENTAL IMPACTS70
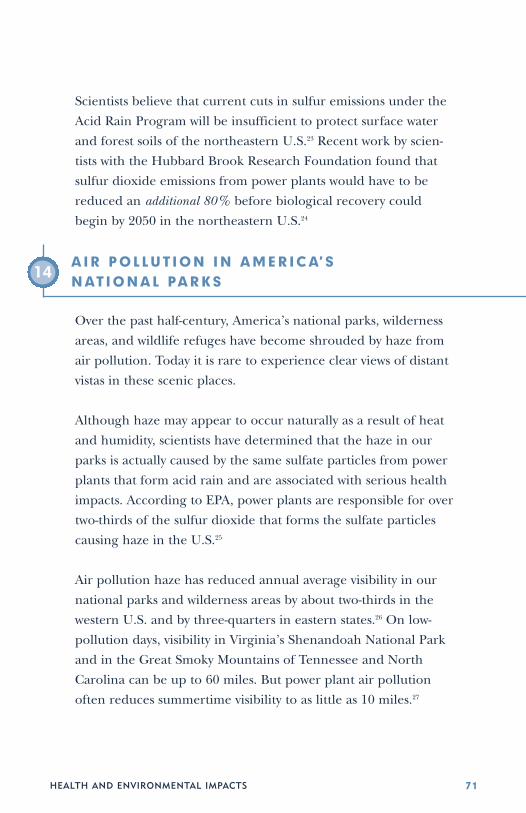
HEALTH AND ENVIRONMENTAL IMPACTS 71
Scientists believe that current cuts in sulfur emissions under the
Acid Rain Program will be insufficient to protect surface water
and forest soils of the northeastern U.S.23 Recent work by scien-
tists with the Hubbard Brook Research Foundation found that
sulfur dioxide emissions from power plants would have to be
reduced an additional 80% before biological recovery could
begin by 2050 in the northeastern U.S.24
Over the past half-century, America’s national parks, wilderness
areas, and wildlife refuges have become shrouded by haze from
air pollution. Today it is rare to experience clear views of distant
vistas in these scenic places.
Although haze may appear to occur naturally as a result of heat
and humidity, scientists have determined that the haze in our
parks is actually caused by the same sulfate particles from power
plants that form acid rain and are associated with serious health
impacts. According to EPA, power plants are responsible for over
two-thirds of the sulfur dioxide that forms the sulfate particles
causing haze in the U.S.25
Air pollution haze has reduced annual average visibility in our
national parks and wilderness areas by about two-thirds in the
western U.S. and by three-quarters in eastern states.26 On low-
pollution days, visibility in Virginia’s Shenandoah National Park
and in the Great Smoky Mountains of Tennessee and North
Carolina can be up to 60 miles. But power plant air pollution
often reduces summertime visibility to as little as 10 miles.27
AIR POLLUT ION IN AMERICA’S NAT I ONAL PARK S
14

Acadia NationalPark (ME)
Big BendNational Park(TX)
Glacier NationalPark (MT)
Grand CanyonNational Park (AZ)
Great SmokyMountains Nat’l Park (TN/NC)
Point ReyesWilderness Area (CA)
16 miles
37 miles
29 miles
61 miles
60 miles
87 miles
118 miles
94 miles
145 miles
12 miles
82%
69%
69%
58%
80%
15 miles 88 miles 83%
ShenandoahNational Park (VA)
10 miles 54 miles 81%
PARK WORST DAY BEST DAY VISIBILITY LOSS
F IGURE 17—Visibility Loss from Haze in National Parks and Wilderness Areas28
Since 1988, the EPA, individual states, and federal land manage-
ment agencies have monitored air pollution and visibility impair-
ment at a number of national parks and wilderness areas across
the United States. These data show that air pollution is responsi-
ble for major decreases in visibility in these areas.
HEALTH AND ENVIRONMENTAL IMPACTS72

HEALTH AND ENVIRONMENTAL IMPACTS
In addition to reducing visibility, air pollution from power plants
costs Americans billions of dollars each year. Tourists to national
parks and wilderness areas consistently rate visibility and clear
scenic vistas as one of the most important reasons for visiting. In
1998, there were 287 million visitors to national parks, who spent
approximately $35 billion on travel-related purchases and who
helped generate approximately half a million jobs.29 Studies have
shown, however, that when visibility in parks declines, fewer peo-
ple visit, and they spend less time. Recent calculations have
found that the economic benefit of eliminating haze in park
areas could be over $4.3 billion dollars a year.30
73
F IGURE 18—Great Smoky National Park on a Clear Day And on a Hazy Day
F IGURE 19—Yellowstone National Park on a Clear DayAnd on a Hazy Day
Sour
ce:
Nat
iona
l Par
k Se
rvic
eSo
urce
: N
atio
nal P
ark
Serv
ice

Power plants emit dozens of hazardous air pollutants. EPA has
identified 67 separate hazardous compounds and chemicals in
the flue gas emitted from power plant smokestacks.32 Of these, 55
are known neurotoxins or developmental toxins (i.e., they affect
the development of a child’s brain, nervous system, or body). In
addition, 24 are also known, probable, or possible human car-
cinogens.33
Taken together, emissions of these 67 hazardous compounds
make power plants the nation’s leading source of toxic air pollu-
tion. In 1999, according to EPA’s Toxics Release Inventory data-
base, utility smokestacks emitted 842 million pounds of chemi-
cals into the air, 40% of the nation’s total toxic air pollution.34
HEALTH AND ENVIRONMENTAL IMPACTS74
Great Smoky Mountains National Park $1.8 billion
Acadia National Park $328 million
Grand Canyon National Park $279 million
Shenandoah National Park $128 million
Yosemite National Park $77 million
Mount Rainier National Park $148 million
Glacier National Park $65 million
Big Bend National Park $42 million
PARK REVENUE LOSS FROMPOWER PLANT HAZE
F IGURE 20—Economic Losses from Haze in Selected National Parks31
POWER PL ANTS , TOXIC POLLUT ION, AND CHILDREN
15
HEALTH AND ENVIRONMENTAL IMPACTS
Of all the chemicals classified by EPA as “hazardous,” mercury
has received the most attention from health professionals and
policy makers. Commonly found in coal, mercury is released to
the environment when coal is burned to produce electricity.
Mercury emitted to the air is eventually deposited on land and
in waterways, where it accumulates over time, persisting in the
environment for 100 years or more. Coal-fired power plants are
the source of 33% of all mercury air pollution, more than any
other industry.35
In 2000, mercury contamination forced 41 states to issue a total
of 2,242 fish advisories, warning anglers not to eat certain fish
and to limit their consumption of others. In the past seven years,
advisories for mercury have increased by 149%. The number of
states issuing warnings for mercury has also risen steadily from
27 in 1993 to 41 states in 2000.36
Health Effects of Mercury on Children
People are exposed to mercury primarily by eating fish contami-
nated with methyl mercury formed when airborne mercury
interacts with microorganisms in water. Fish absorb and store
methylmercury in their fatty tissue.
Consumption of mercury-contaminated fish poses the greatest
hazard to humans during prenatal development. Methylmercury
interferes with the normal development of the nervous system.37
Exposed children may exhibit poor performance on tests meas-
uring attention span, fine motor function, language, visual-spa-
tial abilities (e.g., drawing), and memory.38 According to the
National Academy of Sciences, children exposed to mercury
75

through their mothers will likely have difficulty keeping up in
school and might require remedial classes or special education.39
A recent survey by the Centers for Disease Control and
Prevention found that 10% of women of childbearing age who
were tested for mercury exposure measured above the EPA’s
safe level.40 Nationally, 6 million women of childbearing age have
elevated levels of mercury from eating contaminated fish, and
approximately 390,000 newborns are at risk of neurological
effects from exposure in utero to high levels of this chemical.41
Power plants are responsible for approximately 40% of all U.S.
emissions of carbon dioxide–the pollutant most closely linked to
global warming.42
For years, scientists have warned that man-made pollutants were
causing global temperatures to rise. While a dwindling number
of skeptics continue to challenge the facts, virtually all doubt
has been put to rest by two reports released in 2001 by national
and international scientific bodies. Studies from the National
Academy of Sciences (NAS) and the Intergovernmental Panel on
Climate Change (IPCC) both revealed a scientific consensus that
man-made pollution is the cause of global warming–a problem
with widespread consequences for health, the environment, and
the world economy.
HEALTH AND ENVIRONMENTAL IMPACTS76
GLOBAL WARMING16
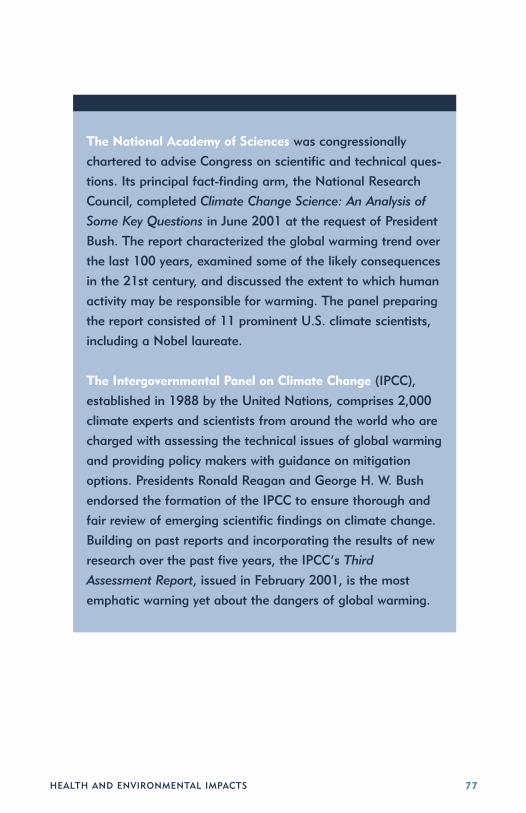
HEALTH AND ENVIRONMENTAL IMPACTS 77
The National Academy of Sciences was congressionally
chartered to advise Congress on scientific and technical ques-
tions. Its principal fact-finding arm, the National Research
Council, completed Climate Change Science: An Analysis of
Some Key Questions in June 2001 at the request of President
Bush. The report characterized the global warming trend over
the last 100 years, examined some of the likely consequences
in the 21st century, and discussed the extent to which human
activity may be responsible for warming. The panel preparing
the report consisted of 11 prominent U.S. climate scientists,
including a Nobel laureate.
The Intergovernmental Panel on Climate Change (IPCC),
established in 1988 by the United Nations, comprises 2,000
climate experts and scientists from around the world who are
charged with assessing the technical issues of global warming
and providing policy makers with guidance on mitigation
options. Presidents Ronald Reagan and George H. W. Bush
endorsed the formation of the IPCC to ensure thorough and
fair review of emerging scientific findings on climate change.
Building on past reports and incorporating the results of new
research over the past five years, the IPCC’s Third
Assessment Report, issued in February 2001, is the most
emphatic warning yet about the dangers of global warming.

Among the key findings of the National Academy of Sciences
and the Intergovernmental Panel on Climate Change are:
“Surface temperature measurements recorded daily at hundreds
of locations for more than 100 years indicate that the Earth’s sur-
face has warmed by about 1 degree Fahrenheit in the past centu-
ry. This warming has been particularly strong during the last 20
years and has been accompanied by retreating glaciers, thinning
arctic ice, [and] rising sea levels” among other effects.43
National Academy of Sciences
“Globally, it is very likely that the 1990s was the warmest decade
and 1998 the warmest year in the instrumental record, since
1861.”44
Intergovernmental Panel on Climate Change
“About three-quarters of the anthropogenic emissions of CO2
to the atmosphere during the past 20 years is due to fossil fuel
burning.”45
Intergovernmental Panel on Climate Change
Among the most devastating global impacts are increased
flooding and outbreaks of diseases in unexpected regions of
the world:
“Global mean sea level is projected to rise from 0.09 meters (4
inches) to 0.88 meters (34 inches) between 1990 and 2100.”46
The “number of people who would be flooded by coastal storm
surges” each year is from “75 to 200 million people.”47
Intergovernmental Panel on Climate Change
HEALTH AND ENVIRONMENTAL IMPACTS78

HEALTH AND ENVIRONMENTAL IMPACTS
There will be “an increase in the number of people exposed
to vector-borne (e.g., malaria) and water-borne diseases (e.g.,
cholera) and an increase in heat stress mortality.”48
Intergovernmental Panel on Climate Change
“The projected climate change would degrade water quality
through higher water temperatures and increased pollutant load
from runoff and overflows of waste facilities.”49
Intergovernmental Panel on Climate Change
“The vulnerability of human societies and natural systems to cli-
mate extremes is demonstrated by the damage, hardship, and
death caused by events such as droughts, floods, heat waves, ava-
lanches, and storms.”50
Intergovernmental Panel on Climate Change
U.S. Impacts from Global Warming
In the United States, higher temperatures will have a number of
negative impacts, primarily declining air and water quality and
accompanying harm to public health.51
Natural ecosystems throughout the United States appear to be
the most vulnerable to the harmful effects of climate change, as
there is often little that can be done to help them adapt to the
projected speed and amount of change.52
• Some ecosystems that are already constrained by climate, such
as alpine meadows in the Rocky Mountains, are likely to face
extreme stress; in some places they will disappear entirely.53
79

• There is a potential for the forests of the Southeast to break up
into a mosaic of forests, savannas, and grasslands from the
stress of climate change.54
• Climate scenarios suggest likely changes in the species compo-
sition of the Northeast forests, notably the loss of sugar
maples.55
Major alterations to natural ecosystems due to climate change
could possibly have negative consequences for our economy,
which depends in part on the sustained bounty of our nation’s
lands, waters, and native plant and animal communities.56
HEALTH AND ENVIRONMENTAL IMPACTS80

HEALTH AND ENVIRONMENTAL IMPACTS
Conclusion
As the debate over comprehensive power plant cleanup evolves,
we hope that the facts presented here will help define the issues
and offer guidance to decision makers.
The facts are clear: Power plant air pollution causes serious pub-
lic health and environmental damage. Significant reductions in
power plant emissions of sulfur dioxide, nitrogen oxides, carbon
dioxide, and mercury will save lives, reduce asthma attacks and
other respiratory illness, make fish safer to eat, and restore
healthy forests and scenic vistas to our natural lands.
Fundamentally, reductions of carbon dioxide must be part of any
plan to clean up power plants. The 1992 Framework Convention
on Climate Change, signed by President George H. W. Bush and
ratified unanimously by the Senate in 1992, committed the
United States to capping its greenhouse gas emissions. During
the intervening decade, however, U.S. emissions of CO2 have
increased by nearly 13%.57 America can and should begin to take
steps to reduce the threat of global warming. The most efficient
and least costly way to achieve a comprehensive cleanup of air
pollution emissions from power plants is to include CO2 reduc-
tions in the plan.
81
ENDNOTES1 Abt Associates, The Particulate-Related Health Benefits of Reducing Power Plant
Emissions, October 2000; http://www.clnatf.org/resources/reports/Abt_PM_report.pdf. AbtAssociates is EPA’s leading health-damage consultant, and conducted its analysis usingthe methodology approved by EPA’s independent Science Advisory Board. For a quickreference to the key findings of the Abt Associates study, see Clear the Air, Death,Disease & Dirty Power: Mortality and Health Damage Due to Air Pollution from PowerPlants, October 2000, pp. 3 and 5; http://cta.policy.net/fact/mortality/mortalitylowres.pdf.
2 “Health Benefits of Emissions Reductions from Older Power Plants,” Risk in Perspective,Vol. 9, Issue 2, Harvard Center for Risk Analysis, April 2001.
3 Abt Associates, The Particulate-Related Health Benefits of Reducing Power PlantEmissions, and Clear the Air, Death, Disease & Dirty Power: Mortality and HealthDamage Due to Air Pollution from Power Plants, p. 5.
4 Dr. John Peters (director), “Epidemiologic Investigation to Identify Chronic Health Effectsof Ambient Air Pollutants in Southern California” (known as “The Children’s HealthStudy”), February 2002; http://www.arb.ca.gov/research/chs/chs.htm.
5 U.S. Public Interest Research Group, Danger in the Air: Unhealthy Smog Days in 2000(January 2001), p. 7, Table 1, “Summary of 2000 Exceedances and Smog Days byState”; http://uspirg.org/reports/Dangerintheair2000.pdf.
6 U.S. EPA, National Air Pollutant Emissions Trends, 1900-1998, March 2000, Chapter1.2, p. 1-2 and Figure 2-4, p. 2-12;http://www.epa.gov/ttn/chief/trends/trends98/trends98.pdf.
7 Ibid., Chapter 1.2, p. 1-1 and Figure 2-2, p. 2-10.
8 Ohio Environmental Council, Ohio Valley - Ozone Alley, February 2000;http://www.theoec.org/pubs_airenerg.html.
9 J. I. Levy et al., “Using CALPUFF to evaluate the impacts of power plant emissions inIllinois: Model sensitivity and implications,” Atmospheric Environment, 36 (6): 1063-1075(2002); http://www.hsph.harvard.edu/press/releases/press1032001.html. Also J. I. Levyand J. D. Spengler, “Modeling the benefits of power plant emission controls inMassachusetts,” Journal of Air & Waste Management Association, 52: (2002);http://www.hsph.harvard.edu/papers/plant/plant.pdf.
10 U.S. EPA, Progress Report on the EPA Acid Rain Program, November 1999, pp. 12-14;http://www.epa.gov/airmarkets/progress/arpreport/acidrainprogress.pdf.
11 Ibid, p. 12.
12 U.S. EPA, National Air Pollutant Emissions Trends, 1900-1998, Figures 2-2 (p. 2-10) and2-4, (p. 2-12).
13 The information in this section is derived from a report by the Clean Air Task Force,Unfinished Business: Why the Acid Rain Problem Is Not Solved, October 2001;http://www.clnatf.org/resources/reports/Acid_Rain_Report.pdf.
14 T. A. Haines et al., “Intensive studies of stream fish populations in Maine,” EcologicalResearch Series, U.S. EPA (1990).
HEALTH AND ENVIRONMENTAL IMPACTS82

HEALTH AND ENVIRONMENTAL IMPACTS
15 J. P. Baker et al., “Episodic Acidification of Small Streams in the Northeastern UnitedStates: Effects on Fish Populations,” Ecological Applications, 6(2): 422-437 (1996).
16 C. T. Driscoll et al., “Acidic deposition in the Northeastern United States: Sources,inputs, ecosystem effects and management strategies,” Bioscience, 51(3) (2001).
17 R. M. Heard et al., “Episodic acidification and changes in fish diversity in Pennsylvaniaheadwater streams,” Transactions American Fisheries Society, 126:977-984 (1997).
18 William Sharpe and Joy R. Drohan, eds. “The Effects of Acidic Deposition onPennsylvania’s Forests,” Proceedings of the 1998 PA Acidic Deposition Conference,Vol. 1. Environmental Resources Research Institute, University Park, PA, 1998.
19 A. J. Bulger et al., “Shenandoah National Park: Fish in Sensitive Habitats Final Report,”University of Virginia and Virginia Polytechnic Institute and State University, Report tothe National Park Service, Coop Agreement CA-4000-2-1007 (2000).
20 A. J. Bulger et al., “Current, reconstructed past, and projected future status of brooktrout (salvelinus fontinalis) streams in Virginia,” Canadian Journal of Fish and AquaticScience, 57: 1515-1523 (2000).
21 R. B. Cook et al., “Acidbase chemistry of high-elevation streams in the Great SmokyMountains,” Water, Air and Soil Pollution, 72: 331-356 (1994).
22 T. P. DeFelice, “Investigation of wet acidic deposition episodes capable of damaging RedSpruce in the Mt. Mitchell State Park,” Atmospheric Research, 43: 325-344 (1997); andS. J. McLaughlin et al., “The impacts of acidic deposition and global change on high elevation southern Appalachian spruce-fir forests,” The productivity and sustainability of southern forests ecosystems in a changing environment, Springer-Verlag, eds., New York: 255-277 (1998).
23 Hubbard Brook Research Foundation, “Acid Rain Revisited: Advances in ScientificUnderstanding Since the Passage of the 1970 and 1990 Clean Air Act Amendments,”2000; Charles T. Driscoll et al., “Acid Deposition in the Northeastern U.S.: Sources andInputs, Ecosystems Effects, and Management Strategies,” BioSience, 51 (3); G.E.Likens et al., “Long-term Effects of Acid Rain: Response and Recovery of a ForestEcosystem,” Science 272: 244-46 (1996).
24 Ibid.
25 U.S. EPA, National Air Pollutant Emissions Trends, 1900-1998, Chapter 1.2, p. 1-2 andFigure 2-2-4, p 2-12.
26 U.S. EPA, National Air Quality and Emissions Trends Report, 1999, March 2001,Chapter 6, p. 109; http://www.epa.gov/oar/aqtrnd99/PDF%20Files/Chapter6.pdf.
27 Ibid., Chapter 6, pp. 101-102. Also, for park-specific data on visibility loss see:http://www.epa.gov/oar/visibility/monitor.html.
28 U.S. EPA, “Visibility in Our Nation’s Parks and Wilderness Areas,”http://www.epa.gov/oar/visibility/monitor.html. For specific park data, go to park nameand click on “visibility trends.”
29 Abt Associates, Out of Sight: The Science and Economics of Visibility Impairment,August 2000; research summarized by Clean Air Task Force, Out of Sight: Haze in OurNational Parks, August 2000, p. 9;http://www.clnatf.org/resources/reports/Out_of_sight.pdf.
83

30 Ibid., p. 11. To determine the total economic impact or damages resulting from electricpower generation, Abt Associates estimated the value of visibility-related changes asso-ciated with eliminating power plant emissions entirely. In the study, the monetary valueswere estimated for two broad categories of visibility benefits: (1) changes in “residential”visibility–i.e., the visibility in and around the locations where people live; and (2) changesin “recreational” visibility at Class I areas–i.e., visibility at specially designated nationalparks and wilderness areas. Based on the public’s willingness to pay for visibly cleanerair where they live, the adverse impact of power plant emissions cost $3.4 billion a yearby Abt Associates’ calculations. Similarly, the impact of power plant emissions on visibili-ty in parks and wilderness areas was $4.3 billion a year. Together, the impact of powerplant emissions as measured by people’s willingness to pay for visibly cleaner air wherethey live and in parks and wilderness areas totaled $7.7 billion per year in the U.S.
31 Ibid.
32 U.S. EPA, Study of hazardous air pollutant emissions from electric utility steam generat-ing units–final report to Congress, February 1998, “Executive Summary,” p. ES-4;http://www.epa.gov/ttn/oarpg/t3/reports/utilexec.pdf.
33 Ibid.
34 U.S. EPA, Toxic Release Inventory 1999: “Executive Summary,” p. E-2, Table E-1;http://www.epa.gov/tri/tridata/tri99/press/execsummary_final.pdf.
35 U.S. EPA, Mercury Study Report to Congress, December 1997, Volume 2, p. ES-6,Table ES-3; http://www.epa.gov/ttn/oarpg/t3/reports/volume2.pdf.
36 U.S. EPA, Mercury Update, Impact on Fish Advisories, June 2001, p. 4;http://www.epa.gov/ost/fishadvice/mercupd.pdf.
37 U.S. EPA, Mercury Study Report to Congress, December 1997, Volume 7, Chapter 2.1,p. 2-1; http://www.epa.gov/ttn/oarpg/t3/reports/volume7.pdf.
38 Ibid., p. 2-2.
39 National Academy of Sciences, Toxicological Effects of Methylmercury, NationalAcademy Press, Washington, DC, 2000, Chapter 5, “Health Effects of Methylmercury,”pp. 191-211; http://books.nap.edu/books/0309071402/html/191.html#pagetop.
40 U.S. Centers for Disease Control and Prevention, “Blood and hair mercury levels inyoung children and women of childbearing age–United States,” Morbidity and MortalityWeekly Review, March 2, 2001;http://www.cdc.gov/mmwr/preview/mmwrhtml/mm5008a2.htm.
41 Ibid. Based on national census data, 10% of women of childbearing age who tested formercury exposure above the EPA’s safe level equals approximately 6 million Americanwomen and an estimated 390,000 newborns. Census data available at:http://www.census.gov.
42 U.S. EPA, National Air Pollutant Emissions Trends, 1900-1998, March 2000, Chapter 8,Table 8-1 (p. 8-5); http://www.epa.gov/ttn/chief/trends/trends98/chapter8.pdf.
43 National Academy of Sciences, The Evidence for Warming;http://www4.nas.edu/onpi/webextra.nsf/web/evidence?OpenDocument.
HEALTH AND ENVIRONMENTAL IMPACTS84

HEALTH AND ENVIRONMENTAL IMPACTS
44 Intergovernmental Panel on Climate Change, Working Group I, Summary forPolicymakers, p. 2; http://www.ipcc.ch/pub/spm22-01.pdf.
45 Ibid., p. 7.
46 Ibid., p. 16.
47 Intergovernmental Panel on Climate Change, Working Group II, Summary forPolicymakers, Climate Change 2001: Impacts, Adaptation and Vulnerability, p. 13;http://www.ipcc.ch/pub/wg2SPMfinal.pdf.
48 Ibid., p. 5.
49 Ibid., p. 9.
50 Ibid., p. 6.
51 U.S. Global Change Research Program, Climate Change Impacts on the United States:The Potential Consequences of Climate Variability and Change, “Climate ChangeImpacts on the United States,” (2001), p. 7; http://www.usgcrp.gov/usgcrp/Library/nationalassessment/1IntroA.pdf.
52 Ibid.
53 Ibid.
54 Ibid.
55 Ibid.
56 Ibid.
57 U.S. EPA, Inventory of U.S. Gas Emissions and Sinks: 1990-1999, April 2001, Chapter2, p. 2; http://www.epa.gov/globalwarming/publications/emissions/us2001/energy.pdf.
85


NATIONAL ENVIRONMENTAL TRUST
1200 Eighteenth Street, N.W., Washington, DC 20036
Tel: 202.887.8800 • Fax: 202.887.8880
www.environet.org