Embed Size (px)
Citation preview
Page 1 of 18
CLEAR Info Progress Report Document Control Sheet
Project Reference
LIFE10 ENV/UK/000175 CLEAR Info
Action number
2.3
Description
Action 2.3: evaluate the transferability of the integration system to other forms of data
Version Final
Contents
Action 2.3 Report Annex 1: Case Study: Sustainable Business Report Annex 2: Case Study: River Basin Management Plans Annex 3: Case Study: Greenhouse gas and air pollution emissions/removals reporting
Written By
Katie Hughes
Project Manager Sign-off & Date
Suzanne Laidlaw
Project Executive Sign off & Date
Gillian Pratt
Page 2 of 18
CLEAR Info Project Report
August 2014
Action 2.3 Evaluate the transferability of data integration to other forms of data
1. Introduction
The CLEAR Info project team developed a data integration system which aggregates site-
based data from regulated sites up to company level. This data integration system
processes the data efficiently, identifies where there may be errors in the data, and is flexible
enough to allow new datasets to be added. The system includes a reporting tool which
enables compliance reports to be produced at site, company and sector levels. The data
integration system and compliance reports both have the potential to be used as tools to aid
environmental regulators in more effectively implementing EU legislation.
Using the Environment Agency as an example of a typical environmental regulator, the
project team considered the:
technical and practical issues which would need to be overcome to integrate
data from other sources into a data integration system;
different technical options (master data management systems) currently used by
the Environment Agency to integrate data;
the potential for using the CLEAR Info data integration system to generate data
the Environment Agency currently produces to help implement the requirements
of EU legislation; and
potential benefits of applying the CLEAR Info data integration system to other
forms of data.
The project team identified additional drivers to make data publicly available and to promote
the re-use of data which they considered relevant to most regulators.
The information in this desk study has been gathered from a variety of sources including:
Interviews with Environment Agency colleagues from a range of departments
including Legal, Evidence, Data Mapping and Modelling Information, Regulated
Industry, Enforcement, EU and International Relations and Fisheries & Biodiversity.
Reports compiled by the Environment Agency for the purpose of increasing
compliance with or meeting statutory reporting requirements related to EC legislation.
The Zero Based Review of all data/information and environmental reporting
requirements; undertaken as part of the Department for Environment, Food and
Rural Affairs (Defra) Smarter Environmental Regulation Review programme.
Aether UK Ltd, and internet research.
Page 3 of 18
2. Integrating data from other sources
The basic principles of data integration remain the same regardless of the technology used,
however, not all data is suitable for integration. Generic characteristics can be used to
determine if data is suitable for integrating and aggregating such as:
The data must be in an electronic format and in one or a small number of databases
collated to Regional if not National level.
The majority of the data should be selectable from a group of options rather than free
text. This enables a data integration tool to group data into standardised lists.
The datasets must have some commonality that can be used to link them together for
example, a field detailing company name, permit number, management team, or
geographic location.
Search fields / categories have been pre-defined for example, company, sector, or
water catchment.
There are numerical fields for example, tonnes of waste or number of pollution
incidents.
There is a structure to organise or aggregate the data against such as internal
business structure, geographic location, company hierarchy.
If data does not meet all of these criteria it may still be possible to integrate it but more
manual cleansing and pre-processing will be needed. This will be more resource-intensive
and the cost-benefits would have to be carefully considered.
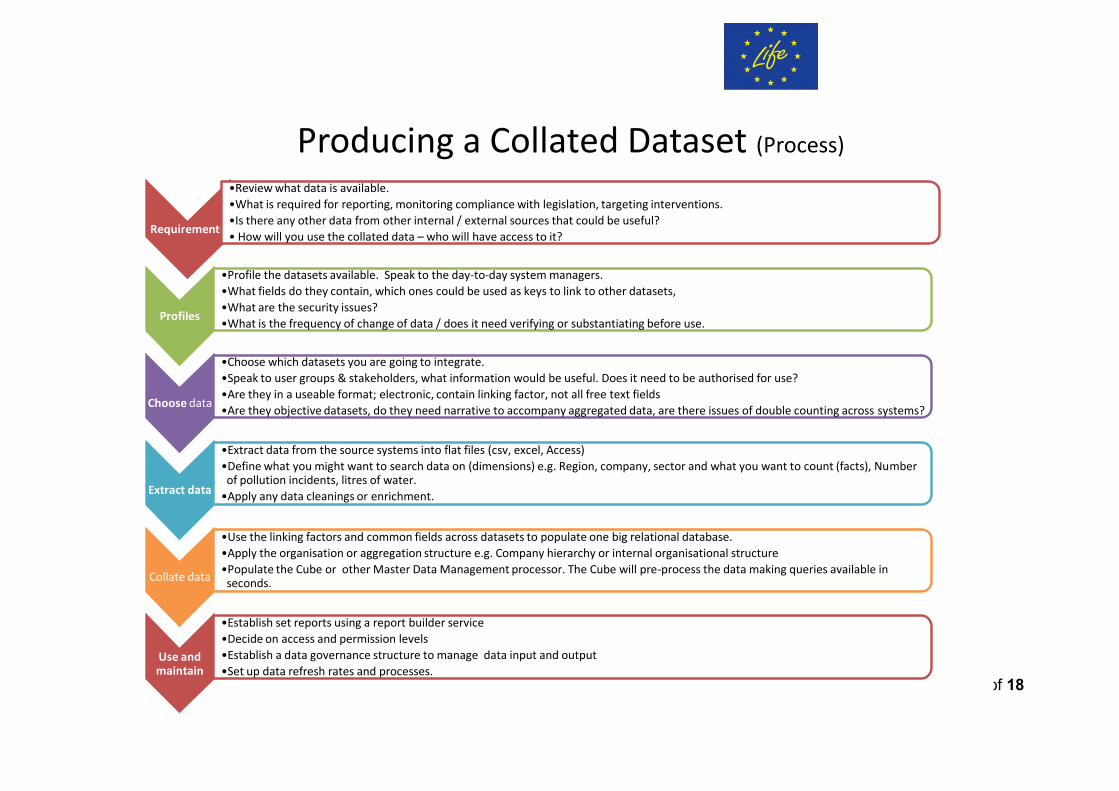
Once it has been established that the data is suitable for integrating and aggregating, the
basic process of preparing and integrating data involves:
identifying requirements;
profiling data;
choosing data and
extracting data.
This process is explained further in Figure 1. More detail about the process the project team
followed to integrate Environment Agency data can be found in the reports for Action 2.1 and
Action 2.4.
Page 4 of 18
Producing a Collated Dataset (Process)
Requirements
•Review what data is available.
•What is required for reporting, monitoring compliance with legislation, targeting interventions.
•Is there any other data from other internal / external sources that could be useful?
• How will you use the collated data – who will have access to it?
Profiles
•Profile the datasets available. Speak to the day-to-day system managers.
•What fields do they contain, which ones could be used as keys to link to other datasets,
•What are the security issues?
•What is the frequency of change of data / does it need verifying or substantiating before use.
Choose data
•Choose which datasets you are going to integrate.
•Speak to user groups & stakeholders, what information would be useful. Does it need to be authorised for use?
•Are they in a useable format; electronic, contain linking factor, not all free text fields
•Are they objective datasets, do they need narrative to accompany aggregated data, are there issues of double counting across systems?
Extract data
•Extract data from the source systems into flat files (csv, excel, Access)
•Define what you might want to search data on (dimensions) e.g. Region, company, sector and what you want to count (facts), Number of pollution incidents, litres of water.
•Apply any data cleanings or enrichment.
Collate data
•Use the linking factors and common fields across datasets to populate one big relational database.
•Apply the organisation or aggregation structure e.g. Company hierarchy or internal organisational structure
•Populate the Cube or other Master Data Management processor. The Cube will pre-process the data making queries available in seconds.
Use and maintain
•Establish set reports using a report builder service
•Decide on access and permission levels
•Establish a data governance structure to manage data input and output
•Set up data refresh rates and processes.
Page 5 of 18
3. Technical options: master data management systems
The Project Team used Microsoft Business Intelligence Stack to build the CLEAR Info data
integration system. However, there are several alternative master data management systems
and software packages available on the market.
Some examples of different master data management systems used by the Environment Agency
provide insight into the variety of data management methods an environmental regulator might
use. These are summarised below:
a) Sharepoint and Microsoft Access is used to implement the Eels (England and
Wales) Regulations 2009 which are enacted under the Habitats Directive 1992. The
regulations ensure eels are provided with safe passage around obstructions. In this case,
the Environment Agency links datasheets in SharePoint to a Microsoft Access database.
SharePoint forms the front end for Environment Agency local staff to enter and update asset
data. The database is made up of a series of queries that enable automated reporting via
buttons.
b) Microsoft Access and Oracle database are used to hold Water Information
Management System (WIMS) data such as environmental monitoring and water quality
permitting information. SlimWIMS is a Microsoft Access database which connects to the
WIMS database to allow easy, user-friendly access to a number of key datasets, including:
sampling points, discharge consents, and samples and measurements.
It links to online mapping and satellite imagery (EasiMap), allowing rapid analysis of
environmental data with statistics, graphs, reports and data exports. It can also report on
sampling programme delivery, and provide a cost analysis for different programmes. There
are currently two versions of SlimWIMS, one running in Office 2003, and the other in
Windows7. The software is self-contained, and can be run from a zipped file. Only
completed samples on WIMS are accessible. Data can be exported for analysis in Excel or
ArcMap. SlimWIMS connects to regional WIMS databases using Access online database
connectivity.
c) Case Management System (CMS) is a single IT system to support the Environment
Agency’s enforcement work from start (suspected offence) to finish (clean up and post-
enforcement action). The system is delivered securely to 2,500 users across the
organisation, including operational staff and their line managers, national business planners,
lawyers and other support function staff.
CMS is built in an Impact Level 3 (IL3) security environment, and has gone through a full
accreditation process to prove that it is 'IL3 compliant'. Reporting in CMS will be done
through Business Objects XI (BOXI) by a limited number of people. Only a small number of
people will be able to create new reports and set up report templates and different levels of
access will be implemented. A much larger group of users will be able to manipulate these
reports and run them. All users will be able to view these reports.
Page 6 of 18
d) MS Business Intelligence Stack. Across the Environment Agency, a number of
data integration tools use the same software package as the CLEAR Info data integration
system. Whilst these are in various stages of development their presence demonstrates
how transferable the technology is to other forms of data. The data integration tools identified
through this desktop study are summarised below:
Corporate performance brings together management data about the Environment
Agency (time recording, personnel data) that is related by ‘Organisational String’ (rather
than Company Name or Site). The indexing (master data management) strategy is still
under development, however, the system is ready to go into production.
Monitoring Information currently brings together information from direct
environmental monitoring (such as rain gauges or river levels) and contains information
on what the Environment Agency measures, where and why. In the future it will also
include actual monitoring measurements. Combining this data with regulated business
compliance data from the data integration system could provide greater insight into
industry’s effect on local environments.
Flood Analytics pulls together information about flood risks, warnings and
mitigations based on property locations. This tool is currently at the pilot stage with plans
for it to go into production to help with the implementation of the Flood Risk Directive
(2007/60/EC).
At present the pilot Flood Analytics dataset and reporting cube has many functions for the
Environment Agency including future flood planning, responding to Freedom of
Information Requests (FOI) and the sale of data to the insurance market.
The GIS layers within the flood analytics cube could be particularly useful to an
environmental regulator in identifying target businesses to approach. For example,
combining flood modelling maps with data on businesses that hold permits could identify
those businesses at potential risk of flooding. These businesses would benefit from
support in developing climate adaptation plans.
Page 7 of 18
4. Generating data to implement EU legislation
The learning obtained from the CLEAR Info project has the potential to inform the Environment
Agency’s approach to better regulation and respond to the UK government’s commitment to
streamlining data and reducing environmental reporting requirements for regulated business.
4.1 Data compilation
To explore further how the CLEAR Info data integration system might be used to generate data
to more effectively implement EU legislation, The project team engaged with a cross section of
teams across the Environment Agency to identify where data is compiled and used to drive
regulatory compliance. Two examples were identified where the Environment Agency analyses
regulatory and other data on the state of the environment to produce information presented to the
public through public registers and reports.
The potential benefits of using the data integration system in these areas are considered in the
following sections.
4.1.1 Public Registers
The Environment Agency has a statutory obligation to publish certain information. To
meet this requirement, the organisation’s website provides access information through an
electronic public register (ePR). The key registers available are:
Environmental permits (industrial installations; waste operations, radioactive
substances, water discharges).
Waste carriers, brokers & dealers.
Hazardous waste producers.
Waste exemptions.
Water discharge exemptions.
Enforcement action.
The current ePR application is a traditional database application which allows internal and
external users to look up summary registration / permit / license details, searching by
location (postcode or town), permit holder, permit reference or local authority.
There is significant potential benefit to be gained from presenting this data using the
CLEAR Info data integration system, as opposed to the existing application, specifically:
Broader access to the data (from a data cube as opposed individual data items)
would allow customers the opportunity to leverage more value from that data by
making it simpler and easier to join it with other available data.
Providing public access to a data integration system rather than a prescriptive and
controlled query tool would support the move towards delivering improved access
Page 8 of 18
to public register data - moving more towards a ‘data-sharing’ approach, rather
than an application.
The data integration system would simply provide data and allow customers /
partners to self-serve, rather than the current method of answering queries.
It would be easier to add in some of the peripheral data sets which sit outside the
current ePR application (for example, Waste Electronic and Electrical Equipment
(WEEE); register for end-of- life vehicles; national packaging waste database;
large raised reservoirs) and provide a more comprehensive, all-in-one register.
As with all data-sharing / access initiatives, appropriate controls would be required to
ensure compliance with data protection legislation and commercial restrictions.
4.1.2 Reports
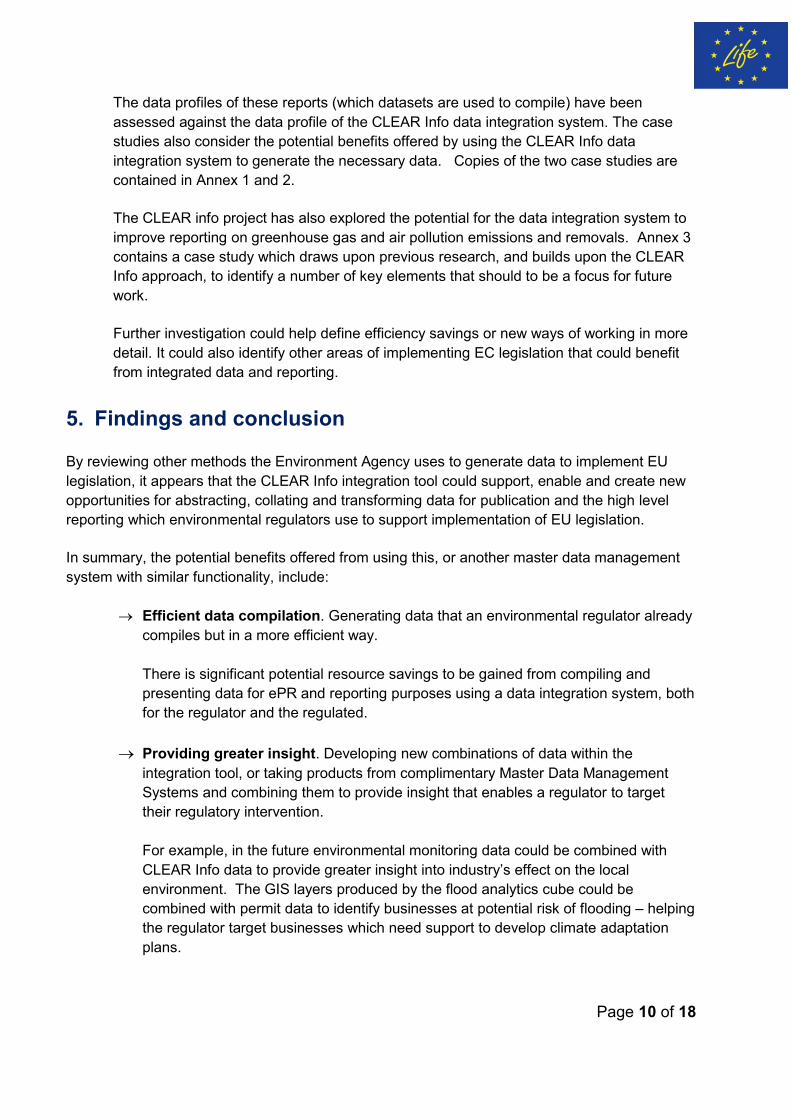
A summary of the reports identified through this desk study, and the EU Directives they
relate to, are presented in Table 1.
As several of the source data sets used to generate data for these reports have already
been incorporated into the CLEAR Info data integration system, there is potential to
generate the data needed for these reports using the data integration system.
Anecdotal evidence from staff interviewed indicates that having a single reporting tool to
generate the data for a number of reports could reduce the risk of conflicting information
being generated by different data analysts, ensuring the organisation produces ‘one
version of the truth’.
Current processes for generating data vary, but most appear to be quite resource
intensive. The actual cost savings offered by moving to a single system have not been
calculated for the purposes of this desk study. This is an area which any regulator
adopting a single data integration system should consider.
The use of a master data management system also has the advantage that once
standard reports have been created, they can be quickly populated with the latest data
because the data has all been pre-processed.
Whilst theoretically, this data could be generated using the CLEAR Info data integration
system, there may be financial, political or practical challenges to doing so. To explore
these in greater detail, and to gain greater understanding of the practicalities involved, the
project team:
Trained and interviewed staff responsible for producing existing data (super-
users).
Compiled case studies on two of the key reports identified.
Page 9 of 18
Super-user training: The project team trained a number of super-users, currently
responsible for compiling data reports, to establish whether the data integration system
could be used to generate the data they need with no, or minimal modification.
Initial feedback indicates that the system has potential, but that a number of issues would
have to be resolved including agreeing data sources, data treatment, data quality and
consistency standards, ownership / responsibilities for data, and data security sign-offs.
Full details of the super-user report-builder testing will be reported against Action 3.1.
Table 1: Key reports containing environmental data in the context of driving compliance with EU
legislation
Case Studies: In order to establish whether the CLEAR Info data integration system could generate this information, two of the key reports were considered in greater detail:
The sustainable business report.
River basin management plans.
Wate
r F
ram
ew
ork
Directive
(Directive 2
000/6
0/E
C)
Hab
itats
Directive (
Council
Directive 9
2/4
3/E
EC
)
Batt
eri
es D
irective’ (D
irective
2006/6
6/E
C)
P
ackag
ing
an
d P
ackag
ing
Waste
Directive (
94/6
2/E
C)
W
EE
E D
irecti
ve’
(Directive
2002/9
6/E
C)
Waste
Fra
mew
ork
Directive’
(Directive 2
006/1
2/E
C)
La
rge
Co
mb
us
tio
n P
lan
ts
Directive’ (D
irective 2
001/8
0/E
C
and 2
001/8
1/E
C)
Ind
us
tria
l E
mis
sio
ns
Directive
(Directive 2
010/7
5/E
U)
Ro
HS
Directive
(2011/6
5/E
U)
Sustainable Business Report
Regulated Industry: Annual Hazardous Waste Report
Regulated Industry: Annual Waste Crime Report
Regulated Industry: DEFRA Hazardous Waste Report
Regulated Industry: DFM European Waste Statistics
Regulated Industry: National EPR Compliance Report
Regulated Industry: Water companies Performance Report
Land and Water: River Basin Management Plans
Land and Water: Annual Assessment of Eel to ICES
Land and Water: Annual Assessment of Salmon to ICES
Evidence Planning Assessment & Reporting. Significant Water Management Issues
Account management reports for Waste Companies
Page 10 of 18
The data profiles of these reports (which datasets are used to compile) have been
assessed against the data profile of the CLEAR Info data integration system. The case
studies also consider the potential benefits offered by using the CLEAR Info data
integration system to generate the necessary data. Copies of the two case studies are
contained in Annex 1 and 2.
The CLEAR info project has also explored the potential for the data integration system to
improve reporting on greenhouse gas and air pollution emissions and removals. Annex 3
contains a case study which draws upon previous research, and builds upon the CLEAR
Info approach, to identify a number of key elements that should to be a focus for future
work.
Further investigation could help define efficiency savings or new ways of working in more
detail. It could also identify other areas of implementing EC legislation that could benefit
from integrated data and reporting.
5. Findings and conclusion
By reviewing other methods the Environment Agency uses to generate data to implement EU
legislation, it appears that the CLEAR Info integration tool could support, enable and create new
opportunities for abstracting, collating and transforming data for publication and the high level
reporting which environmental regulators use to support implementation of EU legislation.
In summary, the potential benefits offered from using this, or another master data management
system with similar functionality, include:
Efficient data compilation. Generating data that an environmental regulator already
compiles but in a more efficient way.
There is significant potential resource savings to be gained from compiling and
presenting data for ePR and reporting purposes using a data integration system, both
for the regulator and the regulated.
Providing greater insight. Developing new combinations of data within the
integration tool, or taking products from complimentary Master Data Management
Systems and combining them to provide insight that enables a regulator to target
their regulatory intervention.
For example, in the future environmental monitoring data could be combined with
CLEAR Info data to provide greater insight into industry’s effect on the local
environment. The GIS layers produced by the flood analytics cube could be
combined with permit data to identify businesses at potential risk of flooding – helping
the regulator target businesses which need support to develop climate adaptation
plans.
Page 11 of 18
Unique identification of entities. Further development of the linkages between legal
entities will allow an activity/emission/risk at a spatial or organisational level to be
aggregated and attributed to interested parties (owning companies/ regulators/
community parties).
Work is needed to establish a link database of entity identification numbers (e.g.
value-added tax or company numbers). This information needs to be transmitted with
any environmental information associated with an entity so that the data can be
linked to related entities. Work has started but there is much more to do and many
stakeholders need to be engaged such as national tax and company registration
systems.
If data from other sources were incorporated into the CLEAR Info data integration system or into
another master data management system with similar functionality, there are some common
issues which would have to be resolved.
Governance. Formalising responsibilities and ownership for the data feeds required to
keep the data integration system up to date would be essential, as would agreeing data
sources, data quality and consistency standards, ownership and responsibility for data.
Security. If the system were opened up to provide external, direct access to the reports
being generated (such as ePR), security controls would have to be put in place such as
login’s, authentication and authorisation controls, and firewall changes. Adaptations will
depend on the methods used
Development. The CLEAR Info data integration system is currently operating in a test
environment. To allow integration of other data sets with live feeds to keep the data up to
date, would require the tool be moved into a production environment.
Risk and call to action scoring. Systems for scoring environmental risk/impacts and
understanding uncertainties (likelihood) should be established and agreed across Europe.
These systems would enable decision-makers to spot and react to important issues
quickly. They also enable rapid communication of important information derived from
detailed analysis of large quantities of data.
CLEAR Info provides a new starting point for transparent and efficient data integration in the
future, building on its exploration of entity linking and approaches to using integrated data to
inform decision-makers.
Page 12 of 18
Annex 1
Case Study: Sustainable Business Report
The Environment Agency’s ‘Sustainable Business Report’ was last published in November 2013.
It provides a summary of the environmental performance information used to drive the
Environment Agency’s engagement with industry to create a better environment for business and
communities. The report includes detailed technical annexes which provide trend data.
Regulatory areas covered in the report include; emissions to air, pollution incidents, permit
compliance, water company performance, and stopping illegal waste sites.
The information in the report is linked to the Environmental Permitting Regime (EPR) which
meets requirements within the following European Directives:
Industrial Emissions Directive (2010/75/EU)
Water Framework Directive (2000/60/EC)
Habitats Directive (92/43/EEC) / Council Directive (99/31/EC)
Waste Framework Directive (2008/98/EC)
WEEE Directive (2012/19/EU)
Batteries Directive (2006/66/EC)
Mining Waste Directive (2006/21/EC)
Groundwater Directive (Directive 2006/118/EC) and daughter directive
Public Participation Directive (2003/35/EC)
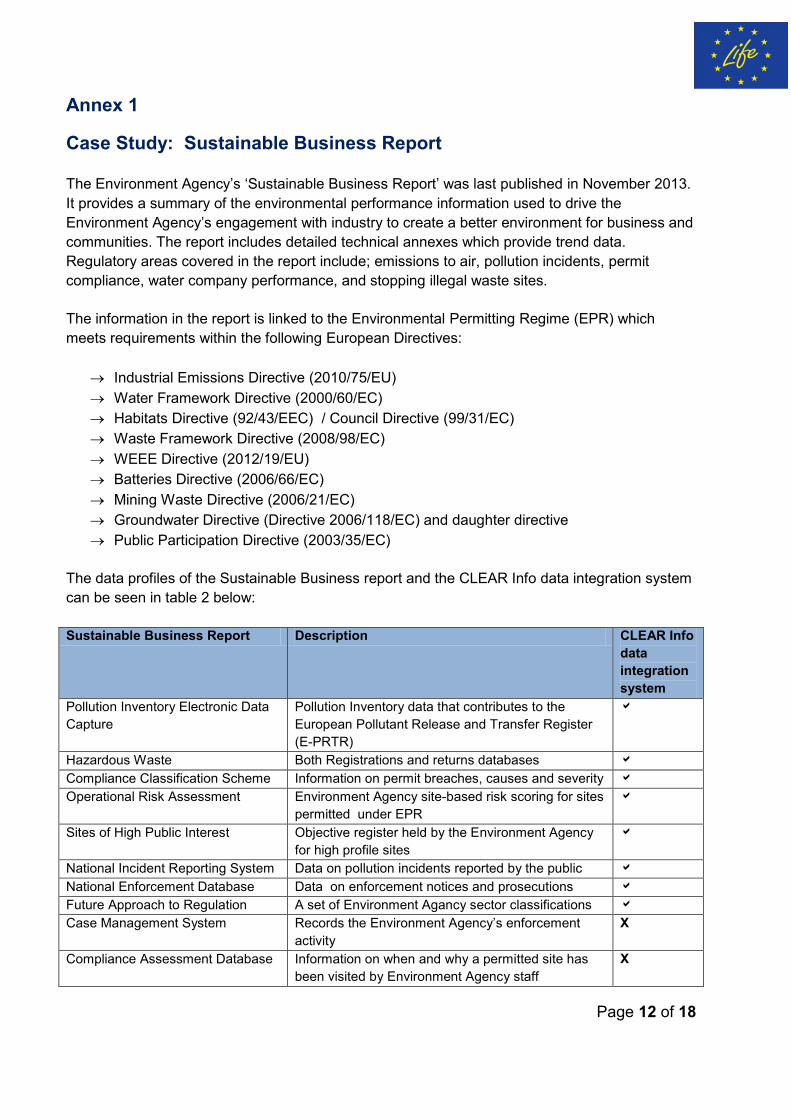
The data profiles of the Sustainable Business report and the CLEAR Info data integration system
can be seen in table 2 below:
Sustainable Business Report Description CLEAR Info
data
integration
system
Pollution Inventory Electronic Data
Capture
Pollution Inventory data that contributes to the
European Pollutant Release and Transfer Register
(E-PRTR)
Hazardous Waste Both Registrations and returns databases
Compliance Classification Scheme Information on permit breaches, causes and severity
Operational Risk Assessment Environment Agency site-based risk scoring for sites
permitted under EPR
Sites of High Public Interest Objective register held by the Environment Agency
for high profile sites
National Incident Reporting System Data on pollution incidents reported by the public
National Enforcement Database Data on enforcement notices and prosecutions
Future Approach to Regulation A set of Environment Agancy sector classifications
Case Management System Records the Environment Agency’s enforcement
activity
X
Compliance Assessment Database Information on when and why a permitted site has
been visited by Environment Agency staff
X
Page 13 of 18
Data on Small to Medium sized Enterprises (SMEs) and a new database developed in the South
East of England for Landfill Operators are not currently included in the Sustainable Business
Report but could be incorporated into the CLEAR Info data integration system.
The Environment Agency produces further sector-specific information to provide an accurate
picture to industry and businesses on where they should be focusing their efforts to improve their
environmental performance. This is used by Sector Groups within the Environment Agency to
plan regulatory activities.
Sustainable Business Report Limitations:
Errors in base data require significant resource to correct.
The change management process is manual. Changes can occur when new sites are
added, an existing site changes operations or varies their permit. Similarly a change in
regulation thresholds can result in a group of sites dropping in or out of requiring a permit
or move from one sector to another. This presents a reporting risk as the data processing
for the sustainable business report takes six months. If changes occur during this time
they have to be manually tracked through the whole process. Clarification is needed on
the criteria used to put an operator into a particular sector with an automated change
management process.
Errors in the data can occur when producing year on year trends as variations in
legislation or substantial sites cannot be easily back calculated.
Potential Benefits of using the CLEAR Info data integration tool:
Querying across data sets may help identify trends and correlations, presenting
opportunities to identify different approaches to monitoring. For instance, points allocated
to breaches to obtain a performance score would enable queries. These could be used to
investigate links between frequent or persistent lower level breaches and the potential to
lead to a more significant breach with serious environmental harm. Another example
could be exploring links between pollution incidents and OPRA scores or frequency of site
visits.
Time could be saved by automatically matching incidents entered on the Pollution
Incidents Database with addresses on the OPRA database to identify permit numbers.
This would replace the current manual approach which is very time consuming.
The tool has the facility not only to document changes but to also retrospectively apply
them at the touch of a button. For example if a company’s main activity changes, its
sector code may change – impacting upon the performance of the sector they were
attributed to. Similarly, OPRA data is obtained in April, however, sites may change (for
example, their permit may be varied) in August, so reports produced after August will
show discrepancies with those produced from April to August.
Page 14 of 18
Simple fixes via Governance and Controls and technical fixes could be improved by the
use of flagging. These automatic processes would release staff time from data input so
that more time could be spent on data analysis.
Reporting on companies could be more holistic and flexible. Wider questions could be
investigated such as ‘is the number of operators increasing or decreasing?’, ‘which
sectors have the most exemptions?’ or ‘how has a new regulation affected industries?’
Increased flexibility in reporting would help target resources where needed, for example
targeting pollution prevention work in areas with the worst discharges. Also, reporting
could track the impacts of population growth by, for example, quantification of discharge
to sewers.
The data sets currently used have a narrow basis, for example, by site. The CLEAR Info
data integration system can connect disparate databases, and using technologies such as
Look Up tables, can make matches across the data sets much more efficiently than can
be achieved manually. This enables more flexible reporting including higher level
overviews, such as by Sector.
Page 15 of 18
Annex 2
Case Study: River Basin Management Plans
Under the European Water Framework Directive (WFD) the Environment Agency map the rivers
basins in England, consisting of lakes, reservoirs, streams, rivers, canals, groundwater,
transitional waters (estuaries) and coastal waters.
The Environment Agency is the lead authority in England for implementing the Water Framework
Directive (WFD), a European directive which provides the main framework for water
management in Europe. The WFD requires a management plan be drawn up, reviewed and
updated every six years for each river basin district. River Basin Management plans set out the
state of the water environment and the measures required for any artificial or heavily modified
water bodies if they are to achieve good ecological potential by a set deadline to achieve
compliance with WFD.
River Basin Management Plans data profiles are comprised of the following data sets:
WFD River Basin Districts
WFD Monitoring Network
WFD River Waterbodies
WFD River Waterbody Catchments
WFD Lake Waterbodies
WFD Transitional (Estuarine) Waterbodies
WFD Coastal Waterbodies
WFD Groundwaterbodies
Protected Areas Register
WFD Classification
Reasons for Failure Database
WFD Transitional Waters typology
WFD Lakes Typology
WFD River Catchment Typology
Surface Water Risk Assessment
River Basin Management Plan Limitations:
The CLEAR Info data integration tool does not currently contain the range of data sets needed to
compile such reporting. If River Basin Management Plans were to be created from a data
integration system it may be better to compare profiles with the current flood data cube. This
uses the same technology and software as the CLEAR Info project but may have a more similar
data profile.
Page 16 of 18
Potential Benefits of using the CLEAR Info data integration tool:
The data profile comparison showed that the River Basin Management Plan reports use substantially different datasets then are currently in the CLEAR Info cube. However if the River Basin data sets were integrated in the same way as the CLEAR Info data, there would be great potential in linking the systems together to provide new insight into failing water bodies. WFD data describes why a water body may be failing, due to factors such as Biodiversity Oxygen Demand, pH, levels of micro-organisms, or nitrates. Maps of failing water bodies could be combined with geographical locations of industrial and waste sites using GIS. Overlaying this with regulated industry emissions records from the CLEAR Info collated dataset and the reasons water bodies were failing could lead to more targeted management plans. Further insight could be gained if additional datasets were added such as agricultural data to evaluate the extent of issues such as diffuse pollution on WFD.
By combining data sets to provide greater insight, the CLEAR Info data integration system
may add value to water quality data. For example, Surface Water Data (relating to
surface and ground water interactions), and Mine Water Pollution Data (using GIS) to
explore the potential for investigating how pollution behaves with different water types.
This could be linked with British Geological Survey’s work to ‘type’ water based on
primary geology.
Similarly, integrating data from Fisheries and Biodiversity could aid analysis to show if
improved water quality was linked to improved fisheries or improved biodiversity.
The latest version of Data Flow Maps is used to provide a clear line of sight between
critical data and the outcomes to which the data contributes. Several of the Data Maps
relate to EU Legislation and therefore may contain opportunities for implementing the
CLEAR Info integration system. With further investigation data flow maps could be used
to identify areas where collated data could be used to meet environmental objectives, as
set by EU legislation.
Page 17 of 18
Annex 3
Case Study: Greenhouse gas and air pollution emissions/removals reporting
Introduction and background
The work done a number of years ago on streamlining EU environmental data reporting
http://ec.europa.eu/clima/policies/package/docs/streamlining_cc_ap_reporting_en.pdf
focused on greenhouse gas and air pollution emissions/removals. This study looked at
opportunities within the spectrum of different EU decisions and regulations for streamlined
reporting. The key elements were focused around data flows in the following two regimes:
‘national perspective’ (nationally derived estimates of emissions and removals for different national activities such as power generation, residential heating, road transport, fuel combustion, refinery and chemical processes)
‘installation perspective’ (installation specific information reported by organisations to regulators and compiled for EU reporting. This included data for EU ETS, E-PRTR, LCPD (large combustion Plant directive), and other reporting covered now under the industrial emissions directive.
The results of the work provided a roadmap indicating which parts of the different European
decisions and regulations could be modified to improve data flow the original source (installation
reporting or national statistical compilation) into European datasets on environmental pressures
(focused on greenhouse gas and air pollutant emissions/removals).
The EU continues to strive for this improved data flow. However there is no coordination around
the implementation of the roadmap, which spans a number of different and changing European
commission departments and therefore has no ownership. The current problems are clear. Data
reported at installation level is difficult to gather and use at national level. There are a number of
fundamental differences in the way data is reported and classified that make it difficult to
integrate the data with other national statistics. As a result data is often reported several times
placing a burden on businesses and industry. In addition, a large amount of expert effort is
required to join the datasets up on a regular basis. This effort by industry and environmental
experts could be better channelled towards improving the quality (accuracy) of data and
increasing the time spent using the data to inform decision-making.
Project findings
CLEAR Info provides a step in the direction of these improvements. CLEAR Info provides a new
starting point for transparent and efficient data integration in the future, building on its exploration
of entity linking and approaches to use integrated data to inform decision-makers. The timing is
right, with EU new ‘Digital Agenda for Europe’ (European Commission, 2014) creating important
opportunities for the improvement of E-PRTR and other industrial emissions directive reporting.
In the UK the red tape challenge has created opportunities to explore improvements in data flow
which reduces the burden on industry and regulators.
The key elements which could be focused on are highlighted below.
Page 18 of 18
Unique identification of entities. Further development of the linkages between legal entities is needed. This will allow an activity/emission/risk at a spatial or organisational level to be aggregated and attributed to interested parties (owning companies/ regulators/ community parties). Work is needed to establish a link database of entity identification numbers (e.g. value-added tax numbers or company numbers). This information needs to be transmitted with any associated environmental information so that the data can be linked to related entities. Work has started but there is much more to do and many stakeholders need to be engaged. Particular stakeholders include national tax and company registration organisations. Transmission of key information. This should try to work towards INSPIRE standards but as a minimum should consider the minimum information on:
a. A period (for which the information is relevant (e.g. year, month, our, day)) b. A metric (tonnes of pollutant, tonnes of product, euros spent, numbers of livestock,
land area, water abstraction) clearly defined with units. c. An indicator of accuracy/certainty (quantitative or semiquantitative). d. Geography (defining a area line or point) e. A classification (economic sector source category) with definition of classification
used. f. An entity identification number. g. The usual meta data including ownership date of update, validity references to
methods, data sources and assumptions etc.
Risk and call to action scoring. Systems for scoring environmental risk/impacts and understanding uncertainties (likelihood, agreed and understood across Europe. These systems enable decision-makers to spot and react to important issues quickly. They also enable rapid communication of important information derived from detailed analysis of large quantities of data.
Next steps and recommendations
As a regulator the EA has an opportunity to put in place a framework that works to these
standards and enables efficient data flows for a zone analysis and for European reporting. Over
the next year to 2 years there are opportunities to influence EU reporting for industrial processes
under the E-PRTR, the industrial emissions directive and EU ETS.
Further exploration of these topics will help to provide a basis for improving data flows and
enabling full integration of datasets so that analysts and business leaders can have a clear
picture of risks and opportunities related to the environment.
Further work should focus on supporting the regulator/installation reporting interface and
ensuring that data can be reported once by installations and used as much as possible by all
interested parties (whilst respecting confidentiality issues). This type of initiative will not only
improve environmental data but also help to improve data that underpins our economic and
social understanding for example improve our understanding of energy consumption and fossil
fuel use in industrial processes, water demand, and environment assets.