Embed Size (px)
Citation preview
CliC Workshop on Asian Cryospheric Data Products
Cold and Arid Regions Environmental and
Engineering Research Institute
Chinese Academy of Sciences (CAREERI, CAS)
Lanzhou, China
29-31 March 2009
WCRP Inf. No.10/2009
January 2010
The World Climate Research Programme is sponsored by the World Meteorological Organization, the International Council for Science, and the Intergovernmental Oceanographic Commission of UNESCO. Climate and Cryosphere (CliC) is a core project of the World Climate Research Programme, cosponsored by the Scientific Committee for Antarctic Research and the International Arctic Science Committee, and is hosted by the Norwegian Polar Institute. Contact information; CliC International Project Office Norwegian Polar Institute The Polar Environmental Centre N-9296 Tromsø, Norway http://clic.npolar.no [email protected] Tel: +47 77 75 01 46 Fax: +47 77 75 05 01 NOTE The designations employed and the presentation of material in this publication do not imply the expression of opinion whatsoever on the part of the Secretariat of the World Meteorological Organization concerning the legal status of any country, territory, city or areas of its authorities, or concerning the delimitation of its frontiers or boundaries.
i
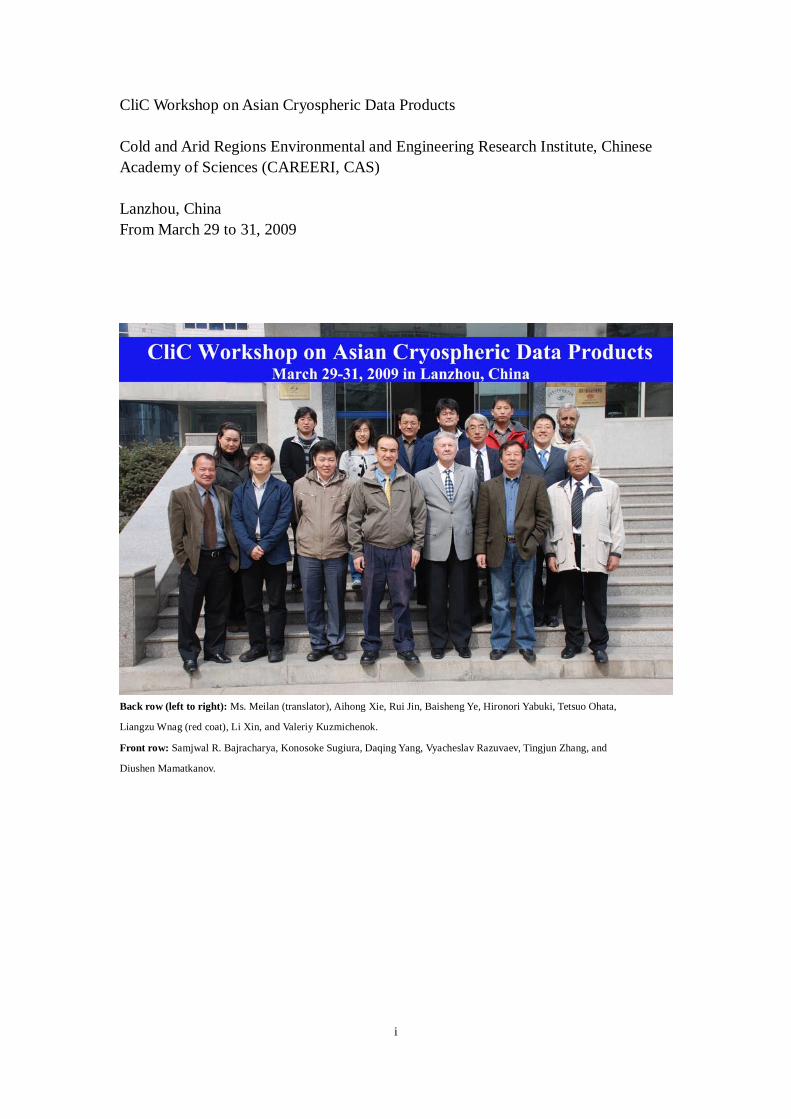
CliC Workshop on Asian Cryospheric Data Products Cold and Arid Regions Environmental and Engineering Research Institute, Chinese Academy of Sciences (CAREERI, CAS) Lanzhou, China From March 29 to 31, 2009
Back row (left to right): Ms. Meilan (translator), Aihong Xie, Rui Jin, Baisheng Ye, Hironori Yabuki, Tetsuo Ohata,
Liangzu Wnag (red coat), Li Xin, and Valeriy Kuzmichenok.
Front row: Samjwal R. Bajracharya, Konosoke Sugiura, Daqing Yang, Vyacheslav Razuvaev, Tingjun Zhang, and
Diushen Mamatkanov.
ii
The Workshop was organized by: 1. Laboratory of Remote Sensing and Geospatial Science, CAREERI, CAS, World
Data Center for Glaciology and Geocryology in Lanzhou 2. State Key Laboratory of Frozen Soil Engineering, CAREERI, CAS 3. Institute of Observational Research for Global Change (IORGC) Japan Agency
for Marine-Earth Science and Technology (JAMSTEC) 4. National Snow and Ice Data Center, University of Colorado at Boulder, USA 5. Climate and Cryosphere (CliC) 6. Chinese National Committee-Climate and Cryosphere (CNC-CliC) Conveners Group: Dr. Xin Li (Cold and Arid Regions Environmental and Engineering Research
Institute, CAS) Dr. Tetsuo Ohata (Institute of Observational Research for Global Change, JAMSTEC) Dr. Tingjun Zhang (National Snow and Ice Data Center, CIRES) Dr. Daqing Yang (Climate and Cryosphere, CliC) Workshop Secretariat: Dr. Tao Che (Cold and Arid Regions Environmental and Engineering Research
Institute, CAS) Dr. Rui Jin (Cold and Arid Regions Environmental and Engineering Research
Institute, CAS)
iii
Table of Contents Summary ................................................................................................................... 1
1.0 Outline and Objectives ............................................................................. 2 2.0 Organization and Support ........................................................................ 2 3.0 Participants and Presentation ................................................................... 2 4.0 Workshop Sessions .................................................................................. 3
4.1 Opening ............................................................................................ 3 4.2 Country reports ................................................................................. 3 4.3 Group work ...................................................................................... 3
5.0 Country reports ........................................................................................ 4 5.1 Snow data from station and passive microwave remote sensing in China ................................................................................................ 4 5.2 A bias-corrected precipitation dataset for China ................................ 4 5.3 In-situ historical snow data in Japan.................................................. 5 5.4 Condition of a level of scrutiny of a snow cover in Kyrghyzstan ....... 6 5.5 In-situ historical snow data of Mongolia .......................................... 11 5.6 Snow cover characteristics from 223 meteorological stations over the former USSR territory .................................................................... 13 5.7 Frozen ground classification, mapping and monitoring in China ..... 14 5.8 Permafrost in Kyrghyzstan .............................................................. 14 5.9 Frozen ground data of Mongolia ..................................................... 15 5.10 Soil temperature observations before 320-cm depths at Russian meteorological stations ................................................................ 16 5.11 Glacier data in China ................................................................... 17 5.12 Progresses on the Second Glacier Inventory of China .................. 17 5.13 Glaciers, Glacial Lakes and Glacial Lake Outburst Floods in Nepal 18
6.0 Reports of group work ........................................................................... 21 6.1 Snow data session ........................................................................... 21 6.2 Glacier data session ........................................................................ 23 6.2.1 Presentations ............................................................................... 23 6.2.2 Current data conditions ............................................................... 23 6.2.3 Potential contact persons (focal points) ....................................... 24 6.2.4 Plan the schedule of data processing and archive ......................... 24 6.2.5 Other issues................................................................................. 24 6.3 Frozen ground data session ............................................................. 24 6.3.1 Presentations ............................................................................... 24 6.3.2 Breakout Discussions .................................................................. 25
7.0 Next Steps and Actions .......................................................................... 26 7.1. Person in charge of making a catalog .............................................. 26 7.2. Telephone meeting, 3 or 4 times/year .............................................. 27
Agenda ............................................................................................................ 29 List of Participants ........................................................................................... 32 List of Acronyms ............................................................................................. 35

iv
1
Summary
Eighteen people from eight countries participated in the CliC Workshop on Asian Cryospheric Data Products held at the Cold and Arid Regions Environmental and Engineering Research Institute (CAREERI), CAS on March 29-31, 2009. Among the participants were Dr. Xin Li, director of World Data Center for Glaciology and Geocryology in Lanzhou, Dr. Tetsuo Ohata, member of the Japan CliC Committee, and Dr. Daqing Yang, Director of the CliC International Project Office. Dr. Tingjun Zhang from the National Snow and Ice Data Center (NSIDC), USA, contributed to the CliC workshop from preparation through implementation. The workshop was preceded by the 1st Asia Climate and Cryosphere (CliC) Symposium: State and fate of Asian Cryosphere, which was held in Yokohama, Japan in 2006. The idea of organizing a data workshop to promote joint data activities in this region was initialized by Dr. Tetsuo Ohata, Dr. Tingjun Zhang and Dr. Xin li. The workshop consisted of six sessions:
1. Open session 2. Snow data session 3. Glacier data session 4. Frozen ground data session 5. Data archive and management session 6. Summary session
Dr. Xin Li opened the workshop with a welcoming speech and an introduction of the workshop. Dr. Tetsuo Ohata, Dr. Daqing Yang, and Dr. Tingjun Zhang each gave a short talk during the opening session. Afterwards, the status of Asian snow data were reported by each country, followed by group discussions summarizing the current condition of snow data in each country. The second day morning session focused on glacier data, while the afternoon session discussed frozen-ground data and mapping of frozen ground in Asia. Each session consisted of country reports and group discussions. A short summary session in the afternoon generated comments on several issues; such as, data catalogue, data archiving, organization of Asian cryospheric data working groups, and other issues. On the last day, JAMSTEC and CAREERI introduced their own data-archive system and data-distribution platforms. The four chairmen then summarized the results from the Snow-, Glacier-, Frozen ground- and Data-archive and Management sessions. Planning which steps to take next was also discussed.
2
1.0 Outline and Objectives
For years, in-situ snow- and frozen-ground data have been measured routinely in many regions. These historical data sets are important for climatic, hydrological, and remote-sensing studies, but some may not have been archived properly and need to be “rescued”. The objectives of the workshop were as follows:
• To identify the present condition of the data archive of snow cover, glacier, and frozen-ground data over Asian region.
• To identify the potential data exchange procedure in Asian region and develop a catalogue for these data sets.
• To consider a portal site for Snow cover-, Glacier-, and Frozen-ground data over Asia, including historical data sets for scientific research.
• To develop a plan for data rescue and archive as an Asia CliC activity. • To develop a report on on-going activity and workshop. • To plan the next workshop to develop the Asian snow-, glacier-, and
frozen-ground data products.
2.0 Organization and Support
The Workshop was organized by the World Data Center for Glaciology and Geocryology in Lanzhou, the Laboratory of Remote Sensing and Geospatial Science/CAREERI, CAS, State Key Laboratory of Frozen Soil Engineering/CAREERI, CAS, Institute of Observational Research for Global Change (IORGC) Japan Agency for Marine-Earth Science and Technology (JAMSTEC), National Snow and Ice Data Center, University of Colorado at Boulder, USA, Climate and Cryosphere (CliC) and the Chinese National Committee-Climate and Cryosphere (CNC-CliC). The Convener Group members are listed on page iv. The Workshop Secretariat was run by Drs. Tao Che and Rui Jin (CAREERI/CAS). The event was sponsored by CAREERI/CAS, IORGC/JAMSTEC, NSIDC/CIRES, and the CliC International Project Office, including the travel and local costs.
3.0 Participants and Presentation
Eighteen people representing eight different countries participated (China, Japan, Kyrgyz Republic, Mongolia, Nepal, Norway, Russia and USA). The workshop received 21 presentations and/or reports.
3
4.0 Workshop Sessions
4.1 Opening Dr. Xin Li, the Director of the World Data Center for Glaciology and Geocryology in Lanzhou - Laboratory of Remote Sensing and Geospatial Science/CAREERI, gave the welcoming address, followed by an introduction of the workshop participants. Dr. Tetsuo Ohata presented the general condition of Asian cryosphere data in Japan and data taken by the Japanese. An overview and update of CliC’s snow-, glacier-, and frozen-ground data issues was presented by Dr. Daqing Yang, Director, CliC International Project Office. Finally, Dr. Tingjun Zhang reported on the increasing need for- and current status of cryospheric data. 4.2 Country reports The country reports presented during the first half of this session were chaired by Drs. Xin Li, Tetsuo Ohata, Viatcheslav Razuvaev, , Dr. Tingjun Zhang, and Mr. Samjwal R. Bajracharya. The 13 report titles are listed below (Details in Section 5):
1. Snow data from station and passive microwave remote sensing in China. 2. A bias-corrected precipitation dataset for China. 3. In-situ historical snow data in Japan. 4. Condition of a level of scrutiny of a snow cover in Kyrgyzstan. 5. In-situ historical snow data of Mongolia. 6. Snow cover characteristics from 223 meteorological stations over the
former USSR territory. 7. Frozen ground classification, mapping and monitoring in China. 8. Permafrost in Kyrgyzstan. 9. Frozen ground data of Mongolia. 10. Soil temperature observations before 320-cm depths at Russian
meteorological stations. 11. Glacier data in China. 12. Progresses on the Second Glacier Inventory of China. 13. Glaciers, glacial lakes and glacial lake outburst floods in Nepal.
4.3 Group work The second half of each session was used for more in-depth group discussions. (See group report summaries in Section 6.)
4
5.0 Country reports
5.1 Snow data from station and passive microwave remote sensing in China Tao Che, Xin Li, and Rui Jin, Chinese Academy of Science, Lanzhou, China Snow data from Chinese stations were discussed. Based on the station snow depth, we modified the NASA Chang algorithm, considering the influences from vegetation, wet snow, precipitation, cold desert and frozen ground. Furthermore, the modified algorithm was dynamically adjusted based on the seasonal variation of grain size and snow density. The spatial and temporal distribution of snow depth was illustrated and discussed, including the stable snow-cover regions in China, and the snowmass trend in these regions. Again, snow data from the stations were used to validate snow-depth data from passive microwave remote sensing. The trend was mostly consistent, although the gap between station data and remote-sensing products was significant pertaining to data from the Qinghai-Tibet plateau. However, the fusion of snow observation and modeling, using data assimilation for example, is important to obtain the spatiotemporal data sets. Several snow satellite data assimilation cases were presented to describe the fusion procedure; including snow process model, passive microwave brightness temperature data from satellite observations and from microwave transfer model simulations, optimal operation, as well as, error estimations. Future work from our group includes:
• Collection of daily snow observations. • Processing and archiving snow data in stations. • Validation from monthly snow observations. • Cross validation using other remote sensing snow products. • Blended snow data from remote sensing and in-situ observations.
5.2 A bias-corrected precipitation dataset for China Baisheng Ye, Chinese Academy of Science, Lanshou, China From 1951-2004, monthly climatic data were collected from 660 meteorological stations throughout China. In this study, the data were analyzed to examine the impact of bias correction on the changing tendencies of monthly and yearly precipitation levels. The annual area-average precipitation over China is 565.2 mm; however; with a bias correction of 89.7 mm, the corrected annual area-average precipitation is 654.9 mm. The impact of bias correction depends on gauge catch efficiency, changes in wind speed, temperature, snow percentage, and number of trace and measurable precipitation days. The changing tendencies of measured and corrected monthly- and yearly- precipitation levels have similar regional patterns throughout China, although they are quantitatively different over some regions.
5
Measured annual precipitation changing tendencies over China are:
-105~+137 mm (10a)-1(-11.75~ 22.9%(10a)-1)
Corrected annual precipitation changing tendencies are:
-142~+146 mm (10a)-1(-13.0~ 17.9%(10a)-1);
On the other hand, the relative changing tendencies have been reduced generally due to bias correction because of correction in increased mean precipitation levels. Bias correction enhances absolute monthly precipitation change by about 5-25%, leading to a 6 % overall increase in yearly precipitation changes throughout China. The relative annual precipitation changes have been underestimated by about 10%. The area-average measured precipitation changing tendency over China is only -1.9 mm·(10a)-1 during 1955-2004 and the area-average corrected annual precipitation changing tendency is up to -6.0 mm·(10a)-1. The annual precipitation changing tendency has been strongly underestimated based on the measured precipitation data. The changing tendencies mentioned here are large enough to affect regional climate and hydrology analyses. More effort is needed to improve the study of the impact of bias correction on precipitation change over other large countries and regions. 5.3 In-situ historical snow data in Japan Konosuke SUGIURA, Japan Agency for Marine-Earth Science and Technology, Yokosuka, Japan In-situ historical snow data in Japan was introduced. There is routine snow data from the JMA (Japan Meteorological Agency) from meteorological weather stations, as well as, project-oriented snow data from institutes and universities. The snow data collected by JMA and other institutes and universities was explained, showing the corresponding screen- and hard-copy image. To measure meteorological elements, JMA has operated AMeDAS (Automated Meteorological Data Acquisition System) since 1 November 1974. This system was installed in approximately 1,300 meteorological stations throughout Japan. About 290 of these stations measured snow depth every 1 cm, but did not measure items of frozen ground and glacier. This data is available to the public through the web site. AMeDAS records snow cover throughout Japan, however the number of stations in mountainous regions are limited. On the other hand, project-oriented snow observations have been carried out by research institutes and universities such as Civil Engineering Research Institute for Cold Region, Hokkaido University, Hirosaki University, Niigata University, National Research Institute for Earth Science and Disaster Prevention, and so on. That snow data is open to the public through papers or the web site.
6
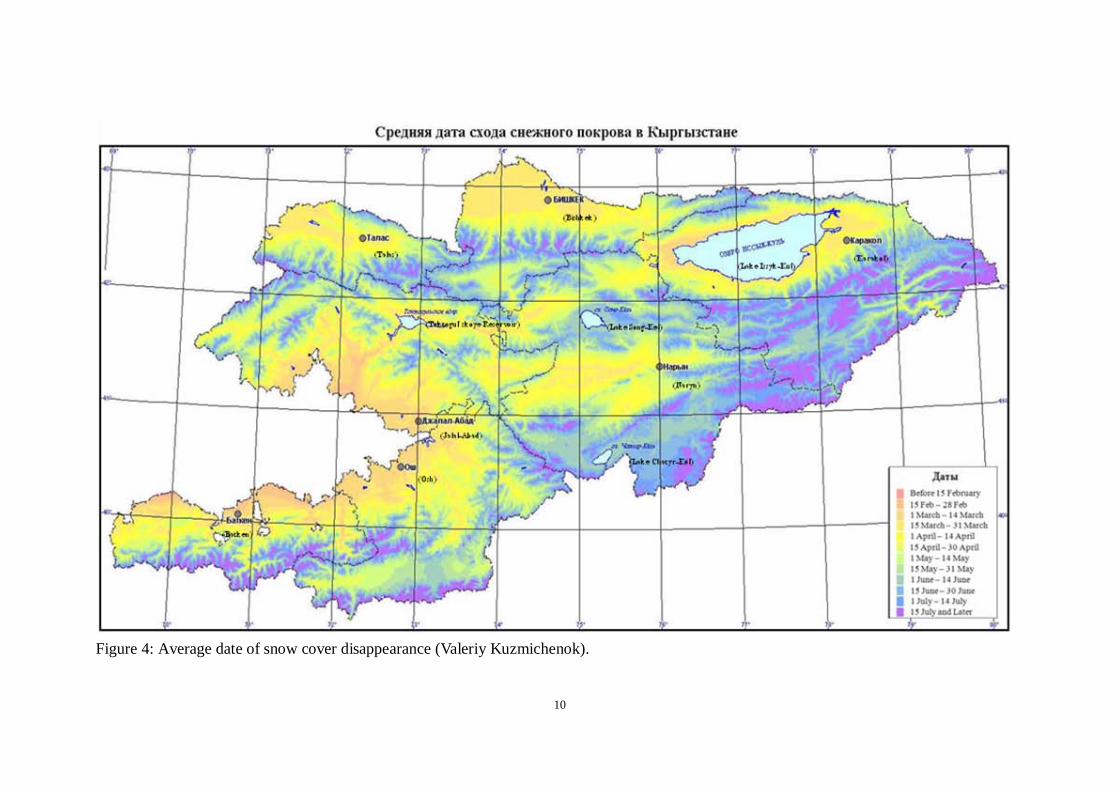
5.4 Condition of a level of scrutiny of a snow cover in Kyrgyzstan Diushen Mamatkanov and Valeriy Kuzmichenok, Institute of Water Problem and Hydropower of National Academy of Sciences of Kyrgyz Republic, Bishkek City, Kyrgyz Republic The snow cover in Kyrgyzstan is an unstable meteorological element often dependent on many local features. Mountainous areas and valleys are the seasonal snow zone, while high mountains are permanently covered in snow. In Kyrgyzstan, mountains influence the loss, accumulation, and storage of snow, which has a huge influence on dynamics of mountain glaciers and formation of river drains. As a result of climatic and topographical factors, the distribution, duration, and water storage of ground snow cover from the first snowfall to the spring thaw is extremely different. Depending on topographical conditions and properties, snow-cover distribution can be classified into four zones:
1. The permanent snow cover zone – located on high-mountainous zones above 3200 m. The area of this zone is quite small.
2. The steady snow cover zone - is below snow line (from 3000-3200 m up to 1500 m) and occupies a significant area. Duration of this snow cover is from 3 to 6 months and decreases with elevation.
3. The unsteady snow cover zone - occupies heights from 600 m to 1000-1500 m of foothills and their adjoining valleys. Some high-mountainous areas belong to this zone where the snowfall is very little in winter.
4. A snow-free zone. The hollow and western part of a hollow where the snowfall is very little and cannot be retained. Capacity of snow cover is distributed (allocated) depending on height, an exposition of slopes and aspects, and the extent of shade in valleys, gorges, and hollows.
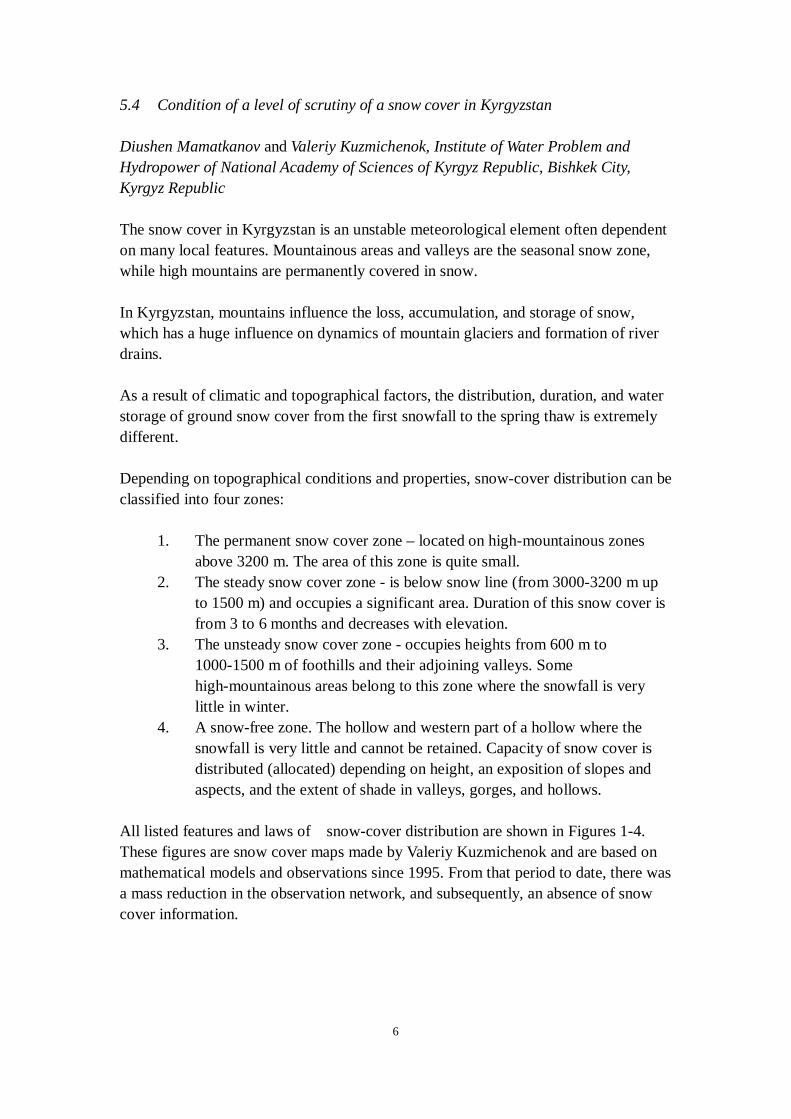
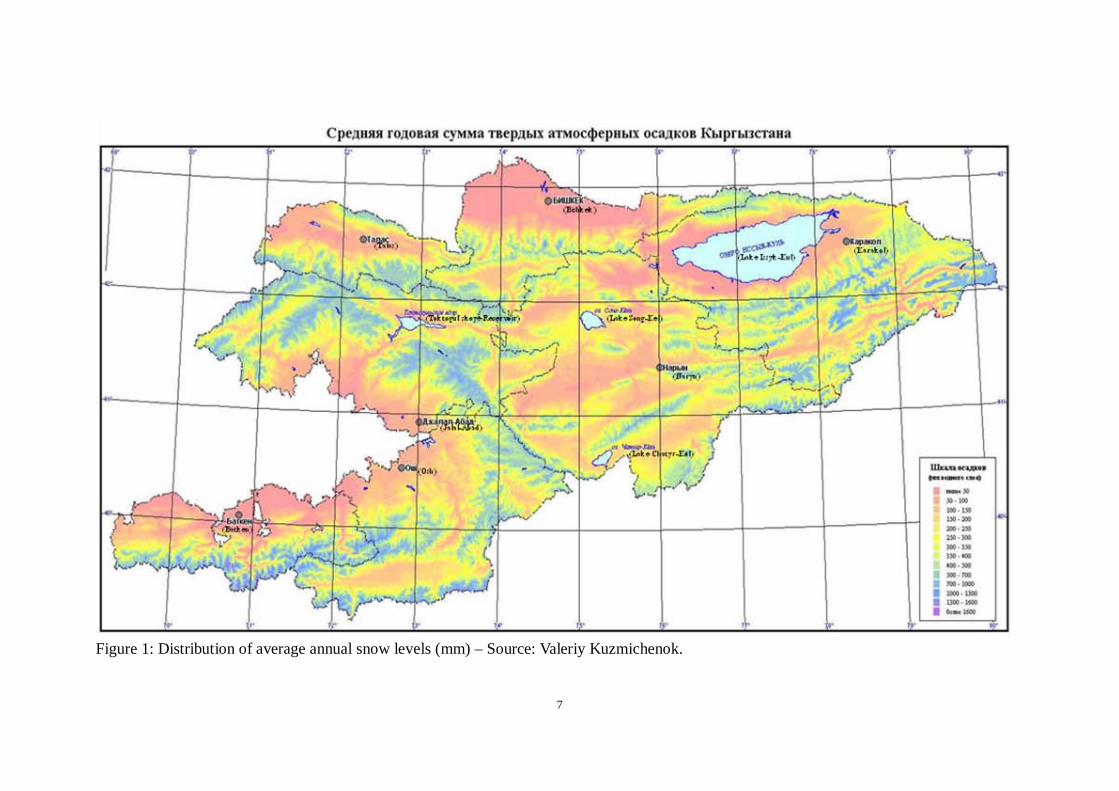
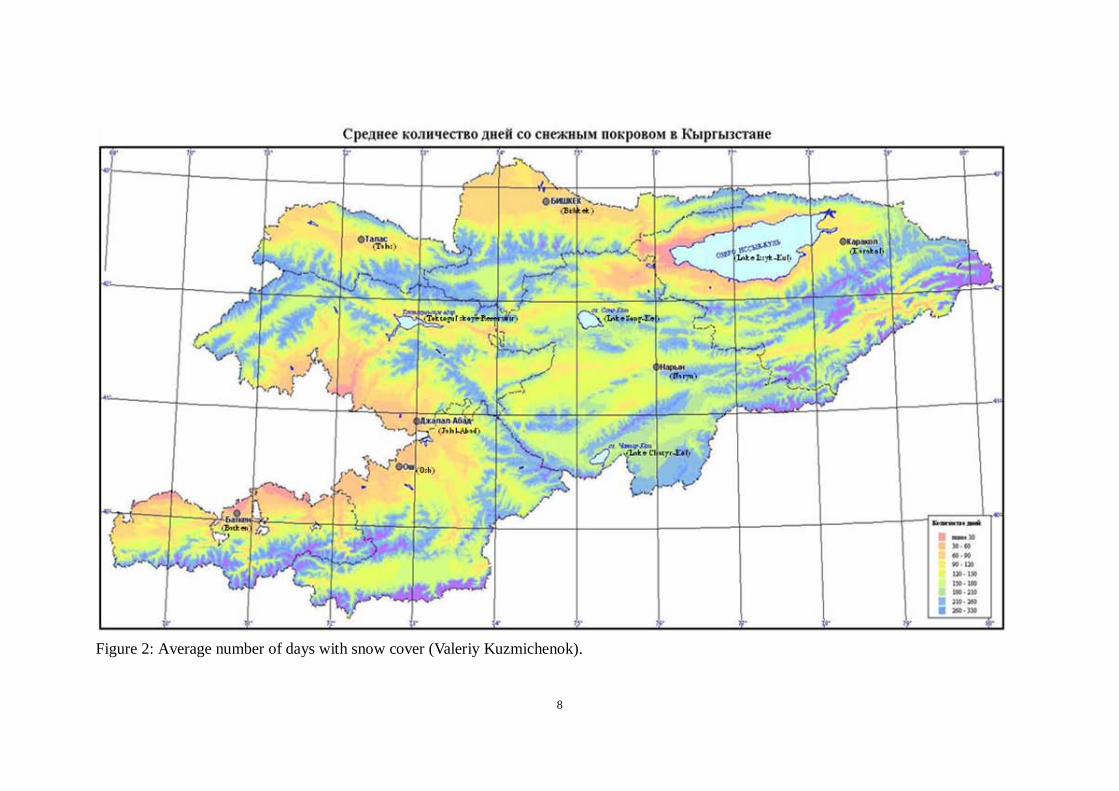
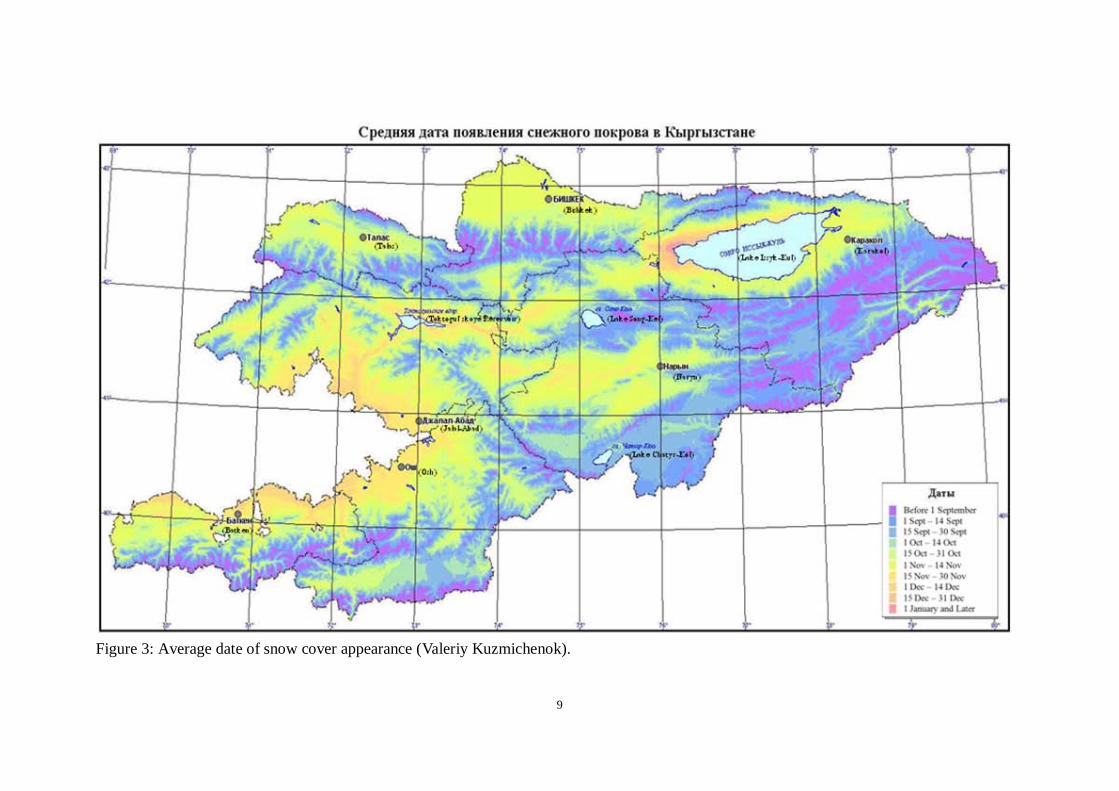
All listed features and laws of snow-cover distribution are shown in Figures 1-4. These figures are snow cover maps made by Valeriy Kuzmichenok and are based on mathematical models and observations since 1995. From that period to date, there was a mass reduction in the observation network, and subsequently, an absence of snow cover information.
7
Figure 1: Distribution of average annual snow levels (mm) – Source: Valeriy Kuzmichenok.
8
Figure 2: Average number of days with snow cover (Valeriy Kuzmichenok).
9
Figure 3: Average date of snow cover appearance (Valeriy Kuzmichenok).
10
Figure 4: Average date of snow cover disappearance (Valeriy Kuzmichenok).
11
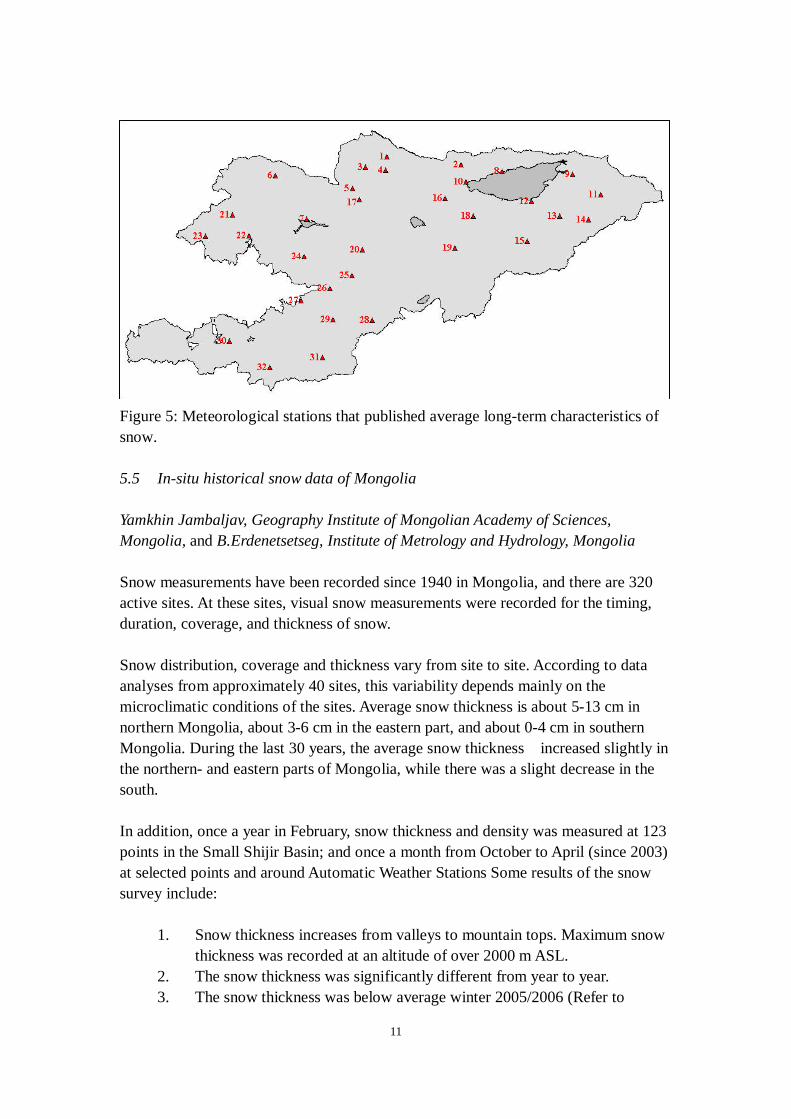
Figure 5: Meteorological stations that published average long-term characteristics of snow. 5.5 In-situ historical snow data of Mongolia Yamkhin Jambaljav, Geography Institute of Mongolian Academy of Sciences, Mongolia, and B.Erdenetsetseg, Institute of Metrology and Hydrology, Mongolia Snow measurements have been recorded since 1940 in Mongolia, and there are 320 active sites. At these sites, visual snow measurements were recorded for the timing, duration, coverage, and thickness of snow. Snow distribution, coverage and thickness vary from site to site. According to data analyses from approximately 40 sites, this variability depends mainly on the microclimatic conditions of the sites. Average snow thickness is about 5-13 cm in northern Mongolia, about 3-6 cm in the eastern part, and about 0-4 cm in southern Mongolia. During the last 30 years, the average snow thickness increased slightly in the northern- and eastern parts of Mongolia, while there was a slight decrease in the south. In addition, once a year in February, snow thickness and density was measured at 123 points in the Small Shijir Basin; and once a month from October to April (since 2003) at selected points and around Automatic Weather Stations Some results of the snow survey include:
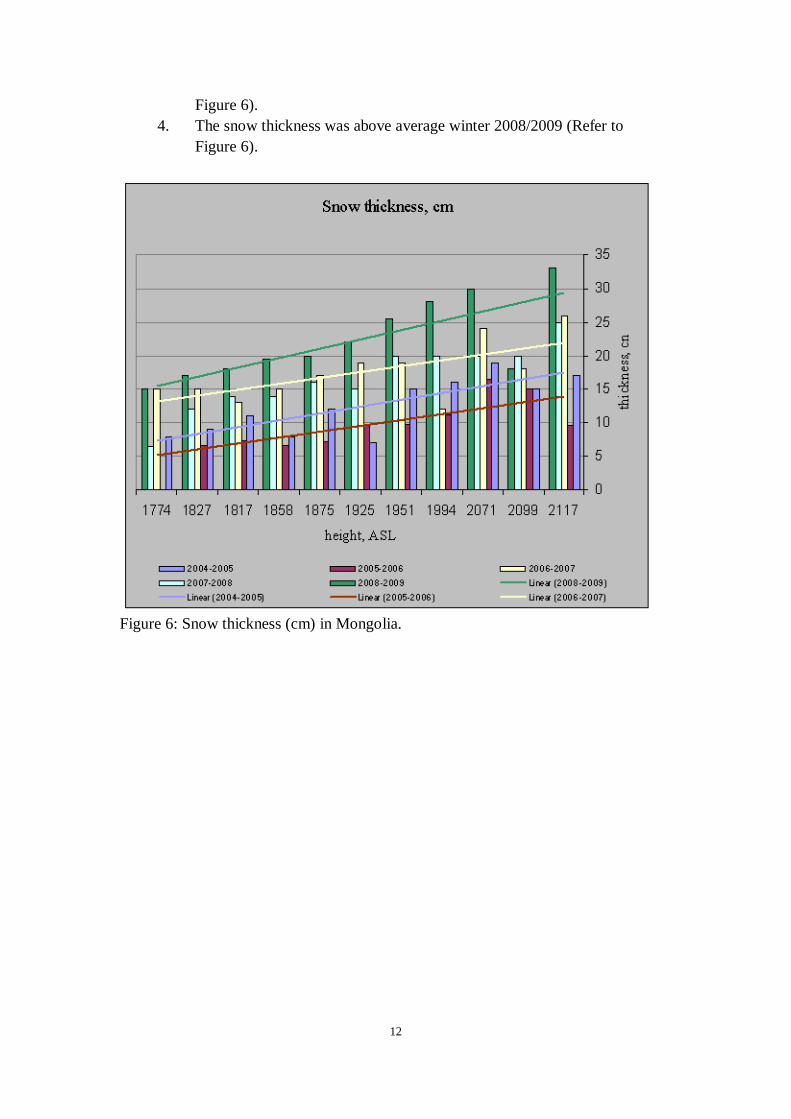
1. Snow thickness increases from valleys to mountain tops. Maximum snow thickness was recorded at an altitude of over 2000 m ASL.
2. The snow thickness was significantly different from year to year. 3. The snow thickness was below average winter 2005/2006 (Refer to
12
Figure 6). 4. The snow thickness was above average winter 2008/2009 (Refer to
Figure 6).
Figure 6: Snow thickness (cm) in Mongolia.
13
5.6 Snow cover characteristics from 223 meteorological stations over the former
USSR territory Vycheslav Razuvaev and O.N.Bulygina, All-Russian Research Institute of Hydrometeorological Information World Data Center (RIHMI-WDC), Russian Federation A data set was created from regular snow observations from 223 meteorological stations located over the former USSR territory. The data set containing daily snow data from the beginning of observation up to 2006 is published on http://www.meteo.ru and is available free of charge. Data from the stations located in former USSR republics, are published in accordance with the decisions made by the Executive Committee of the Interstate Council for Meteorology of CIS1
countries (Alma-Ata, 1993).
The data set contains 223 data files in ASCII format. Each file contains fixed-length records, 27 bytes, and each record contains 7 fields with a fixed position in the record and a fixed length. In addition, all the fields in the record are separated from each other by a “blank” character. This “dual” record formatting makes it possible to use any of the most common ways of field separation (“comma separated” or “fixed length fields”) in performing data entry into the storage software environment (DBMS), electronic tabular processors, and statistical packets. Any comments and recommendations concerning this data set can be forwarded to RIHMI-WDC:
Vyacheslav N. Razuvaev, Head of Climatology Department:
• Climatology Department, RIHMI-WDC, 6 Korolyov Str., Obninsk, Kaluga Region, 249035, Russia;
• [email protected] or Olga N. Bulygina, Leading Researcher of Climatology Department:
1 Commonweatlh of Independent States (CIS) - community of independent nations - formerly USSR
republics.
14
5.7 Frozen ground classification, mapping and monitoring in China This paper reports the development of a decision tree algorithm to classify the surface soil freeze/thaw states. The algorithm uses SSM/I brightness temperatures recorded in the early morning. Three critical indices are used as classification criteria: 1) the scattering index (SI); 2) the 37 GHz vertical polarization brightness temperature (T37V), and; 3) the 19 GHz polarization difference (PD19). The thresholds of these criteria were obtained from samples of frozen soil, thawed soil, desert, and snow. The algorithm is capable of distinguishing between frozen soil, thawed soil, desert, and precipitation. In-situ 4 cm deep soil temperatures on the Qinghai-Tibetan Plateau were used to validate the classification results, and the average classification accuracy was found to be 87%. Regarding the misclassified pixels, about 40% and 73% of them appeared when the surface soil temperature ranged from -0.5°C to 0.5°C and from -2.0°C to 2.0°C, respectively, which means that most misclassifications occurred near the soil freezing point. In addition, misclassifications mainly occurred from April to May and September to October, the transition periods between warm and cold seasons. A grid-to-grid Kappa analysis was also conducted to evaluate the consistency between the map of the actual number of frozen days obtained using the decision tree classification algorithm and the reference map of geocryological regionalization and classification in China. The overall classification accuracy was 91.7%, and the Kappa index was 80.5%. The boundary between the frozen- and the thawed soil was consistent with the southern limit of seasonally frozen ground from the reference map. The statistics show that the maximum area of frozen soil is about 6.82×10⁶ km2 in late January, accounting for 69% of total Chinese land area. 5.8 Permafrost in Kyrgyzstan Diushen Mamatkanov and Valeriy Kuzmichenok, Institute of Water Problem and Hydropower of National Academy of Sciences of Kyrgyz Republic, Bishkek City, Kyrgyz Republic Cryogenic phenomena in Kyrgyzstan are connected with mountain territories and are distributed mostly above 3000 m. However, permafrost thickness is strongly dependent on local conditions: local climate, slopes, soil properties, duration of snow cover and snow depth, and so on. In good conditions for permafrost development, the elevation can go down up to 2700 m, in adverse conditions its bottom border is sometimes between 3200 m and 3400 m. Generally, the permafrost area is 67,000 km2 and mainly distributed in the Tien Shan (84%). The maximum depth permafrost occurs in Naryn region is 200m. Cryospheric forms of relief are seasonal- and long-term frost mounds with ice lenses, debris floods, frost wedging, and thaw settlement where large ground ice is distributed.
15
The Laboratory of Institute Permafrost, Siberian branch, in the USSR (Yakutsk) was engaged in regular permafrost research in the high-mountain regions of Kazakhstan. Similar research has ceased to lack of funding. There is wide, deep ground-ice in the Kyrgyzstan permafrost region, as well as stone glaciers and postponed glacial moraines that often formed during the “small glacial age” (approximately the middle of the 19 century for the Tien Shan). In the last 30-35 years, air temperature has increased in Kyrgyzstan. Observations from 14 meteorological stations over more than 60 years have shown that the average annual air temperatures from the period of 1945-1974 to 1975-2004 is from 0.33°• - 1.24°• higher. It is obvious that such temperature changes should influence long-term frozen ground, or in the very least its top layer. Human activity also influences the condition of the permafrost. Take for example, at a height of 3626-3650 m, close to the gold mine “Kymtop”, a huge dam was built to store waste products from the rock processing that contains cyanide remains. Although the construction of the landfill dam was strictly carried out according to the contract design, it is of great importance to take into account the permafrost’s current state and thickness, as well as, unforeseen changes in the future. 5.9 Frozen ground data of Mongolia Jambaljav Yamkhin, Geography Institute of Mongolian Academy of Sciences, Mongolia, and N.Sharkhuu, Mongolian Permafrost Association, Mongolia Mongolia is located at the southern edge of the Siberian permafrost region. Therefore, northern Mongolia has permafrost, while southern Mongolia does not. In the summer of 2008, 21 boreholes were drilled. Some of these boreholes have historical data that was recorded once by movable thermistors. These boreholes, mostly 10.0 m deep, were located in the western and southern parts of the Hangai Mountain permafrost region, the Altay Mountain permafrost region, and the eastern part of the Hentei Mountain permafrost region. Global climate models suggest that the Central Asian regions may warm more than other regions. Records from land stations indicate that the mean annual air temperature has increased by 1.56oC during the last 60 years (Natsagdorj, 2001). This increase in air temperature is twice the average increase of the global air temperature. Due to its geographical location, Mongolia is characterized by arid land mountain permafrost with temperatures around zero degrees Celsius, and a deep active layer. This permafrost is vulnerable to climate change. As Mongolia is at the southern fringe of the Siberian permafrost, it is likely that changes in permafrost will involve permafrost thaw, not only permafrost warming (Etzelmuller, 2005).
16
List of active borehole in Mongolia:
1. 44 boreholes for CALM and GTN-P (N.Sharkhuu, MPA). 2. 21 boreholes were drilled by Geography Institute, MAS and are ready for
logger instrumentation. 3. 4 boreholes, instrumented by data loggers, Datamarks for recording the
surface, deep temperatures and ground moisture (Institute of Observational Research For Global Change, JAMSTEC, JAPAN).
4. 3 boreholes, instrumented by data loggers and datamarks for recording the surface, deep temperatures and ground moisture (National Institute for Environmental Studies, JAPAN).
5. Therefore, there are 72 active boreholes for temperature records. 5.10 Soil temperature observations before 320-cm depths at Russian meteorological
stations Vycheslav Razuvaev and A. B. Sherstyukov, All-Russian Research Institute of Hydrometeorological Information World Data Centre (RIHMI-WDC), Russian Federation A large soil-temperature data set was collected by the Hydrometeorological Service of Russia from more than 100 years of observations. The first meteorological stations over the Russian territory were established as early as in the 18th century, but soil temperature measurements had not been included in the observation program for a long time. At present, soil temperature observations at different depths are not included in standard meteorological observations, and are therefore conducted by a limited number of meteorological stations. Major depths of soil temperature observations (from draw-out thermometer data) are 20, 40, 80, 160 and 320 cm, and extra depths are 60 cm (out of use since the 1960s), 120 cm and 240 cm. Observations from draw-out thermometers at 80-320-cm depths are performed throughout the year once a day at 02:00 p.m. (winter Daylight Saving Time). Observations at 20 and 40 cm in the warm part of the year are performed in the same synchronous hours. In winter, when snow height attains 15 cm or more, observations are conducted once a day at the time closest to 02:00 p.m. (winter Daylight Saving Time). Observations in the same synchronous hours are resumed in spring when snow height is less than 5 cm. At individual depths or at all depths concurrently, observations were sometimes interrupted by reasons not always known. This resulted in gaps in the data archives.
17
Sometimes these gaps fell on different historical events and transition periods in the development of the country. The number of stations conducting soil temperature observations at depths up to 320 cm and the completeness of their data varies. For example, observations as deep as 320 cm and 80 cm are conducted by 450 and 610 stations respectively. Of these, the number of WMO stations is slightly lower (about 300 stations for 320 cm). 5.11 Glacier data in China Xin Li, Chinese Academy of Sciences, China Up-to-date statistics on mountain glaciers was derived from the Chinese Glacier Inventory (CGI), which was accomplished in 2002, and the Chinese Glacier Information System (CGIS), which was established in 2004. The CGIS is a modified CGI, in which strict quality control was conducted. Glacier distribution from CGI maps and from topographic maps was digitized, and some editing errors in CGI were corrected. According to the CGIS and the Concise Chinese Glacier Inventory, there are 46,377 glaciers in China that cover an area of 59,425.18 km2, which is 51.2% and 10.9–11.6% of the mountain glacier area in Asia (116.18×10³ km2) and on Earth (excluding the glaciers and ice caps surrounding Greenland and the Antarctic ice sheets) (512×103 – 546×103 km2) respectively. The total ice reserve was estimated using empirical relationships established by regression analysis of the glacier areas and radar-measured glacier depths. The total ice reserve of Chinese mountain glaciers is estimated to be about 5600 km3 or 5.04×10¹² m3 in water equivalent, which is about five times the annual runoff of the Yangtze River (9.6×10¹¹ m3). Annual glacier runoff was about 61.6×10⁹ m3 in 1980, when the glaciers were inventoried. The value was estimated by using the systematic model, which was based on an empirical equation relating glacier ablation with mean summer temperature. Glacier runoff is a very important water resource in the arid regions of northwest China. In western China, glacier runoff accounts for 11.9% of total discharge. For inland rivers and outflow rivers glacier runoff accounts for 24.3% and 8.7% of the annual runoff respectively. 5.12 Progresses on the Second Glacier Inventory of China Liu Shiyin and Guo Wanqin, State Key Laboratory of Cryosphere Science, Chinese Academy of Sciences, China Remote sensing data used in the Second Glacier Inventory of China include EOS- ASTER, Landsat 5/7 TM/ETM+, CBERS 02B HR, SPOT 4/5 HRVIR, DEM (SRTM V3, Topo-DEM, and GDEM), Google Earth, and Field observation data. The ASTER images are the main data, and about 2378 ASTER L1A/L1B images from USGS with the total data volume of 272.5 GB have been obtained.
18
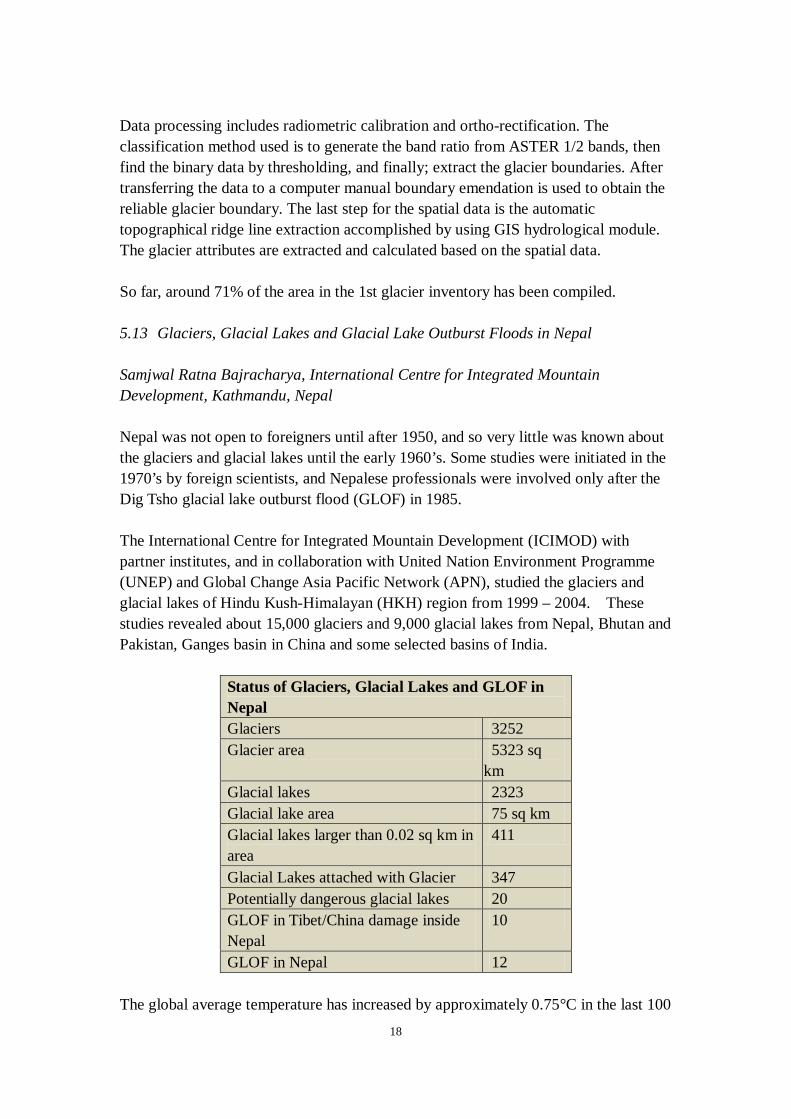
Data processing includes radiometric calibration and ortho-rectification. The classification method used is to generate the band ratio from ASTER 1/2 bands, then find the binary data by thresholding, and finally; extract the glacier boundaries. After transferring the data to a computer manual boundary emendation is used to obtain the reliable glacier boundary. The last step for the spatial data is the automatic topographical ridge line extraction accomplished by using GIS hydrological module. The glacier attributes are extracted and calculated based on the spatial data. So far, around 71% of the area in the 1st glacier inventory has been compiled. 5.13 Glaciers, Glacial Lakes and Glacial Lake Outburst Floods in Nepal Samjwal Ratna Bajracharya, International Centre for Integrated Mountain Development, Kathmandu, Nepal Nepal was not open to foreigners until after 1950, and so very little was known about the glaciers and glacial lakes until the early 1960’s. Some studies were initiated in the 1970’s by foreign scientists, and Nepalese professionals were involved only after the Dig Tsho glacial lake outburst flood (GLOF) in 1985. The International Centre for Integrated Mountain Development (ICIMOD) with partner institutes, and in collaboration with United Nation Environment Programme (UNEP) and Global Change Asia Pacific Network (APN), studied the glaciers and glacial lakes of Hindu Kush-Himalayan (HKH) region from 1999 – 2004. These studies revealed about 15,000 glaciers and 9,000 glacial lakes from Nepal, Bhutan and Pakistan, Ganges basin in China and some selected basins of India.
Status of Glaciers, Glacial Lakes and GLOF in Nepal Glaciers 3252 Glacier area 5323 sq
km Glacial lakes 2323 Glacial lake area 75 sq km Glacial lakes larger than 0.02 sq km in area
411
Glacial Lakes attached with Glacier 347 Potentially dangerous glacial lakes 20 GLOF in Tibet/China damage inside Nepal
10
GLOF in Nepal 12 The global average temperature has increased by approximately 0.75°C in the last 100
19
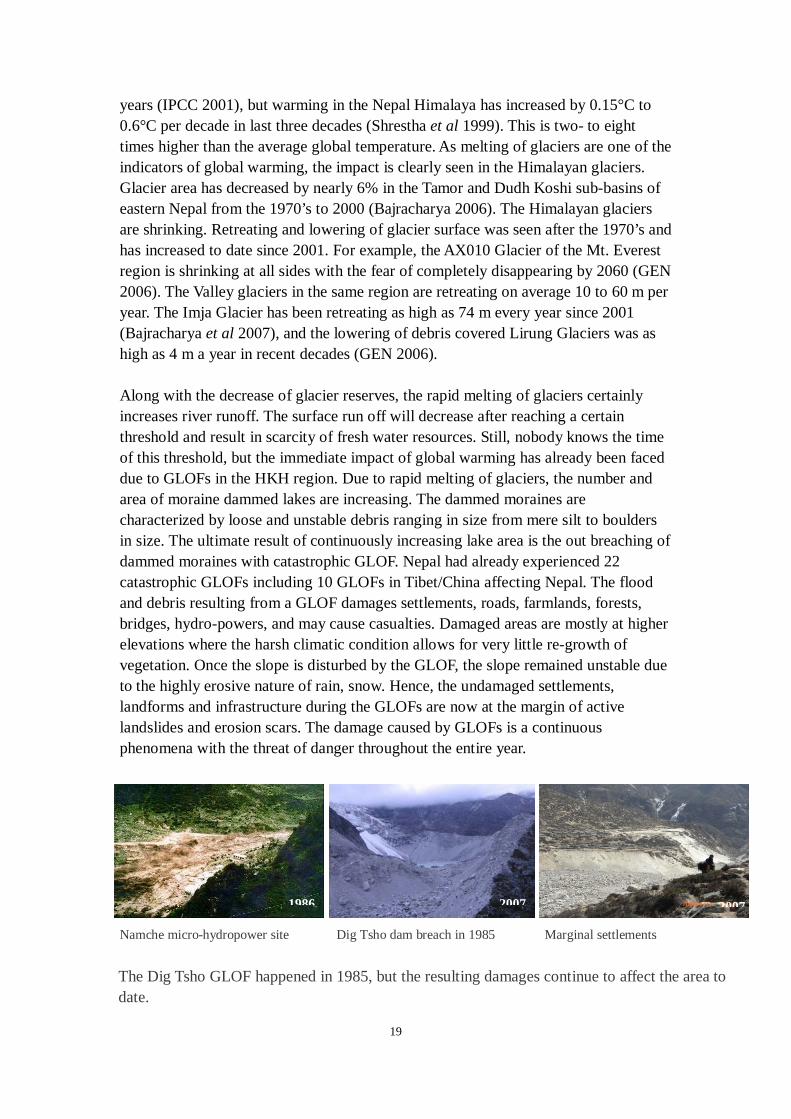
years (IPCC 2001), but warming in the Nepal Himalaya has increased by 0.15°C to 0.6°C per decade in last three decades (Shrestha et al 1999). This is two- to eight times higher than the average global temperature. As melting of glaciers are one of the indicators of global warming, the impact is clearly seen in the Himalayan glaciers. Glacier area has decreased by nearly 6% in the Tamor and Dudh Koshi sub-basins of eastern Nepal from the 1970’s to 2000 (Bajracharya 2006). The Himalayan glaciers are shrinking. Retreating and lowering of glacier surface was seen after the 1970’s and has increased to date since 2001. For example, the AX010 Glacier of the Mt. Everest region is shrinking at all sides with the fear of completely disappearing by 2060 (GEN 2006). The Valley glaciers in the same region are retreating on average 10 to 60 m per year. The Imja Glacier has been retreating as high as 74 m every year since 2001 (Bajracharya et al 2007), and the lowering of debris covered Lirung Glaciers was as high as 4 m a year in recent decades (GEN 2006). Along with the decrease of glacier reserves, the rapid melting of glaciers certainly increases river runoff. The surface run off will decrease after reaching a certain threshold and result in scarcity of fresh water resources. Still, nobody knows the time of this threshold, but the immediate impact of global warming has already been faced due to GLOFs in the HKH region. Due to rapid melting of glaciers, the number and area of moraine dammed lakes are increasing. The dammed moraines are characterized by loose and unstable debris ranging in size from mere silt to boulders in size. The ultimate result of continuously increasing lake area is the out breaching of dammed moraines with catastrophic GLOF. Nepal had already experienced 22 catastrophic GLOFs including 10 GLOFs in Tibet/China affecting Nepal. The flood and debris resulting from a GLOF damages settlements, roads, farmlands, forests, bridges, hydro-powers, and may cause casualties. Damaged areas are mostly at higher elevations where the harsh climatic condition allows for very little re-growth of vegetation. Once the slope is disturbed by the GLOF, the slope remained unstable due to the highly erosive nature of rain, snow. Hence, the undamaged settlements, landforms and infrastructure during the GLOFs are now at the margin of active landslides and erosion scars. The damage caused by GLOFs is a continuous phenomena with the threat of danger throughout the entire year.
Namche micro-hydropower site Dig Tsho dam breach in 1985 Marginal settlements
The Dig Tsho GLOF happened in 1985, but the resulting damages continue to affect the area to date.
1986 2007 2007
20
To reduce the risk of GLOFs and strengthen the mountain people’s resilience, ICIMOD initiated the following activities in the Mt. Everest region in 2008:
• Simulation of GLOF To understand the GLOF discharge and travel time with flood depth adjacent to village along the river valley.
• Vulnerability and risk assessment Vulnerability and risk assessment was carried out downstream of Imja Tsho to identify the GLOF risk area along the river valley.
• Near real time monitoring With cooperation of ESA, acquisition of radar satellite images to monitor the lake Imja Tsho, as this lake is one of the fastest growing lakes in the Himalaya.
• Real time monitoring With cooperation of Keio University of Japan networking of field sensors and transmission station at Imja Tsho was installed to measure Lake water level, total weather station with web camera for the monitoring of Lake Imja Tsho
• Rural wireless internet connectivity Facility of Wireless Internet is provided at Chhukung, Pangboche, Tengboche and Dingboche Villages.
• Create awareness global to local o ICIMOD opened an Information Center at the Everest Base Camp
from 12 June to 12 May 2008.The center provides information about the climate change impact in the Himalaya with repeat photographs of Himalayan glaciers from 1956 to 2006. ICIMOD and Asian Trekking jointly organised different activities under the EcoEverest Expedition program, and the following message from Director General of ICIMOD was read by Mt. Everest summiteers Dawa Steven Sherpa
Message: “Let us care for Environment of Himalaya and strengthen its people’s determination and resilience”
o GLOF Awareness Workshop 25th April 2008 on “Climate change
impact in the Himalaya: Glacial Lake Outburst Flood (GLOF)” was organised for the local people in Namche Bazaar (Gate way to Mount Everest). Mountaineer Appa Sherpa (18 times Mt. Everest summiteers), Dawa Steven Sherpa (leader of Eco Everest Expedition), Japanese team from Keio University and NHK TV team, local media people, senior citizens and about 50 local people with ICIMOD experts all contributed to the workshop.
• Early Warning Systems
21
Need to develop web based Early Warning System as the local people has now access of wireless Internet connectivity but still not materialized.
ICIMOD Program in 2008 to 2012
• Regional Level Cryosphere (Workshop) in March 31 to 2 April 2009 to develop the Status of glaciers, snow and ice and glacial lakes in the HKH region.
• Revisit inventory of glaciers and glacial lakes on the basis of Landsat/ASTER satellite images
• Field Investigation of high priority (3 to 5) potential GLOF lakes o Topographical surveying o Geo-physical studies of the moraine damming the lake o Ground Penetrating Radar (GPR) o Bathymetric survey of lake o Hydro-metrology of lake and downstream areas o Geological, Geomorphological studies o Possible GLOF triggering factors o Downstream impact assessment with modeling techniques o RS based primary EWS
• Recommendations for overall national strategy on GLOF mitigation and adaptation measures
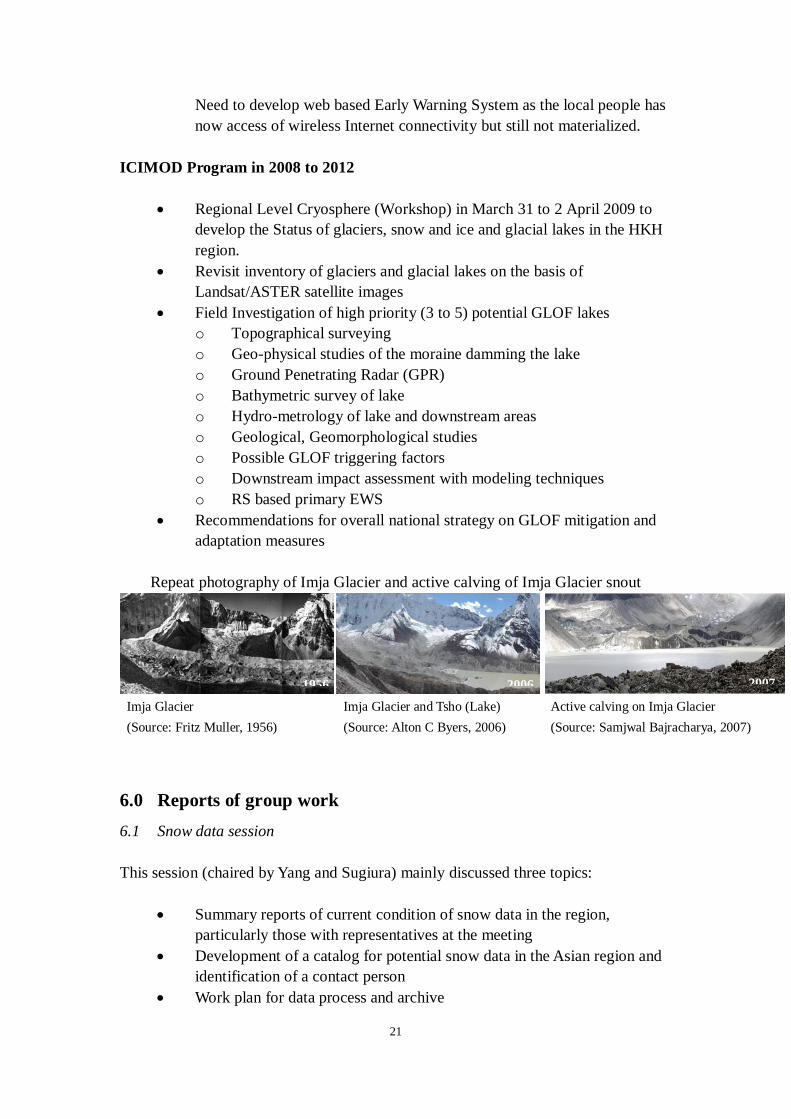
Repeat photography of Imja Glacier and active calving of Imja Glacier snout
Imja Glacier
(Source: Fritz Muller, 1956)
Imja Glacier and Tsho (Lake)
(Source: Alton C Byers, 2006)
Active calving on Imja Glacier
(Source: Samjwal Bajracharya, 2007)
6.0 Reports of group work
6.1 Snow data session This session (chaired by Yang and Sugiura) mainly discussed three topics:
• Summary reports of current condition of snow data in the region, particularly those with representatives at the meeting
• Development of a catalog for potential snow data in the Asian region and identification of a contact person
• Work plan for data process and archive
1956 2006 2007
22
After extensive discussions, the group agreed on the following actions: Step1: In order to have compatible data catalog for all the countries, an example is necessary. Colleagues in China, led by Dr. Che, will produce such an example and send it to all participants within a week after the workshop. Step 2: Catalogs of current snow data (snow depth, snow density, snow water equivalence, snow structure, and so on) in each country will be produced and submitted to Dr. Che in China. He will compile the data, make maps of snow stations in the region, and distribute these maps to the workshop participants within a month after the meeting. Additionally, there is need to engage other countries (not present at the workshop, such as Pakistan, India, Iran, Korea and so on) and identify the contact persons for communications. It was suggested to produce a flier for the snow group to explain the goals and procedures of regional snow dataset development. The co-chairs (Drs. Zhang and Rezuvaev) agreed to take a lead on this work. Step 3: Planning cooperative research projects The goal of this effort is to develop regional snow data for cold regions hydrology, glacier, and climate research. It was agreed that discussion on how to plan and develop cooperative research projects of snow cover hydrology over the region should continue. Step 4: Producing new products using station snow data The outcomes of this collaboration are new snow products, such as regional snow extent, snow depth and SWE maps and data sets. The group recognizes the need to work together to achieve the best snow products over Asian countries. JAMSTEC in Japan agreed to construct a new website for the snow data project which major function will be to promote the project concept (not store data). The location of snow data storage was discussed at the workshop, but no agreement was made. The agreed to postpone the data storage issue for the time being. Data exchange issues were also discussed in the session. The group understands that countries have different data policies -- some of them very strict -- making data sharing difficult. There is a need to investigate, in detail, the variation of data policy among the nations in the region. China is a large country in Asia, it was suggested that the snow data collected in China should be open for research and exchange. It was hoped that this effort under CliC will be the first step of Asian regional snow datasets and products. This idea will expand to other regions and countries in the future.
23
Finally, the group agrees to have Dr. Zhang and Dr. Rezuvaev as co-chairs of the snow data working group. Dr. Zhang and Dr. Rezuvaev agreed to continue to serve as co-chairs. 6.2 Glacier data session 6.2.1 Presentations The glacier data session, chaired by Xin Li, received three presentations. Mr. Bajracharya from ICIMOD reported on “glacier and glacier lakes in Indu-Kush area”, Prof. Kuzmichenok from the Institute of Water Problem and Hydropower of National Academy of Sciences of Kyrgyz Republic presented on “the glacier data in Kyrgyz”, and Dr. Guo, on behalf of Prof. Shiyin Liu of CAREERI/CAS, introduced the “second Chinese Glacier Inventory”. 6.2.2 Current data conditions The current conditions of glacier data in the region were summarized based on the presentations and ground discussion.
• Glacier data for Indu-Kush area has been archived in ICIMOD and released on Internet.
• For China, the first glacier inventory is available online with a web information system. The second one will be accomplished in a few years and the data sharing is possible.
• For Russia, the data (digital one) are probably available in the geography institute, Russian Academy of Science. Prof. Razuvaev will pass the presentations to Russian Colleague for possible data sharing from Russian colleagues.
• Mongolia, the glacier data belong to the met. and hydro. department. It was mentioned that: o Japanese colleagues have worked on the Mongolia Glacier
inventory for the 1970s with a map scale of 1:100,000. Additionally, a new inventory of 2009 was carried out using the LandSat TM images. It will be finished by 2009.
o The DEM accuracy is very important. Generally, the SRTM or ASTER generated DEM are available for glacier mapping and change analysis.
• Kyrgyz, the glacier data have been sent to the glacier monitoring and Lanzhou. There is some difference of the inventory with the IGS (International Glaciology Society) standard. The following issues were discussed: o The new inventory was carried out in some glacier-covered regions. o Some colleagues asked if there was a plan to inventory all of the
glaciers in Kyrgyz. The answer was that it depends on the materials
24
and the financial supports available. o ICIMOD is going to extend the glacier inventory to central Asia.
The plan is to work with Kyrgyz by providing software (ERDAS and ArcInfo) and analysis aid. A lab in Hydro. Institute will be a partner.
o The availability of very-high-resolution remote-sensing images, e.g., ALOS and Quickbird, was discussed.
o Financial issues were discussed. o The collaboration with Lanzhou was discussed. o It was suggested that the Institute of Water Problem and
Hydropower, Kyrgyz act as a communication center for central Asian countries.
6.2.3 Potential contact persons (focal points)
• China, Prof. Shiyin Liu • ICIMOD, Mr. Bajracharya, S. • Central Asia, the Institute of Water Problem and Hydropower Kyrgyz as a
communication center 6.2.4 Plan the schedule of data processing and archive
• The digitalization of Kyrgyz glacier maps? o A 1:800,000 map of the whole country is now available. o Large-scale maps for some regions are available. o CAREERI and ICIMOD can do the digitalization if scanned maps
can be prepared • For schedule, follow the snow session • Key contact point needs to be identified.
6.2.5 Other issues
• The coordination with GLIMS should be strengthened. • It was suggested that the glacier lakes need to be inventoried.
6.3 Frozen ground data session 6.3.1 Presentations There were six oral presentations during the Frozen Ground Data Session. Dr. Zhang gave an overview of frozen ground data from the National Snow and Ice Data Center (NSIDC), University of Colorado at Boulder, USA, followed by five 30-minutes oral presentations of related data issues from Russia, Mongolia, Japan, Kyrgyz Republic, and China. Zhang’s presentation provided an overall introduction on what we have, and would like to have, at the Frozen Ground Data Center (FGDC/NSIDC), especially data over the Eurasian Continent. The key issue is data rescue from individual projects over the past decades and soil temperature data from national meteorological
25
stations up to 3.2 m. Monthly mean soil temperature data of up 3.2 m depth, including data from about 40 permafrost sites, have been transferred from Russian colleagues to FGDC/NSIDC. Colleagues from Japan and Alaska also worked with colleagues in Russia and have this kind of soil temperature data. He pointed out that a coordinated effort should be carried out for more efficient approach. This will also reduce workload to our Russian colleagues for repeated work. Deep borehole permafrost temperature data exist in Russia but hardly available to this community. Soil temperature data from Mongolia and China of up to 3.2 m depth have been identified but not available to this community. Efforts for such soil temperature and deep borehole data should also be carried out from other Eurasian countries. Dr. V. Razuvaev (Russia) reported that daily snow- and soil-temperature data up to 3.2 m depth are both in preparation for his group. He expressed that these data will be available to the Asia-CliC project when ready. Drs. Ya.Jambaljav and N.Sharkhuu from Mongolia summarized permafrost studies from various agencies and individuals. Most data are still in individual hands, and they will look into preparing them for Asia-CliC. They also discussed daily snow data and soil temperature data up to 3.2 m depth in Mongolia. Dr. Jambaljav and his colleagues will explore possibilities for sharing these data with this group and the scientific community at large. Frozen ground data and information from Kyrgyzstan was reported by Prof. V. Kuzmichenok and his group. They are very eager to work with the community. Dr. Ohata and his group provided detailed cryospheric data inventory, including soil temperatures and permafrost data, from various agencies, universities, institutions, and individuals in Japan. These data sets cover both data from inside and outside of Japan. As they reported, data are available to the public, with the exception of institutional data from Japan. Dr. Rui Jin from China gave a comprehensive review of a frozen ground study in Chinausing satellite remote sensing. He also provided detailed information on soil temperature and permafrost data. However, most of these data are still in individual hands. Data-rescue and data-sharing efforts needs to be carried out aggressively. 6.3.2 Breakout Discussions During the breakout session, the following issues were discussed: 1). Soil Temperature: collect and rescue soil temperature data from standard meteorological stations across the Eurasia, up to 3.2 m deep. Monthly soil temperature data from more than 400 stations in Russia have been transferred to NSIDC. There are about 900 stations where soil temperatures at various depths were,
26
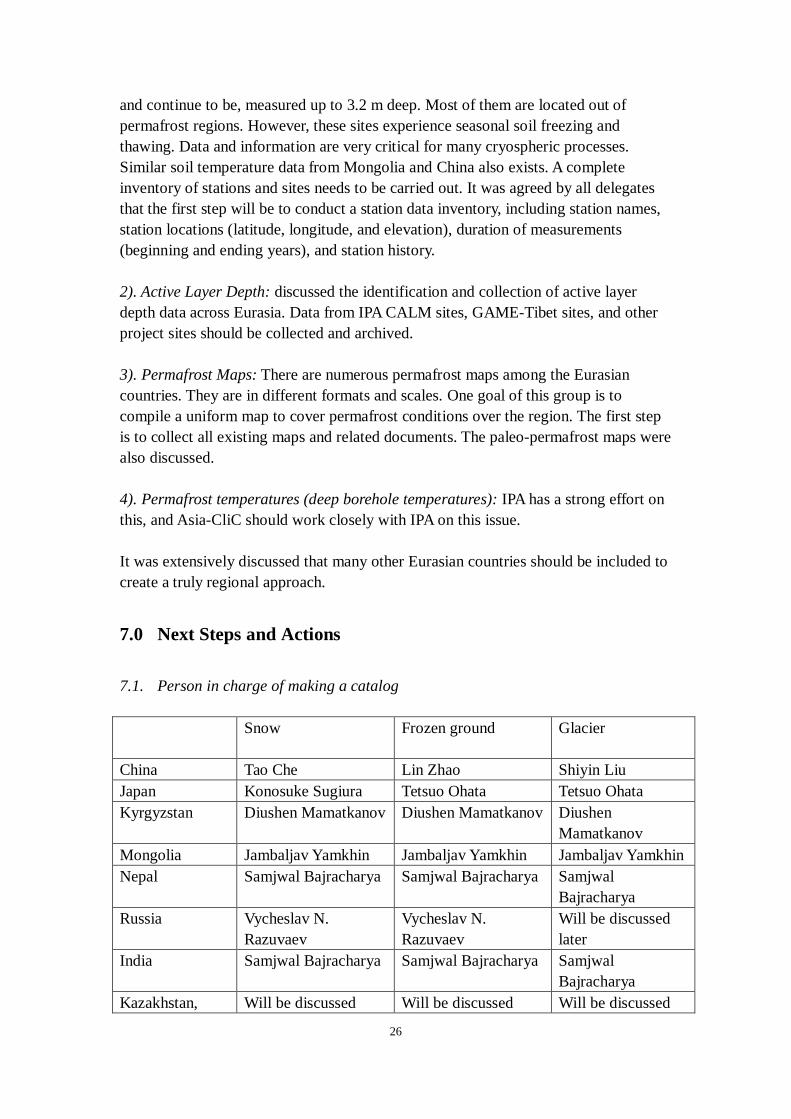
and continue to be, measured up to 3.2 m deep. Most of them are located out of permafrost regions. However, these sites experience seasonal soil freezing and thawing. Data and information are very critical for many cryospheric processes. Similar soil temperature data from Mongolia and China also exists. A complete inventory of stations and sites needs to be carried out. It was agreed by all delegates that the first step will be to conduct a station data inventory, including station names, station locations (latitude, longitude, and elevation), duration of measurements (beginning and ending years), and station history. 2). Active Layer Depth: discussed the identification and collection of active layer depth data across Eurasia. Data from IPA CALM sites, GAME-Tibet sites, and other project sites should be collected and archived. 3). Permafrost Maps: There are numerous permafrost maps among the Eurasian countries. They are in different formats and scales. One goal of this group is to compile a uniform map to cover permafrost conditions over the region. The first step is to collect all existing maps and related documents. The paleo-permafrost maps were also discussed. 4). Permafrost temperatures (deep borehole temperatures): IPA has a strong effort on this, and Asia-CliC should work closely with IPA on this issue. It was extensively discussed that many other Eurasian countries should be included to create a truly regional approach.
7.0 Next Steps and Actions
7.1. Person in charge of making a catalog Snow Frozen ground Glacier
China Tao Che Lin Zhao Shiyin Liu Japan Konosuke Sugiura Tetsuo Ohata Tetsuo Ohata Kyrgyzstan Diushen Mamatkanov Diushen Mamatkanov Diushen
Mamatkanov Mongolia Jambaljav Yamkhin Jambaljav Yamkhin Jambaljav Yamkhin Nepal Samjwal Bajracharya Samjwal Bajracharya Samjwal
Bajracharya Russia Vycheslav N.
Razuvaev Vycheslav N. Razuvaev
Will be discussed later
India Samjwal Bajracharya Samjwal Bajracharya Samjwal Bajracharya
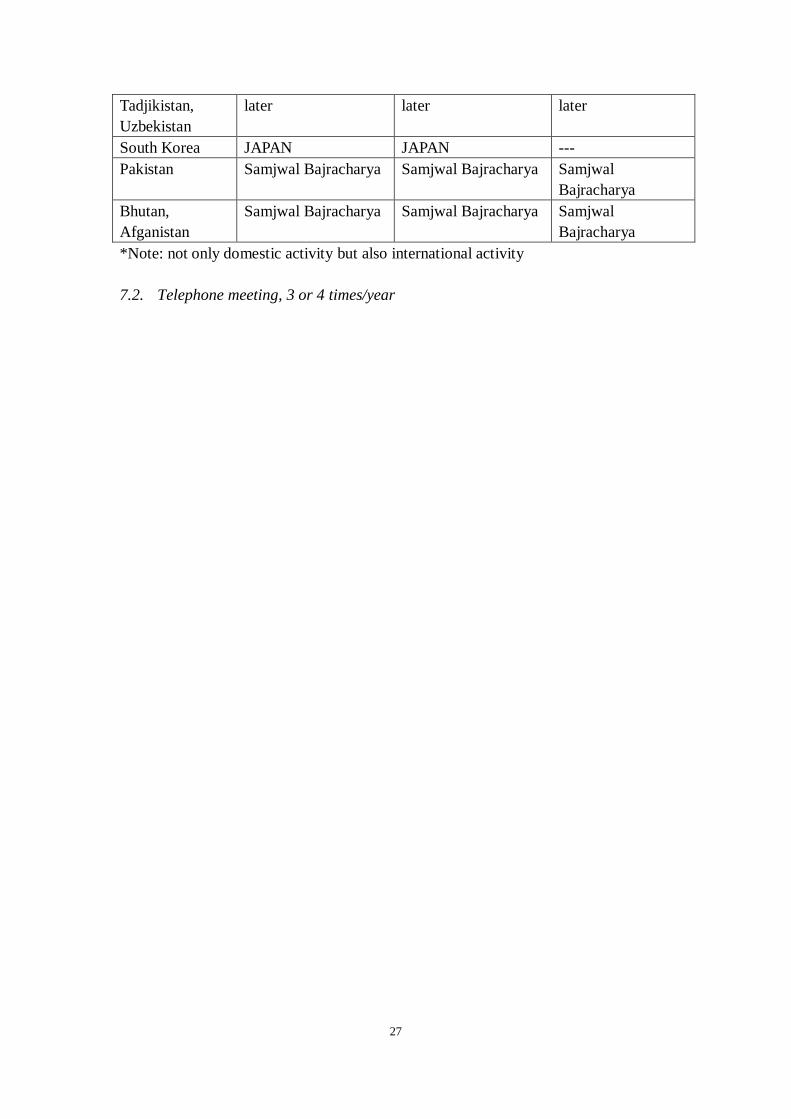
Kazakhstan, Will be discussed Will be discussed Will be discussed
27
Tadjikistan, Uzbekistan
later later later
South Korea JAPAN JAPAN --- Pakistan Samjwal Bajracharya Samjwal Bajracharya Samjwal
Bajracharya Bhutan, Afganistan
Samjwal Bajracharya Samjwal Bajracharya Samjwal Bajracharya
*Note: not only domestic activity but also international activity 7.2. Telephone meeting, 3 or 4 times/year

28
APPENDICES
Appendix 1
29
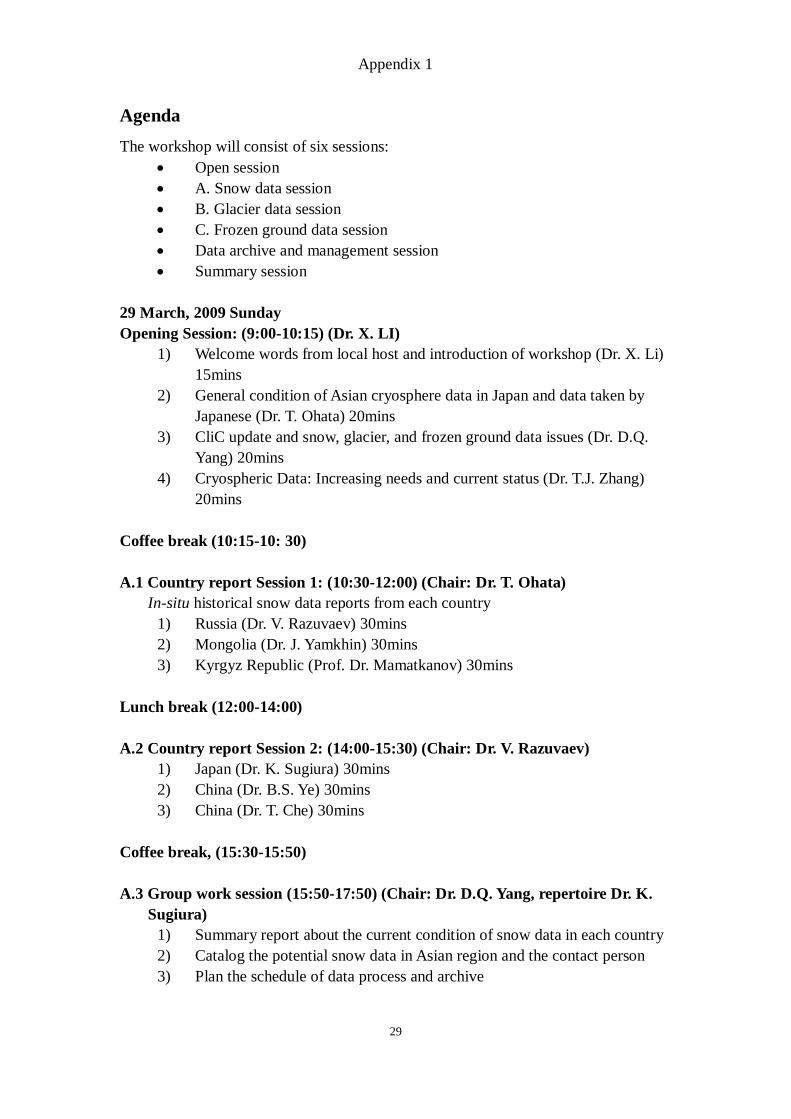
Agenda
The workshop will consist of six sessions: • Open session • A. Snow data session • B. Glacier data session • C. Frozen ground data session • Data archive and management session • Summary session
29 March, 2009 Sunday Opening Session: (9:00-10:15) (Dr. X. LI)
1) Welcome words from local host and introduction of workshop (Dr. X. Li) 15mins
2) General condition of Asian cryosphere data in Japan and data taken by Japanese (Dr. T. Ohata) 20mins
3) CliC update and snow, glacier, and frozen ground data issues (Dr. D.Q. Yang) 20mins
4) Cryospheric Data: Increasing needs and current status (Dr. T.J. Zhang) 20mins
Coffee break (10:15-10: 30) A.1 Country report Session 1: (10:30-12:00) (Chair: Dr. T. Ohata)
In-situ historical snow data reports from each country 1) Russia (Dr. V. Razuvaev) 30mins 2) Mongolia (Dr. J. Yamkhin) 30mins 3) Kyrgyz Republic (Prof. Dr. Mamatkanov) 30mins
Lunch break (12:00-14:00) A.2 Country report Session 2: (14:00-15:30) (Chair: Dr. V. Razuvaev)
1) Japan (Dr. K. Sugiura) 30mins 2) China (Dr. B.S. Ye) 30mins 3) China (Dr. T. Che) 30mins
Coffee break, (15:30-15:50) A.3 Group work session (15:50-17:50) (Chair: Dr. D.Q. Yang, repertoire Dr. K.
Sugiura) 1) Summary report about the current condition of snow data in each country 2) Catalog the potential snow data in Asian region and the contact person 3) Plan the schedule of data process and archive
Appendix 1
30
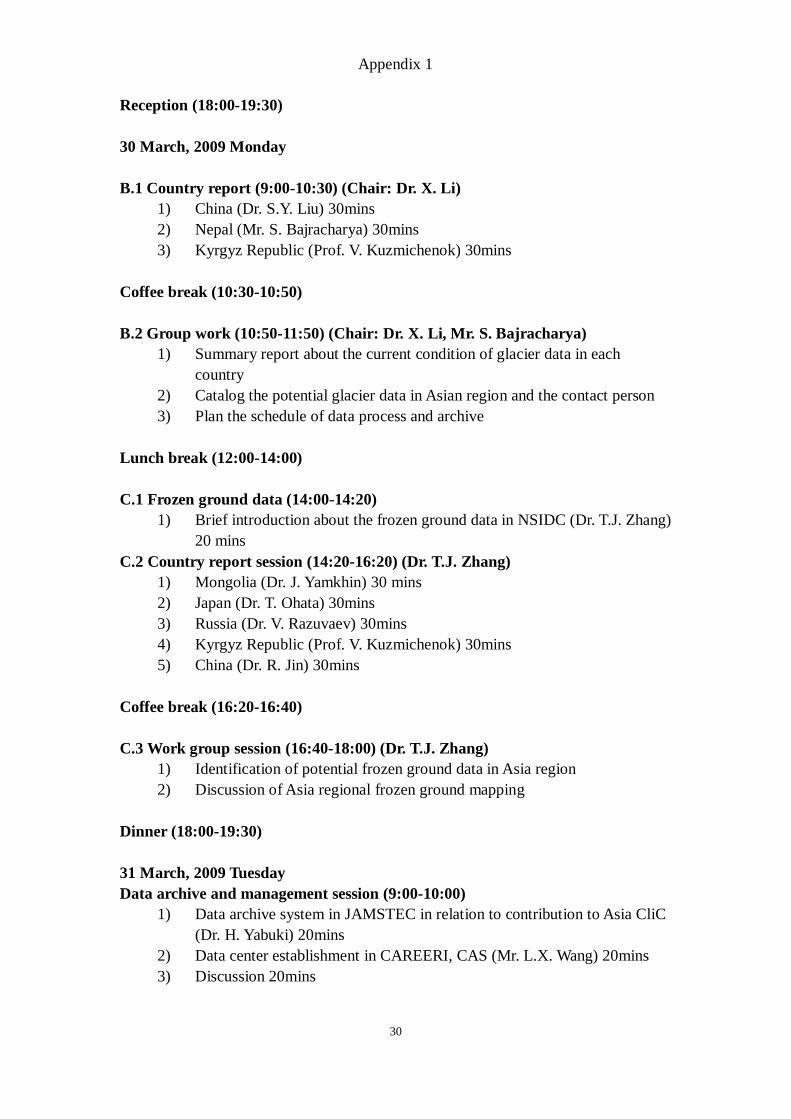
Reception (18:00-19:30) 30 March, 2009 Monday B.1 Country report (9:00-10:30) (Chair: Dr. X. Li)
1) China (Dr. S.Y. Liu) 30mins 2) Nepal (Mr. S. Bajracharya) 30mins 3) Kyrgyz Republic (Prof. V. Kuzmichenok) 30mins
Coffee break (10:30-10:50) B.2 Group work (10:50-11:50) (Chair: Dr. X. Li, Mr. S. Bajracharya)
1) Summary report about the current condition of glacier data in each country
2) Catalog the potential glacier data in Asian region and the contact person 3) Plan the schedule of data process and archive
Lunch break (12:00-14:00) C.1 Frozen ground data (14:00-14:20)
1) Brief introduction about the frozen ground data in NSIDC (Dr. T.J. Zhang) 20 mins
C.2 Country report session (14:20-16:20) (Dr. T.J. Zhang) 1) Mongolia (Dr. J. Yamkhin) 30 mins 2) Japan (Dr. T. Ohata) 30mins 3) Russia (Dr. V. Razuvaev) 30mins 4) Kyrgyz Republic (Prof. V. Kuzmichenok) 30mins 5) China (Dr. R. Jin) 30mins
Coffee break (16:20-16:40) C.3 Work group session (16:40-18:00) (Dr. T.J. Zhang)
1) Identification of potential frozen ground data in Asia region 2) Discussion of Asia regional frozen ground mapping
Dinner (18:00-19:30) 31 March, 2009 Tuesday Data archive and management session (9:00-10:00)
1) Data archive system in JAMSTEC in relation to contribution to Asia CliC (Dr. H. Yabuki) 20mins
2) Data center establishment in CAREERI, CAS (Mr. L.X. Wang) 20mins 3) Discussion 20mins

Appendix 1
31
Summary Session (10:00-12:00) Summary for snow, glacier and frozen ground data (Chair: Dr. T.J. Zhang)
1) Snow summary (Dr. D.Q. Yang) 15mins 2) Glacier summary (Dr. X. Li) 15mins 3) Frozen ground summary (Dr. T.J. Zhang) 15mins
Coffee break (10:45-11:00) Plan for next step (11:00-12:00)
1) Future plans and actions 2) Seeking potential funding 3) Planning next workshop 4) Workshop report
Lunch break (12:00-14:00) Visit yellow river watermill park (14:00-18:00) The costs of transport and ticket will be paid by CAREERI. Dinner (18:00)
Appendix 2
32
List of Participants
Xin Li Cold and Arid Regions Environmental and Engineering Research Institute, Chinese Academy of Sciences, World Data Center for Glaciology and Geocryology in Lanzhou 320 West Donggang Road, Lanzhou, 730000, China [email protected] Phone/Fax: +86-931-4967249/ +86-931-8279161 Tetsuo Ohata Institute of Observational Research for Global Change (IORGC), Japan Agency for Marine-Earth Science and Technology (JAMSTEC) 2-15, Natsushima-cho, Yokosuka, 237-006, Japan [email protected] Phone/Fax: +81-46-867-9250/ +81-46-867-9255 Tingjun Zhang National Snow and Ice Data Center 1540 30th Street NSIDC/CIRES, 449 UCB University of Colorado Boulder, CO 80309-0449, USA [email protected] Phone/Fax: +1-303-492-5236/ +1-303-492-2468 Daqing Yang CliC International Project Office Polar Environmental Center Norwegian Polar Institute, N-9296 Tromsø. Norway [email protected]; [email protected] Ph/Fx: +47-77-750-145/ +47-77-750-501
Vycheslav N. Razuvaev All-Russian Research Institute of Hydrometeorological Information World Data Centre (RIHMI-WDC) 6 Korolev St., Obninsk, Kaluga Reg., 249035, Russian Federation [email protected] Ph/Fx: +7-495-255-21-94/ +7-495-255-22-25 Diushen Mamatkanov Institute of Water Problem and Hydropower National Academy of Sciences of Kyrgyz Republic. 533, Frunze str. Bishkek city, Kyrgyz Republic [email protected] Ph/Fx: +996-312-323-928, +996-312-323-815 Jambaljav Yamkhin Geography Institute, MAS Ulaanbaatar 210620, Mongolia [email protected] Phone: +976-11-350-471 Samjwal Bajracharya International Centre for Integrated Mountain Development Khumaltar, Lalitpur, GPO Box 3226 Kathmandu, Nepal [email protected] Ph/Fx: +977-1-500-3222
Appendix 2
33
Konosuke Sugiura Institute of Observational Research for Global Change (IORGC), JAMSTEC) 2-15, Natsushima-cho, Yokosuka, 237-0061, Japan [email protected] Ph/Fx: +81-46-867-9279/ +81-46-867-9255 Hiroyuki Yabuki Institute of Observational Research for Global Change (IORGC), JAMSTEC 2-15 Natsushima-cho, Yokosuka-city, Kanakawa, 237-0061, Japan [email protected] Ph/Fx: +81-46-867-9268/ +81-46-867-9255 Yongjian Ding Cold and Arid Regions Environmental and Engineering Research Institute Chinese Academy of Sciences World Data Center for Glaciology and Geocryology in Lanzhou 320 West Donggang Road Lanzhou, 730000, China [email protected] Ph/Fx: +86-931-4967524 Shiyin Liu Cold and Arid Regions Environmental and Engineering Research Institute Chinese Academy of Sciences World Data Center for Glaciology and Geocryology in Lanzhou 320 West Donggang Road Lanzhou, 730000, China [email protected] Ph/Fx: +86-931-4967375
Baisheng Ye Cold and Arid Regions Environmental and Engineering Research Institute, Chinese Academy of Sciences, World Data Center for Glaciology and Geocryology in Lanzhou 320 West Donggang Road, Lanzhou, 730000, China [email protected] Ph/Fx: +86-931-4967399/ Qingbai Wu Cold and Arid Regions Environmental and Engineering Research Institute Chinese Academy of Sciences World Data Center for Glaciology and Geocryology in Lanzhou 320 West Donggang Road Lanzhou, 730000, China [email protected] Ph/Fx: +86-931-4967284/ Huijun Jin Cold and Arid Regions Environmental and Engineering Research Institute, Chinese Academy of Sciences, World Data Center for Glaciology and Geocryology in Lanzhou 320 West Donggang Road, Lanzhou, 730000, China [email protected] Ph/Fx: +86-931-4967284/ Rui Jin Cold and Arid Regions Environmental and Engineering Research Institute Chinese Academy of Sciences, World Data Center for Glaciology and Geocryology in Lanzhou 320 West Donggang Road Lanzhou, 730000, China [email protected] Ph/Fx: +86-931-4967298/ +86-931-8279161
Appendix 2
34
Tao Che Cold and Arid Regions Environmental and Engineering Research Institute, Chinese Academy of Sciences, World Data Center for Glaciology and Geocryology in Lanzhou 320 West Donggang Road, Lanzhou, 730000, China [email protected] Ph/Fx: +86-931-4967966/ +86-931-8279161 Valeriy Kuzmichenok Institute of Water Problem and Hydropower of National Academy of Sciences of Kyrgyz Republic. 533, Frunze str., Bishkek city, Kyrgyz Republic [email protected] Phone/Fax: +996-312-323-928, +996-312-323-815
Appendix 3
35
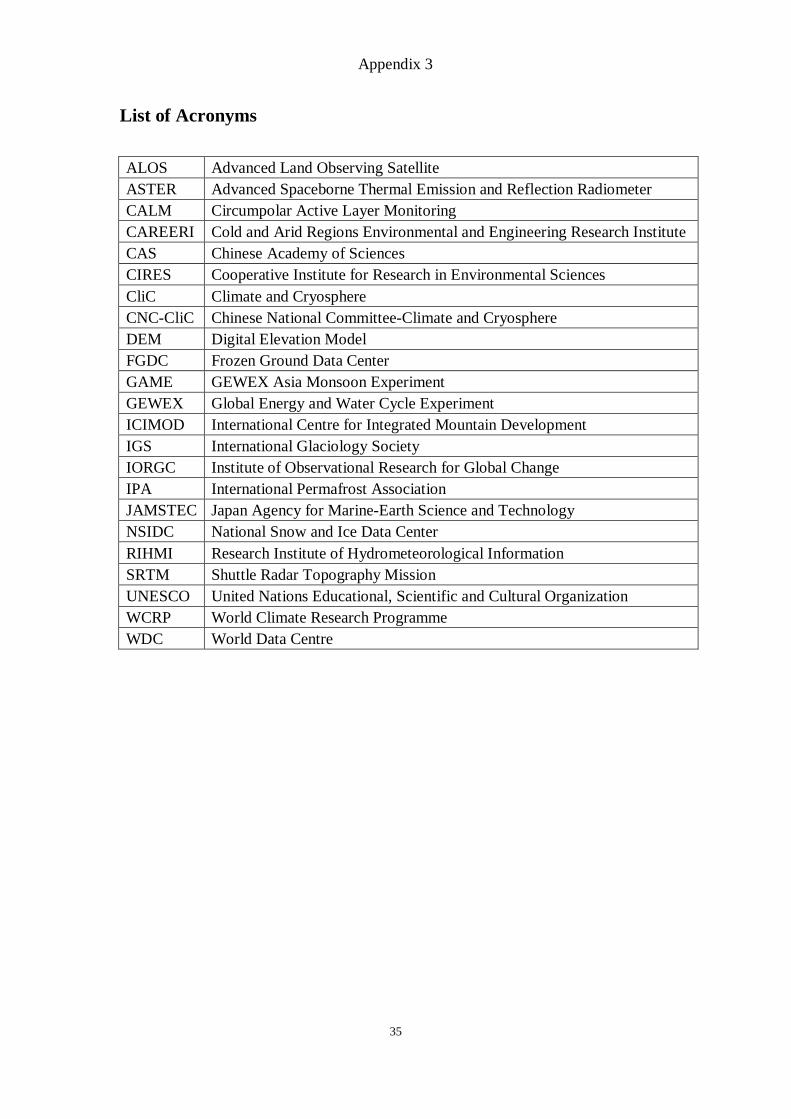
List of Acronyms
ALOS Advanced Land Observing Satellite ASTER Advanced Spaceborne Thermal Emission and Reflection Radiometer CALM Circumpolar Active Layer Monitoring CAREERI Cold and Arid Regions Environmental and Engineering Research Institute CAS Chinese Academy of Sciences CIRES Cooperative Institute for Research in Environmental Sciences CliC Climate and Cryosphere CNC-CliC Chinese National Committee-Climate and Cryosphere DEM Digital Elevation Model FGDC Frozen Ground Data Center GAME GEWEX Asia Monsoon Experiment GEWEX Global Energy and Water Cycle Experiment ICIMOD International Centre for Integrated Mountain Development IGS International Glaciology Society IORGC Institute of Observational Research for Global Change IPA International Permafrost Association JAMSTEC Japan Agency for Marine-Earth Science and Technology NSIDC National Snow and Ice Data Center RIHMI Research Institute of Hydrometeorological Information SRTM Shuttle Radar Topography Mission UNESCO United Nations Educational, Scientific and Cultural Organization WCRP World Climate Research Programme WDC World Data Centre