Embed Size (px)
Citation preview

Heather Auld, Neil Comer & Norm Shippee Risk Sciences International
CLIMATE 101: INTRODUCTION
to CLIMATE CHANGE DATA
and VOCABULARY
OCC’s Climate Data Training Session for Engineers, Planners and Decision-makers

Weather/Climate: Going to Extremes?
Extreme Weather in Canada Here to Stay: Experts
We
athe
r/Clim
ate H
ead
line
s
IBC commends federal government’s focus on infrastructure and flood mitigation in 2016 fall economic statement – Nov, 2016
Severe weather, natural disasters cause record year for
insurable damage in Canada – Jan, 2017
Environment Canada inspecting damage after storm in central Ontario – Oct, 2016

Weather vs Climate: Is it “news” or is it “history”?
Weather (what you get): • Conditions today and over the next few days; • “we operate infrastructure day-to-day on the
basis of weather”
Climate (what you typically expect): • Weather over time: Extremes, Trends, Changes; • “we plan and design for the longer term on the
basis of climate” (spans local to global scales)

Climate and Weather Linkages: Global
Oscillations
• Global Oscillations have a large influence on climate & weather – come in varying lengths/frequencies
• But largely unpredictable, especially when acting together! • Sometimes in phase, sometimes not

What happened with Winter and Spring, 2013-14: Polar Vortex?
• Cold here, BUT… • Globally: 4th warmest January & 8th warmest winter since 1880. • Polar Vortex “slumped” southward – link to ↓ Arctic ice?
• Climate variability
Credit: L.S. Gardiner/UCAR

Global Temperatures and GHG emissions linked

The Climate is changing…

and will continue to change…
current
2014 GHG value keeps us on RCP8.5 emission pathway
Currently on path of highest GHG emissions

Small changes in GHG emissions matter…
• Natural GHG effect – keeps Earth at an average temperature of 15°C (-18°C without)
• Delicate balance of GHGs to support life on Earth and our current climate system
• Anthropogenic GHGs changing the Earth’s balance rapidly

Irreversible
Unequivocal warming
95% certainty warming is due
to climate change
Stronger language than other reports – considering that scientists make ‘conservative’ statements
Inter-governmental Panel on Climate Change (IPCC) Reports
• 2012: IPCC Special Report on
Extremes (SREX)
• 2013-14: IPCC 5th Assessment Report – Science, Adaptation, Mitigation

Adaptation to Climate Change: Confused, Concerned and/or Ready for Action?
Confused, Skeptical
Concerned/Adapt to What?
Get set! Ready!!

Confused? Skeptical? …

More and improved climate models (for larger scale)
Climate Change Model Resolutions are Improving with each IPCC Assessment Run: Great Lakes Example

Debates over Climate Change? The Climate Change Science is Valid… and the Evidence
grows Stronger every year
According to Climate Scientists … human caused
According to the Atmosphere …
97-

Climate… with and without GHG emissions
Natural factors only
Anthropogenic factors
All factors

Length of Climate Record is important: Skeptics and Short-term Climate Variability vs Longer-term Signal
Using short record periods – Contrarian’s view Using longer record periods – Realist’s view
Hiatus?

Our Recent Reality – Global Warming Hiatus? Or Natural Variability?
• New research recent on 15 year ‘global warming hiatus’
• Generally accepted that
warming hasn’t gone away – instead, likely warming the oceans (possible PDO link)
• Recent reduced warming still
within range indicated by climate models
• Possible that “hiatus’ could
continue for 20 years, but likelihood low (<1%)
NOTE: Increased likelihood of accelerated warming after this latest phase
Concerned? Adaptation to WHAT? National and Regional Changes in Climate

Trends: Canada, compared to the World Harder to detect national and regional trends
Temperature trends 1948 - 2012
North warming ~ 4X Global

Precipitation Trends – More Challenging
Nationally averages annual precipitation trends

Our Past … 1951-1980 Average Annual Temperature
8
Our Present … 1981-2010 Average Annual Temperature
8
Our Near Future … 2020s Average Annual Temperature (AR5-RCP8.5)
8
Our Mid-Century Future … 2050s Average Annual Temperature (AR5-RCP8.5)
11
9
Mean Annual Temperature Trends: Ongoing Warming

Our Past … 1951-1980 Average Annual Precipitation
800
900
(mm)
Our Present … 1981-2010 Average Annual Precipitation
800 900
1000
Our Near Future … 2020s Average Annual Precipitation (AR5-RCP8.5)
900 1000
1100
Our Mid-Century Future … 2050s Average Annual Precipitation (AR5-RCP8.5)
900 1000
1100
Mean Annual Precipitation Trends: Becoming Wetter

1200 mm/yr
900 mm/yr 750 mm/yr
550 mm/yr
350 mm/yr
Ontario Historically – Precipitation increasing regionally
Data Source: NRCAN/EC

Snowbelt regions observing increased lake-effect snow (lee Great Lakes winter flows)

On average, Great Lakes are open longer (more winters) … snowsqualls
2014
2015
2016
2017: Warmest lake temperatures in 16 years

Shorter and warmer winters… Less snow?
Jan+Feb Toronto Pearson Airport Snowfall (cm)
2008 2013 1985
Outside of the “snowbelts”

“It is likely that frequency and intensity of snowstorm events will increase in northern U.S.”
Note trends in frequencies of Top 100 Snowstorms in the U.S. Ohio Valley (U.S. Climate Change Report, 2014)
Frequency TOP 100 snowstorms: Ohio Valley (U.S.) Northeast U.S.
to 2
01
3

Warmer air can hold more water.. Potential for more precipitation
• Amount of moisture in air grows rapidly with temperature increases (Clausius-Clapeyron relation) • Provided moisture source exists; • Increasingly used for future
projection of rainfall extremes. • Warming can lead to more intense
rainfalls and snow events; • Can also evaporate more water from
surfaces (i.e., faster drying).

Data challenges in Canada: Detecting changes in Rainfall Extremes
Declining long-term climate stations: e.g. Rate-of-rainfall

Extreme Rainfall BIG events in GTA from 2000-2014 with “Improved” Event Mapping
May 12, 2000
Aug 19, 2005
July 8, 2013
Aug 4, 2014
Aug 4, 2009

Community Impacts will be wide-reaching
Structures Ice & Snow
Loads
Extreme Rain
(Intensity,
Duration, Freq)
Extreme Winds,
Tornadoes
Electrical
structures
FAILURES
Towers FAILURES
Water
Structures
FAILURE, Power
outages
FAILURES Power outages;
failure-tornado
Roads, Bridges Driving hazard,
snowmelt RISK
FAILURES –
drainage &
erosion
Signs, bridge
failure risks
Buildings Snowload
FAILURES
Weathering;
flooding,
moisture
FAILURES
High Rise
Buildings
Neighbouring
buildings (+ ice
sheets)
Flooding low
levels, moisture
problems
FAILURE RISKS
Risk of failure Risks to infrastructure services

READY! GET SET! How to get good local climate
guidance, climate change models for decisions?

Decision-maker NEEDs are important…
Fundamentally impossible for the future
Limitations in input data
To be developed - uncertainties
Many sources, some fundamental, others manageable
But, the science also has its limitations
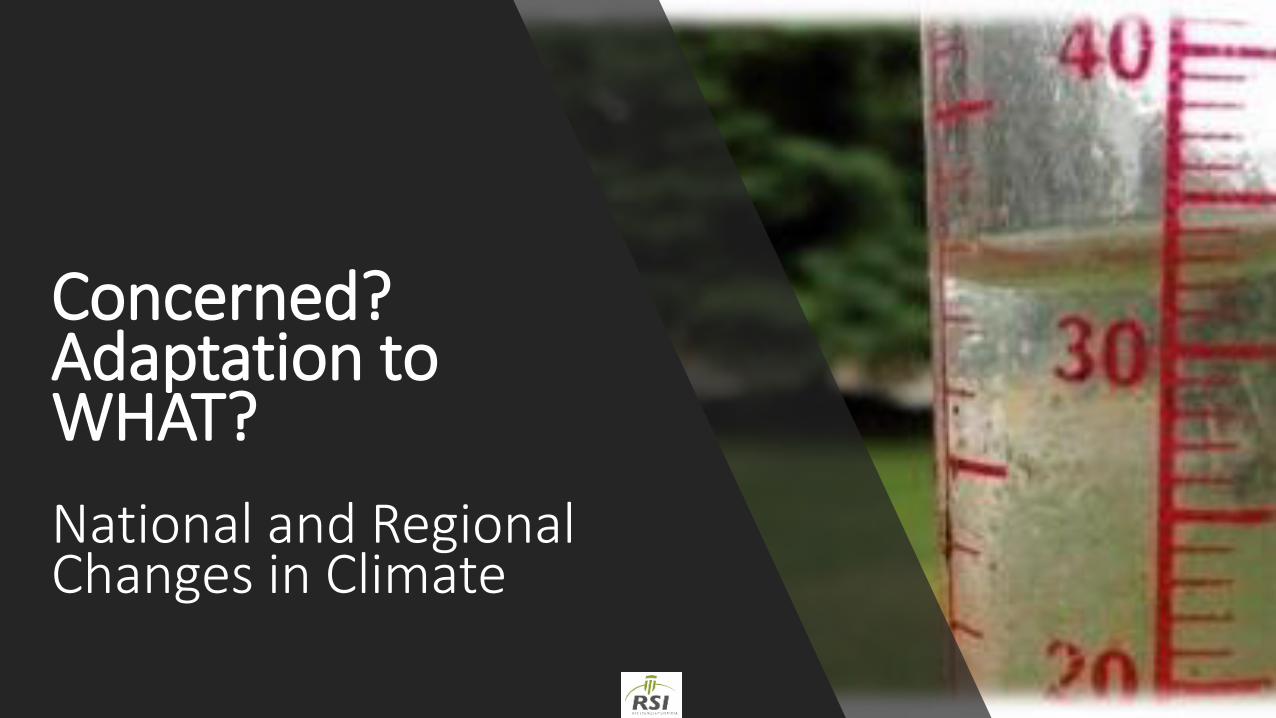
User NEEDS are important… The GAP between climate science and user needs is still huge
• Important to advocate for “decision relevant” info, policies & regulations – PIEVC assessments informed by good data, defensible science
• Partnerships are key – no one agency/party has enough resources to provide all data

NOTE: Climate models are designed to capture the larger scale climate processes and longer term climate trends - not the subdaily weather extremes
Model outputs are NOT the same as weather predictions
An analogy to the resolution and skill of a “good” regional climate model – merging of Santa pictures

Sources of Uncertainty in Global Climate Models: Mean Temperatures
Source: IPCC AR5 Figure 11.8
GHG Emissions: Human decisions
Climate model processes, data & uncertainty
Natural climate variability
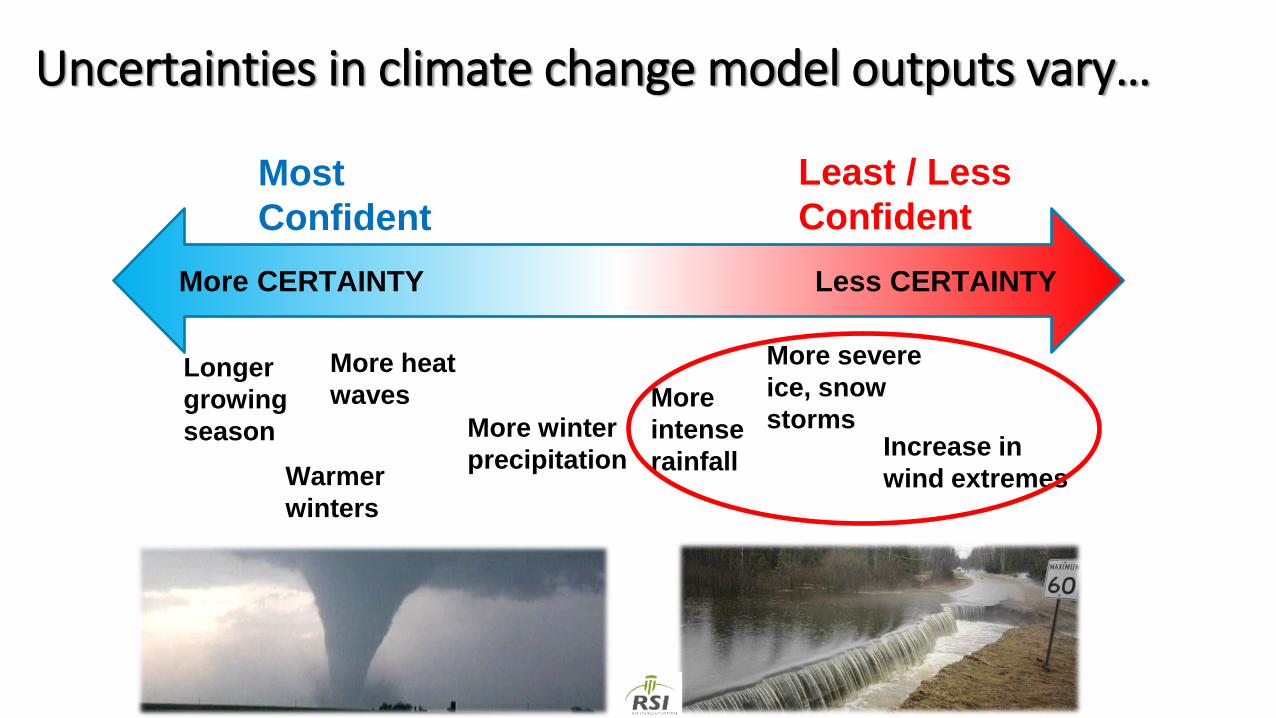
Uncertainties in climate change model outputs vary…
More CERTAINTY Less CERTAINTY
Most
Confident
Least / Less
Confident
More winter
precipitation Increase in
wind extremes
More severe
ice, snow
storms
More heat
waves More
intense
rainfall
Longer
growing
season
Warmer
winters

Varying Spatial and Temporal Scales of Weather and Climate: A Major Challenge

Challenge: Uncertainties in Projecting Future
Rainfall IDFs
• Southern Ontario study evaluation of different approaches for future IDFs;
• McMaster U, U Waterloo, Conservation Authorities, Toronto and Essex CAs;
• Large variations among approaches - Large inconsistencies, discrepancies
• Greatest uncertainties in short-duration, high-intensity events (15 minute to 1-hour events) and larger than the 25-year return periods;
• Difficult for stakeholders to interpret future IDFs and understand their uncertainty levels – Consider using best management practices for current climate

Cascading Climate Change Projection Uncertainties
• Uncertainties grow from: • larger to the finer scales; • longer to shorter time periods; • means to extremes.
• Some climate fields are more uncertain – extreme & finer scale rainfall (convective) among most uncertain
• IPCC advises use of ensemble (multiple) climate models - consider uncertainties

Climate Change Projections: Guidance and Cautions
• Consider different GHG assumptions (or take a higher GHG scenario, depending on project risk tolerance)
• Caution on the signal to noise ratios!
Generally right vs Precisely wrong??!!
Accurate – not precise
Precise – not accurate

Other Climate Change Projection Limitations
• Many parameters will not be available from climate models
• Alternate approaches (literature, professional judgement, climate analogues)
• All models have biases (even in replicating historical climate) – varying approaches to adjust
• Get the current or baseline climate as accurate as the data allows

Global climate models (GCMs)? Regional scale models (RCMs)?
• Depends on region– RCMs likely better for complex terrain, mountains, coasts (IPCC, 2013)… • Models likely underestimate thunderstorm rainfalls – need finest scale models, current data • “Good” baseline current climate is the foundation for projections

Filling the Gap: PLANNING Adaptation
Options

Types of approaches for Decision-making Top-Down
(Climate change models first)
Climate projections
Process models (e.g., local hydrology)
Consider potential impacts
Adaptation to projected changes
Bottom-up
(Stakeholders & Vulnerability/system first)
Current climate sensitivities, vulnerabilities
Coping range and thresholds of systems
Project climate changes (i.e., prob. exceeds thresholds)
Best adaptation, timing, Resilience
Adapted From IPCC SREX report (2012). Source (Ch 6): Lal, P.N., T. Mitchell, P. Aldunce, H. Auld, R. Mechler, A. Miyan, L.E. Romano, and S. Zakaria, 2012: National systems for managing the risks from climate extremes and disasters
START
CONSIDER & ADD
FUTURE IMPACTS
ADAPTATION OPTIONS

Adaptation Options: Consider asset lifespan, rate of CC, uncertainties, risks...

Adaptation Choices for Climate & Weather Resilience
Do nothing New approaches (e.g.
district cooling, LID)
Manage current extremes (e.g. disaster
planning; PIEVC risk assessment)
Current Climate
With Climate Change
Add Resilience; Safety factor; Return period; Stage; Flexible
Include future
climate (PIEVC);
codes/standards
Improve (Repair &
retrofit; maintenance)
Financial (insurance; Mun. reserves)
Monitor; Improve science
DESIGN (new structures?) OPERATIONS (existing/new)
Strengthen existing & new (e.g. safety factors;
return periods; retrofits)

Sources of Climate
Information
For specialized projections – undoubtedly requires experienced climate specialists
There is no standard or certification for the provision of climate chang information – user beware, ‘wild west’

Most Authoritative Source of CC info
Intergovernmental Panel on Climate Change (IPCC)
Worldwide (climate) scientific community reports every 6 years
Our best science uses complex atmospheric models
Climatological/meteorological expertise is also important and needed
Notably, changes we have seen are totally consistent with future projections
We’ve come a long way

Sources of Climate Information - Examples
• Ontario Climate Consortium (OCC) – wide range of guidance http://climateontario.org/wp/about/
• Environment and Climate Change Canada (ECCC) Historical data (IDF, normals, trends):
http://climate.weather.gc.ca
• ECCC Climate Model (Note: one GCM model)
http://ec.gc.ca/ccmac-cccma/default.asp?lang=En&n=4A642EDE-1
• ECCC Regional scale model (Note: one driving GCM model)
http://www.cccma.ec.gc.ca/data/canrcm/CanRCM4/index_cordex.shtml
• (Ontario) OMECC Climate Change Adaptation Tool Box:
http://tinyurl.com/ClimateOntario
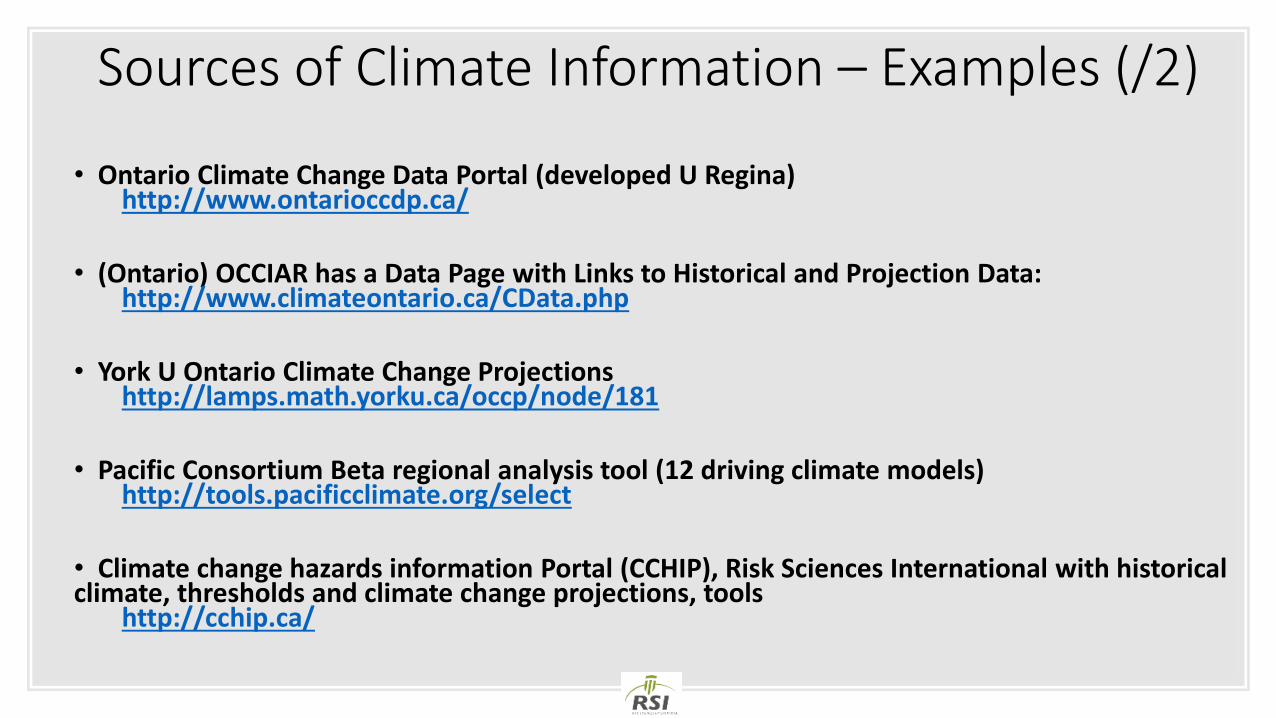
Sources of Climate Information – Examples (/2)
• Ontario Climate Change Data Portal (developed U Regina) http://www.ontarioccdp.ca/
• (Ontario) OCCIAR has a Data Page with Links to Historical and Projection Data:
http://www.climateontario.ca/CData.php
• York U Ontario Climate Change Projections
http://lamps.math.yorku.ca/occp/node/181
• Pacific Consortium Beta regional analysis tool (12 driving climate models)
http://tools.pacificclimate.org/select
• Climate change hazards information Portal (CCHIP), Risk Sciences International with historical climate, thresholds and climate change projections, tools
http://cchip.ca/

RSI Climate Change Hazards Information Portal
• Web-based turnkey product • Works for any location • Customized outputs – thresholds • All climate models (incl. AR5) • Continuously updated climate data • User support • Available in French

Thank You!
• For further information, contact: • Heather Auld or Neil Comer Risk Sciences International 905-737-6026 or 905-596-5992