Embed Size (px)
Citation preview
Climate Change Graphs
This document provides original climate change graphs and planning worksheets to use when creating an illustrated graph. Each title contains a link to the original graph, where you can access the data and a short description. Graphs contained in this document include: I. Global Carbon Emissions from Fossil Fuels, 1900-2011 II. Atmospheric CO 2 Levels: 2005-Present (direct measurement)
III. Atmospheric CO 2 Levels During Last Three Glacial Cycles (indirect measurement) IV. Global Land-Ocean Temperature Index V. Average September Extent of Arctic Sea Ice, since 1979 VI. Antarctic Ice Mass Variation, since 2002 VII. Greenland Ice Mass Variation, since 2002 VIII. Sea Level Rise: 1993-Present (satellite data) IX. Sea Level Rise: 1870-2000 (coastal tide gauge data) X. Global Surface Temperature (top, blue) Vs. Sun's Energy Received at the Top of Earth's Atmosphere (red, bottom), From 1978 to 2009
WWW.SCIENCEFRIDAY.COM By Educator Collaborator Ryan Becker
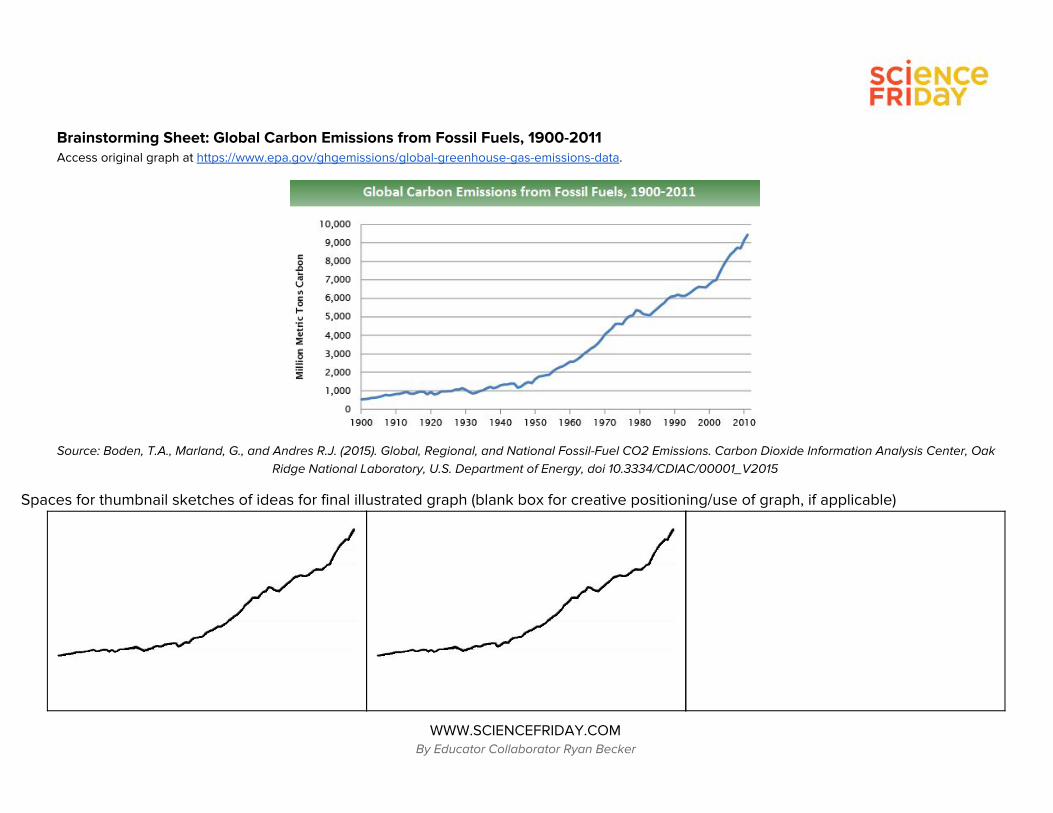
Brainstorming Sheet: Global Carbon Emissions from Fossil Fuels, 1900-2011 Access original graph at https://www.epa.gov/ghgemissions/global-greenhouse-gas-emissions-data.
Source: Boden, T.A., Marland, G., and Andres R.J. (2015). Global, Regional, and National Fossil-Fuel CO2 Emissions. Carbon Dioxide Information Analysis Center, Oak
Ridge National Laboratory, U.S. Department of Energy, doi 10.3334/CDIAC/00001_V2015
Spaces for thumbnail sketches of ideas for final illustrated graph (blank box for creative positioning/use of graph, if applicable)
WWW.SCIENCEFRIDAY.COM By Educator Collaborator Ryan Becker
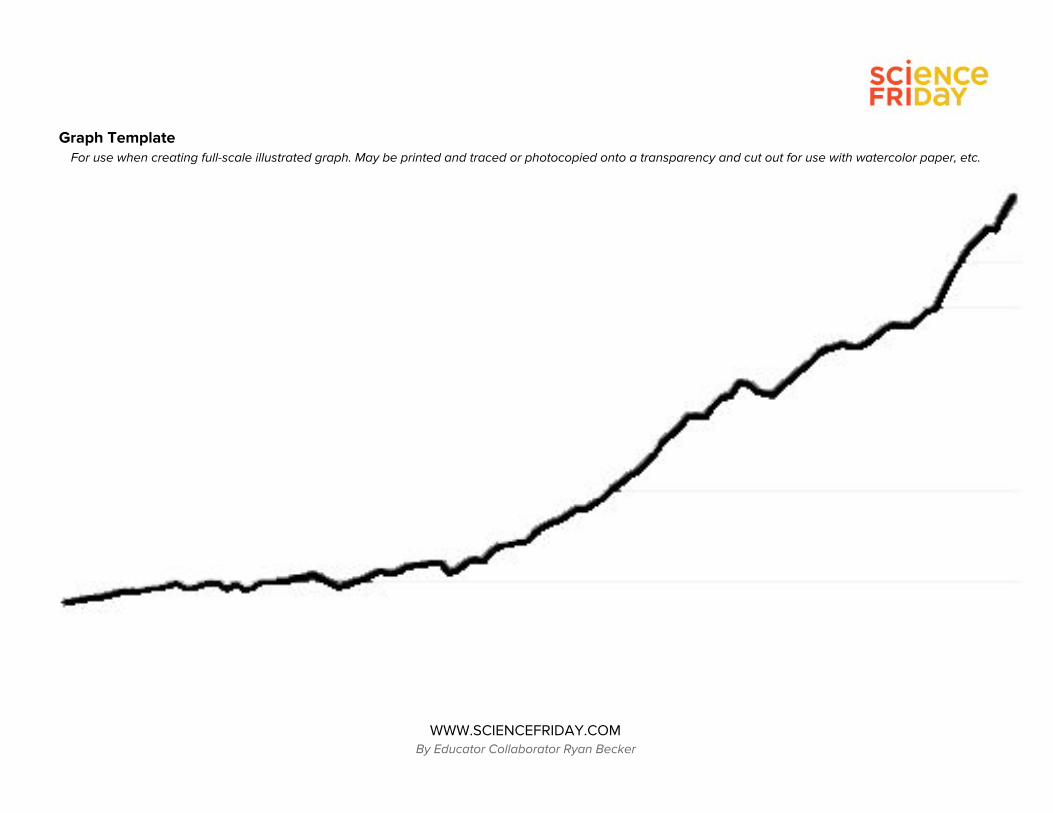
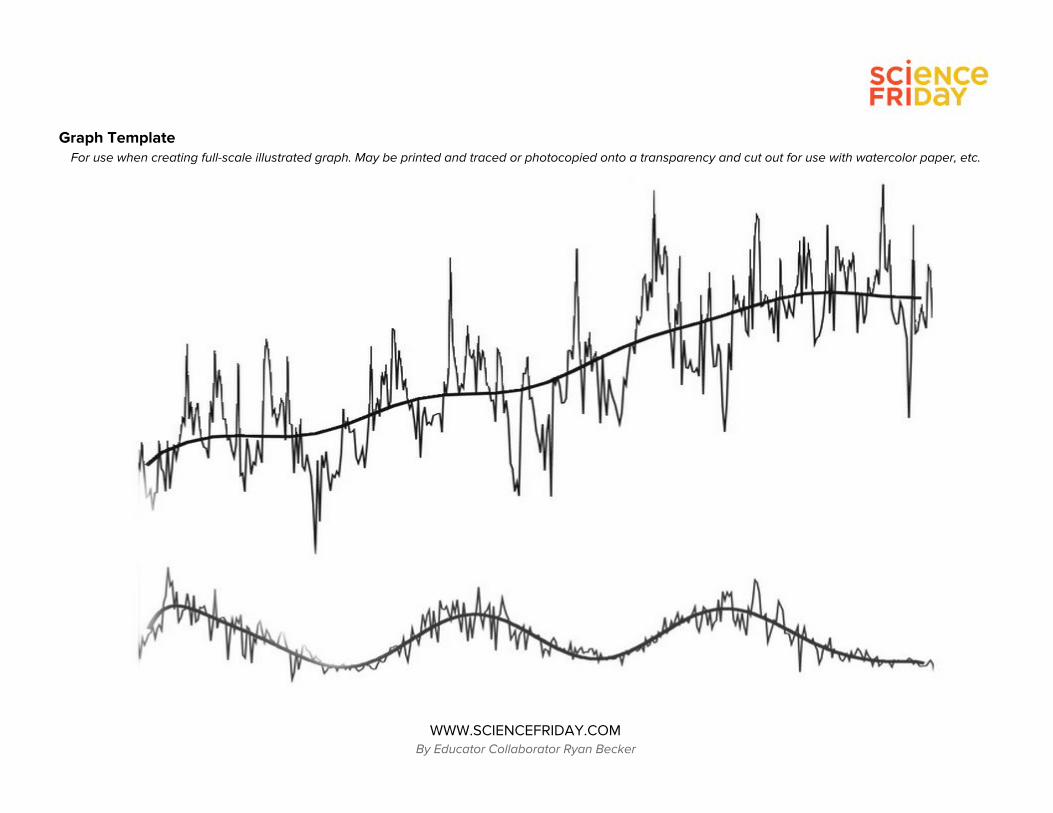
Graph Template For use when creating full-scale illustrated graph. May be printed and traced or photocopied onto a transparency and cut out for use with watercolor paper, etc.
WWW.SCIENCEFRIDAY.COM By Educator Collaborator Ryan Becker
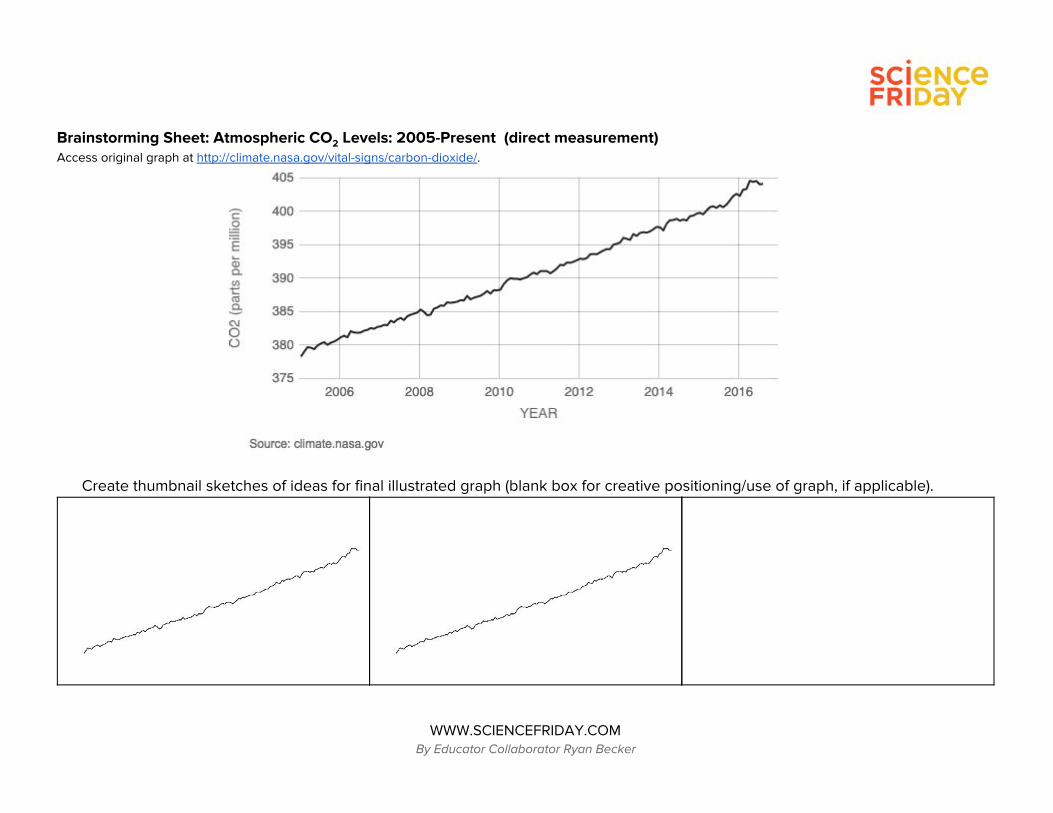
Brainstorming Sheet: Atmospheric CO 2 Levels: 2005-Present (direct measurement) Access original graph at http://climate.nasa.gov/vital-signs/carbon-dioxide/.
Create thumbnail sketches of ideas for final illustrated graph (blank box for creative positioning/use of graph, if applicable).
WWW.SCIENCEFRIDAY.COM By Educator Collaborator Ryan Becker
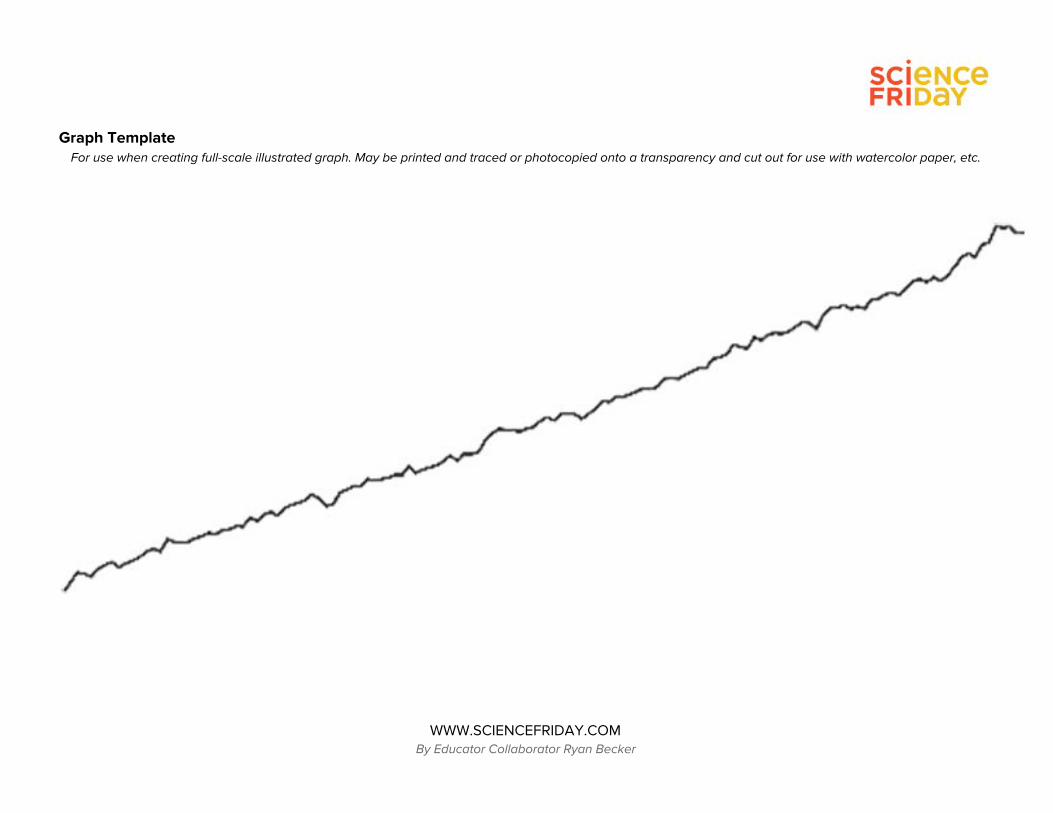
Graph Template For use when creating full-scale illustrated graph. May be printed and traced or photocopied onto a transparency and cut out for use with watercolor paper, etc.
WWW.SCIENCEFRIDAY.COM By Educator Collaborator Ryan Becker
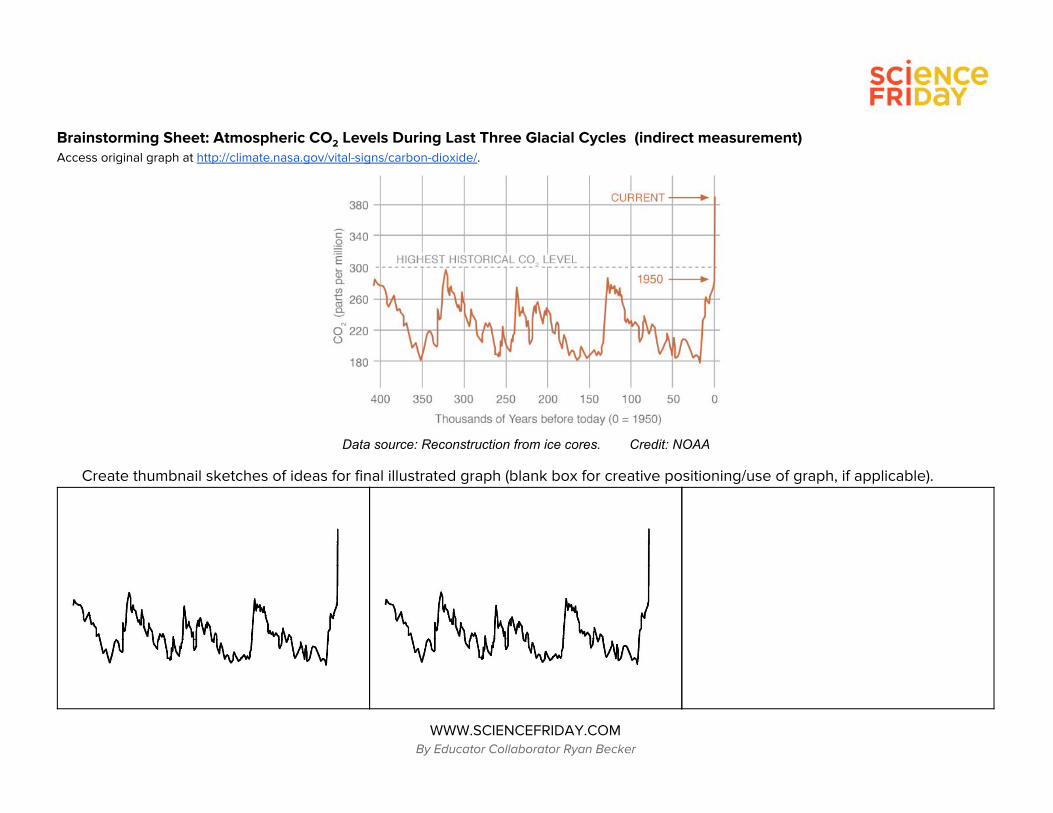
Brainstorming Sheet: Atmospheric CO 2 Levels During Last Three Glacial Cycles (indirect measurement) Access original graph at http://climate.nasa.gov/vital-signs/carbon-dioxide/.
Data source: Reconstruction from ice cores. Credit: NOAA
Create thumbnail sketches of ideas for final illustrated graph (blank box for creative positioning/use of graph, if applicable).
WWW.SCIENCEFRIDAY.COM By Educator Collaborator Ryan Becker
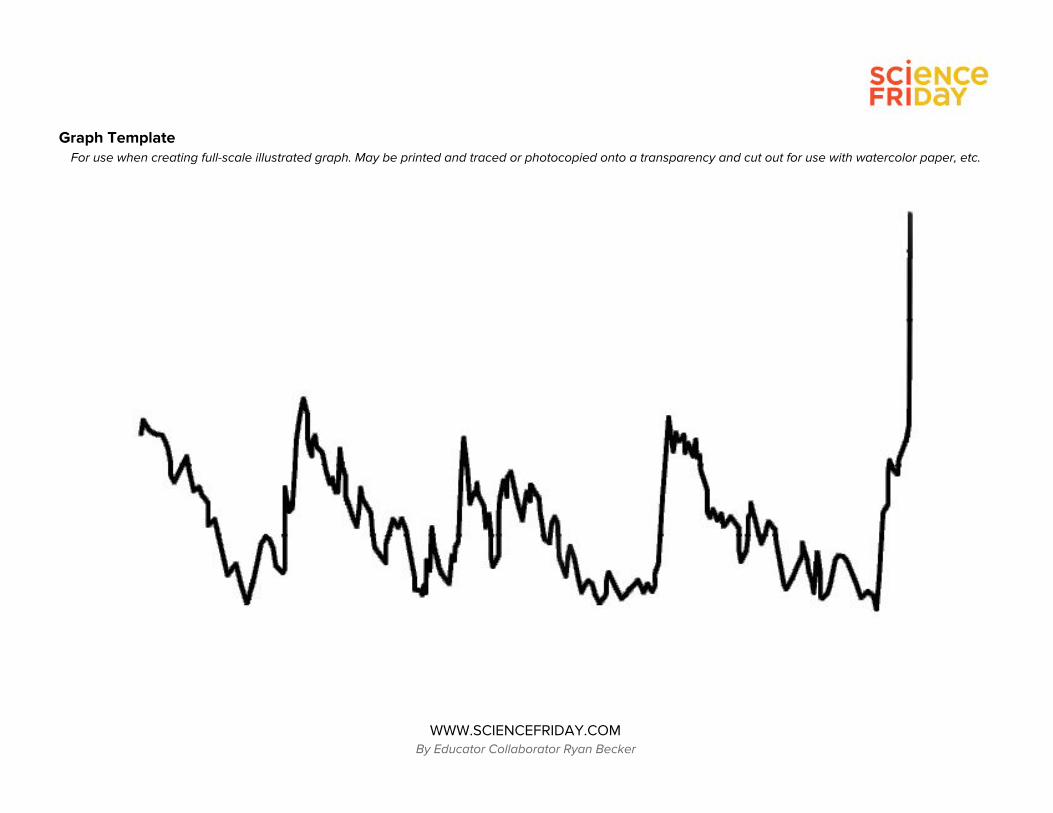
Graph Template For use when creating full-scale illustrated graph. May be printed and traced or photocopied onto a transparency and cut out for use with watercolor paper, etc.
WWW.SCIENCEFRIDAY.COM By Educator Collaborator Ryan Becker
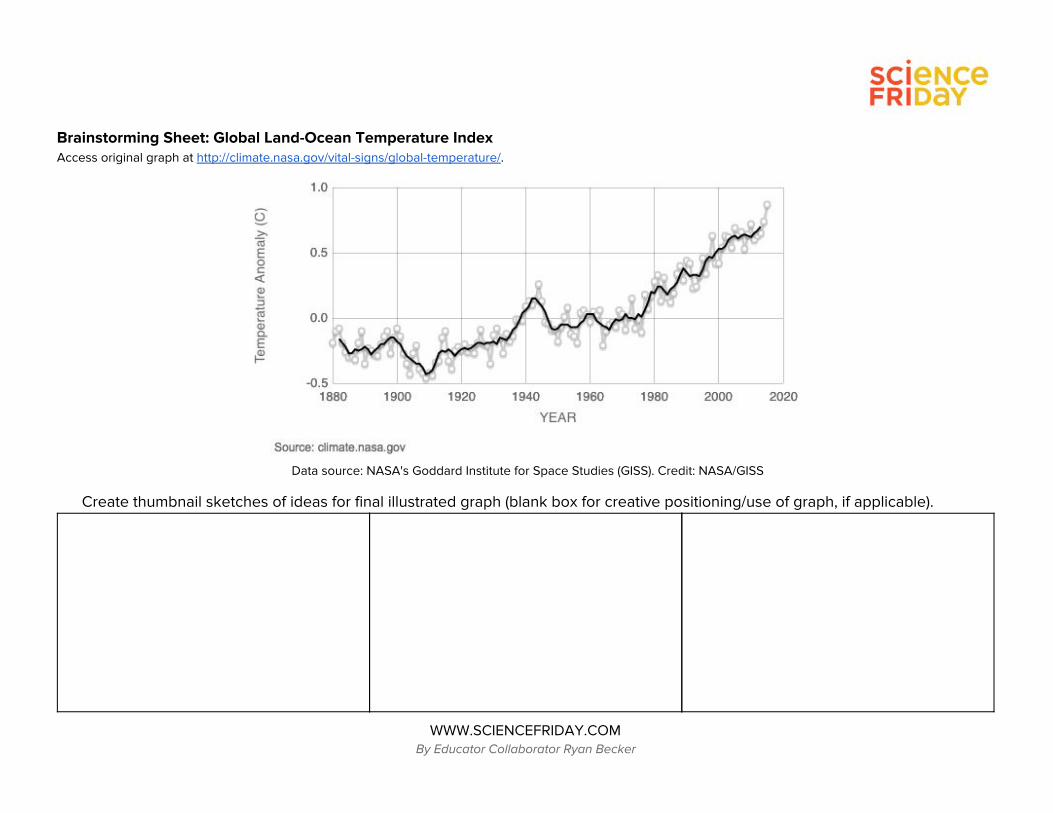
Brainstorming Sheet: Global Land-Ocean Temperature Index Access original graph at http://climate.nasa.gov/vital-signs/global-temperature/.
Data source: NASA's Goddard Institute for Space Studies (GISS). Credit: NASA/GISS
Create thumbnail sketches of ideas for final illustrated graph (blank box for creative positioning/use of graph, if applicable).
WWW.SCIENCEFRIDAY.COM By Educator Collaborator Ryan Becker
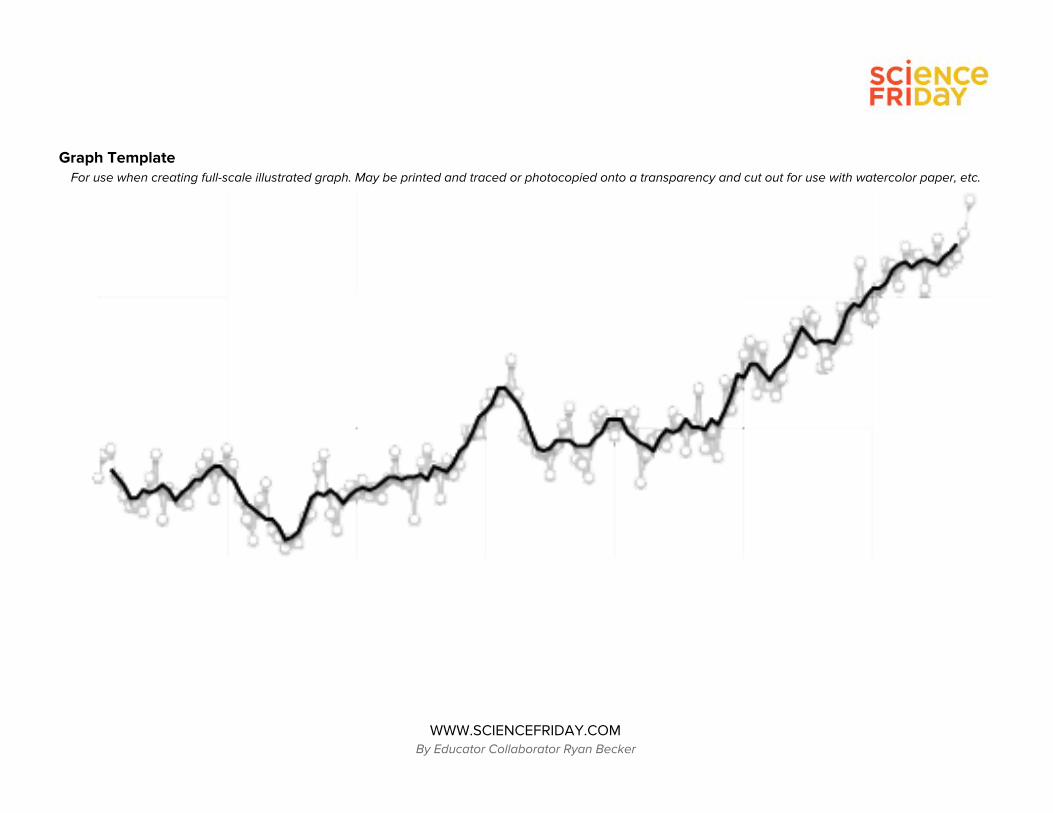
Graph Template
For use when creating full-scale illustrated graph. May be printed and traced or photocopied onto a transparency and cut out for use with watercolor paper, etc.
WWW.SCIENCEFRIDAY.COM By Educator Collaborator Ryan Becker
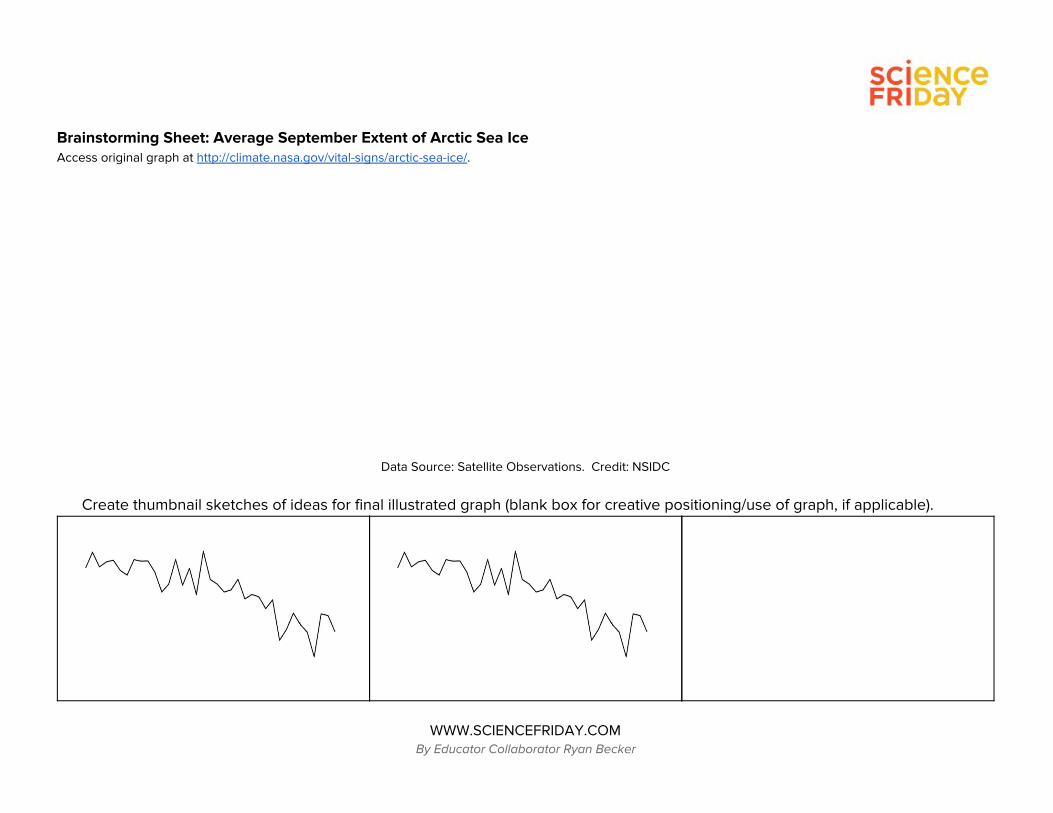
Brainstorming Sheet: Average September Extent of Arctic Sea Ice Access original graph at http://climate.nasa.gov/vital-signs/arctic-sea-ice/.
Data Source: Satellite Observations. Credit: NSIDC
Create thumbnail sketches of ideas for final illustrated graph (blank box for creative positioning/use of graph, if applicable).
WWW.SCIENCEFRIDAY.COM By Educator Collaborator Ryan Becker
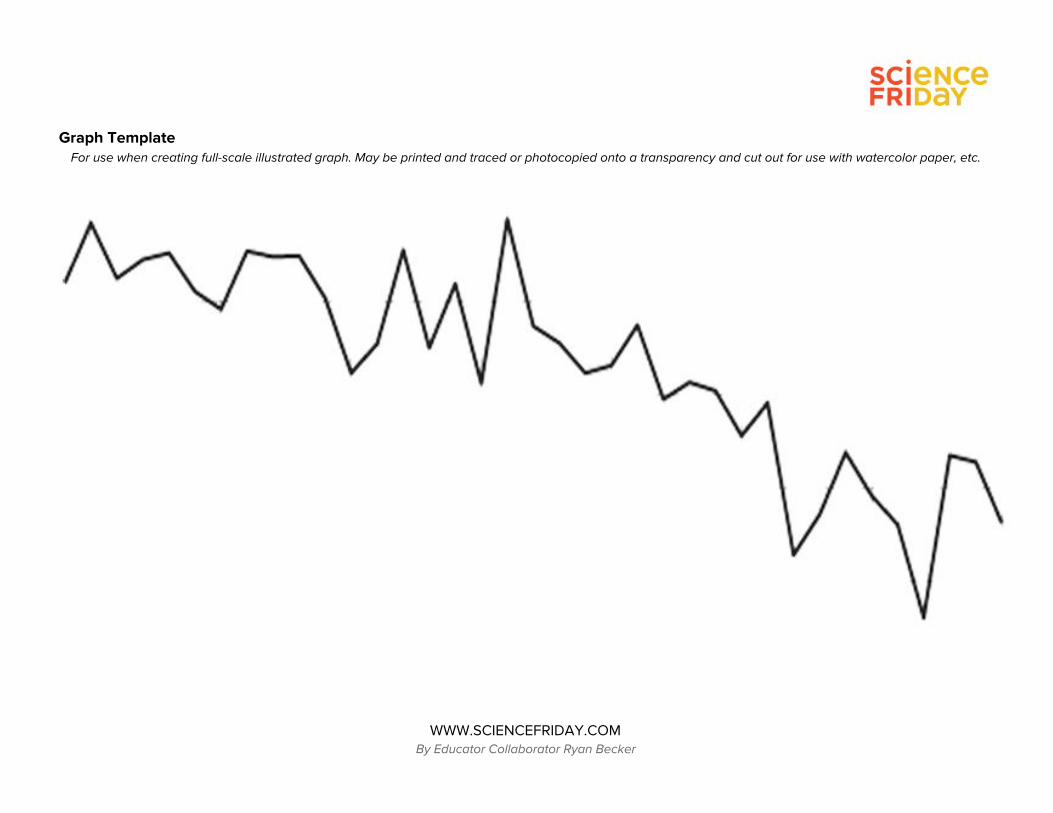
Graph Template For use when creating full-scale illustrated graph. May be printed and traced or photocopied onto a transparency and cut out for use with watercolor paper, etc.
WWW.SCIENCEFRIDAY.COM By Educator Collaborator Ryan Becker
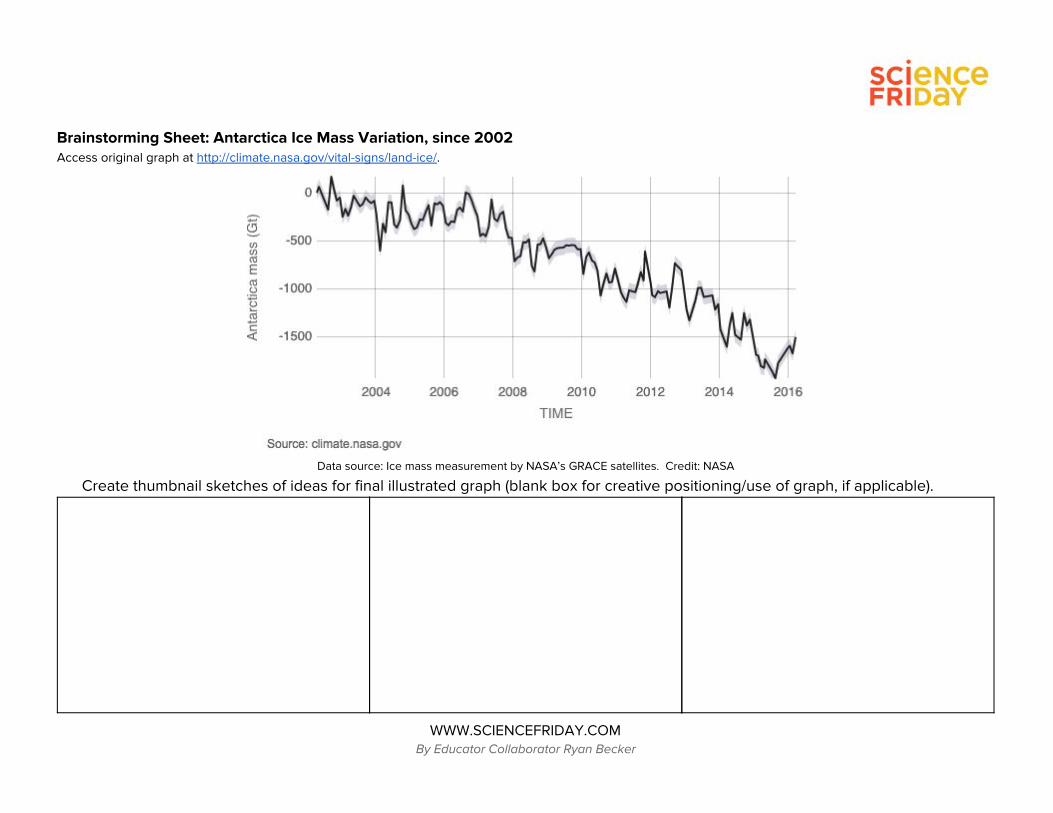
Brainstorming Sheet: Antarctica Ice Mass Variation, since 2002 Access original graph at http://climate.nasa.gov/vital-signs/land-ice/.
Data source: Ice mass measurement by NASA’s GRACE satellites. Credit: NASA
Create thumbnail sketches of ideas for final illustrated graph (blank box for creative positioning/use of graph, if applicable).
WWW.SCIENCEFRIDAY.COM By Educator Collaborator Ryan Becker
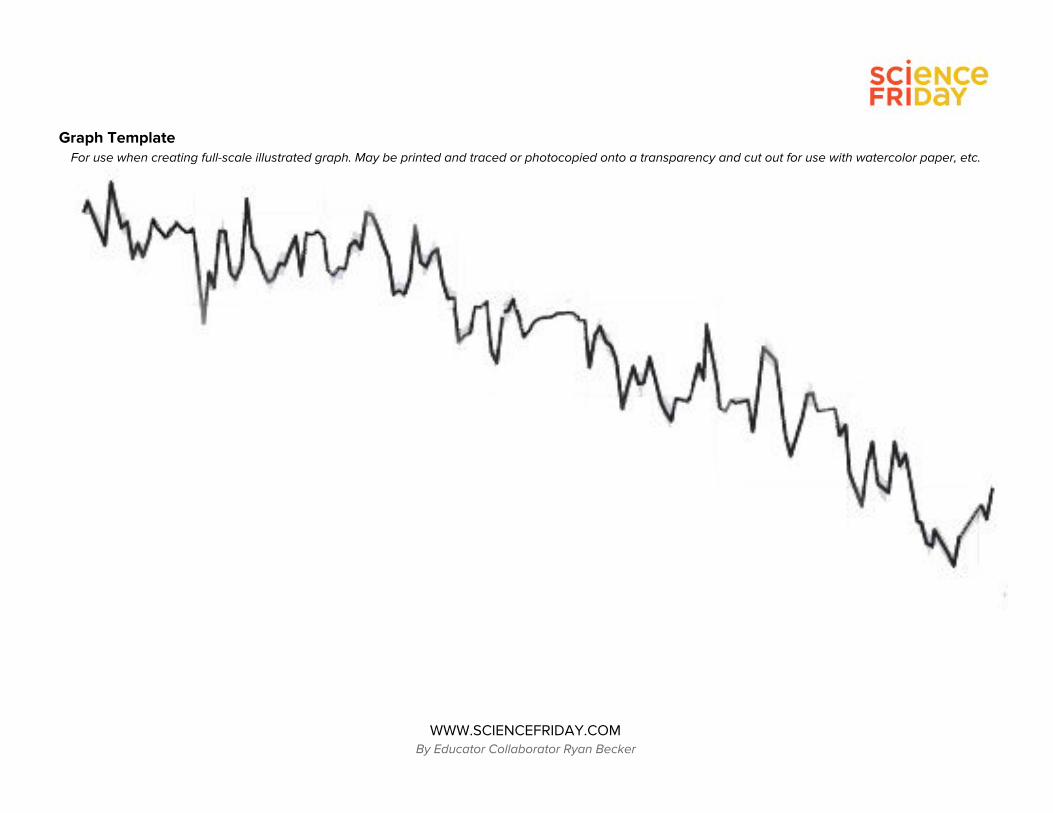
Graph Template For use when creating full-scale illustrated graph. May be printed and traced or photocopied onto a transparency and cut out for use with watercolor paper, etc.
WWW.SCIENCEFRIDAY.COM By Educator Collaborator Ryan Becker
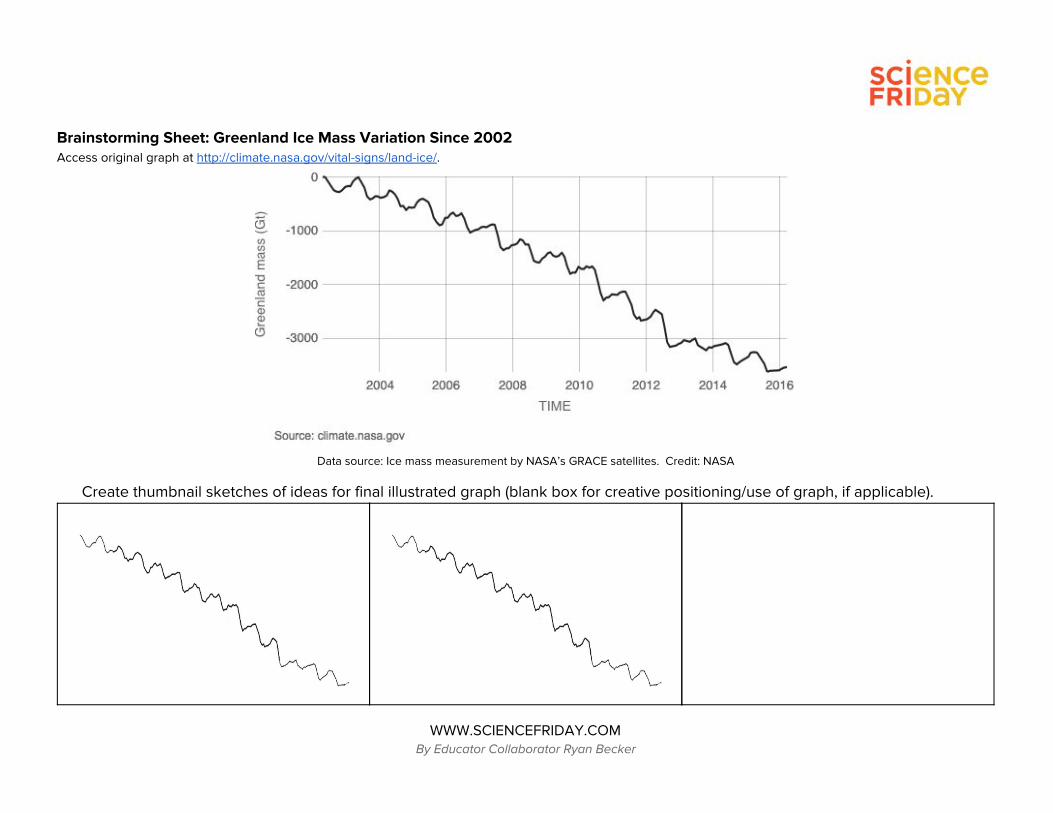
Brainstorming Sheet: Greenland Ice Mass Variation Since 2002 Access original graph at http://climate.nasa.gov/vital-signs/land-ice/.
Data source: Ice mass measurement by NASA’s GRACE satellites. Credit: NASA
Create thumbnail sketches of ideas for final illustrated graph (blank box for creative positioning/use of graph, if applicable).
WWW.SCIENCEFRIDAY.COM By Educator Collaborator Ryan Becker

Graph Template For use when creating full-scale illustrated graph. May be printed and traced or photocopied onto a transparency and cut out for use with watercolor paper, etc.
WWW.SCIENCEFRIDAY.COM By Educator Collaborator Ryan Becker
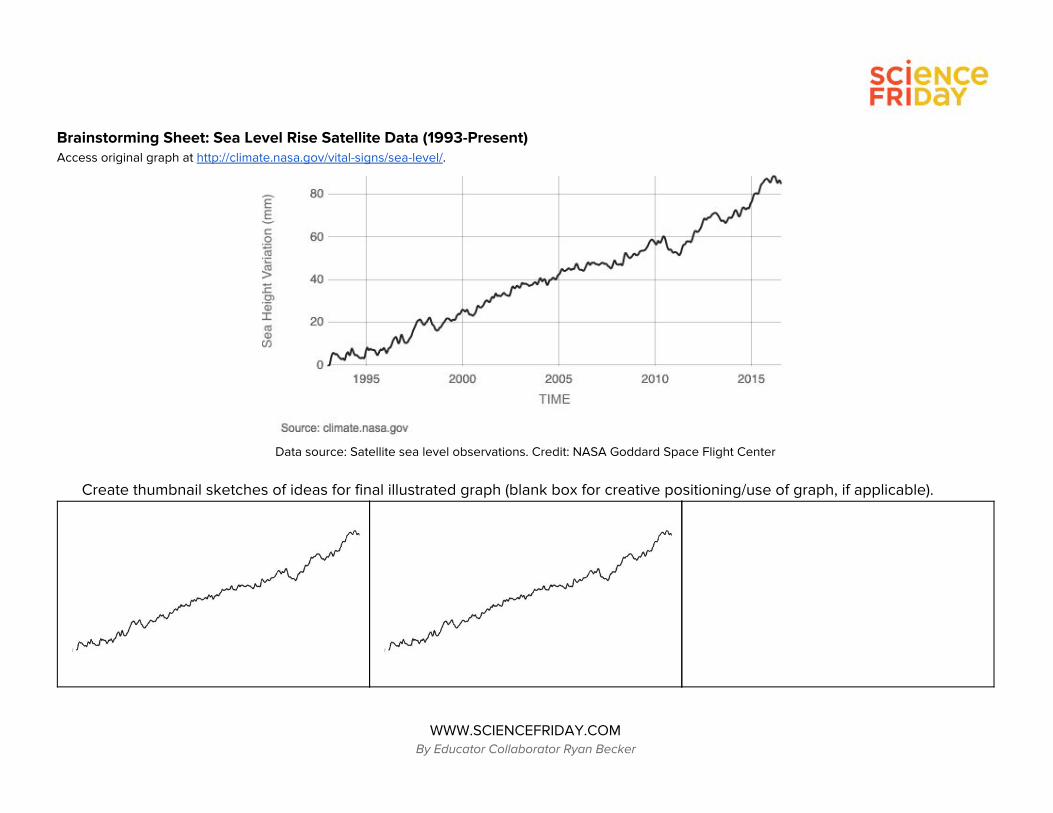
Brainstorming Sheet: Sea Level Rise Satellite Data (1993-Present) Access original graph at http://climate.nasa.gov/vital-signs/sea-level/ .
Data source: Satellite sea level observations. Credit: NASA Goddard Space Flight Center
Create thumbnail sketches of ideas for final illustrated graph (blank box for creative positioning/use of graph, if applicable).
WWW.SCIENCEFRIDAY.COM By Educator Collaborator Ryan Becker
Graph Template For use when creating full-scale illustrated graph. May be printed and traced or photocopied onto a transparency and cut out for use with watercolor paper, etc.
WWW.SCIENCEFRIDAY.COM By Educator Collaborator Ryan Becker
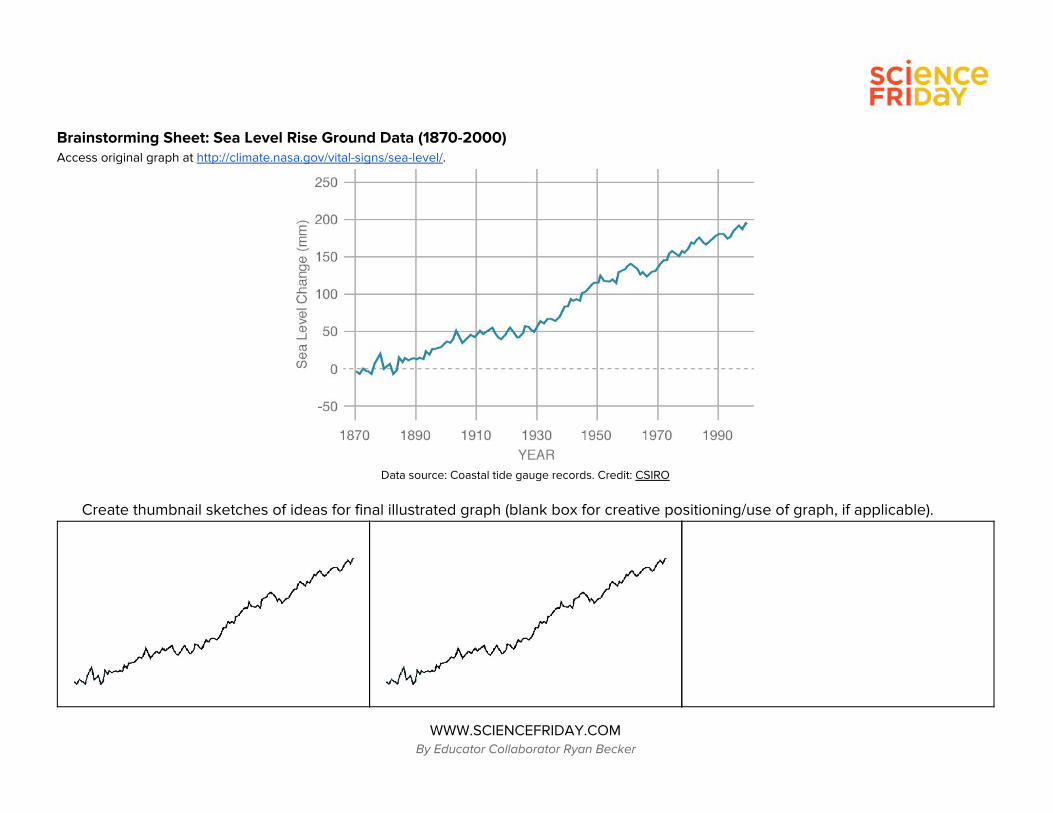
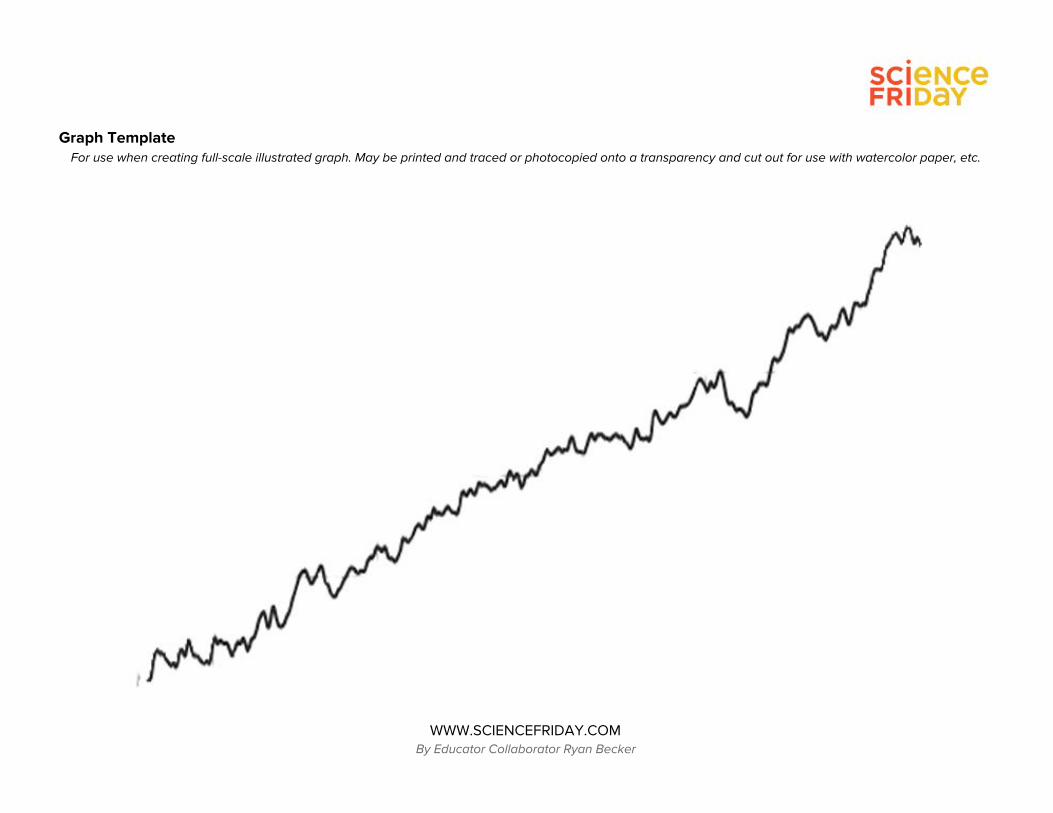
Brainstorming Sheet: Sea Level Rise Ground Data (1870-2000) Access original graph at http://climate.nasa.gov/vital-signs/sea-level/ .
Data source: Coastal tide gauge records. Credit: CSIRO
Create thumbnail sketches of ideas for final illustrated graph (blank box for creative positioning/use of graph, if applicable).
WWW.SCIENCEFRIDAY.COM By Educator Collaborator Ryan Becker
Graph Template For use when creating full-scale illustrated graph. May be printed and traced or photocopied onto a transparency and cut out for use with watercolor paper, etc.
WWW.SCIENCEFRIDAY.COM By Educator Collaborator Ryan Becker
Brainstorming Sheet: Global surface temperature vs. sun's energy received at the top of Earth's atmosphere, from 1978 to 2009 Access original graph at http://climate.nasa.gov/faq/, under the question “Is the sun causing global warming?”.
Spaces for thumbnail sketches of ideas for final illustrated graph (blank box for creative positioning/use of graph, if applicable). Use detailed, jagged curve(s) or simplify and just use best-fit curve(s)
WWW.SCIENCEFRIDAY.COM By Educator Collaborator Ryan Becker
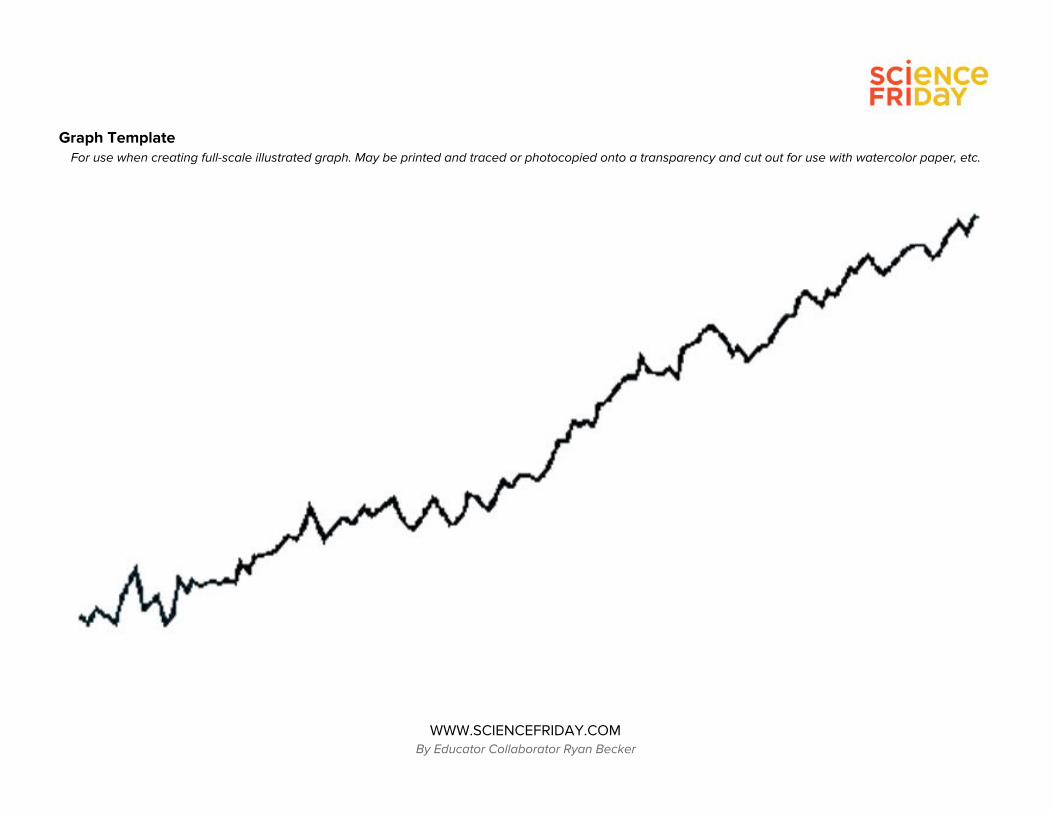
Graph Template For use when creating full-scale illustrated graph. May be printed and traced or photocopied onto a transparency and cut out for use with watercolor paper, etc.
WWW.SCIENCEFRIDAY.COM By Educator Collaborator Ryan Becker